Embed Size (px)
Citation preview

PT Pelabuhan Indonesia III (Persero)
INVESTOR UPDATE
First Half 2018 Performance

DISCLAIMER
2
This presentation has been prepared by PT Pelabuhan Indonesia (Persero) (“Pelindo III” or the “Issuer”). This presentation is being presented solely
for your information and is subject to change without notice. By accessing this presentation, you are agreeing to be bound by the restrictions set out
below. Any failure to comply with these restrictions may constitute a violation of applicable securities laws.
This presentation contains forward-looking statements that involve risks and uncertainties. All statements other than statements of historical facts are
forward-looking statements. These statements involve known and unknown risks, uncertainties and other factors that may cause the actual results,
performance or achievements of Pelindo III to be materially different from those expressed or implied by the forward-looking statements.
This presentation may not be reproduced, disseminated or quoted without the prior written consent of the Pelindo III. Relaying copies of this
presentation to other persons in your company or elsewhere is prohibited

TABLE OF CONTENT
3
PRIVATE & CONFIDENTIAL
COMPANY OVERVIEW I
INDUSTRY OVERVIEW II
KEY CREDIT HIGHLIGHTS III
FINANCIAL HIGHLIGHTS IV
4
12
15
25

COMPANY OVERVIEW
PRIVATE & CONFIDENTIAL
I
1,856 1,968 2,117 1,355 1,396
2,504 2,643 2,802
1,023 1,055
Domestic International
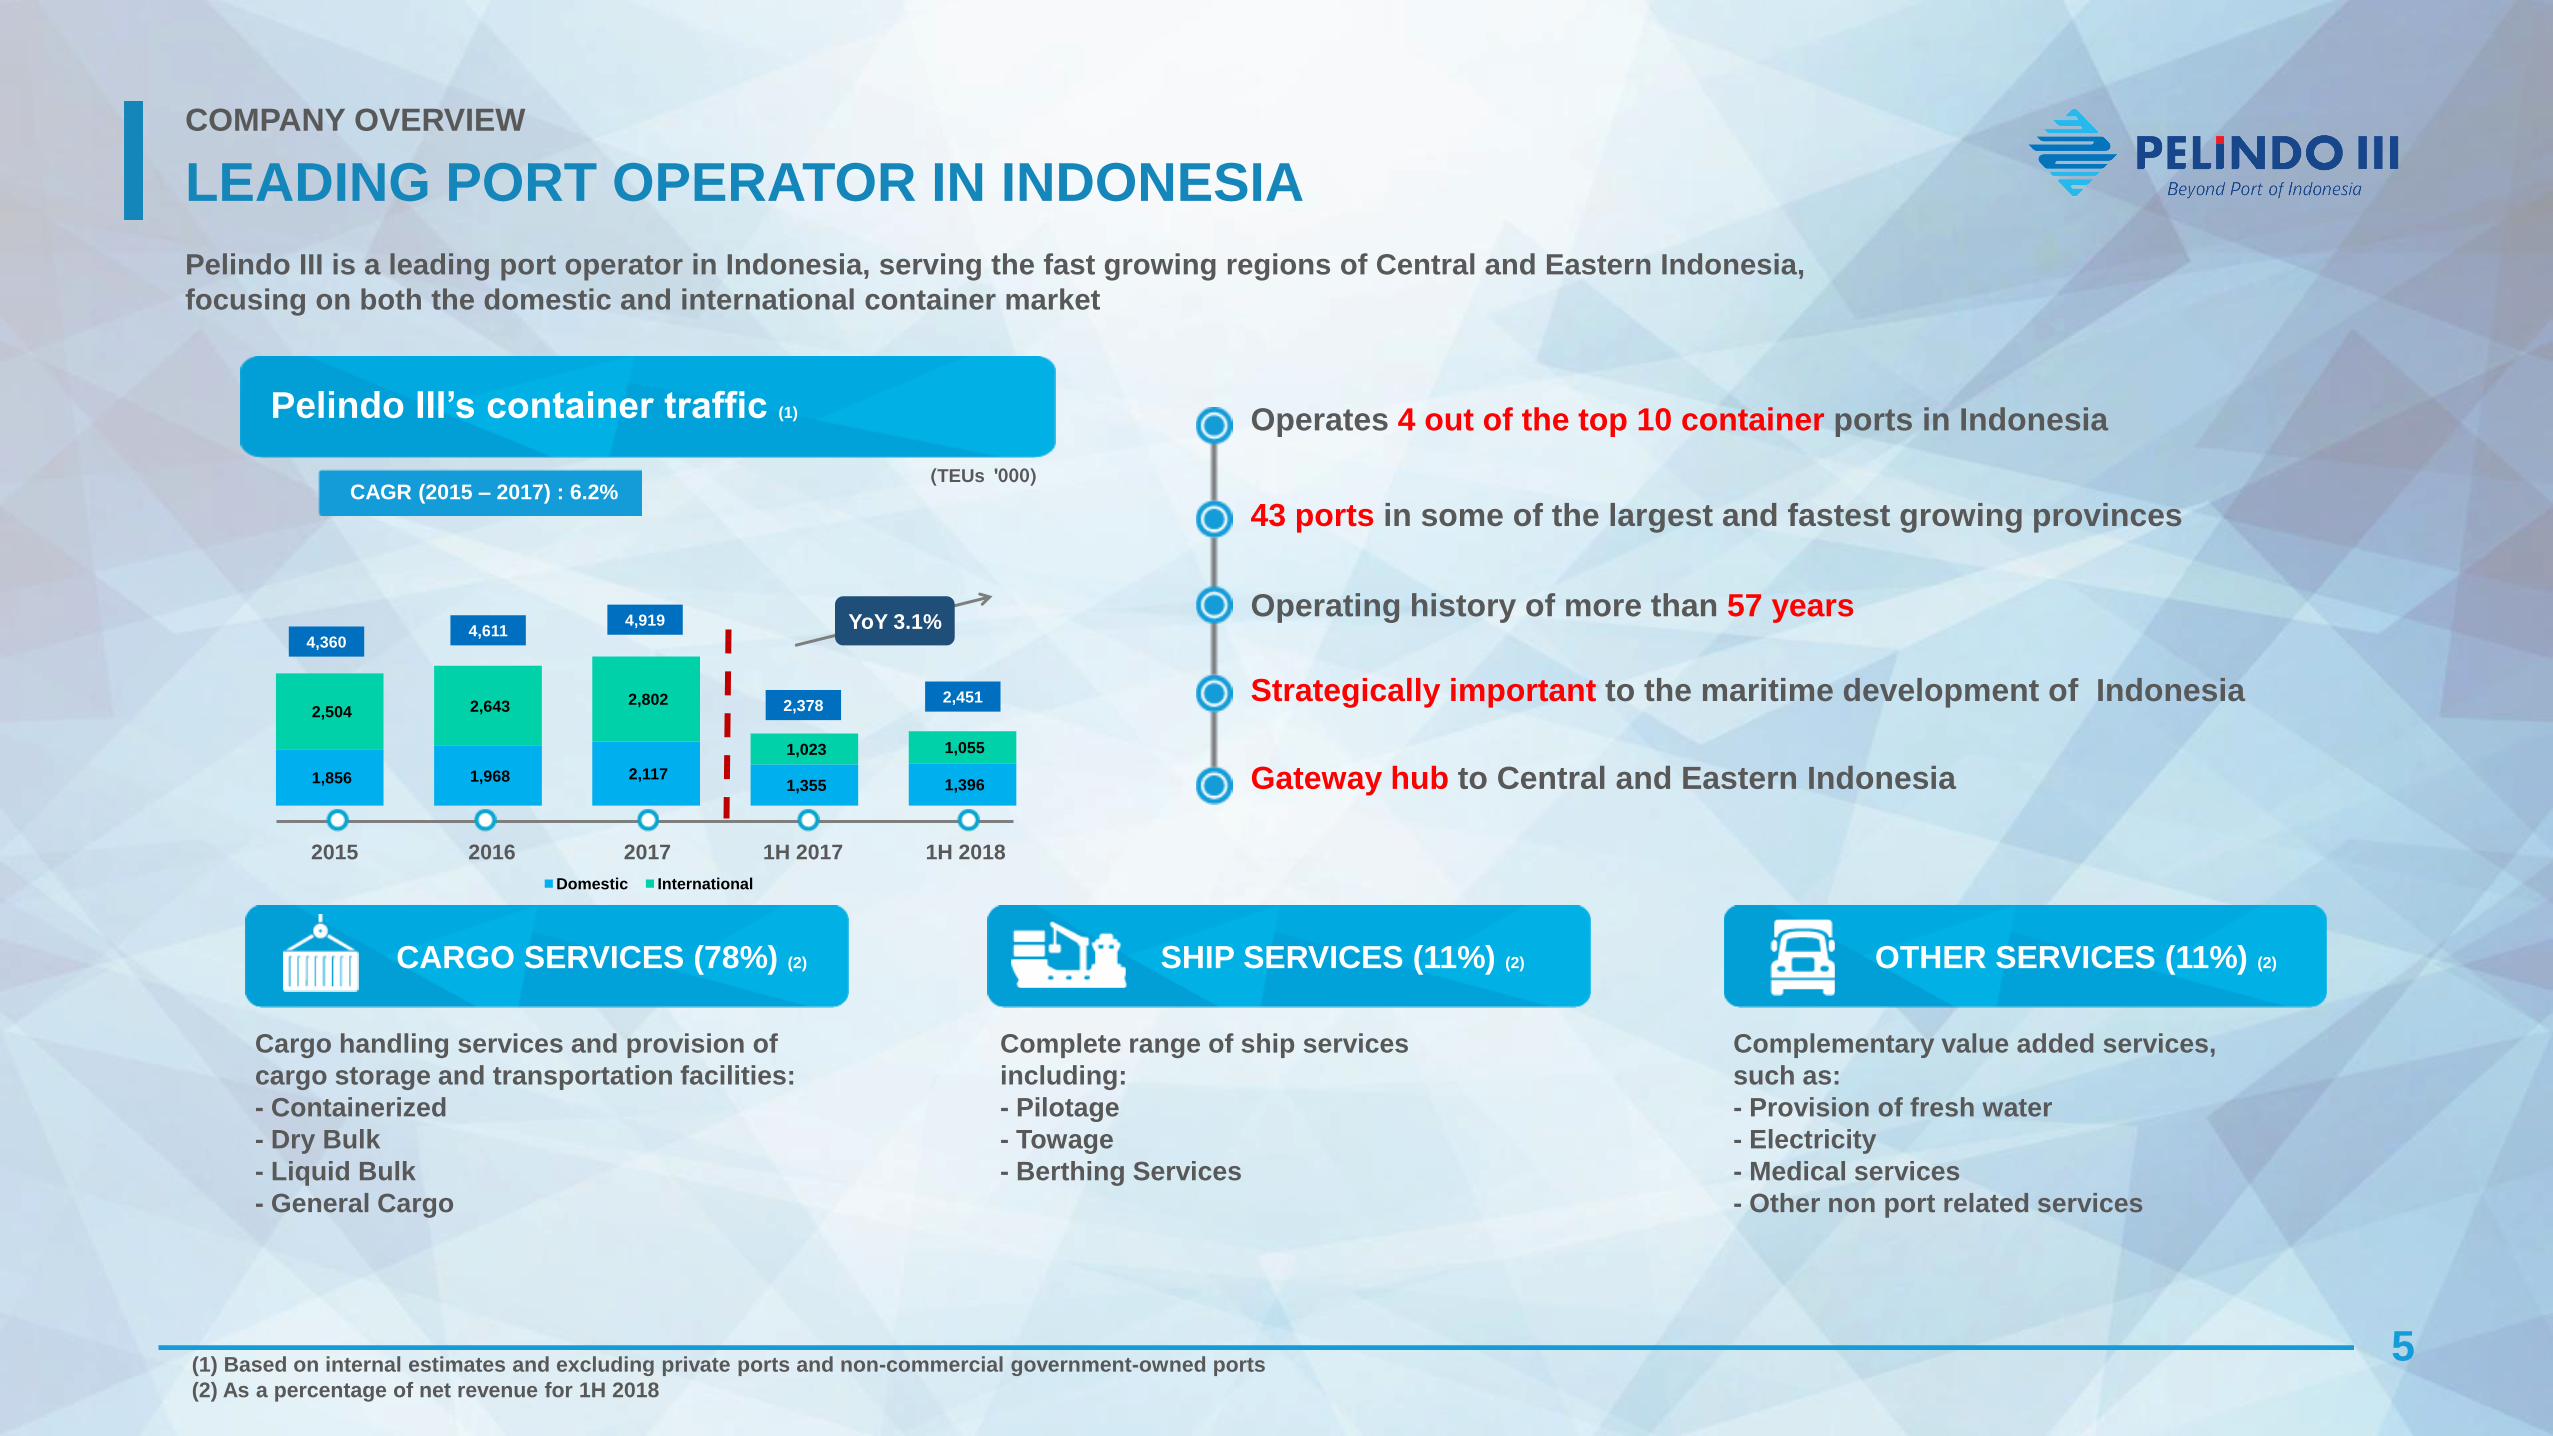
LEADING PORT OPERATOR IN INDONESIA
5
COMPANY OVERVIEW
Pelindo III is a leading port operator in Indonesia, serving the fast growing regions of Central and Eastern Indonesia,
focusing on both the domestic and international container market
(TEUs '000) CAGR (2015 – 2017) : 6.2%
Operates 4 out of the top 10 container ports in Indonesia
CARGO SERVICES (78%) (2) SHIP SERVICES (11%) (2) OTHER SERVICES (11%) (2)
Cargo handling services and provision of
cargo storage and transportation facilities:
- Containerized
- Dry Bulk
- Liquid Bulk
- General Cargo
43 ports in some of the largest and fastest growing provinces
Operating history of more than 57 years
Strategically important to the maritime development of Indonesia
Gateway hub to Central and Eastern Indonesia
Complete range of ship services
including:
- Pilotage
- Towage
- Berthing Services
Complementary value added services,
such as:
- Provision of fresh water
- Electricity
- Medical services
- Other non port related services
Pelindo III’s container traffic (1)
(1) Based on internal estimates and excluding private ports and non-commercial government-owned ports
(2) As a percentage of net revenue for 1H 2018
YoY 3.1% 4,360
4,611 4,919
2,378 2,451
2015 2016 2017 1H 2017 1H 2018

76%
11%
7%
2% 4%
Containers General Cargo Dry Bulk
Liquid Bulk Other Cargo Services
14%
40% 21%
25%
Pilotage Towage Berthing Other Ship Services
5,016 5,357 6,610
2,917 3,553
709 685
864
410 513
755 1,444
1,375
849 493
Cargo Services Ship Services Other Services
INTEGRATED SERVICE OFFERING
6
COMPANY OVERVIEW
CARGO SERVICES (78%) (1) SHIP SERVICES (11%) (1) OTHER SERVICES (11%) (1)
NET REVENUE GROWTH
(Rp Billions)
Rp3.5
Trillion
(1) As a percentage of net revenue for 1H 2018
1H 2018 REVENUE SPLIT PER BUSINESS LINE
6,480
7,486
8,849
4,176 4,559
Rp0.5
Trillion
755
1,444 1,375
849
493
12%
19%
16%
20%
11%
0%
5%
10%
15%
20%
25%
-
200
400
600
800
1,000
1,200
1,400
1,600
Other Services (%) of net revenue
1H 2018 REVENUE SPLIT PER BUSINESS LINE YoY REVENUE TREND
2015 1H 2018 1H 2017 2017 2016
2015 2016 2017 1H 2017 1H 2018

GROUP AND SHAREHOLDING STRUCTURE
7
COMPANY OVERVIEW
6
4
13
DIRECT SUBSIDIARIES
AFFILIATES
INDIRECT SUBSIDIARIES
Pelindo III is 100% owned by the Republic of Indonesia

GATEWAY DOMESTIC AND INTERNATIONAL PORT
COMPANY OVERVIEW
Pelindo III’s main branch in Tanjung Perak serves as the gateway port for Surabaya (Indonesia’s second largest city), as the domestic hub
for Central and Eastern Indonesia, and one of the key hub identified in the Sea Toll Program
Port Net Revenue (Rp Billions)
Small Port S
8
3,5
90
87
9
39
3
1,6
17
3,8
80
90
5
39
4
2,3
06
4,6
47
1,1
26
42
6
2,6
52
2,5
33
52
4
19
2 9
27
2,6
66
55
4
20
7
1,1
32
TANJUNG PERAK TANJUNG EMAS BANJARMASIN OTHER PORTS
2015 2016 2017 1H 2017 1H 2018
Tanjung Emas (TEUs) Other Ports (TEUs) Banjarmasin (TEUs) Tanjung Perak (TEUs) (A) (B) (C)
5,497 5,633 6,761
5,763 6,761
3,121 3,327 3,533
1,714 1,778
56.8%
59.1% 52.3%
29.7%
26.3%
0.0%
10.0%
20.0%
30.0%
40.0%
50.0%
60.0%
70.0%
-
2,000
4,000
6,000
8,000
10,000
12,000
Capacity Throughput Utilization
1,191 1,487 1,577
1,577 1,577
608
615 634
314 310
51.1%
41.4% 40.2%
19.9% 19.7%
0.0%
10.0%
20.0%
30.0%
40.0%
50.0%
60.0%
-
500
1,000
1,500
2,000
2,500
Capacity Throughput Utilization
619 619 825
1,100
825
388 408
422 203
212
62.8% 65.9%
51.1%
18.5%
25.7%
0.0%
10.0%
20.0%
30.0%
40.0%
50.0%
60.0%
70.0%
-
200
400
600
800
1,000
1,200
1,400
Capacity Throughput Utilization
984 1,058 1,158 1,058 1,158
243 261
310
147 151
24.7% 24.7%
26.8%
13.9% 13.0%
0.0%
5.0%
10.0%
15.0%
20.0%
25.0%
30.0%
-
200
400
600
800
1,000
1,200
1,400
1,600
Capacity Throughput Utilization
2015 2016 2017 1H 2017 1H 2018 2015 2016 2017 1H 2017 1H 2018 2015 2016 2017 1H 2017 1H 2018 2015 2016 2017 1H 2017 1H 2018

EVOLUTION OF PELINDO III TO A FULLY-FLEDGED
COMMERCIAL PORT AGENCY
COMPANY OVERVIEW
1992
Formally incorporated as
a limited liability company
pursuant to Deed No. 5
dated December 1, 1992
1999 Pelindo III entered into a
JV with DP World Asia
Holdings Limited
(“DPW”) under 20 year
concession ending 2019
2010 We pioneered the window
system at Nilam Terminal at
Tanjung Perak and TPKB at
Banjarmasin
2011
2012
We entered into two joint
ventures with PT Usaha Era
Pratama Nusantara (“UEPN”),
a subsidiary of PT AKR
Corporindo (“AKR”) to
develop and operate Java
Integrated Industrial Port and
Estate (“JIIPE”)
2013 ESTABLISHED
2014
Awarded 25 years
concession for Surabaya
West Access Channel and
established APBS
2015
Sea Toll Program
Implementation
commenced
operations of the
international
container terminal
at Teluk Lamong
2016 commenced
operations of the
domestic dry and
liquid bulk terminal
at JIIPE Port
2017
Achieved capacity of
more than 10 million
TEUs and close to 5
million TEUs throughput
2018 - 2022
Key future developments
• Phase III of Teluk Lamong
Terminal
• JIIPE Project
• Kendal Port
• Tanjung Bulupandan
• New Gili Mas Terminal at
port in Lembar
• Expansion of Benoa port
in Bali
9
Pelindo III commenced the
development of Teluk
Lamong Terminal in order to
reduce overcrowding at
Tanjung Perak and to
provide additional capacity

KEY BUSINESS STRATEGIES
10
COMPANY OVERVIEW
People
Processes
Technology
Cultivate a productive culture in the
organization
Business Processes Enables People & Processes, and
supports daily operations
Participative leadership culture
Maintain optimal number of
employees with appropriate skill
sets
Compatible values
Improve competencies and
understanding of the Company
through rotation of roles
Standardize services in all ports to
increase efficiency
Port Community System
Automation of services
ICT Based System
Finance platform for payment
transfers
Corporate Culture Transformation

• Reconfiguring our terminals to cluster our cargo handling
services at our major ports and at our other ports where
feasible
• Each terminal will have designated areas that are dedicated to
handling specific types of cargo, thereby improving
productivity and reducing the waiting time for customers
• Example of clustering services plan:
• Tanjung Perak Port: Nilam Termina to focus on
container and bulk commodities services and
Kalimas Terminal to focus on providing traditional
shipping services, logistics and docking of small
boats
• Tanjung Emas Port: West Kalibaru Terminal to focus
on dry and liquid bulk terminal services and Tambak
Lorok to focus on traditional shipping services
11
KEY STRATEGIES
COMPANY OVERVIEW
Clustering of Services
To Achieve Greater Operational
and Cost Efficiency
• Modernizing our port equipment and infrastructure throughout
our port facilities to increase the capacity of our ports and
improve the services provided to our customers
• Modernizing our IT infrastructure, together with state of the art
cargo handling equipment, will eliminate equipment down
time, increase berth utilization and continuously maximize
efficiency and throughput at our ports
• Modern equipment will provide greater automation of services
and minimize costs
Modernization of Facilities at
Existing Ports
• Expanding our operations by increasing capacity at our
existing facilities and developing new ports in strategic
locations
• For example:
• The development of our Teluk Lamong Terminal in
2011 order to reduce overcrowding at Tanjung Perak
• The development of JIIPE port, an in integrated port
and industrial estate, featuring multipurpose cargo
handling capabilities
Prudent Development and
Expansion of New and Existing
Ports and Related Infrastructure
• Expanding service offerings into other lines of business to
optimize the utilization of resources and diversify revenue base
• Recently established subsidiaries to operate and grow new
non-core lines of business
• Net revenue from our non-core lines of business is expected to
contribute more than 20.0% of total net revenue by 2019
Diversify Into Complementary
Business Lines
• Focus on developing human resources and corporate culture
as a recognition of the need to uphold a corporate culture that
is aligned with business, industry and strategy
• in recent years, employee benefits are reviewed and changes
are implemented which we is believed contributed to a
reduction in employee turnover rate
Develop Our Human Resources
and Corporate Culture
• Focusing on utilizing information technology as a key aspect in
creating value for customers, partners and stakeholders
• in the process of implementing an information and
communication technology (“ICT”) based system to monitor,
coordinate and execute our business activities
• Plan to establish a fully integrated terminal and logistics
handling system by 2019
Implement Technological
Improvements

INDUSTRY OVERVIEW
PRIVATE & CONFIDENTIAL
II

MARKET OVERVIEW
13
INDUSTRY OVERVIEW
GLOBAL PORT GROWTH 2006 - 2017
54%
17%
9%
9%
6%
3% 2%
Asia
Europe
Middle East-Indian Sub-Continent North America
Latin America
Africa
Oceania
743
Million
TEUs
Asia growing at 5.8%, outpacing global
growth of 4.9% between 2006 to 2017
Asia accounting for 54% of global
container throughput for 2017
Impact of potentially untapped markets and
a rising middle class in Asia
Growth rate of container rate throughput has risen 4.9% globally since 2006-2017, with most contribution from Asia (60%) as an impact of
potentially untapped markets and a rising middle class
4.9%
5.8%
6.6%
3.1%
2.3%
4.0%
6.2%
4.3%
World Asia Middle East - Sub
Continent
Europe North America
Latin America
Africa Oceania
REGIONAL CONTAINER THROUGHPUT MARKET
SHARE (2017)
A majority of inter-island trade and approximately 90% of
international trade is conducted via maritime transport’
0
5
10
15
2010 2011 2012 2013 2014 2015 2016
Positive economic conditions have led to Indonesia’s
throughput growth gaining further pace in 2017, with total
throughput volume estimated to have risen between 2016 and
2017 by 7.8% to about 14.8 million TEUs
GDP: CAGR
5.7%
Sea Toll Programme to support major
domestic sea lanes
Pendulum Nusantara system in an effort to
reduce high logistic costs.
State owned enterprise companies
(Pelindos) handling most of the container
volumes in Indonesia
PROMINENT ASIA MARKET
ASIA DRIVING GLOBAL CONTAINER GROWTH
FAVOURABLE MARKET CONDITIONS IN INDONESIA
INTER-ISLAND CONNECTIVITY INDONESIA CONTAINER THROUGHPUT GOVERNMENT INITIATIVES
Million TEUs
Source: Drewry Maritime Research Source: Drewry Maritime Research Source: Drewry Maritime Research
Source: Drewry Maritime Research
Source: Drewry Maritime Advisors

MARKET OVERVIEW
14
INDUSTRY OVERVIEW
7% 4%
4%
23%
41%
21%
Belawan Makasar Tanjung Emas Other Tanjung Priok Tanjung Perak
INDONESIA TOP 10 CONTAINER PORTS - 2017
PELINDO MARKET SHARE 2010 - 2017
OTHERS
• Banjarmasin 2.8%
• Teluk Lamong 3.3%
• Pontianak 1.9%
• Samarinda 1.5%
• Bitung 1,5%
• Remaining (each <0.2 MTEu)
12.0%
14.8
Million
18
16
14
12
10
8
6
4
2
0
11.3 12.1 13.1 14.0 14.0 13.0 13.7 14.8
2010 2011 2012 2013 2014 2015 2016 2017
45.5% 48.8% 49.3% 50.9% 48.9% 45.4% 45.3% 46.7%
31.7% 29.7% 30.1%
29.6% 31.0% 33.5% 33.6%
33.2% 15.5%
7.5%
13.0% 12.2% 12.8%
13.5% 13.4% 12.4%
14.0%
7.5%
7.6% 7.3% 7.3%
7.6% 7.8% 7.7%
Pelindo I
Pelindo IV
Pelindo III
Pelindo II
Collaboration of four Pelindo companies in an effort to reduce high
logistic costs.
Strong domestic economic and trade development, geographic reliance on maritime transport, and stimulus packages from the Government
could support port industry in Indonesia to grow further
PENDULUM NUSANTARA
Develop a more efficient domestic shipping network between six of
Indonesia’s major ports (Belawan, Batam, Tanjung Priok, Tanjung Perak,
Makassar and Sorong) by upgrading these port facilities and increasing
their water depth
Allows larger vessels to be deployed, which in turn would significantly
reduce shipping costs and boost domestic trade
Support major domestic sea lanes with well-developed ports through a
“hub and feeder model”
SEA TOLL PROGRAMME
Provide for more efficient cargo loading and unloading services for
vessels as well as achieve a more balanced distribution of national
development resources across regions in Indonesia
Ensuring adequate dredging and access channel to support Panamax
vessels and improving the draft of feeder ports
Source: Pelindo I, II, III, IV, Drewry Maritime Advisors
Source: Drewry Maritime Advisors

KEY CREDIT HIGHLIGHTS
PRIVATE & CONFIDENTIAL
III

KEY CREDIT HIGHLIGHTS
16
INVESTOR PRESENTATION
1 Leading market position in high growth
Indonesian market with high barriers to
entry
2 Strategically located ports
serving the fast growing
hinterland
3 Longstanding and diverse customer base
across geographies and industries
4 Established Port Operator Recognized
for Operational Performance
5 Strong Support from the
Government
6 Robust Financial Profile
7 Reputable and Experienced
Management

Leading Market Position in the Central and Eastern Indonesia
1. Leading market position in high growth Indonesian
market with high barriers to entry (1)
KEY CREDIT HIGHLIGHTS
CONTAINER
Market Share
LIQUID BULK
Market Share
DRY BULK
Market Share
GENERAL CARGO
Market Share
CONTAINER TRAFFIC INDONESIA MARKET SHARE OF PELINDO COMPANIES FOR 2017 (2) GDP INDONESIA, CONSTANT PRICES (Rp Quadrillion)
8%
47% 33%
12%
PELINDO I PELINDO II PELINDO III PELINDO IV
99.8% 97.0% 75.5% 25.8%
5.74
6.16
6.45
6.86
7.29
7.73
8.16
8.56
8.98
9.43
5.39 2006
2007
2008
2009
2010
2011
2012
2013
2014
2015
2016
CAGR : 5.7%
International Domestic
2010
2011
2012
2013
2014
2015
2016
0 2 4 6 8 10 12 14
(1) Based on internal estimates and excluding private ports and non-commercial Government-owned ports
(2) Market share is based on container throughput volume
High Growth Country with Heavy Reliance on Maritime Transportation
17 Source: IMF – WEO Oct 2017 Source: Drewry Maritime Research Source: Drewry Maritime Advisors

1. Leading market position in high growth Indonesian
market with high barriers to entry (1)
KEY CREDIT HIGHLIGHTS
Given the high barriers to entry and Pelindo III’s first mover advantage, it is well placed to maintain its position as the
largest port operator in Central and Eastern Indonesia
High barriers to entry for new entrants to gain a foothold in Pelindo III’s regional focus
Scarcity of sizeable coastal land
Process of obtaining licenses / permits
Significant capital expenditure with long lead time
Well-connected port network
Good relationships with key stakeholders
Developing a port requires large amounts of space, located in a maritime
environment with proximity to production or consumption areas
• Road / railway connections to the hinterland
• Gateway port / branch to disperse containers / cargo to domestic
ports throughout the region
• Obtaining government-issued licenses / permits for port operations
requires significant time
• Pelindo III enjoys several first mover advantages
New port opportunities are likely to be put up for tender
• Capital expenditure is required for port development / maintenance
including the acquisition of new equipment
• Construction of a port is a long-term project
• Pelindo III has established relationships with key stakeholders (many
of which are government related)
• Pelindo III’s expertise in the region well-positions them for any tender
opportunity
(1) Based on internal estimates and excluding private ports and non-commercial Government-owned ports. Excludes Western Java 18

2. Strategically located ports serving the fast growing hinterland
19
KEY CREDIT HIGHLIGHTS
South Kalimantan – Banjarmasin
Surabaya – Tanjung Perak
Bali – Benoa
Other Branch Connectivity
• One of the largest cities in Kalimantan, capital of South Kalimantan
• Strong mining industry; benefits from the large quantities of coal and other
natural resources exported from resource-rich Kalimantan
• Real gross regional domestic product CAGR for Central Kalimantan: 6.7%
(2012 – 2016)
• 2nd largest city in Indonesia and the industrial /
manufacturing hub of Central Eastern Indonesia
• Gateway hub to Eastern Indonesia
• Second largest province by GDP, accounting for
14.8% of Indonesian GDP
• Strategically located near industrial areas, well
connected by developed toll road
• Real gross regional domestic product CAGR for East
Java: 5.7% (2012 – 2016)
• One of the 5 largest cities in Indonesia
• Fourth largest province by GDP, accounting for 8.9% of Indonesian GDP
• Strong economic growth supported by various industries relocating
from Jakarta
• Connectivity to good inland road networks and planned railway network
• Real gross regional domestic product CAGR for Central Java: 5.3%
(2012 – 2016)
• Key port in one of the most attractive tourist
destinations in Asia
• Ministry of Tourism supporting developing Benoa
into the largest cruise passenger terminal in
Indonesia
• Real gross regional domestic product CAGR for Bali:
6.5% (2012 – 2016)
• Most of the ports are connected to road and railway
network
• It allows us and our customers to avoid urban traffic
as well as efficient transportation of cargo in and out
of our ports
• In addition, some plans are made to provide more
connectivity to our ports:
Reactivation of Indro line at Kandangan railway station
in 2028 which will connect the new Teluk Lamong
Terminal to the national railway station.
Reactivation of a railway network to connect Tanjung
Emas to the national railway system
Local government of South Kalimantan is supporting
the development of infrastructure around Banjarmasin
Construction of a new railway line, for which we are in
negotiations with state-owned enterprise, PT Kereta Api
Indonesia, to collaborate and jointly develop, is
expected to directly connect and significantly reduce
traveling time between Duduk Sampeyan Station in
Gresik City to JIIPE Port
Semarang – Tanjung Emas
Pelindo III’s ports are strategically located in a number of the largest and fastest growing provinces in Indonesia

3. Longstanding and diverse quality customer base
across geographies and industries
KEY CREDIT HIGHLIGHTS
Longstanding relationship with diverse customer base across industries and geographies, with high customer satisfaction
Strong Customer Diversity Various Industry Served International Container Destination
Key customers by service offering
Large Domestic Corporation Shipping Lines
Local
International
Industrial
Goods
Consumer
Goods Agriculture Oil and Gas
Mining Energy Infrastructure
SINGAPORE CHINA MALAYSIA
U.S SOUTH KOREA JAPAN
• Highly diversified customer base with low
concentration risk
o Largest customer – 20.0% of net revenue
o Top 10 customers – 23.4% of net revenue
• Diversity across vessel types, including dry bulk,
liquid bulk, container, tanker, passenger, etc
20

4. Established port operator recognized for operational and execution performance
21
LONG TRACK RECORD EFFICIENT OPERATION OPERATIONAL EXCELLENCE
57 Years of Experience
45 operational and non-operational
awards for excellence between 2015 and
2017
Window System Benefits:
• Traffic and Port Efficiency
• More predictable cargo time
• Reduced waiting and berthing time
• Reduced turnover voyage time
Advanced Terminal Operations Systems
for :
• Ship Planning
• Yard Planning
• Gate Control
• Yard Inventory
• Vessel Billing
• Management Control and Reporting
Surpasses DGST standard Maximum waiting time for domestic non-container
cargo
Automated Stacking Cranes
KEY CREDIT HIGHLIGHTS
The highest award for good performance
at the annual BUMN Performance
Excellence Awards
The Zero Accident Award 2017 from
Badan Penyelenggara Jaminan Sosial
Employment
1
2
0.3 0.2
Tanjung Emas Banjarmasin
DGST Standards Pelindo III
(In hour)

5. Strong Support from the Government
22
KEY CREDIT HIGHLIGHTS
Sea Toll Program
Port Development Program
Pelindo III’s linkages with the Government of Indonesia
Support major domestic sea lanes with well-developed ports
through a “hub and feeder model”
HUBS PORT
5 1 Wholly owned by the Government of Indonesia
2 The Ministry of State-Owned Enterprises appoints
Board of Commissioners and Board of Directors
3 Favorable government regulatory support
4 Closely aligned between company’s growth with the
Government’s strategic plan
Modernization of facilities and equipment
for the purposes of ensuring adequate
dredging and access channel to support
Panamax vessels and improving the draft of
feeder ports
19
1 4
TOTAL
PELINDO III

6. Robust Financial Profile
23
KEY CREDIT HIGHLIGHTS
Our robust financial profile is supported by strong and stable cash flows and a strong capital structure
Net Revenue (Rp Billions) EBITDA Margin (%) NCOA(1) (Rp Billions)
(1) Net cash provided by operating activities
Outcome
1 Increase in revenue
2 Improve operating margins
3 Increase cash generating ability
Strategy
Expand our operations:
• Increasing capacity at our existing facilities
• Developing new ports
• Diversifying into other lines of business
Increase the operating efficiency:
• Clustering of services
• Modernizing facilities
Supported by:
1
2
Forecasted positive growth of Indonesia’s economy
Indonesia’s reliance on maritime transport
3,248
1,953 2,156 2,558
5,015
5,016 5,357 6,610
2,917 3,553
709 685
864
410 513
755 1,444
1,375
849 493
Cargo Services Ship Services Other Services
6,480 7,486
8,849
4,176 4,559
2015 2016 2017 1H 2017 1H 2018 2015 2016 2017 1H 2017 1H 2018 2015 2016 2017 1H 2017 1H 2018
42% 37%
46% 44% 45%

7. Reputable & experienced board & management
24
KEY CREDIT HIGHLIGHTS
Board of Commissioners Board of Diretors
Hari Bowo President Commissioner
• Education: Indonesian Naval Academy
• Previous position: Vice Admiral and Deputy Chief of Staff of the Indonesian Navy
• Appointed to Pelindo III BoC in 2014
Zainal Abbidin Commissioner
• Education: Indonesia Military Academy
• Current position: President Commisioner of PT Kartanegara Energi Perkasa
• Appointed to Pelindo III BoC in 2017
Wahju Satrio Utomo Commissioner
• Education: Trisakti University (Bachelor), University of Indonesia (Masters),
University of Indonesia (Doctor)
• Current position: Head of Human Resources Development Division, the Ministry of
Transportation
• Appointed to Pelindo III BoC in 2016
Heddy Lugito Commissioner
• Education: Diponegoro University (Bachelor)
• Current position: Editor in Chief Gatra
• Appointed to Pelindo III BoC in 2016
I Gusti Ngurah Askhara Danadiputra President Director
• Education: Gadjah Mada University (Bachelor), University of Indonesia (Masters)
• Previous position: Director of PT Wijaya Karya (Persero)
• >20 years experience
Mohammad Iqbal Commercial and Operational Director
• Education: University of Diponegoro (Bachelor), Sekolah Tinggi Manajemen
(Masters)
• Previous position: CEO PT Samudera Golden Mitra
• c.20 years experience
Husein Latief Engineering & IT Director
• Education: Bandung Institute of Technology (Bachelor), IHE-Delft (Masters)
• Previous position: Commercial and Business Development Director, Pelindo III
• >25 years experience
Toto Heli Yanto HR & General Affairs Director
• Education: Merdeka Surabaya University (Bachelor), Airlangga University (Masters)
• Previous position: General Manager of Tanjung Perak
• c.19 years experience
U. Saefudin Noer Finance Director
• Education: University of Indonesia (Bachelor & Masters)
• Previous position: Senior Vice President, CIMB Niaga
• c.21 years experience
Dedi Syaruf Usman Commissioner
• Education: Parahyangan University (Bachelor), University of Colorado (Masters)
• Current position: Director of Separated State Asset, Ministry of Finance
• Appointed to Pelindo III BoC in 2018

FINANCIAL HIGHLIGHTS
PRIVATE & CONFIDENTIAL
IV

3,248
1,953 2,156 2,558
5,015
STRONG REVENUE GROWTH AND STABLE MARGINS
26
FINANCIAL HIGHLIGHTS
NET REVENUE OPERATING INCOME
EBITDA NET CASH FROM OPERATING ACTIVITIES
(Rp Billions)
(EBITDA in Rp Billions | EBITDA margin in %) (Rp billions)
(1) Operating Income Margin
(2) Profit for the Year Margin
2,229 2,084
3,173
1,394 1,543
34%
27%
35% 33% 33%
-
500
1,000
1,500
2,000
2,500
3,000
3,500
Operating Income
OIM(1)
2,739 2,806
4,088
1,828 2,061
42%
37%
46% 44% 45%
-
500
1,000
1,500
2,000
2,500
3,000
3,500
4,000
4,500
0.0
0.1
0.1
0.2
0.2
0.3
0.3
0.4
0.4
0.5
0.5
EBITDA
EBITDA Margin
5,016 5,357 6,610
2,917 3,553
709 685
864
410 513
755 1,444
1,375
849 493
Cargo Services Ship Services Other Services
4,559 4,176
8,849
7,486
6,480
2015 2016 2017 1H 2017 1H 2018 2015 2016 2017 1H 2017 1H 2018
2015 2016 2017 1H 2017 1H 2018 2015 2016 2017 1H 2017 1H 2018

1,359 932 1,082
5,016
2,618 1,816
2,751
4,755
8,488 9,821
11,281
15,034
HEALTHY BALANCE SHEET
27
FINANCIAL HIGHLIGHTS
TOTAL ASSETS
TOTAL DEBT (1) NET CURRENT ASSETS
(Rp Billions)
(Rp Billions) (Rp Billions)
NET CASH
(Rp Billions)
(1) Intereset Bearing Debt
2015
Assets
Net Current
Assets
2015
Debt
2015 2016 2017
Net Cash
1H2018
18,971 22,182
25,409 28,712
2016 2017 1H 2018
2016 2017 1H 2018 2015 2016 2017 1H 2018

RESILIENT CREDIT METRICS & PRUDENT DEBT MANAGEMENT
28
FINANCIAL HIGHLIGHTS
NET DEBT/EBITDA NET DEBT/EQUITY
EBITDA/FINANCE CHARGES DEBT PROFILE (1)
Net Debt/Equity Net Debt/EBITDA
2015
6.9x
EBITDA/Finance
Charges
(Rp Billions)
(1) As of 30 June 2018
(2) Current Maturity of Long Term Liabilities
2015 2016 2017 1H 2018
0.8x 0.8x 0.8x
0.9x
5.9x
2016 2017
6.8x
1H 2017 1H 2018
5.4x
6.3x
2015 2016 2017 LTM 2018
2.1x 2.1x
2.9x
3.8x
- 175 601
14,258
Short Term
Bank Loan
CMLTM (2) Long Term
Bank Loan
Bonds
Payable