Embed Size (px)
Citation preview

Investor Update
US & Canada RoadshowJune 2011
For
per
sona
l use
onl
y

Forward Looking Statements
2
This presentation contains certain forward-looking statements and forecasts which includewithout limitation, expectations regarding future performance, costs, production levels orrates, reserves and resources, the financial position of Troy Resources NL (the “Company”),industry growth or other trend projections.
Although such forecasts and forward-looking statements reflect current beliefs and arebased on information currently available and assumptions believed to be reasonable there isno assurance that actual results will be consistent with such forecasts and forward-lookingstatements. A number of factors could cause actual results, performance, or achievement todiffer materially from the results expressed or implied in such forecasts and forward-lookingstatements. For a description of such factors please see the section entitled “Risk Factors”in the Company’s amended and restated preliminary prospectus dated 10 January 2008available under the Company’s profile at sedar.com.
Nothing in this presentation should be construed as either an offer to sell or a solicitation ofan offer to buy or sell securities.
For
per
sona
l use
onl
y

Dividend Paying Junior Gold Producer
3
Listed on ASX (TRY) in 1987 as a Gold Explorer Became a gold producer in Western Australia in 2000 Opened our first gold mine in South America in 2002 (Sertão) Dual listed on the TSX in 2008 Commissioned the Andorinhas gold mine in Brazil in 2008 Acquired the Casposo gold silver project in Argentina in 2009 Paid 10(1) consecutive cash dividends First gold pour at Casposo in November 2010 April Casposo production 4,414 oz Au @ US$232/oz net of silver
credits No hedging Significant exploration potential(1) 11th Dividend declared and to be paid on June 29, 2011
For
per
sona
l use
onl
y

What We Own
4
Gold Assets Andorinhas Gold Mine – Brazil Casposo Gold Silver Mine – Argentina Sandstone Gold Mine – Australia (Closed)
Performance Dec 2010 H1 Profit of A$6.05m FY2011 production guidance of ~80,000oz Au_eq
We ste rn Austra l ia
Q ue e nsla nd
N. S. W.
A.C.T.
Vic to ria
So uthAustra l ia
500 km
Daly River
Sydney
Perth
X
SandstoneGold Mine
On Care and MaintenanceFor
per
sona
l use
onl
y

Corporate Snapshot
5
Troy Share Price
Board & Senior Management
Non-Executive Directors
David Dix, Non-Executive Chairman
Gordon Chambers, Non-Executive Director
Fred Grimwade, Non-Executive Director
John Jones, Non-Executive Director
Robin Parish, Non-Executive Director
Senior Management Paul Benson, CEO & Managing Director
Peter Doyle, VP Exploration & Bus. Development
Ken Nilsson, Executive Director Operations
David Sadgrove, CFO & Company Secretary
Ordinary Shares: 87.97MOptions: 4.8MShare Price as at June 9, 2011: $3.6752 Week Range: $1.85 - $4.29 Market Cap as at June 9, 2011: ~A$320MNet Debt as of May 31, 2011 ~A$19.3m
Key Statistics (A$)
0
0.5
1
1.5
2
2.5
3
3.5
4
4.5
1‐Oct‐08
1‐Dec‐08
1‐Feb‐09
1‐Apr‐09
1‐Jun‐09
1‐Aug‐09
1‐Oct‐09
1‐Dec‐09
1‐Feb‐10
1‐Apr‐10
1‐Jun‐10
1‐Aug‐10
1‐Oct‐10
1‐Dec‐10
1‐Feb‐11
1‐Apr‐11
1‐Jun‐11
Troy Share Price A$
For
per
sona
l use
onl
y
6
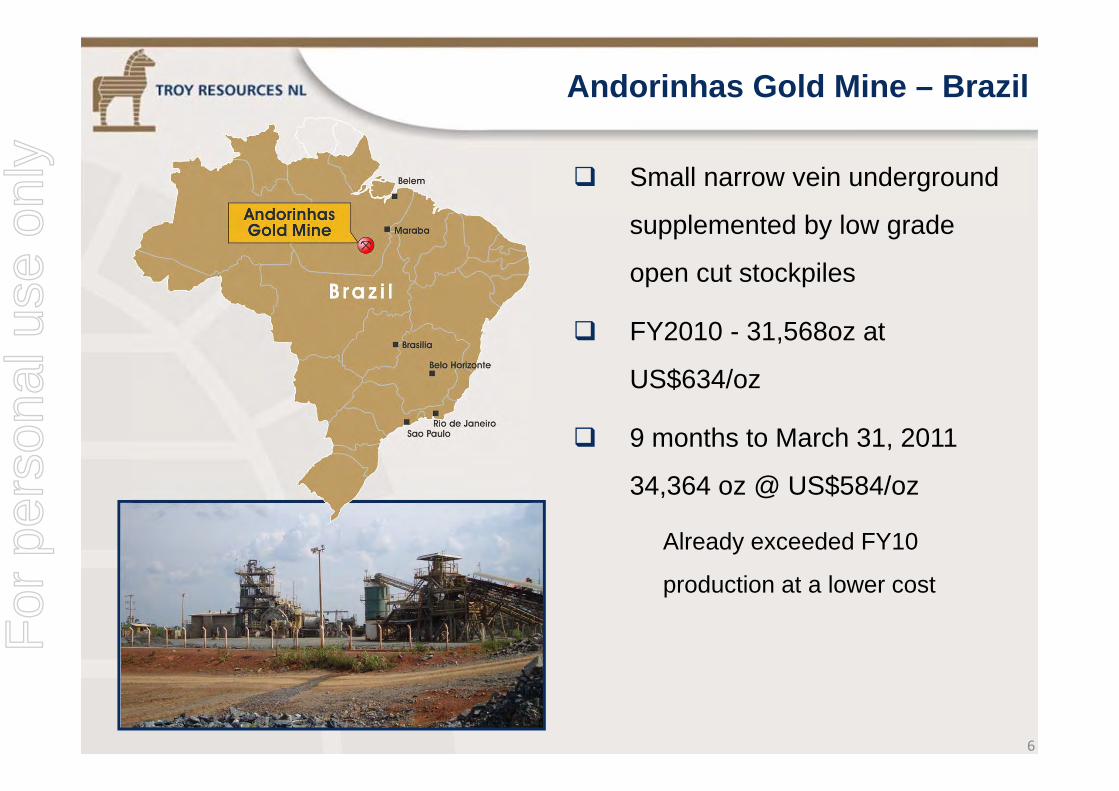
Andorinhas Gold Mine – Brazil
Small narrow vein underground
supplemented by low grade
open cut stockpiles
FY2010 - 31,568oz at
US$634/oz
9 months to March 31, 2011
34,364 oz @ US$584/oz
Already exceeded FY10
production at a lower cost
For
per
sona
l use
onl
y
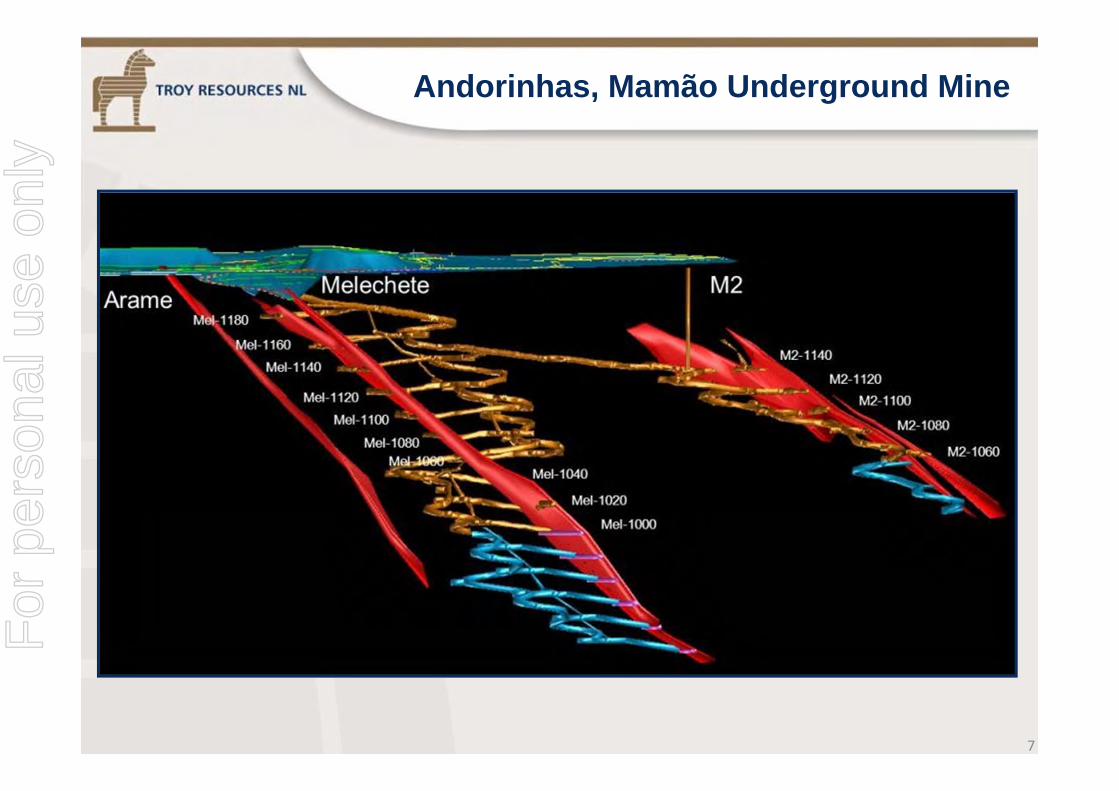
Andorinhas, Mamão Underground Mine
7
For
per
sona
l use
onl
y
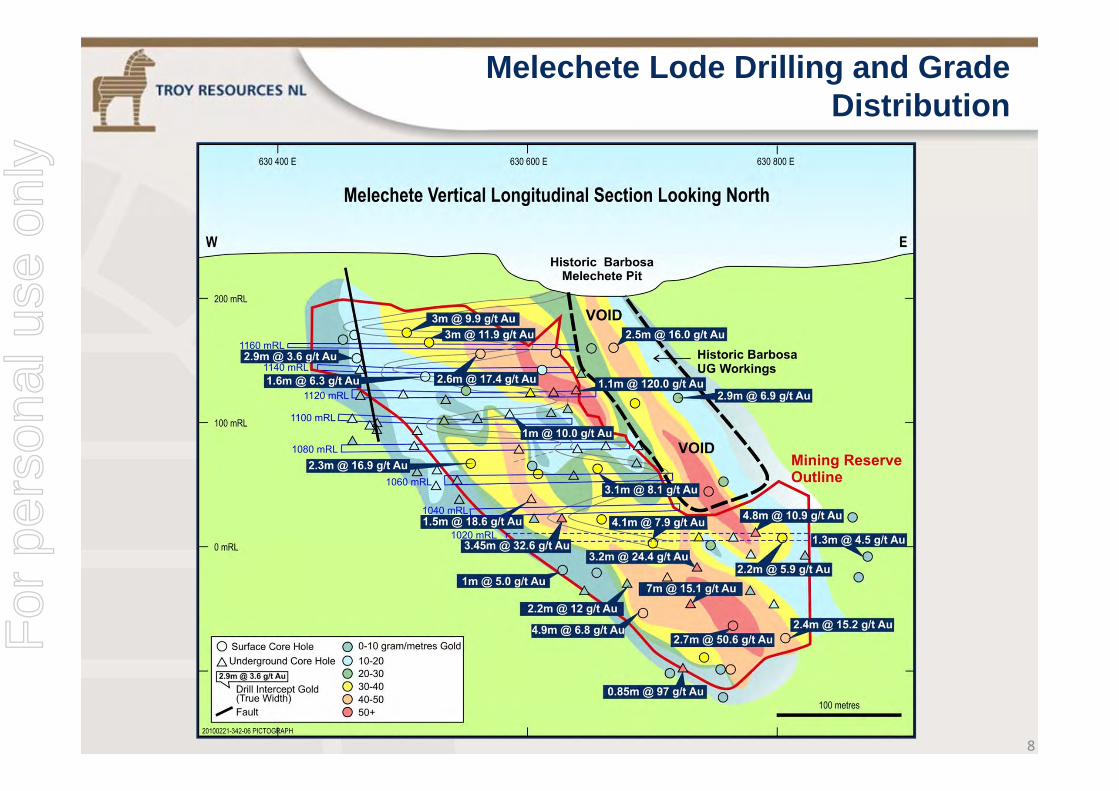
Melechete Lode Drilling and Grade Distribution
8
For
per
sona
l use
onl
y

Melechete Deep Drilling Plan
9
For
per
sona
l use
onl
y

Andorinhas – Summary
10
Moving into higher grade areas FY2010: 31koz Guidance FY2011: ~48koz, FY2012: ~50koz 2 year mine life with potential at depth and
regionally to add Reserves Monetising iron ore royalty ~ forecast US$3m pa
from calendar 2012
For
per
sona
l use
onl
y
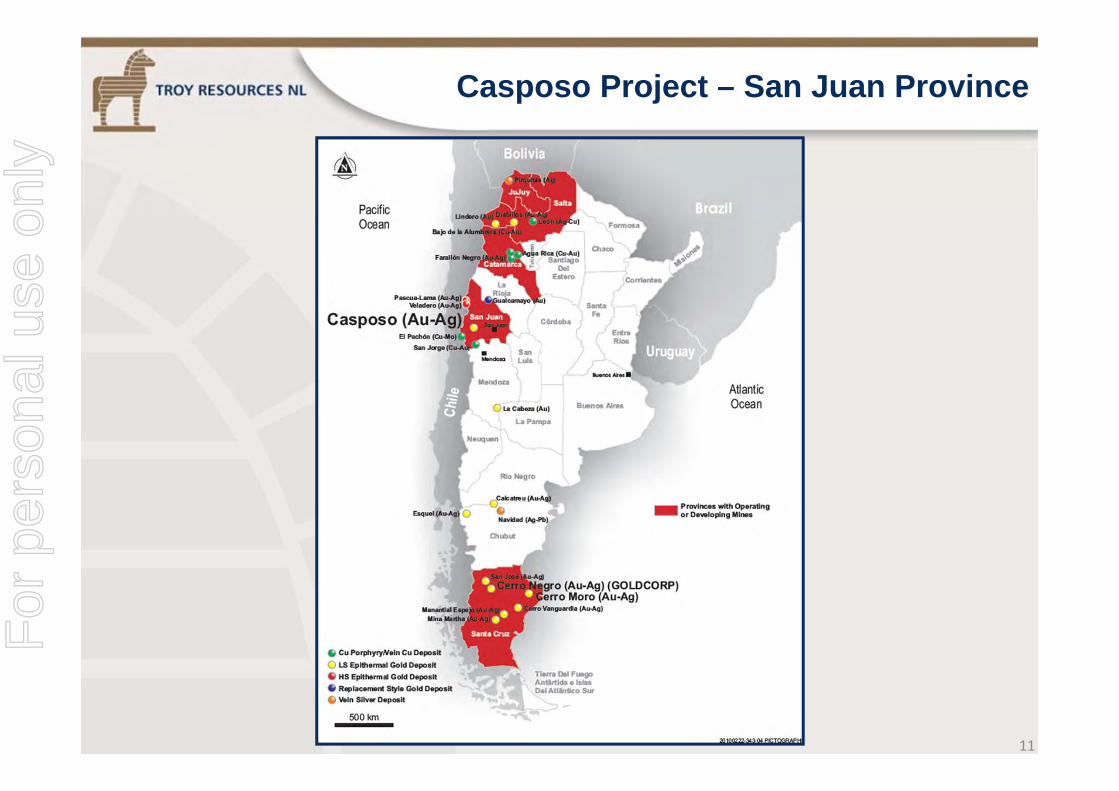
Casposo Project – San Juan Province
11
For
per
sona
l use
onl
y

San Juan Province Mineral EndowmentMines and Casposo Project Access
12
For
per
sona
l use
onl
y
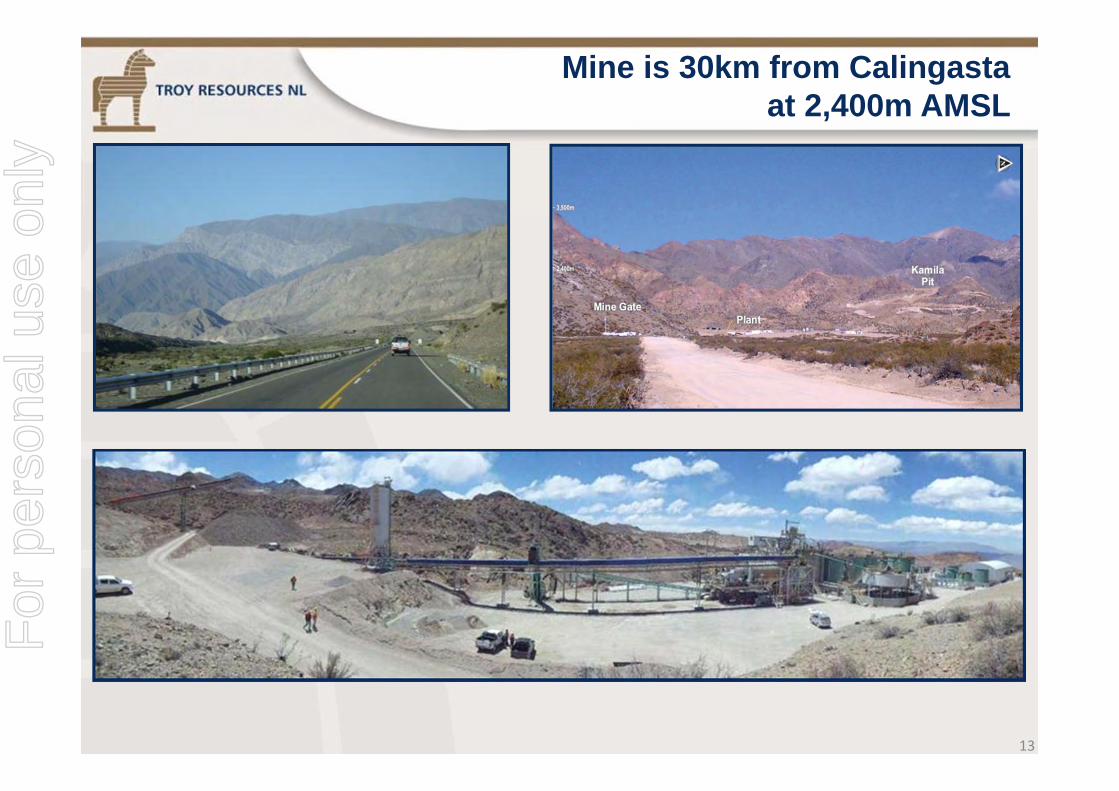
Mine is 30km from Calingastaat 2,400m AMSL
13
For
per
sona
l use
onl
y

Delays in Ramp Up to Full Production
14
Relatively complex circuit Merrill Crowe (due to silver) Dry Tailings (due to seismically active area) Closed circuit for water balance
Initial difficulty with tailings filter performance Clay binding filter cloth New Flocculent Introduction of antiscalant Introduction of diatomaceous earth and
cellulose Various challenges with:
Merrill Crowe filters Thickeners/clarifiers Commissioning of electronics/plant
monitoring and control systems Training and supervision Expect to reach budget throughput in June
quarter
Tails Filtering January 2011
Tails Filtering March 2011
For
per
sona
l use
onl
y

Casposo Ramp Up
15
March Quarter Produced: 4,318 oz Au @ US$974/oz (net of 72koz
silver credits) or 6,118 oz Au_eq @ US$1,153/oz Au_eq
(co-product costing) Averaged 250tpd compared to design of
1100tpd Month of March:
2,465 oz Au @ US$477/oz net of silver credits Averaged 360tpd
Month of April: 4,414 oz Au @ US$232/oz net of silver Averaged 550tpd
Mining comfortably ahead of the plant – stockpile at March 31: 145,877 t @ 7.1g/t Au and 97.7 g/t Ag Over 4 months stockpile at budget rates!
For
per
sona
l use
onl
y
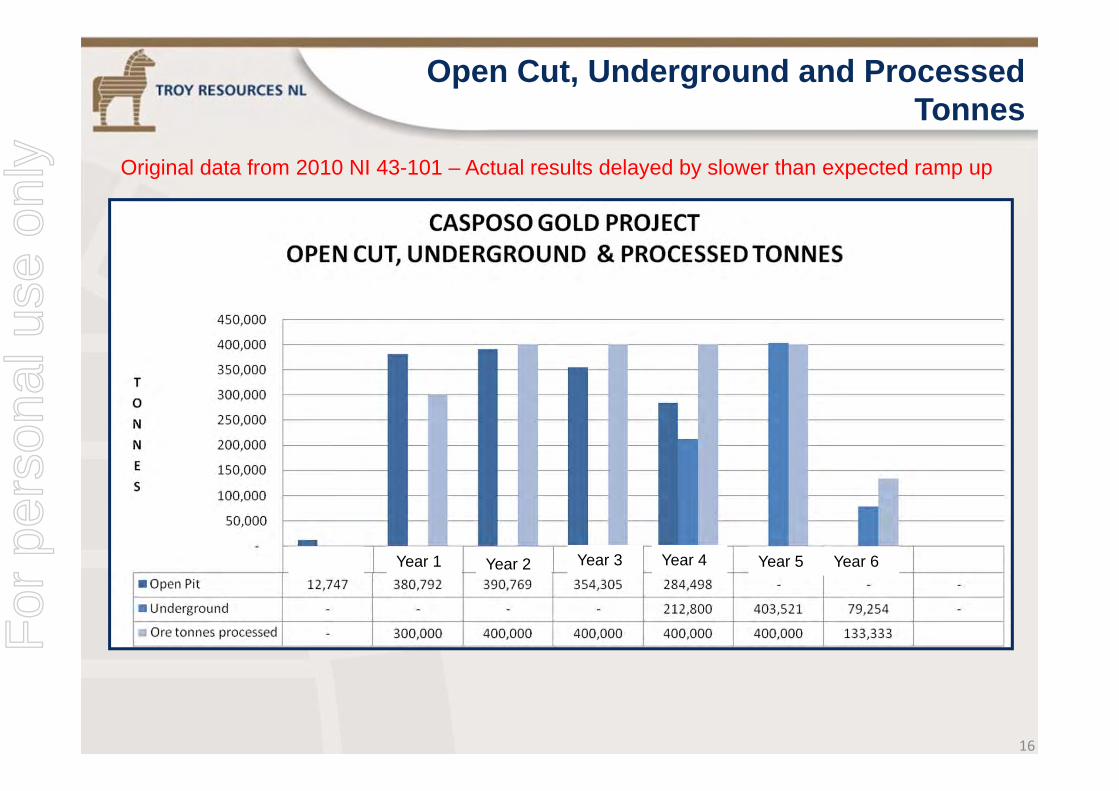
Open Cut, Underground and ProcessedTonnes
16
Year 1 Year 2 Year 3 Year 4 Year 5 Year 6
Original data from 2010 NI 43-101 – Actual results delayed by slower than expected ramp up
For
per
sona
l use
onl
y

Total Gold Equivalent Production
17
Aim to avoid the drop in production in Years 3 and 4 through proving up additional higher grade ore –eg Kamila SE Extension
Aim to extend mine life through proving up additional surface and underground Reserves
Year 1 Year 2 Year 3 Year 4 Year 5 Year 6
Original data from 2010 NI 43-101 – Actual results delayed by slower than expected ramp up
For
per
sona
l use
onl
y
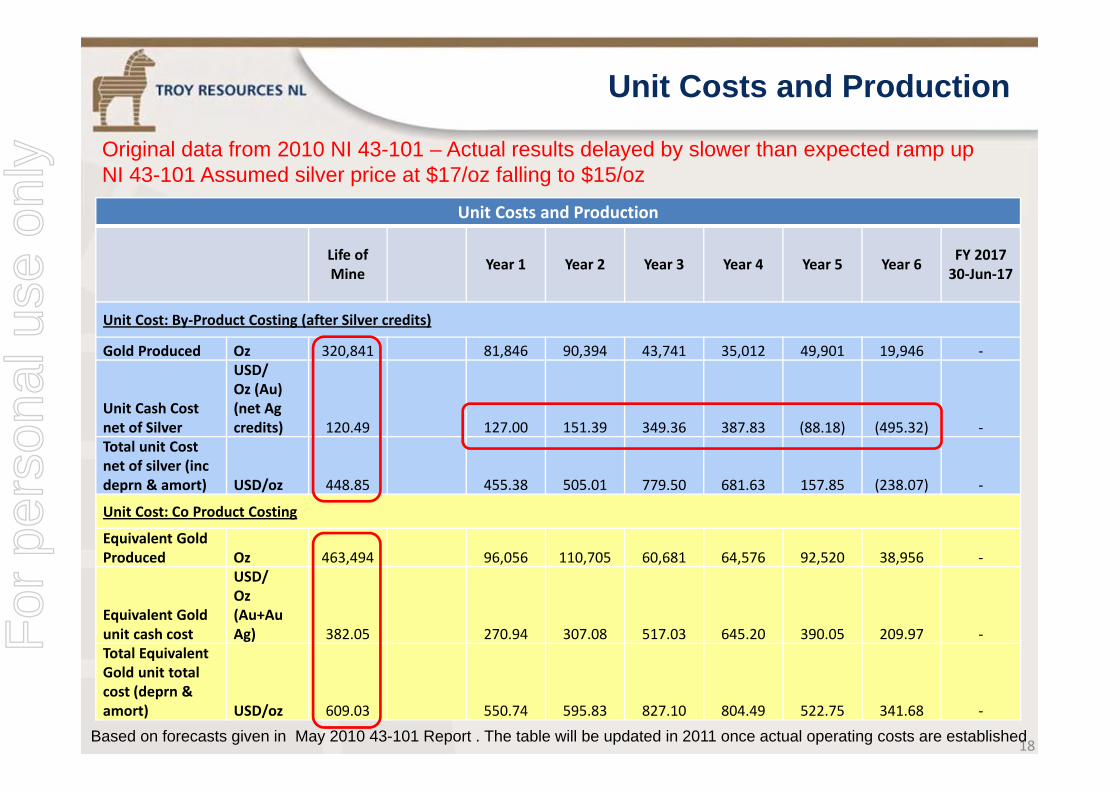
Unit Costs and Production
18
Unit Costs and Production
Life of Mine Year 1 Year 2 Year 3 Year 4 Year 5 Year 6 FY 2017
30‐Jun‐17
Unit Cost: By‐Product Costing (after Silver credits)
Gold Produced Oz 320,841 81,846 90,394 43,741 35,012 49,901 19,946 ‐
Unit Cash Costnet of Silver
USD/Oz (Au)(net Ag credits) 120.49 127.00 151.39 349.36 387.83 (88.18) (495.32) ‐
Total unit Costnet of silver (inc deprn & amort) USD/oz 448.85 455.38 505.01 779.50 681.63 157.85 (238.07) ‐
Unit Cost: Co Product Costing
Equivalent Gold Produced Oz 463,494 96,056 110,705 60,681 64,576 92,520 38,956 ‐
Equivalent Gold unit cash cost
USD/Oz(Au+AuAg) 382.05 270.94 307.08 517.03 645.20 390.05 209.97 ‐
Total Equivalent Gold unit total cost (deprn & amort) USD/oz 609.03 550.74 595.83 827.10 804.49 522.75 341.68 ‐
Based on forecasts given in May 2010 43-101 Report . The table will be updated in 2011 once actual operating costs are established
Original data from 2010 NI 43-101 – Actual results delayed by slower than expected ramp upNI 43-101 Assumed silver price at $17/oz falling to $15/oz
For
per
sona
l use
onl
y

Blue Sky
19
For
per
sona
l use
onl
y

0
1
2
3
4
5
6
7
8
million ou
nces
South American Low Sulphidation Epithermal DepositsTotal Endowment
20
Casposo – Low Sulphidation Epithermal Deposit
For
per
sona
l use
onl
y
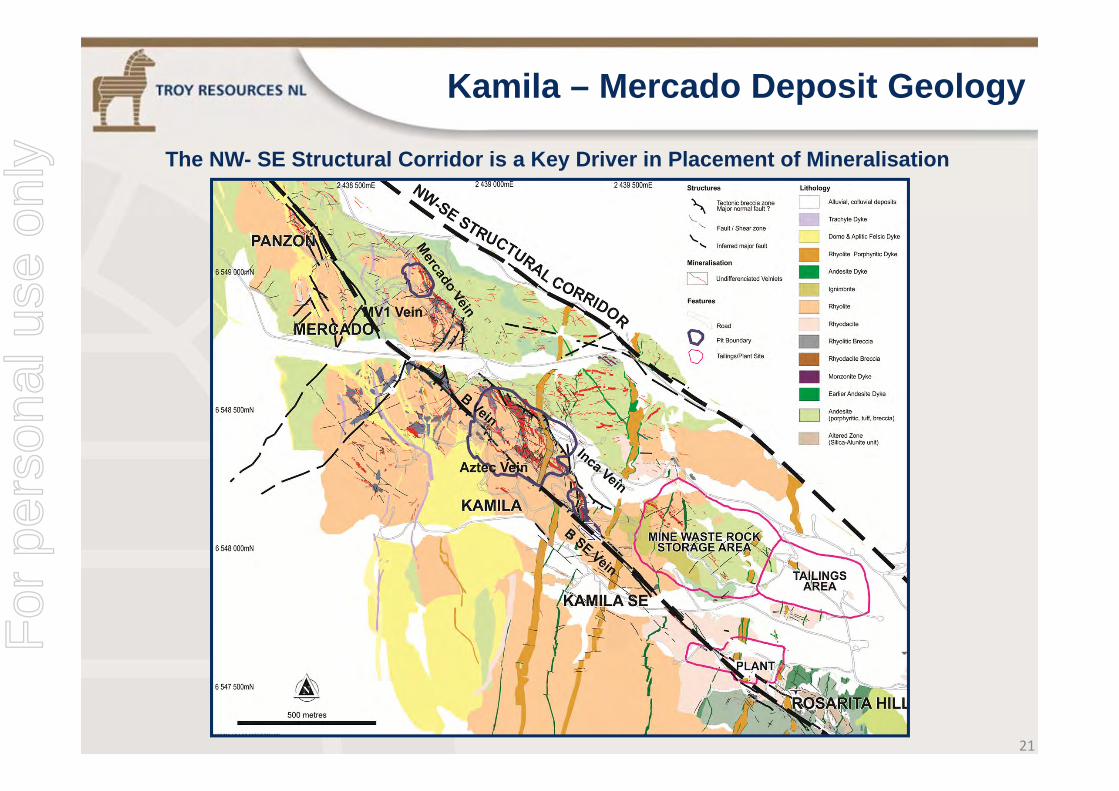
Kamila – Mercado Deposit Geology
21
The NW- SE Structural Corridor is a Key Driver in Placement of Mineralisation
For
per
sona
l use
onl
y

22
Casposo 2010 Mining Reserves
Highest value intercept on the property to date
HOLE: CA082507.2m @ 108.7g/t Au
4,423g/t Ag
Contained metal value over US$10,000 per tonne at US$1500/oz Au and US$35/oz Ag.
For
per
sona
l use
onl
y
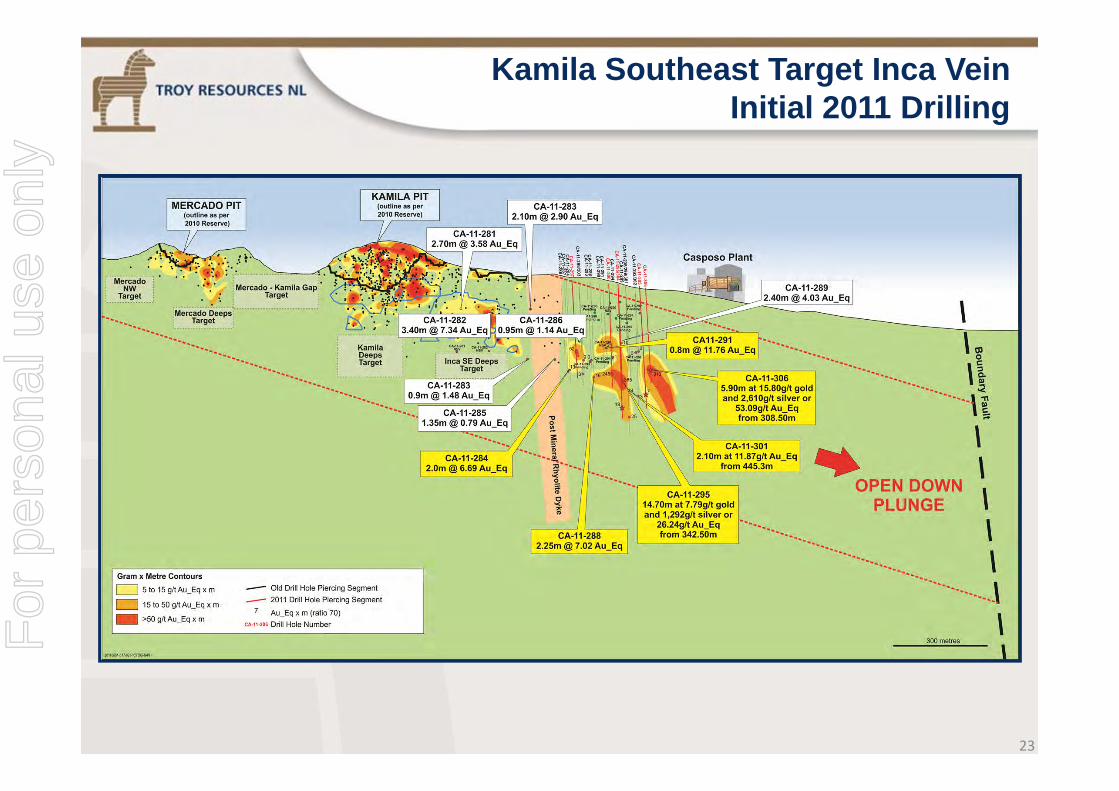
Kamila Southeast Target Inca Vein Initial 2011 Drilling
23
For
per
sona
l use
onl
y

High Grade Intercepts Drilled in April
24
Note the quoted gold equivalent grade assumes a conversion of 70:1 for converting silver to gold equivalent.
This is a conservative approach to enable comparisons to the reserve published in 2010. The ratio of 70:1 assumes the differential metallurgical recoveries assumed in the NI43101 Report produced in 2010 and the metal prices assumed at that time.Because silver prices have risen proportionally more than gold prices, this ratio is increasingly conservative for high silver grade intercepts.Using the same assumptions for metallurgical recoveries but current prices of:
Au – US$1500/oz andAg – US$35/oz
Gives a conversion ratio of 50:1 to convert silver to gold.The impact can be seen for hole CA-11-3005.4m @ 8.18 g/t Au and 2,607 g/t Ag
Was reported as 45.43 g/t Au_eq assuming a conversion ratio for silver to gold of 70:1
The grade would be 60.3g/t Au_eq if the conversion ratio of 50:1 was assumed.
For
per
sona
l use
onl
y

Inca Vein CA-11-295 Cross Section
25
For
per
sona
l use
onl
y

Inca Vein CA-11-300 Cross Section
26
For
per
sona
l use
onl
y
27
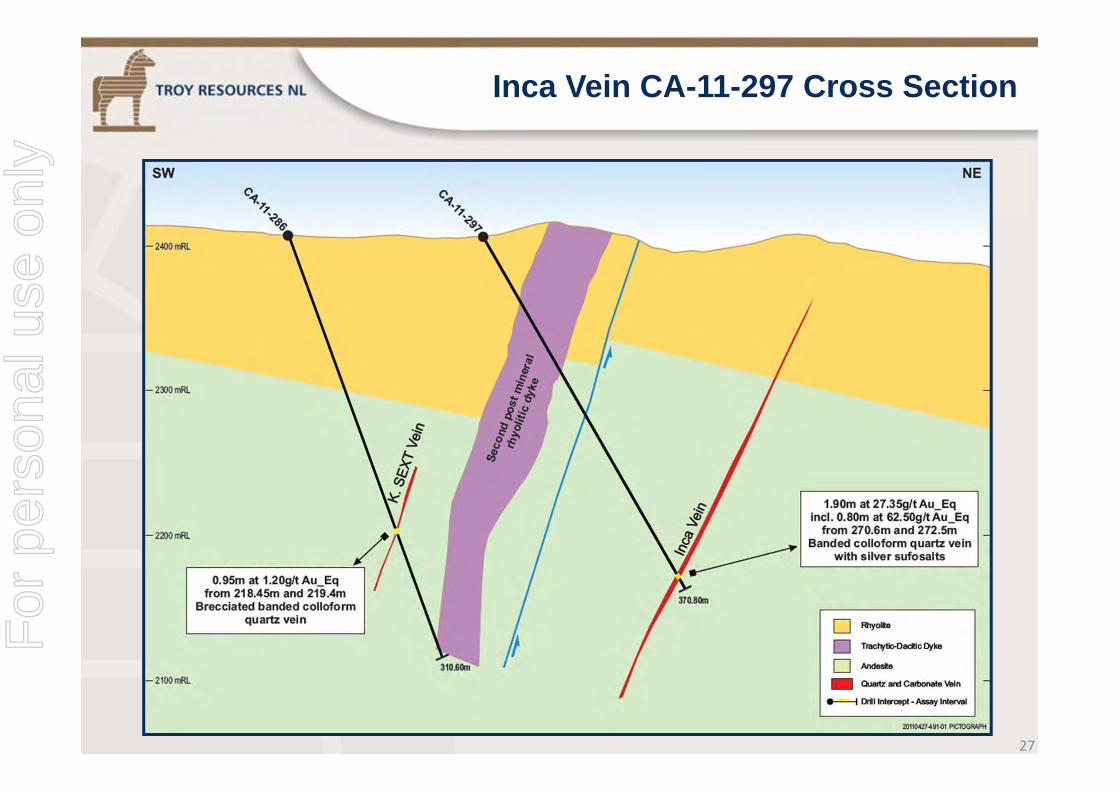
Inca Vein CA-11-297 Cross SectionF
or p
erso
nal u
se o
nly
Julieta SE Drilling
28
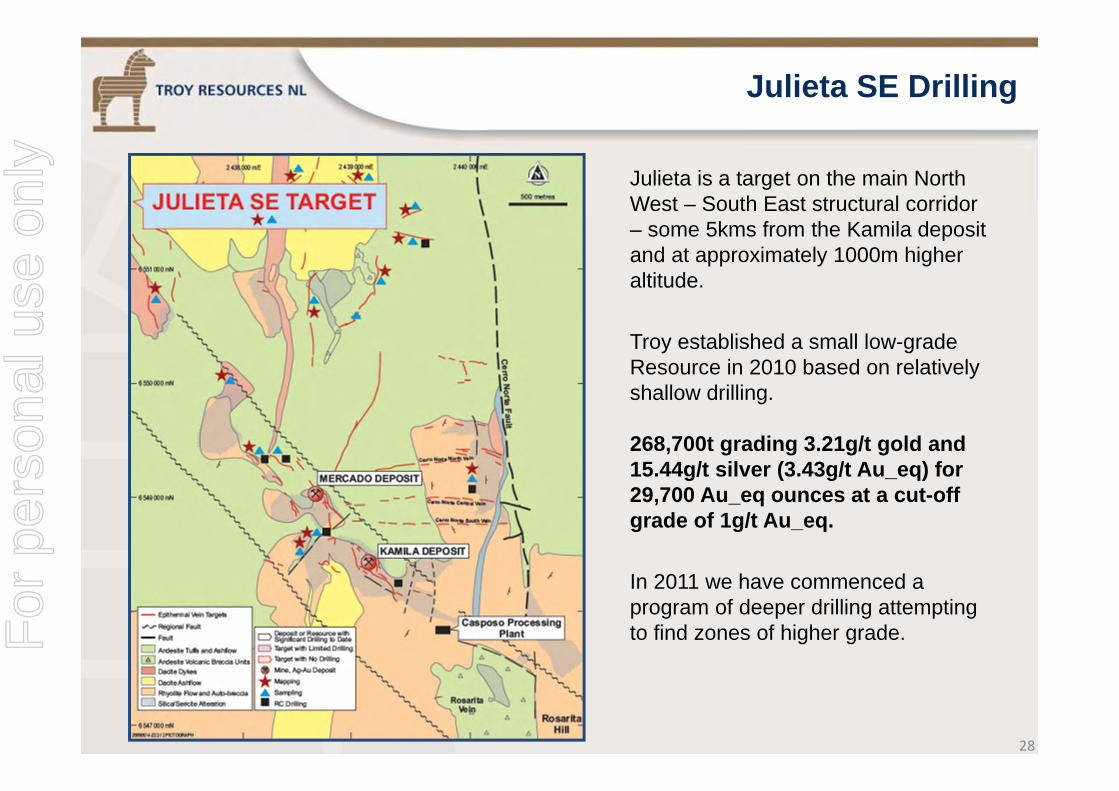
Julieta is a target on the main North West – South East structural corridor – some 5kms from the Kamila deposit and at approximately 1000m higher altitude.
Troy established a small low-grade Resource in 2010 based on relatively shallow drilling.
268,700t grading 3.21g/t gold and15.44g/t silver (3.43g/t Au_eq) for 29,700 Au_eq ounces at a cut-off grade of 1g/t Au_eq.
In 2011 we have commenced a program of deeper drilling attempting to find zones of higher grade.F
or p
erso
nal u
se o
nly

29
Julieta SE DrillingF
or p
erso
nal u
se o
nly

2011 Drilling Results
30
For
per
sona
l use
onl
y
31
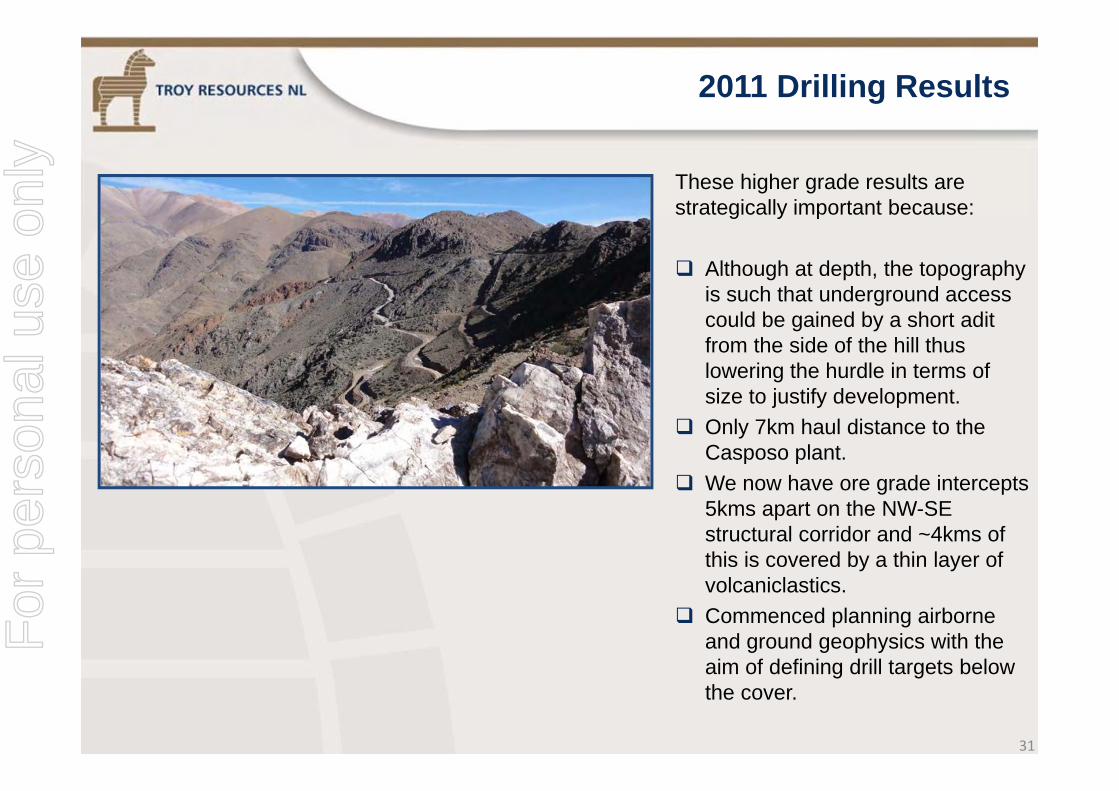
These higher grade results are strategically important because:
Although at depth, the topography is such that underground access could be gained by a short aditfrom the side of the hill thus lowering the hurdle in terms of size to justify development.
Only 7km haul distance to the Casposo plant.
We now have ore grade intercepts 5kms apart on the NW-SE structural corridor and ~4kms of this is covered by a thin layer of volcaniclastics.
Commenced planning airborne and ground geophysics with the aim of defining drill targets below the cover.
2011 Drilling ResultsF
or p
erso
nal u
se o
nly

Exploration Potential Brownfields Targets
32
Cerro Norte ZoneLooking East
Maya Vein
Mercado NW Vein
For
per
sona
l use
onl
y

Lucia Vein Drill TargetChannel Sample Results
33
For
per
sona
l use
onl
y

Casposo Norte – Anomalous Gold In and Near SurfaceA Target for Follow Up Deeper Diamond Drilling
34
For
per
sona
l use
onl
y

Castaño Nuevo Target, Argentina
35
For
per
sona
l use
onl
y
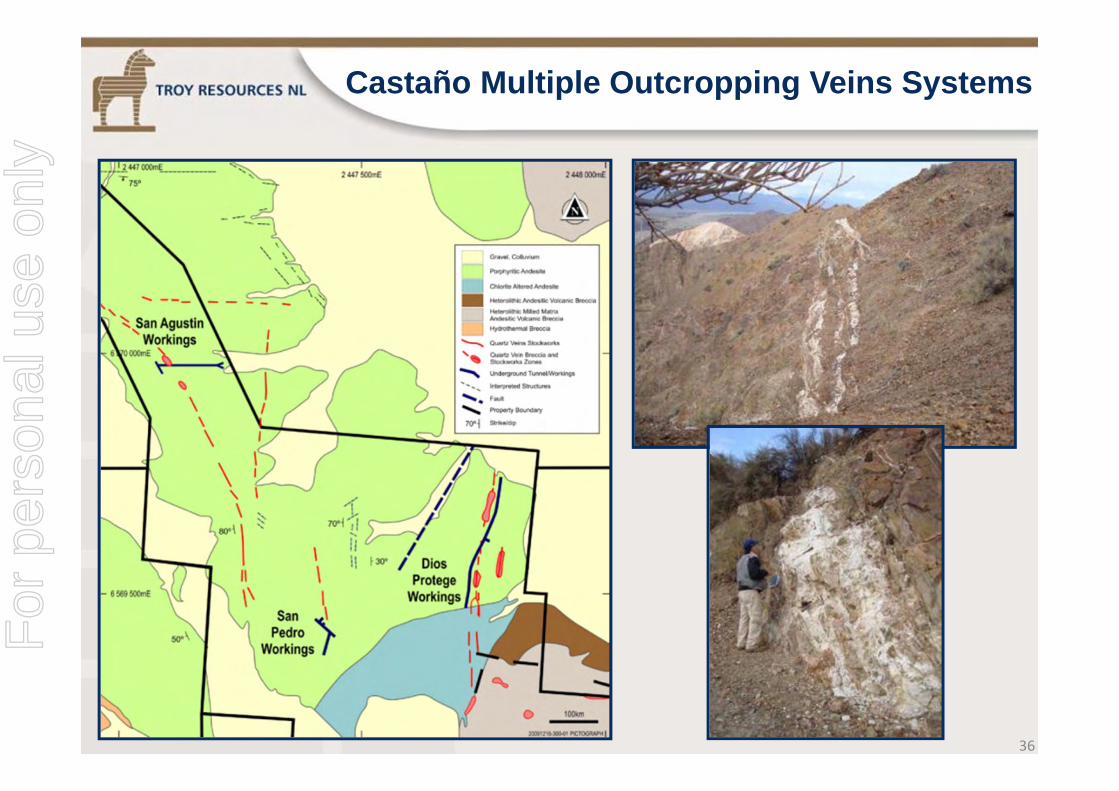
Castaño Multiple Outcropping Veins Systems
36
For
per
sona
l use
onl
y

Extended Our Ground Positionwith the Signing of the Don David JV
37
For
per
sona
l use
onl
y

An Inflection Point?
39
Casposo ramping up to budget production.
Casposo will be a very low cost mine.
Andorinhas performing well.
Significant exploration results at Casposo with potential, dependent on
further exploration success, to:
Extend mine life (additional ounces) Avoid drop in production in years 3 and 4 (access to higher grade) Lower unit costs (access to higher grade)
For
per
sona
l use
onl
y

Thank You
For
per
sona
l use
onl
y

Qualifying Statements
46
1. Au_eq grade calculated using a gold to silver ratio of 1:70. As per May 2010 Current Casposo NI-43101 Technical ReportThe gold equivalent cut-off was determined according to the parameters below:
• Au/Ag ratio 1:70.00• Au Price US$933.33/oz• Ag Price US$15.50/oz• Au processing recovery 93.7%• Ag processing recovery 80.6%
Gold equivalency is determined by metal price and recovery factors. Metal prices were the average prices assumed in the Casposo life of mine plan. Processingrecoveries were determined by metallurgical testwork carried out by independent consultants on diamond drill core from Casposo.The equivalency is calculated by the formula - Gold: Silver ratio:
= (gold price ÷ silver price) x (gold recovery ÷ silver recovery)= (933.33 ÷ 15.5) x (.937 ÷ .806)= 70.00
Gold equivalency is calculated by the formula: Au_eq g/t = Au g/t + (Ag g/t ÷ 70.00)
2. NSR – No Significant Results All samples were prepared and assayed by Alex Stewart (Assayers) Argentina Laboratory in Mendoza Argentina.3. Gold by FA and either a gravimetric or AAS finish, using method gold 4-50 or gold 4A 50 for samples with gold>10g/t4. Silver by three techniques: four-acid digestion followed by AAS reading for check samples up to February 2006, aqua regia digestion followed by inductively
coupled plasma with optical emission spectroscopy (ICP-OES) reading for all samples in mineralised intersections after February 2006. Method numbers wereGMA, ICP-AR-39 and silver 4A-50.
Geological information in this Report has been compiled by Troy’s Vice President Exploration & Business Development, Peter Doyle, who:
• Is a full time employee of Troy Resources NL• Has sufficient experience which is relevant to the type of deposit under consideration and to the activity which he is undertaking to qualify as a Competent
Person as defined in the 2004 Edition of the ‘Australasian Code for Reporting of Exploration Results, Mineral Resources and Ore Reserves’• Is a member of the Australasian Institute of Mining and Metallurgy• Has consented in writing to the inclusion of this data
Information of a scientific or technical nature in this report was prepared under the supervision of Peter J. Doyle, Vice President Exploration and Business Development ofTroy, a “qualified person” under National Instrument 43-101 – “Standards of Disclosure for Mineral Projects”, a Fellow of the Australasian Institute of Mining and Metallurgy.Mr. Doyle has sufficient experience, which is relevant to the style of mineralisation and type of deposit under consideration, and to the activity he is undertaking, to qualifyas a “qualified person” as defined in “National Instrument 43-101 – Standards of Disclosure for Mineral Projects”. Mr Doyle has reviewed and approved the informationcontained in this report. For further information regarding the Company’s projects in Brazil, Australia and Argentina, including a description of Troy’s quality assuranceprogram, quality control measures, the geology, samples collection and testing procedures please refer to the technical reports filed which are available under theCompany’s profile at www.sedar.com or on the Company’s website.
This report contains forward-looking statements. These forward-looking statements reflect management’s current beliefs based on information currently available tomanagement and are based on what management believes to be reasonable assumptions. A number of factors could cause actual results, performance, or achievementsto differ materially from the results expressed or implied in the forward-looking statements. Such factors include, among others, future prices of gold, the actual results ofcurrent production, development and/or exploration activities, changes in project parameters as plans continue to be refined, variations in ore grade or recovery rates, plantand/or equipment failure, delays in obtaining governmental approvals or in the commencement of operations.
For
per
sona
l use
onl
y