Embed Size (px)
Citation preview

Investor RelationsSupplementary information Fourth Quarter 2015

1
Chief Executive, CEO
Finn Haugan
For further information, please contact
Kjell Fordal, Executive Director Finance [email protected] +47 905 41 672
Address
SpareBank 1 SMN, Postboks 4796 Sluppen, 7467 Trondheim
Visiting address: Søndre gate 4, 7011 Trondheim
Sparebank 1 SMN Switchboard: +47 07300
Information on the Internet
SpareBank 1 SMN’s home page www.smn.no
ECC information in general www.egenkapitalbevis.no
Financial Calendar 2016
1st quarter 2016 29 April 2016
2nd quarter 2016 11 August 2016
3rd quarter 2016 28 October 2016

2
Table of Contents
1. SpareBank 1 SMN .................................................................................................................................. 3
1.1. Financial highlights ......................................................................................................................... 3
1.2. Business description ........................................................................................................................ 4
1.3. Credit ratings ................................................................................................................................... 7
1.4. Equity capital certificate (MING) ................................................................................................... 8
2. Financial results .................................................................................................................................... 12
2.1. Main figures** .............................................................................................................................. 12
2.2. Net interest income*) .................................................................................................................... 14
2.3. Commission income ...................................................................................................................... 17
2.4. Operating expenses........................................................................................................................ 19
3. Loans to customers ............................................................................................................................... 22
3.1. Distribution of loans by industry ................................................................................................... 22
3.2. Risk profile and write-downs ........................................................................................................ 24
4. Capital adequacy ................................................................................................................................... 29
5. Funding ................................................................................................................................................. 34
6. Financial results .................................................................................................................................... 36
7. Segment Information ............................................................................................................................ 39
7.1. Extract from income statement ...................................................................................................... 39
7.2. Retail Market ................................................................................................................................. 42
7.3. SME ............................................................................................................................................... 45
7.4. Corporate ....................................................................................................................................... 48
7.5. Subsidiaries ................................................................................................................................... 51
8. Development last ten years ................................................................................................................... 56
3
1. SpareBank 1 SMN
1.1. Financial highlights
January- December 2015
(Consolidated figures. Figures in parentheses refer to the same period of 2014 unless otherwise stated).
Profit before tax and inv. held for sale: NOK 1,776 million (NOK 2,143 million)
Net profit: NOK 1,406 million (NOK 1,782 million)
Return on equity: 10.7 per cent (15.1 per cent)
12-month growth in lending (incl. SB1 Boligkreditt and SB1 Næringskreditt): 5.8 per cent (7.3 per cent)
12-month growth in deposits: 5.6 per cent (8.5 per cent)
Loan losses: NOK 169 million (NOK 89 million), including collective write downs of NOK 82 million (0 million)
Common equity tier 1 ratio: 13.6 per cent (11.2 per cent)
Earnings per EC: NOK 7.02 (8.82) Fourth quarter 2015
Profit before tax and inv. held for sale: NOK 388 million (NOK 434 million)
Net profit: NOK 287 million (NOK 375 million)
Return on equity: 8.4 per cent (12.1 per cent)
Loan losses: NOK 56 million (NOK 34 million), including collective write downs of NOK 51 million (0 million)
Earnings per EC: NOK 1.45 (NOK 1.85)

4
1.2. Business description
SpareBank 1 SMN is Mid-Norway’s largest bank with assets totalling NOK 132 billion at the end of December 2015. Head office is in Trondheim. SpareBank 1 SMN employs 1,208 FTE, including subsidiaries, and provides a full range of products and services within financing, investments, money transfers, pensions as well as life and non-life insurance.
SpareBank 1 SMN's activities
Main areas of Sparebank 1 SMN
Subsidiaries*
Ownership: 87.0 % Number of man-years: 211 Key area: Real estate agency
Ownership: 100 % Number of man-years: 184 Key area: Accountancy business
Ownership: 72.1 % Number of man-years: 34 Key area: Lease finance
Ownership: 73.5 % Number of man-years: 104 Key area: Investment banking
Joint ventures
SpareBank 1 Gruppen AS (19.5%)
BN Bank ASA (33%)
SpareBank 1 Boligkreditt AS (19,0 %)
SpareBank 1 Næringskreditt AS (33,6 %)
SpareBank 1 Kredittkort (18.4%)
- Holding company for the SpareBank 1-Alliance
- Commercial bank located in Oslo and Trondheim
- Covered bond company (mortgages)
- Covered bond company (commercial real estate)
- Credit card company located in Trondheim
Retail Market
Number of man-years: 333
Corporate Market
Number of man-years: 117
Adm. & Support
Number of man-years: 195
*In addition SpareBank 1 SMN has subsidiaries with activities covering asset management, investments in regional seed corn, venture and private equity funds, property companies and car fleet management. These subsidiaries account for 29 man-years

5
Organisation of SpareBank 1 SMN
The Bank's operational structure as of January 1st 2016:
Group CEO
Finn Haugan
Retail Market
Svein Tore Samdal
Corporate
Vegard Helland
Group Finance
Kjell Fordal
Organisation and development
Nelly S Maske
Legal
Risk
Serves the retail
market incl agricultural
customers, sole proprietorships,
associations etc.
Serves the
corporate clients.
Central credit
function for the
Group
Finance, accounting,
analysis and strategy
HR, development
projects, technology
and market
6
Overview of governing and control bodies
SpareBank 1 Alliance
SpareBank 1 SMN was one of the founding partners of the SpareBank 1 Alliance ("the Alliance") in 1996. The Alliance consists of closely cooperating savings banks, all of them being independent and locally anchored banks. The purpose of the SpareBank 1 Alliance is for members to develop, procure and supply competitive financial services and products and to exploit economies of scale. The Alliance canalize a lot of its mutual interests through SpareBank 1 Gruppen AS, a holding company of life and non-life insurance, mutual funds, a broker-dealer and other companies. The Alliance is the 2nd largest Norwegian financial group with a wide distribution all over Norway.
*) LO: The Norwegian Confederation of Trade Unions

7
1.3. Credit ratings
Moody's 2015 2014 2013 2012 2011 2010
Outlook Stable Stable Negative Stable
Rating(s)
under
review Stable Stable
Issuer Rating A1 A1 A2 A2 A2 A1 A1
Bank Deposits A1/P-1 A1/P-1 A2/P-1 A2/P-1 A2/P-1 A1/P-1 A1/P-1
Senior Unsecured A1 A1 A2 A2 A2 A1 A1
Subordinate Baa2 Baa2 Baa2 Baa3 Baa3 A2 A2
Fitch 2015 2014 2013 2012 2011 2010
Outlook Stable Stable Stable Stable Stable Stable Negative
Long-term IDR A- A- A- A- A- A- A
Short-term IDR F2 F2 F2 F2 F2 F2 F1
Support rating 3 3 3 3 3 3 3
Todays
rating
Todays
rating
Year end
Year end

8
1.4. Equity capital certificate (MING)
The key figures are corrected for issues. 31 December 2015 the price of the Bank’s ECC was NOK 50.50 (NOK 58.50). Earnings per ECC were NOK 7.02 (NOK 8.82). Book value per ECC was NOK 67.65 (NOK 62.04) as of 31 December 2015.
Key figures4Q 3Q 2Q 1Q 4Q
(in NOK million) 2015 2015 2015 2015 2014 2015 2014 2013
ECC price 50,50 54,00 65,50 59,50 58,50 50,50 58,50 55,00
Number of certificates issued, millions 129,83 129,83 129,83 129,83 129,83 129,83 129,83 129,83
Booked equity capital per ECC (incl. dividend) 67,65 65,52 64,18 61,95 62,04 67,65 62,04 55,69
Adjusted profit per ECC 1,45 1,26 2,13 2,18 1,85 7,02 8,82 6,92
P/E per ECC 8,71 10,72 7,70 6,81 7,89 7,19 6,63 7,95
P/B equity capital 0,75 0,82 1,02 0,96 0,94 0,75 0,94 0,99
31 Dec.
0
10
20
30
40
50
60
70
80
Jan
14
Mar
14
May
14
Jul
14
Sep
14
Nov
14
Jan
15
Mar
15
May
15
Jul
15
Sep
15
Nov
15
SMN OSEBX OSEEX
1) OSEBX = Oslo Stock Exchange Benchmark Index (rebased)2) OSEEX = Oslo Stock Exchange ECC Index (rebased)
Stock price compared with OSEBX1) and OSEEX2)
1 Jan 2014 to 31 Dec 2015
0
2.000
4.000
6.000
8.000
Jan 14 Mar 14 May 14 Jul 14 Sep 14 Nov 14 Jan 15 Mar 15 May 15 Jul 15 Sep 15 Nov 15
Trading statistics1)
1 Jan 2014 to 31 Dec 2015
1) Total number of ECs traded (1,000)
9
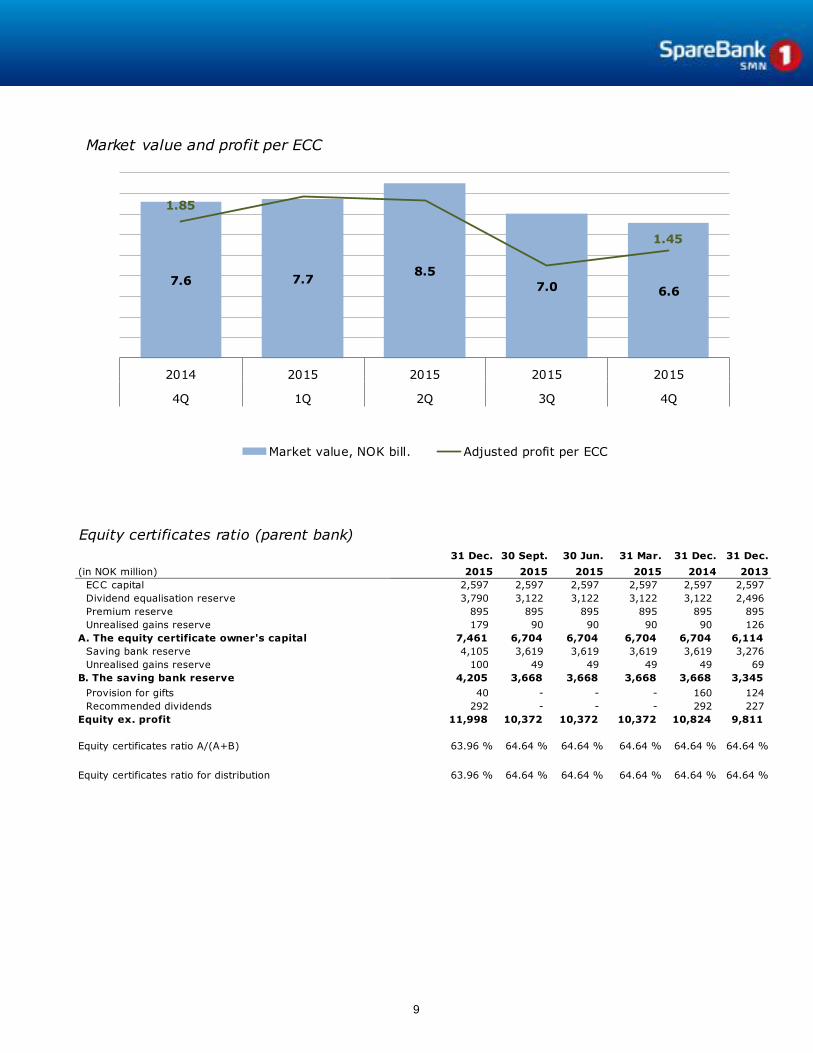
6.67.0
8.57.77.6
1.45
1.85
0.00
0.50
1.00
1.50
2.00
2.50
-
1,000
2,000
3,000
4,000
5,000
6,000
7,000
8,000
9,000
20152015201520152014
4Q3Q2Q1Q4Q
Market value and profit per ECC
Market value, NOK bill. Adjusted profit per ECC
Equity certificates ratio (parent bank)
31 Dec. 30 Sept. 30 Jun. 31 Mar. 31 Dec. 31 Dec.
(in NOK million) 2015 2015 2015 2015 2014 2013
ECC capital 2,597 2,597 2,597 2,597 2,597 2,597
Dividend equalisation reserve 3,790 3,122 3,122 3,122 3,122 2,496
Premium reserve 895 895 895 895 895 895
Unrealised gains reserve 179 90 90 90 90 126
A. The equity certificate owner's capital 7,461 6,704 6,704 6,704 6,704 6,114
Saving bank reserve 4,105 3,619 3,619 3,619 3,619 3,276
Unrealised gains reserve 100 49 49 49 49 69
B. The saving bank reserve 4,205 3,668 3,668 3,668 3,668 3,345
Provision for gifts 40 - - - 160 124
Recommended dividends 292 - - - 292 227
Equity ex. profit 11,998 10,372 10,372 10,372 10,824 9,811
Equity certificates ratio A/(A+B) 63.96 % 64.64 % 64.64 % 64.64 % 64.64 % 64.64 %
Equity certificates ratio for distribution 63.96 % 64.64 % 64.64 % 64.64 % 64.64 % 64.64 %

10
20 largest ECC holders
Owner
VPF Nordea Norge Verdi
Verdipapirfondet DNB Norge (IV)
Sparebankstiftelsen SMN
VPF Odin Norge
State Street Bank and Trust CO (nominee)
VPF Odin Norden
VPF Pareto Aksje Norge
Vind LV AS
VPF Danske Invest Norske Aksjer Inst. II
Wimoh Invest AS
The Bank of New York Mellon (nominee)
Pareto AS
MP Pensjon PK
Forsvarets Personellservice
JP Morgan Chase Bank (Nominee)
VPF Nordea Kapital
DNB Livsforsikring AS
State Street Bank and Trust CO (nominee)
Verdipapirfondet DNB Norge Selektiv (III)
VPF Danske Invest Norske Aksjer Inst. I
Total 20 largest shareholders
Others
Total
2.67 %
2.59 %
2.24 %
2.11 %
1.85 %
1.82 %
1.46 %
1.40 %
Number
4,810,413
4,147,494
3,965,391
3,826,686
3.70 %
3.19 %
3.05 %
2.95 %
Ownership
in %
1,329,561
2,359,388
1,892,398
1,821,202
3,472,091
3,363,290
2,909,106
2,736,435
2,400,567
1,792,160
1,674,646
100.00 %
1.02 %
1.02 %
0.93 %
38.03 %
61.97 %
1.38 %
1.29 %
1.24 %
1.07 %
1.04 %
1,325,444
1,207,123
49,383,230
80,453,213
129,836,443
1,383,148
1,611,137
1,355,550

11
ECC capital history
Year Change
1991 Placing
1992 Placing
2000 Employee placing
2001 Employee placing
2002 Employee placing
2004 Bonus Issue
2005 Placing
2005 Employee placing
2005 Split
2005 Bonus Issue
2007 Dividend Issue
2007 Employee placing
2008 Dividend Issue
2008 Employee placing
2009 Bonus Issue
2010 Placing
2010 Employee placing
2011 Issue
2012 Placing
2012 Employee placing
2012 Private placement 112 129,836,443 2,597
6,148,060
1,440
1,009
Change in ECC
capital No. of ECC's
1,009 24
Total ECC
capital
10,097,817
6,099,432
7,685,075
9,859,317
610
768
986
525 5,250,000
6,053,099
600
605
75
525
5
6,000,000
1,262
5
1
13 2,373
69,434,167
53,752,203
1,736
57,603,748
57,861,806 1,447 6
289
1,349 53,976,003
123,407,456
124,218,466
2,468
2,484
95
16
5
5
154
91
-
253
82
2,373
614
94,930,286
217
1,344
94,905,286
94,397,474
50,489,085
40,391,268
624 2,360
12
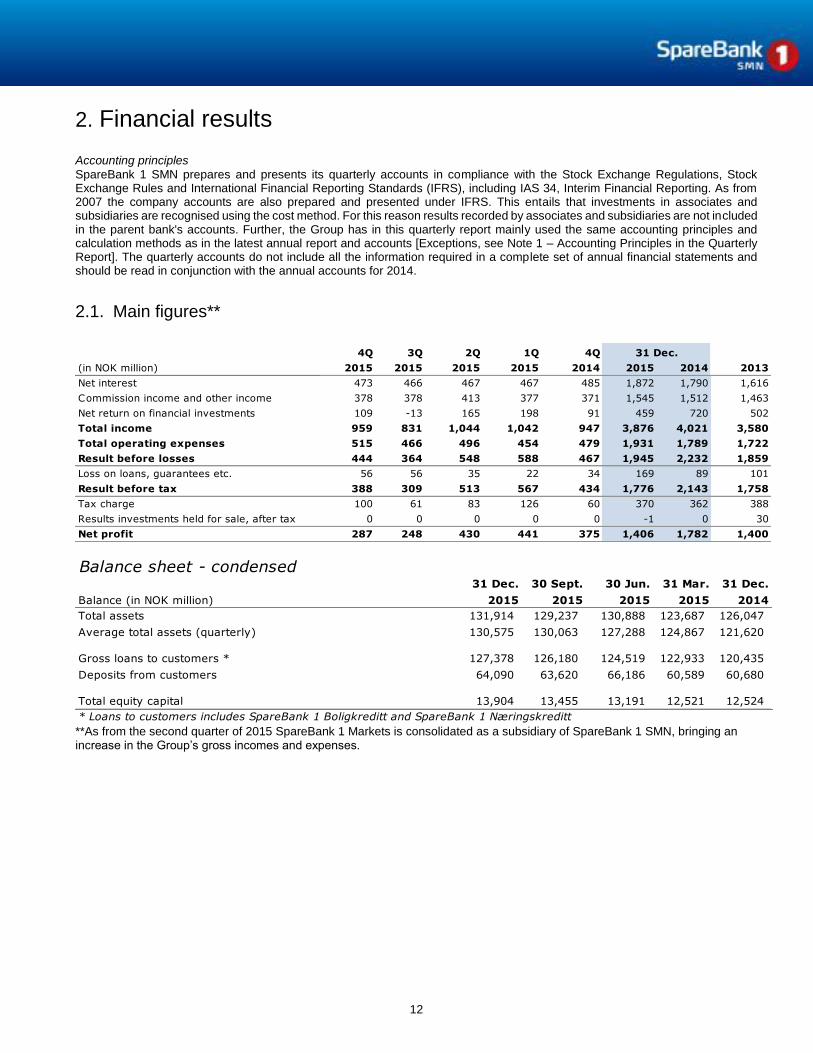
2. Financial results
Accounting principles
SpareBank 1 SMN prepares and presents its quarterly accounts in compliance with the Stock Exchange Regulations, Stock Exchange Rules and International Financial Reporting Standards (IFRS), including IAS 34, Interim Financial Reporting. As from 2007 the company accounts are also prepared and presented under IFRS. This entails that investments in associates and subsidiaries are recognised using the cost method. For this reason results recorded by associates and subsidiaries are not included in the parent bank's accounts. Further, the Group has in this quarterly report mainly used the same accounting principles and calculation methods as in the latest annual report and accounts [Exceptions, see Note 1 – Accounting Principles in the Quarterly Report]. The quarterly accounts do not include all the information required in a complete set of annual financial statements and should be read in conjunction with the annual accounts for 2014.
2.1. Main figures**
4Q 3Q 2Q 1Q 4Q
(in NOK million) 2015 2015 2015 2015 2014 2015 2014 2013
Net interest 473 466 467 467 485 1,872 1,790 1,616
Commission income and other income 378 378 413 377 371 1,545 1,512 1,463
Net return on financial investments 109 -13 165 198 91 459 720 502
Total income 959 831 1,044 1,042 947 3,876 4,021 3,580
Total operating expenses 515 466 496 454 479 1,931 1,789 1,722
Result before losses 444 364 548 588 467 1,945 2,232 1,859
Loss on loans, guarantees etc. 56 56 35 22 34 169 89 101
Result before tax 388 309 513 567 434 1,776 2,143 1,758
Tax charge 100 61 83 126 60 370 362 388
Results investments held for sale, after tax 0 0 0 0 0 -1 0 30
Net profit 287 248 430 441 375 1,406 1,782 1,400
31 Dec.
Balance sheet - condensed31 Dec. 30 Sept. 30 Jun. 31 Mar. 31 Dec.
Balance (in NOK million) 2015 2015 2015 2015 2014
Total assets 131,914 129,237 130,888 123,687 126,047
Average total assets (quarterly) 130,575 130,063 127,288 124,867 121,620
Gross loans to customers * 127,378 126,180 124,519 122,933 120,435
Deposits from customers 64,090 63,620 66,186 60,589 60,680
Total equity capital 13,904 13,455 13,191 12,521 12,524
* Loans to customers includes SpareBank 1 Boligkreditt and SpareBank 1 Næringskreditt **As from the second quarter of 2015 SpareBank 1 Markets is consolidated as a subsidiary of SpareBank 1 SMN, bringing an increase in the Group’s gross incomes and expenses.
13
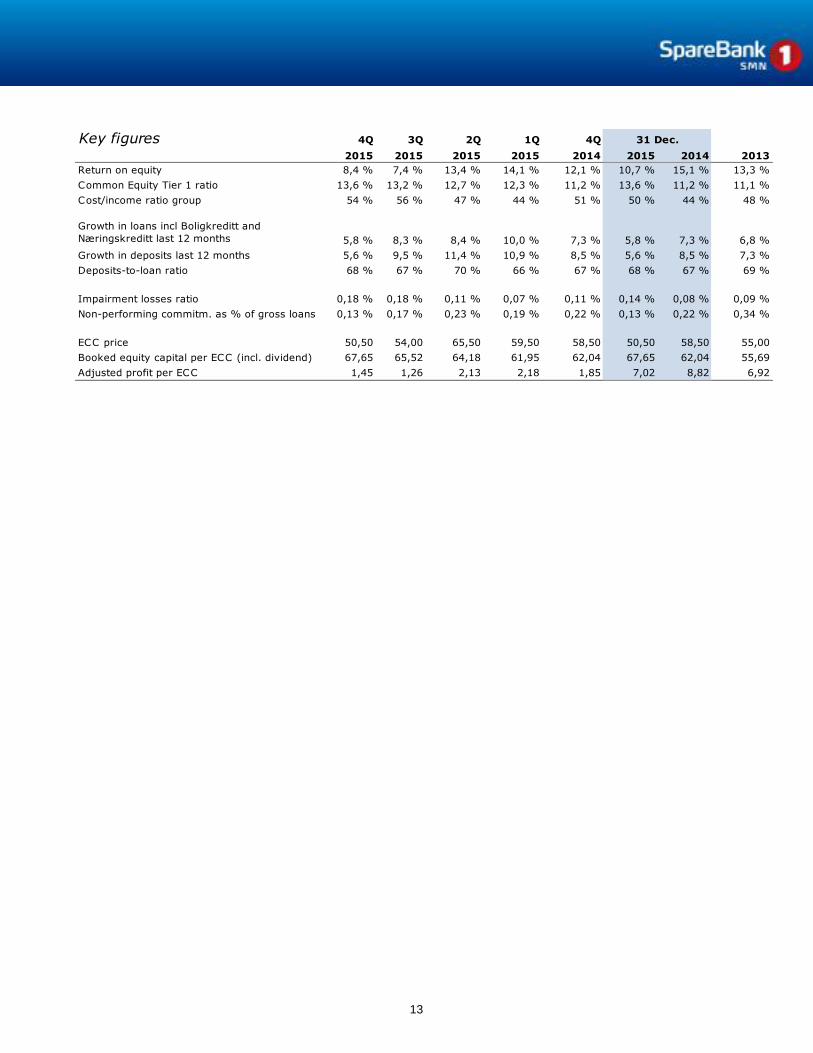
Key figures 4Q 3Q 2Q 1Q 4Q
2015 2015 2015 2015 2014 2015 2014 2013
Return on equity 8,4 % 7,4 % 13,4 % 14,1 % 12,1 % 10,7 % 15,1 % 13,3 %
Common Equity Tier 1 ratio 13,6 % 13,2 % 12,7 % 12,3 % 11,2 % 13,6 % 11,2 % 11,1 %
Cost/income ratio group 54 % 56 % 47 % 44 % 51 % 50 % 44 % 48 %
Growth in loans incl Boligkreditt and
Næringskreditt last 12 months 5,8 % 8,3 % 8,4 % 10,0 % 7,3 % 5,8 % 7,3 % 6,8 %
Growth in deposits last 12 months 5,6 % 9,5 % 11,4 % 10,9 % 8,5 % 5,6 % 8,5 % 7,3 %
Deposits-to-loan ratio 68 % 67 % 70 % 66 % 67 % 68 % 67 % 69 %
Impairment losses ratio 0,18 % 0,18 % 0,11 % 0,07 % 0,11 % 0,14 % 0,08 % 0,09 %
Non-performing commitm. as % of gross loans 0,13 % 0,17 % 0,23 % 0,19 % 0,22 % 0,13 % 0,22 % 0,34 %
ECC price 50,50 54,00 65,50 59,50 58,50 50,50 58,50 55,00
Booked equity capital per ECC (incl. dividend) 67,65 65,52 64,18 61,95 62,04 67,65 62,04 55,69
Adjusted profit per ECC 1,45 1,26 2,13 2,18 1,85 7,02 8,82 6,92
31 Dec.
14
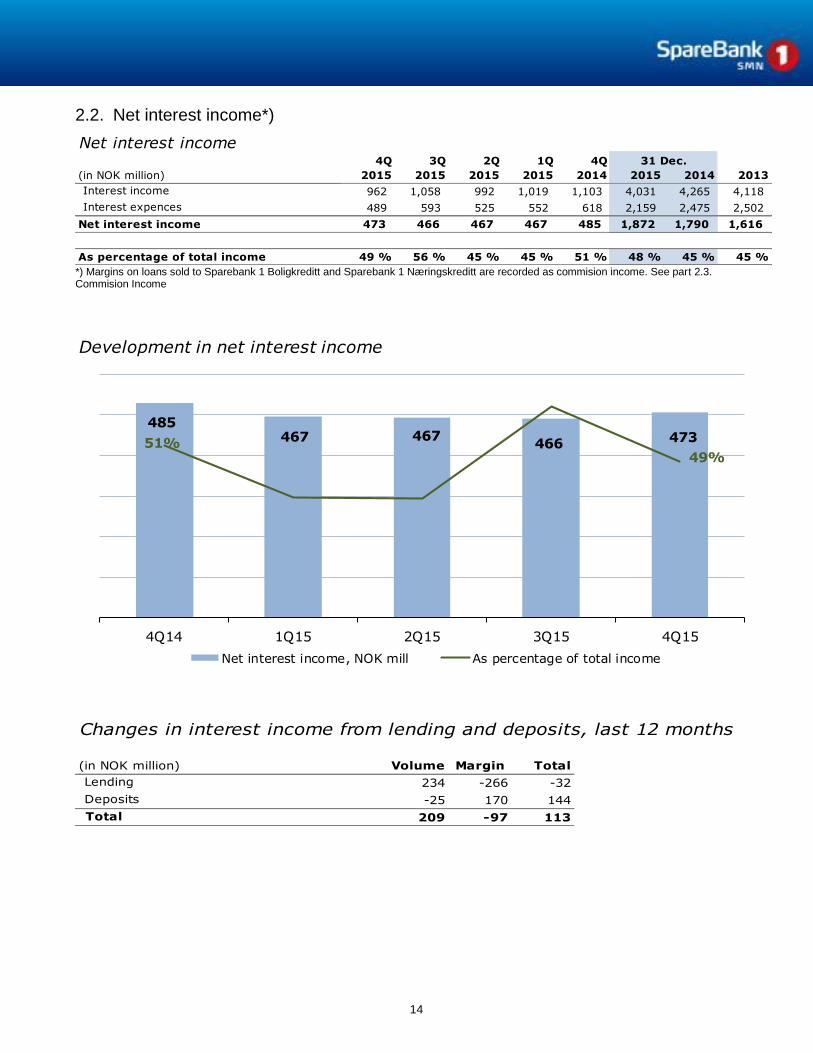
2.2. Net interest income*)
Net interest income4Q 3Q 2Q 1Q 4Q
(in NOK million) 2015 2015 2015 2015 2014 2015 2014 2013
Interest income 962 1,058 992 1,019 1,103 4,031 4,265 4,118
Interest expences 489 593 525 552 618 2,159 2,475 2,502
Net interest income 473 466 467 467 485 1,872 1,790 1,616
As percentage of total income 49 % 56 % 45 % 45 % 51 % 48 % 45 % 45 %
31 Dec.
*) Margins on loans sold to Sparebank 1 Boligkreditt and Sparebank 1 Næringskreditt are recorded as commision income. See part 2.3. Commision Income
485467 467
466 47351%49%
30.0 %
35.0 %
40.0 %
45.0 %
50.0 %
55.0 %
60.0 %
220
270
320
370
420
470
520
4Q14 1Q15 2Q15 3Q15 4Q15
Development in net interest income
Net interest income, NOK mill As percentage of total income
Changes in interest income from lending and deposits, last 12 months
(in NOK million) Volume Margin Total
Lending 234 -266 -32
Deposits -25 170 144
Total 209 -97 113

15
Changes in net interest income 31 Dec.
(in NOK million) 2015 Change 2014
Net interest income 1,872 82 1,790
Equity capital -4
Lending volume 234
Fees on lending -7
Deposit margin 170
SMN Finans 23
Deposit volume -25
Lending margin -266
Funding and liquidity buffer -43
Change 82
1,790
1,872
234
170
234 7
2543
266
Net Interest
Income
31
Dec.2014
Lending
volume
Deposit
margin
SMN Finans Equity
capital
Fees on
lending
Deposit
volume
Funding and
liquidity
buffer
Lending
margin
Net interest
income
31
Dec.2015
16
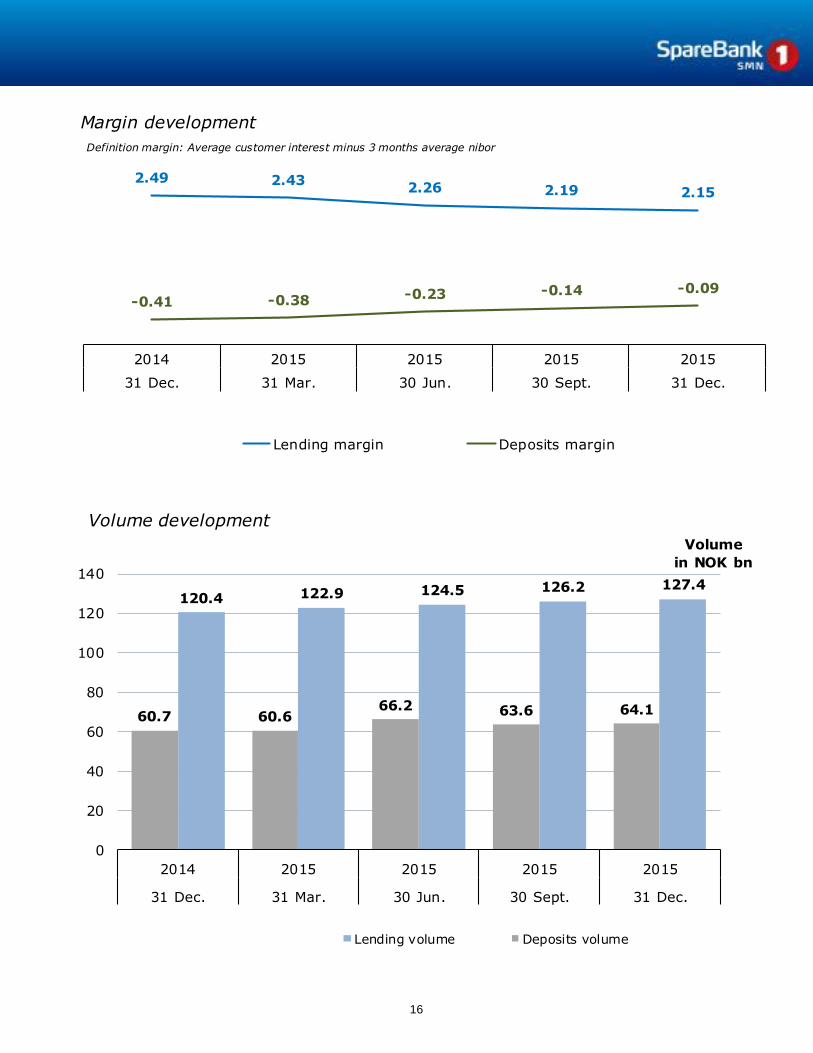
2.152.192.262.432.49
-0.09-0.14-0.23-0.38-0.41
20152015201520152014
31 Dec.30 Sept.30 Jun.31 Mar.31 Dec.
Margin development
Lending margin Deposits margin
Definition margin: Average customer interest minus 3 months average nibor
127.4126.2124.5122.9120.4
64.163.666.260.660.7
0
20
40
60
80
100
120
140
20152015201520152014
31 Dec.30 Sept.30 Jun.31 Mar.31 Dec.
Volume
in NOK bn
Volume development
Lending volume Deposits volume
17
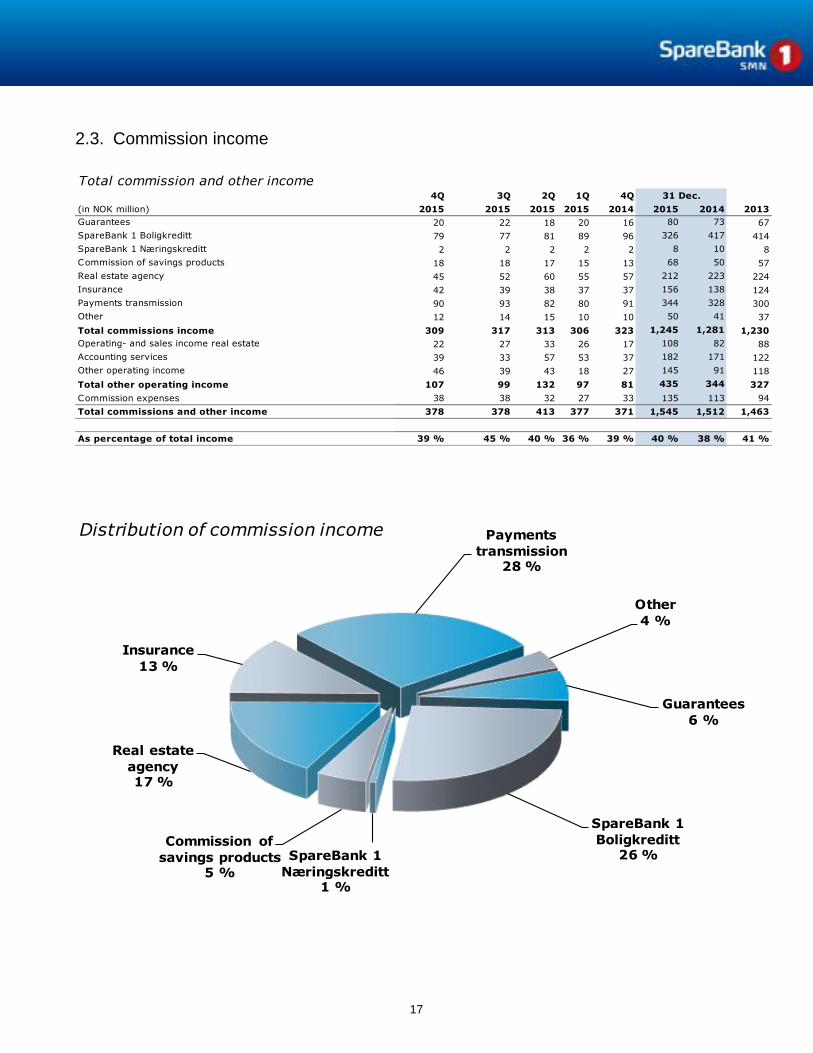
2.3. Commission income
Total commission and other income4Q 3Q 2Q 1Q 4Q
(in NOK million) 2015 2015 2015 2015 2014 2015 2014 2013
Guarantees 20 22 18 20 16 80 73 67
SpareBank 1 Boligkreditt 79 77 81 89 96 326 417 414
SpareBank 1 Næringskreditt 2 2 2 2 2 8 10 8
Commission of savings products 18 18 17 15 13 68 50 57
Real estate agency 45 52 60 55 57 212 223 224
Insurance 42 39 38 37 37 156 138 124
Payments transmission 90 93 82 80 91 344 328 300
Other 12 14 15 10 10 50 41 37
Total commissions income 309 317 313 306 323 1,245 1,281 1,230
Operating- and sales income real estate 22 27 33 26 17 108 82 88
Accounting services 39 33 57 53 37 182 171 122
Other operating income 46 39 43 18 27 145 91 118
Total other operating income 107 99 132 97 81 435 344 327
Commission expenses 38 38 32 27 33 135 113 94
Total commissions and other income 378 378 413 377 371 1,545 1,512 1,463
As percentage of total income 39 % 45 % 40 % 36 % 39 % 40 % 38 % 41 %
31 Dec.
Guarantees
6 %
SpareBank 1
Boligkreditt26 %SpareBank 1
Næringskreditt1 %
Commission of
savings products5 %
Real estate
agency17 %
Insurance
13 %
Payments
transmission 28 %
Other
4 %
Distribution of commission income

18
Change in commission and other income
31 Dec.
(in NOK million) 2015 Change 2014
Total 1,545 34 1,512
Real estate agency -11
Other operating income 55
Operating- and sales income real estate 26
Accounting services 10
Insurance 18
Commission of savings products 17
Commission expenses -22
Other 10
Payments transmission 16
Guarantees 7
SpareBank 1 Boligkreditt -91
SpareBank 1 Næringskreditt -2
Net return on financial investments
4Q 3Q 2Q 1Q 4Q
(in NOK million) 2015 2015 2015 2015 2014 2015 2014 2013
Income from investment in related companies 121 78 120 129 144 448 527 355
of which SpareBank 1 Gruppen AS 68 56 68 59 99 251 358 210
BN Bank ASA 11 -4 17 18 15 41 93 91
SpareBank 1 Boligkreditt AS 15 15 9 41 15 80 38 40
SpareBank 1 Næringskreditt AS 8 7 7 8 10 30 41 8
Sparebank 1 Kredittkort 5 6 6 4 2,2 21 2
Comp. owned by Sparebank 1 SMN Invest 14 0 13 0 13 27 31 14
Other 1) 2)0 0 0 -2 -10 -2 -34 -8
Capital gains/dividens, shares and ECCs 2)-17 8 61 10 -15 62 202 114
of which dividends 3 0 22 0 5 25 65 41
capital gains on shares -20 8 39 9 -20 37 137 64
capital gains on ECCs 0 0 0 0 0 0 0 9
Capital gains, bonds and derivatives -16 -116 32 11 -48 -90 -66 -40
Forex and fixed income business, Markets 20 18 16 48 11 102 57 73
Change in discount factor in fair value model for fixed interest loans -64 -64
Net return on financial investments 109 -13 165 198 91 459 720 502
As percentage of total income 11 % -2 % 16 % 19 % 10 % 12 % 18 % 14 %
1) These companies were essentially established to handle corporate exposures taken over from other entities
2) 1Q 2015 and earlier: Income from SpareBank 1 Markets (as related company) is included in Other
3) Including net gain/losses from SpareBank 1 SMN Invest AS, which manages parts og the Bank's share portfolio
31 Dec.
Change in net return on financial investments
31 Dec.
(in NOK million) 2015 Change 2014
Total 459 -261 720
Capital gains from bonds and derivatives -24
Forex and fixed income business, Markets 45
Capital gains/dividends on shares and ECC's -139
Change in discount factor in fair value model for fixed interest loans -64
Income from investment in related companies, incl inv held for sale -79

19
2.4. Operating expenses
Operating expenses4Q 3Q 2Q 1Q 4Q
(in NOK million) 2015 2015 2015 2015 2014 2015 2014 2013
Salary 203 202 222 206 206 833 786 737
Pension costs (defined benefit plan) 16 19 19 17 20 71 61 45
Employer's insurance contributions 3 4 4 3 0 14 14 14
Other personnel expenses 58 38 38 42 42 176 141 128
Total personnel expenses 280 264 283 267 267 1093 1002 923
EDP and telecommunication expenses 47 64 68 62 46 240 223 206
Postage and transportation services 6 5 5 6 6 22 25 29
Marketing 31 20 22 23 22 96 81 58
Operating exp. on properties and premises 25 26 26 23 24 100 93 118
Other external services 37 25 28 15 27 105 78 71
Other operating expenses 65 34 38 33 56 171 178 199
Depr./write-downs of fixed & intangible assets 25 28 25 25 29 104 109 118
Other expenses 235 203 213 186 212 838 787 799
Total operating expenses 515 466 496 454 479 1,931 1,789 1,721
Cost/income ratio 54 % 56 % 47 % 44 % 51 % 50 % 44 % 48 %
Cost/income ratio ex financial inv. 61 % 55 % 56 % 54 % 56 % 57 % 54 % 56 %
12-month cost growth* 7.5 % 9.6 % 11.9 % 2.8 % 3.0 % 7.9 % 3.9 % 4.1 %
* The increase in 12 month cost growth is effected by the consolidation of SpareBank 1 Markets as a subsidiary
31 Dec.
Change in operating expenses 31 Dec.
(in NOK million) 2015 Change 2014
Total 1,931 142 1,789
Total personnel expenses 91
Depr./write-downs of fixed & intangible assets 5-
EDP and telecommunication expenses 16
Other operating expenses 8-
Operating exp. on properties and premises 8
Other external services 27
Marketing 15
Postage and transportation services 3-

20
947
1,042 1,044
831
959
479 454496
466515
51 %
54 %
40 %
42 %
44 %
46 %
48 %
50 %
52 %
54 %
56 %
58 %
0
200
400
600
800
1,000
1,200
4Q14 1Q15 2Q15 3Q15 4Q15
NOK mill.
Cost/income ratio
Income Expenses Cost/income ratio *
* Total operating expences as a percentage of total operating income

21
786 793 757 753
645
159 177192 199
211
104
98108 148 178 1844129
3333 34
1328
2829 29
2011 2012 2013 2014 4Q 2015
Employees in employment
Parent bank EiendomsMegler 1 Midt-Norge AS
SpareBank 1 Markets SpareBank 1 Regnskapshuset SMN AS
SpareBank 1 Finans Midt-Norge AS Other
SpareBank 1 Markets has been a subsidiary of SpareBank 1 SMN since 1 April 2015. SpareBank 1 SMN’s capital market activities, including 32 FTEs, were transferred to SpareBank 1 Markets as part of the transaction. The bank is reorganised as from 1 January 2013. Further adjustments are made in 2014. Figures for person-years worked in 2013 and 2014 in the parent bank are therefore not comparable with historical figures.

22
3. Loans to customers
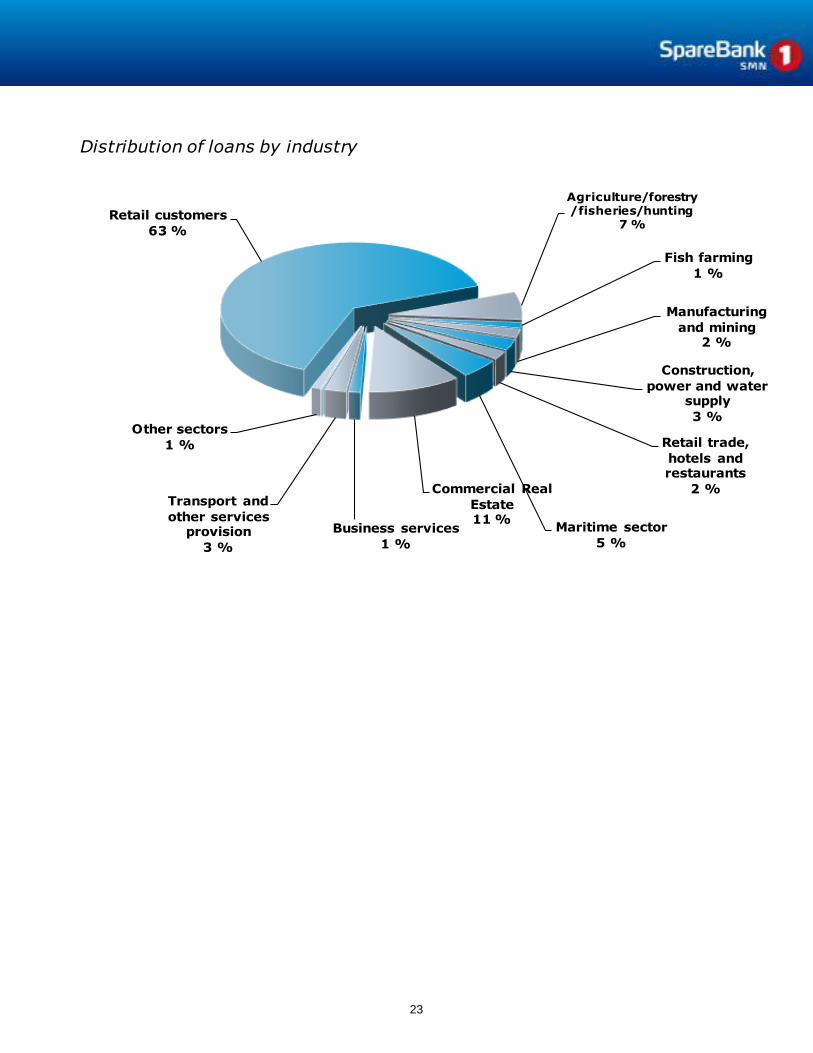
3.1. Distribution of loans by industry
Distribution of loans by industry31 Dec. 30 Sept. 30 Jun. 31 Mar. 31 Dec. 31 Dec.
(in NOK million) 2015 2015 2015 2015 2014 2013
Agriculture/forestry/fisheries/hunting 8,674 8,313 8,152 7,694 7,158 6,380
Fish farming 1,807 1,581 1,798 1,322 1,367 2,468
Manufacturing and mining 2,675 2,517 2,333 2,190 2,330 2,152
Construction, power and water supply 3,598 3,707 4,247 4,048 3,717 3,217
Retail trade, hotels and restaurants 2,666 2,940 2,856 2,937 2,671 2,447
Maritime sector 6,066 6,097 6,024 6,017 5,638 5,403
Commercial Real Estate 14,346 14,142 14,167 14,375 14,075 12,152
Business services 1,777 1,698 1,681 3,594 3,681 3,878
Transport and other services provision 3,355 3,509 3,408 3,344 3,141 2,750
Public administration 211 225 208 286 300 424
Other sectors 1,477 2,587 2,342 1,969 2,270 2,421
Gross loans in corporate market 46,653 47,315 47,215 47,776 46,348 43,692
Retail customers 80,725 78,864 77,304 75,157 74,087 68,591
Gross loans incl. Boligkr. and Næringskr. 127,378 126,180 124,519 122,933 120,435 112,283
- Adv. of this Boligkreditt 31,944 29,894 28,965 29,165 28,393 30,514
- Adv. of this Næringskreditt 1,460 1,369 1,375 1,457 1,463 1,221
Gross loans in balance sheet 93,974 94,917 94,179 92,311 90,578 80,548
Share of loans, corporate market 37 % 37 % 38 % 39 % 38 % 39 %
Share of loans, retail market 63 % 63 % 62 % 61 % 62 % 61 %
23
Agriculture/forestry/fisheries/hunting
7 %
Fish farming
1 %
Manufacturing
and mining2 %
Construction,
power and water supply
3 %
Retail trade,
hotels and restaurants
2 %
Maritime sector
5 %
Commercial Real
Estate11 %
Business services
1 %
Transport and
other services provision
3 %
Other sectors
1 %
Retail customers
63 %
Distribution of loans by industry

24
3.2. Risk profile and write-downs
27.8
33.736.0
14.5
11.1 12.0
7.2
3.81.7
0.2 0.5
A B C D E F G H I J K
NOK billion
Actual risk profile, Exposure At Default
18.7 %
22.7 %
24.2 %
9.8 %
7.5 %8.1 %
4.9 %
2.6 %1.2 %
0.1 %0.3 %
16.1 %
21.9 %22.6 %
10.9 %9.9 %
9.1 %
4.9 %
3.1 %
1.2 %
0.1 % 0.2 %
A B C D E F G H I J K
Actual risk profile, Exposure At DefaultPer cent
4Q15 4Q14

25
Risk classification in SpareBank 1 SMN
Risk class Low High
A 0.01 0.10 AAA - A3
B 0.10 0.25 Baa1 - Baa2
C 0.25 0.50 Baa3
D 0.50 0.75 Ba1
E 0.75 1.25 Ba2
F 1.25 2.50
G 2.50 5.00 Ba2 - B1
H 5.00 10.00 B1 - B2
I 10.00 99.99 B3 - caa3
J Default
K Written down
Risk class A represents the lowest risk and class K the highest risk.
* Probability of default
PD* in percent Corresponding
ratingclass at
Moody's
Write-downs on loans and guarantees
4Q 3Q 2Q 1Q 4Q
(in NOK million) 2015 2015 2015 2015 2014 2015 2014 2013
Increase in and new individual write-downs -8 23 9 -13 -10 11 -1 29
Reassessments and recoveries -14 -3 -24 -35 -44 -76 -90 -71
Total individual write-downs 6 26 33 22 34 87 89 101
Change in group write-downs on loans 51 30 1 0 0 82 0 0
Write-downs on loans and guarantees 56 56 34 22 34 169 89 101
As % of gross loans incl. Boligkreditt 0.18 % 0.18 % 0.11 % 0.07 % 0.11 % 0.14 % 0.08 % 0.09 %
31 Dec.
Loss on loans by segment4Q 3Q 2Q 1Q 4Q
(in NOK million) 2015 2015 2015 2015 2014 2015 2014 2013
Retail 5 3 1 3 -2 11 6 6
SME * 5
Corporate** 1 21 32 17 34 71 77 71
SMN Finans and other 0 2 1 2 2 6 6 19
Collective write downs 51 30 1 0 0 82 0 0
Total loss on loans 56 56 34 22 34 169 89 101
* As from 1 January 2014 the bank's SME portfolio is split up and assigned to Retail Banking and Corporate Banking respectively
** The increase in collective write downs related to the Corporate portfolio includes NOK 30 million in 3Q and NOK 50 million in 4Q
31 Dec.

26
-23 1 3 5
34
17
32
21
1
2
2
1
2
30
51
4Q14 1Q15 2Q15 3Q15 4Q15
Retail Corporate SMN Finans and other Collective write downs
Loss on loans by
segment
Individual and collective write-downs4Q 3Q 2Q 1Q 4Q
(in NOK million) 2015 2015 2015 2015 2014 2015 2014 2013
Individual write-downs to cover loss on loans,
guarantees at start of period 191 168 160 172 182 172 173 144
Write downs of loans previously subject to
individual write down 17 0 0 4 -5 22 2 15
Reversal of previous years' write downs -14 -15 -14 -3 1 -46 -22 -18
Increase in write downs of commitments not
previously subject to individual write down -5 41 46 20 25 101 84 72
Confirmed losses in the period on loans, guaran-
tees etc., prev. subject to ind. write down -7 -3 -24 -33 -32 -67 -66 -40
Individual write downs to cover loss 183 191 168 160 172 183 172 173
Collective write downs to cover loss on loans,
guarantees at start of period 326 296 295 295 295 295 295 295
Period’s collective write down to cover loss on
loans, guarantees etc. 51 30 1 0 0 82 0 0
Collective write downs to cover loss on loans,
guarantees 376 326 296 295 295 376 295 295
31 Dec.
27
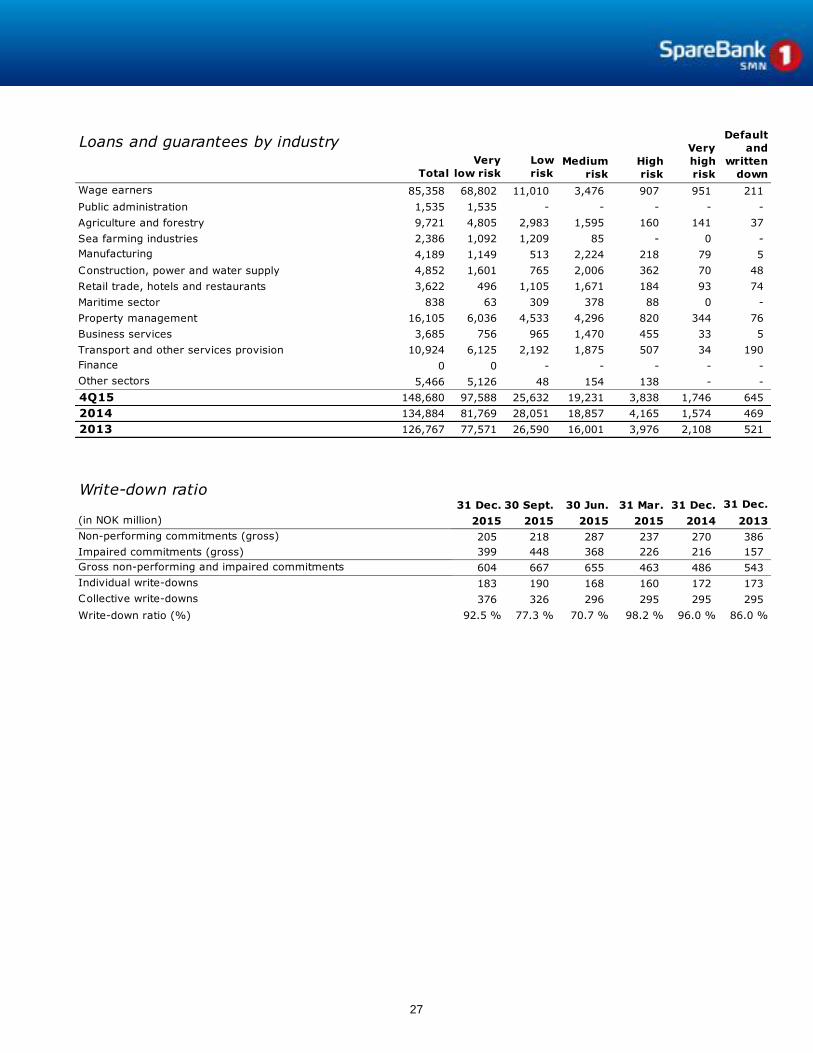
Loans and guarantees by industry
Total
Very
low risk
Low
risk
Wage earners 85,358 68,802 11,010 3,476 907 951 211
Public administration 1,535 1,535 - - - - -
Agriculture and forestry 9,721 4,805 2,983 1,595 160 141 37
Sea farming industries 2,386 1,092 1,209 85 - 0 -
Manufacturing 4,189 1,149 513 2,224 218 79 5
Construction, power and water supply 4,852 1,601 765 2,006 362 70 48
Retail trade, hotels and restaurants 3,622 496 1,105 1,671 184 93 74
Maritime sector 838 63 309 378 88 0 -
Property management 16,105 6,036 4,533 4,296 820 344 76
Business services 3,685 756 965 1,470 455 33 5
Transport and other services provision 10,924 6,125 2,192 1,875 507 34 190
Finance 0 0 - - - - -
Other sectors 5,466 5,126 48 154 138 - -
4Q15 148,680 97,588 25,632 19,231 3,838 1,746 645
2014 134,884 81,769 28,051 18,857 4,165 1,574 469
2013 126,767 77,571 26,590 16,001 3,976 2,108 521
Default
and
written
down
Medium
risk
High
risk
Very
high
risk
Write-down ratio31 Dec. 30 Sept. 30 Jun. 31 Mar. 31 Dec.
(in NOK million) 2015 2015 2015 2015 2014 2013
Non-performing commitments (gross) 205 218 287 237 270 386
Impaired commitments (gross) 399 448 368 226 216 157
Gross non-performing and impaired commitments 604 667 655 463 486 543
Individual write-downs 183 190 168 160 172 173
Collective write-downs 376 326 296 295 295 295
Write-down ratio (%) 92.5 % 77.3 % 70.7 % 98.2 % 96.0 % 86.0 %
31 Dec.

28
133149
161141
134
20152015201520152014
4Q3Q2Q1Q4Q
Default in excess of 90 days
NOK million
Retail > 90 d
3835
848390
20152015201520152014
4Q3Q2Q1Q4Q
Default in excess of 90 daysNOK million
Corporates* > 90 d

29
4. Capital adequacy
The Ministry of Finance adopted on 22 August 2014 amendments to regulations on capital requirements taking effect on 30 September 2014. The amendments bring Norwegian legislation into line with the EU’s new capital requirements framework (CRR/CRD IV). This framework is for the present not incorporated into the EEA agreement, although its most important provisions have been incorporated in the Financial Institutions Act and the Securities Trading Act. The adjusted legislation entered into force on 1 July 2013, and requires a gradual increase in minimum requirements on Common Equity Tier 1 (CET1) capital in the period to 1 July 2016. As of 31 December 2015 the capital conservation buffer requirement is 2.5 per cent, the systemic risk requirement is 3.0 per cent and countercyclical buffer is 1.0 per cent. These requirements are additional to the requirement of 4.5 per cent CET1 capital, so that the overall minimum requirement on CET1 capital is 11.0 per cent. The countercyclical buffer is announced to increase to 1.5 per cent with effect from 30 June 2016. SpareBank 1 SMN utilises the Internal Rating Based Approach (IRB) for credit risk. Use of IRB imposes wide-ranging requirements on the bank’s organisational set-up, competence, risk models and risk management systems. As from 31 March 2015 the bank has received permission to apply the Advanced IRB Approach to those corporate portfolios that were previously reported under the Basic Indicator Approach. SpareBank 1 SMN has reviewed the intention for the bond portfolios and on that basis reclassified certain portfolios from trading to banking in the first quarter of 2015. This is reflected in reduced debt risk and increased credit risk under the standardised approach. In connection with changed requirements on conditions governing hybrid capital, hybrid capital not meeting the new requirements over time will not be eligible as other core capital. The bonds will be subject to a stepwise reduction of 30 per cent in 2015 and 10 per cent thereafter. As at 31 December 2015 SpareBank 1 SMN held hybrid capital worth NOK 450 m that will be subject to stepwise reduction. Finanstilsynet may require the hybrid capital to be written down in proportion to equity capital if the bank’s CET1 capital ratio falls below 5.125 per cent. The parent bank calculates capital charges against operational risk using the standardised approach. In the case of subsidiaries, the basic indicator approach is applied. Capital adequacy figures are stated in accordance with the new reporting requirements as from 30 September 2014. Comparatives have not been restated. SpareBank 1 SMN's methods for calculating the minimum regulatory capital requirements are summarized below:
Type of risk Portfolio Regulatory method
Credit risk States - parent bank Standard method
Institutions - parent bank Standard method
Housing cooperatives, clubs and associations - parent bank Standard method
Enterprises - parent bank Advanced IRB approach
Mass market - parent bank IRB - mass market (advanced)
Sparebank 1 Finans Midt-Norge AS Standard method
SpareBank 1 Invest Standard method
SpareBank 1 Allegro Kapitalforvaltning AS Standard method
Mass market - SpareBank 1 Boligkreditt AS IRB- mass market (advanced)
Enterprises - SpareBank 1 Næringskreditt AS Standard method
Enterprises - BN Bank AS Advanced IRB approach
Mass market - BN Bank AS IRB - mass market (advanced)
Market risk Equity risk - parent bank Standard method
Debt risk - parent bank Standard method
Currency risk - parent bank Standard method
Subsidiaries and part-ow ned companies Standard method
Operational risk SpareBank 1 SMN (parent bank) Standardised approach
Subsidiaries and part-ow ned companies Basic Indicator Approach

30
Capital Adequacy31 Dec. 30 Sept. 30 Jun. 31 Mar. 31 Dec. 31 Dec.
(in NOK million) 2015 2015 2015 2015 2014 2013
Equity capital certificates 2,597 2,597 2,597 2,597 2,597 2,597
- Own holding of ECCs -21 0 0 0 0 0
Premium fund 895 895 895 895 895 895
Dividend equalisation fund 3,790 3,122 3,122 3,122 3,122 2,496
Savings bank's reserve 4,105 3,619 3,619 3,619 3,619 3,276
Recommended dividends 292 0 0 0 292 227
Provision for gifts 40 0 0 0 160 124
Unrealised gains reserve 290 148 148 148 148 206
Other equity and minority interest 1,597 1,660 1,639 1,622 1,620 1,354
Minority interests 318 295 301 78 72 67
Net profit 0 1,119 871 441 0 0
Total book equity 13,904 13,455 13,191 12,521 12,524 11,242
Deferred taxes, goodwill and other intangible assets -662 -679 -664 -569 -566 -582
Part of reserve for unrealised gains, associated companies 264 179 120 120 120 98
Deduction for allocated dividends and gifts -332 0 0 0 -452 -361
50 % deduction for subordinated capital in other financial institutions -106
50 % deduction for expected losses on IRB, net of write-downs -214
50 % capital adequacy reserve -595
Minority interests recognised in other equity capital -318 -295 -301 -78 -72
Minority interests eligible for inclusion in CET1 capital 132 49 47 36 35
Surplus financing of pension obligations -43 0 0 0 0 -107
Net profit 0 -1,119 -871 -441 0 0
Year-to-date profit included in core capital (73 per cent pre tax of group profit) 0 817 636 322 0 0
Value adjustments due to requirements for prudent valuation -55 -49 -43 -44 -45
Positive value of adjusted expected loss under IRB Approach -239 -277 -318 -381 -419
Direct, indirect and synthetic investments in financial sector companies -458 -428 -355 -477 -451
Total common equity Tier one 12,192 11,652 11,443 11,008 10,674 9,374
Hybrid capital, core capital 1,310 1,311 1,217 1,217 1,716 1,615
Hybrid capital covered by transitional provisions 495 496 491 497
Direct, indirect and synthetic investments in financial sector companies -9 -9 -9 -9 -9
Total core capital 13,988 13,451 13,142 12,713 12,382 10,989
Supplementary capital in excess of core capital
Fund bonds, hybrid capital in excess of 15 % 31
Subordinated capital 1,647 1,692 1,692 1,692 2,598 2,313
Subordinated capital covered by transitional provisions 786 786 786 786 0
50 % deduction for subordinated capital in other financial institutions -106
50 % deduction for expected losses on IRB, net of write-downs -214
50 % capital adequacy reserve -595
Direct, indirect and synthetic investments in financial sector companies -43 -43 -43 -43 -43
Total supplementary capital 2,390 2,435 2,435 2,435 2,555 1,428
Net subordinated capital 16,378 15,886 15,577 15,147 14,937 12,417

31
Minimum requirements subordinated capital31 Dec. 30 Sept. 30 Jun. 31 Mar. 31 Dec. 31 Dec.
(in NOK million) 2015 2015 2015 2015 2014 2013
Involvement with spesialised enterprises 1,213 1,262 1,391 1,506 1,887 1,573
Other corporations exposure 1,105 1,058 965 1,038 1,371 1,479
Mass market exposure, SMBs 167 186 185 149 159 74
Mass market exposure, property 1,557 1,551 1,514 1,447 1,280 628
Other retail exposure 40 15 13 54 51 33
Equity investments, IRB 0 0 0 0 0 0
Total credit risk IRB 4,082 4,073 4,068 4,194 4,748 3,787
Debt risk 64 94 200 200 397 224
Equity risk 10 10 8 2 1 10
Currency risk 0 0 0 0 0 0
Operational risk 457 457 457 452 416 398
Exposures calculated using the standardised approach 1,805 1,827 1,926 2,025 1,971 2,151
Deductions 0 0 -119
CVA 106 92 71 97 92
Transitional arrangements 634 533 471 163 0 316
Minimum requirements subordinated capital 7,157 7,087 7,201 7,134 7,625 6,767
Risk Weighted Assets (RWA) 89,465 88,586 90,010 89,171 95,317 84,591
Minimum requirement on CET1 capital, 4.5 per cent 4,026 3,986 4,050 4,013 4,289
Capital conservation buffer, 2,5 per cent 2,237 2,215 2,250 2,229 2,383
Systemic risk buffer, 3.0 per cent 2,684 2,658 2,700 2,675 2,860
Countercyclical buffer, 1.0 per cent 895 886 900
Available CET1 capital after buffer requirements 2,351 1,908 1,542 2,091 1,143
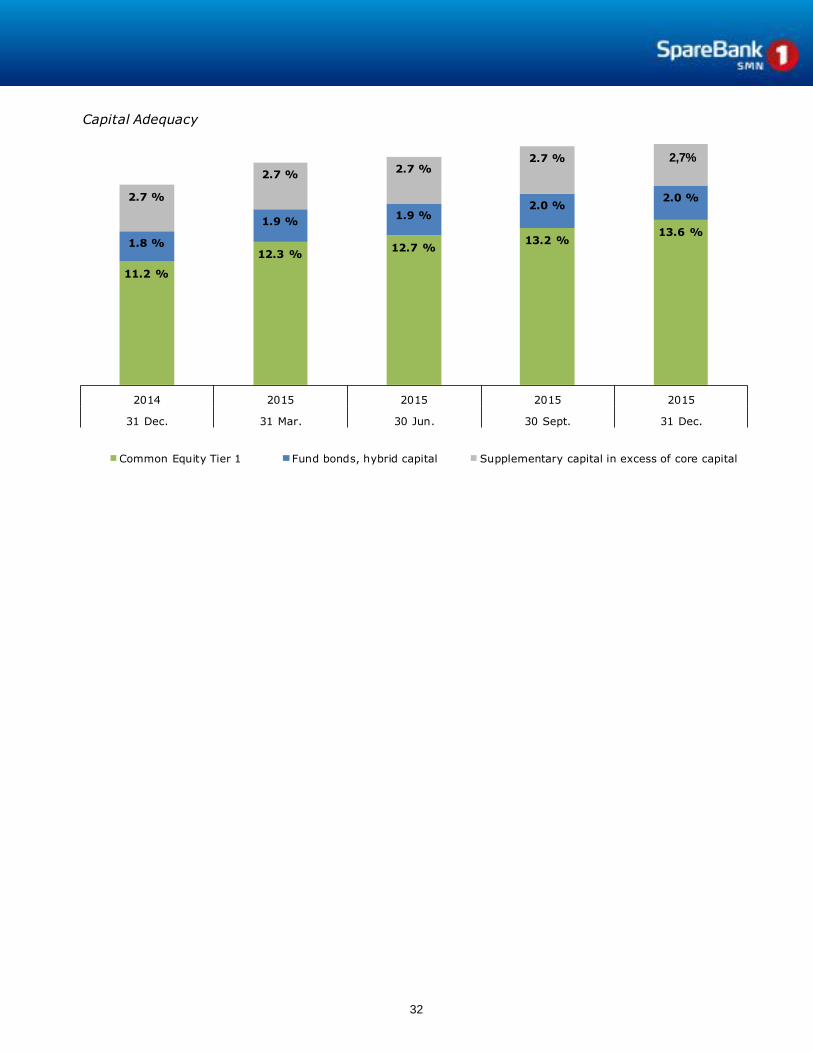
Common equity Tier 1 13.6 % 13.2 % 12.7 % 12.3 % 11.2 % 11.1 %
Core capital ratio 15.6 % 15.2 % 14.6 % 14.3 % 13.0 % 13.0 %
Capital adequacy ratio 18.3 % 17.9 % 17.3 % 17.0 % 15.7 % 14.7 %
Leverage ratio 6.7 % 6.7 % 6.5 % 6.3 % 6.0 %
15.7 %
17.0 % 17.3 %17.9 %
13.0 %
14.3 % 14.6 %15.2 % 15.6 %
11.2 %
12.3 %12.7 %
13.2 %13.6 %
2014 2015 2015 2015 2015
31 Dec. 31 Mar. 30 Jun. 30 Sept. 31 Dec.
Capital Adequacy
Capital adequacy ratio Core capital ratio Common equity Tier 1
18,3%
32
11.2 %
12.3 %12.7 %
13.2 %13.6 %
1.8 %
1.9 %1.9 %
2.0 %2.0 %2.7 %
2.7 %2.7 %
2.7 %
2014 2015 2015 2015 2015
31 Dec. 31 Mar. 30 Jun. 30 Sept. 31 Dec.
Capital Adequacy
Common Equity Tier 1 Fund bonds, hybrid capital Supplementary capital in excess of core capital
2,7%

33
11,652
12,195
287
165 2829
6038
53
11,300
11,400
11,500
11,600
11,700
11,800
11,900
12,000
12,100
12,200
3Q15 Net profit OCI Dividends Threshold
exemptions,
holdings
Minority EL Other 4Q15
Quarterly changes in Common equity Tier 1

34
5. Funding
5.1 5.5
10.1
6.3
10.5
0
2
4
6
8
10
12
2016 2017 2018 2019 2020 ->
NOK bill.
Funding maturity dates
1.1
1.9
0.0
2.1
2.7
0.9
1.2
0.8
0
1
1
2
2
3
3
Q1 16 Q2 16 Q3 16 Q4 16 Q1 17 Q2 17 Q3 17 Q4 17
NOK bill.
Funding maturity dates over the next eight quarters

35
Capital markets funding31 Dec. 30 Sept. 30 Jun. 31 Mar. 31 Dec. 31 Dec.
(in NOK million) 2015 2015 2015 2015 2014 2013
NOK Bonds 17,139 17,774 17,745 16,588 18,263 18,953
Curr Bonds 17,898 15,418 14,286 12,873 13,611 11,451
NOK CD's - 403 1,155 2,305 820 2,750
Curr CD's 155 - - - -
Interbank 8,155 8,324 8,684 7,595 7,572 5,159
Gov. Swap arrangement - - - - - 1,220
Perp. Sub. Loan capital 299 299 299 1,746 307 304
Hybrid equity 1,445 1,446 1,441 1,447 1,449 1,431
Subordinated loan capital 1,719 1,707 1,641 1,659 1,607 1,569
Other liabilities 5,996 6,034 5,199 6,716 7,512 5,830
Total 52,807 51,406 50,449 50,929 51,141 48,667
NOK Bonds 32 %
Curr Bonds 34 %
Curr CD's 0 %
Interbank 15 %
Perp. Sub. Loan capital 1 %
Hybrid equity 3 %
Subordinated loan capital 3 %
Other liabilities11 %

36
6. Financial results
Financial results
4Q 3Q 2Q 1Q 4Q
2015 2015 2015 2015 2014 2015 2014 2013
Interest income 962 1,058 992 1,019 1,103 4,031 4,265 4,118
Interest expenses 489 593 525 552 618 2,159 2,475 2,502
Net interest 473 466 467 467 485 1,872 1,790 1,616
Commission income 309 317 313 306 323 1,245 1,281 1,230
Commission expenses 38 38 32 27 33 135 113 94
Other operating income 107 99 132 97 81 435 344 327
Commission income and other income 378 378 413 377 371 1,545 1,512 1,463
Dividends 3 0 22 0 5 25 65 41
Income from investment in related companies 121 78 120 129 144 448 527 355
Net return on financial investments -15 -91 23 69 -58 -14 128 106
Net return on financial investments 109 -13 165 198 91 459 720 502
Total income 959 831 1,044 1,042 947 3,876 4,021 3,580
Staff costs 280 264 283 267 267 1,093 1,002 923
Administration costs 157 137 147 126 129 568 500 447
Other operating expenses 78 65 66 61 83 270 287 352
Total operating expenses 515 466 496 454 479 1,931 1,789 1,722
Result before losses 444 364 548 588 467 1,945 2,232 1,859
Loss on loans, guarantees etc. 56 56 35 22 34 169 89 101
Result before tax 388 309 513 567 434 1,776 2,143 1,758
Tax charge 100 61 83 126 60 370 362 388
Results investments held for sale, after tax 0 0 0 0 0 -1 0 30
Net profit 287 248 430 441 375 1,406 1,782 1,400
Majority share 291 253 427 439 372 1,410 1,772 1,390
Minority interest -4 -5 3 2 2 -4 10 10
31 Dec.
(in NOK million)

37
Balance sheet31 Dec. 30 Sept. 30 Jun. 31 Mar. 31 Dec. 31 Dec.
2015 2015 2015 2015 2014 2013
Cash and receivables from central banks 3,270 1,252 3,895 568 4,676 4,795
Deposits with and loans to credit institutions 2,407 2,807 2,520 1,952 1,289 1,189
Gross loans to customers before write-down 93,974 94,917 94,179 92,311 90,578 80,548
- Specified write-downs -183 -191 -168 -160 -172 -173
- Write-downs by loan category -376 -326 -296 -295 -295 -295
Net loans to and receivables from customers 93,415 94,400 93,715 91,855 90,112 80,080
Fixed-income CDs and bonds at fair value 15,752 14,430 15,082 13,954 14,177 16,937
Derivatives 7,524 7,513 5,851 7,340 7,877 3,780
Shares, units and other equity interests 1,485 1,221 1,346 700 708 1,016
Investment in related companies 5,522 5,189 5,024 5,185 5,129 4,624
Investments held for sale 16 15 15 16 45 113
Goodwill 528 528 529 529 526 495
Other assets 1,996 1,882 2,912 1,587 1,509 2,329
Assets 131,914 129,237 130,888 123,687 126,047 115,360
Deposits from credit institutions 8,155 8,324 8,684 7,598 9,123 6,581
Deposits from and debt to customers 64,090 63,620 66,186 60,589 60,680 55,927
Debt created by issue of securities 35,154 33,557 33,146 31,971 33,001 34,086
Derivatives 5,414 5,486 4,610 6,096 6,252 2,720
Other liabilities 1,734 1,342 1,690 1,495 1,095 1,485
Investments held for sale 0 0 0 0 0 0
Subordinated loan capital 3,463 3,453 3,380 3,415 3,371 3,319
Total liabilities 118,010 115,782 117,697 111,165 113,523 104,118
Equity capital certificate 2,597 2,597 2,597 2,597 2,597 2,597
Own holding of ECCs -21 0 0 0 0 0
Premium fund 895 895 895 895 895 895
Dividend equalisation fund 3,790 3,122 3,122 3,122 3,122 2,496
Recommended dividends 292 0 0 0 292 227
Provision for gifts 40 0 0 0 160 124
Savings bank’s reserve 4,105 3,619 3,619 3,619 3,619 3,276
Unrealised gains reserve 290 148 148 148 148 206
Other equity capital 1,597 1,660 1,639 1,622 1,620 1,354
Result of the period 0 1,119 871 441 0 0
Minority interests 318 295 301 78 72 67
Total equity capital 13,904 13,455 13,191 12,521 12,524 11,242
Total liabilities and equity 131,914 129,237 130,888 123,687 126,047 115,360
(in NOK million)
The Group has changed its presentation of accrued interest as from the first quarter of 2015. Accrued interest is now presented together with the underlying financial instrument. It was previously presented as other assets and other liabilities. Historical figures for 2014 and 2013 are similarly restated.

38
Key figures 4Q 3Q 2Q 1Q 4Q
2015 2015 2015 2015 2014 2015 2014 2013
Return on equity 8,4 % 7,4 % 13,4 % 14,1 % 12,1 % 10,7 % 15,1 % 13,3 %
Cost/income ratio group 54 % 56 % 47 % 44 % 51 % 50 % 44 % 48 %
Cost/income ratio group, ex. financial inv. 61 % 55 % 56 % 54 % 56 % 57 % 54 % 56 %
12-month cost growth 7,5 % 9,6 % 11,9 % 2,8 % 3,0 % 7,9 % 3,9 % 4,1 %
Gross loans to customers* 127.378 126.180 124.519 122.933 120.435 127.378 120.435 112.283
Growth in loans last 12 months* 5,8 % 8,3 % 8,4 % 10,0 % 7,3 % 5,8 % 7,3 % 6,8 %
Growth in loans this period* 0,9 % 1,3 % 1,3 % 2,1 % 3,4 % 5,8 % 7,3 % 6,8 %
Deposits from customers 64.090 63.620 66.186 60.589 60.680 64.090 60.680 55.927
Growth in deposits last 12 months 5,6 % 9,5 % 11,4 % 10,9 % 8,5 % 5,6 % 8,5 % 7,3 %
Growth in deposits this period 0,7 % -3,9 % 9,2 % -0,2 % 4,5 % 5,6 % 8,5 % 7,3 %
Ordinary lending financed by ordinary deposits 68 % 67 % 70 % 66 % 67 % 68 % 67 % 69 %
Total assets 131.914 129.237 130.888 123.687 126.047 131.914 126.047 115.360
Average total assets (quarterly) 130.575 130.063 127.288 124.867 121.620 128.355 117.794 111.843
Employees in employment group 1.208 1.228 1.227 1.157 1.192 1.208 1.192 1.159
Employees in employment parent bank 645 663 673 716 753 645 753 757
Employees in employment subsidiares 563 565 554 441 439 563 439 402
Number of branches 49 49 49 49 49 49 49 50
Lending margin 2,15 2,19 2,26 2,43 2,49 2,26 2,57 2,58
Deposit margin (0,09) (0,14) (0,23) (0,38) (0,41) (0,21) (0,48) (0,51)
Net other operating income of total income 39 % 45 % 40 % 36 % 39 % 40 % 38 % 41 %
Common Equity Tier 1 ratio 13,6 % 13,2 % 12,7 % 12,3 % 11,2 % 13,6 % 11,2 % 11,1 %
Core capital ratio 15,6 % 15,2 % 14,6 % 14,3 % 13,0 % 15,6 % 13,0 % 13,0 %
Capital adequacy ratio 18,3 % 17,9 % 17,3 % 17,0 % 15,7 % 18,3 % 15,7 % 14,7 %
Total core capital 13.988 13.451 13.142 12.713 12.382 13.988 12.382 10.989
Net subordinated capital 16.378 15.886 15.577 15.147 14.937 16.378 14.937 12.417
Impairment losses ratio 0,18 % 0,18 % 0,11 % 0,07 % 0,11 % 0,14 % 0,08 % 0,09 %
Non-performing commitm. as % of gross loans 0,13 % 0,17 % 0,23 % 0,19 % 0,22 % 0,13 % 0,22 % 0,34 %
Other doubtfull commitm. as % of gross loans 0,30 % 0,36 % 0,30 % 0,18 % 0,18 % 0,30 % 0,18 % 0,14 %
ECC price 50,50 54,00 65,50 59,50 58,50 50,50 58,50 55,00
Number of certificates issued, millions 129,83 129,83 129,83 129,83 129,83 129,83 129,83 129,83
Booked equity capital per ECC (incl. dividend) 67,65 65,52 64,18 61,95 62,04 67,65 62,04 55,69
Adjusted profit per ECC 1,45 1,26 2,13 2,18 1,85 7,02 8,82 6,92
P/E per ECC 8,71 10,72 7,70 6,81 7,89 7,19 6,63 7,95
P/B equity capital 0,75 0,82 1,02 0,96 0,94 0,75 0,94 0,99
* Gross loans to customers includes Sparebank1 Boligkreditt and Sparebank 1 Næringskreditt
31 Dec.

39
7. Segment Information
For the subsidiaries, the figures refer to the respective company accounts, while for joint ventures incorporated by the equity method the Group’s profit share is stated, after tax, as well as book value of the investment at group level. The segment SB1 Markets comprises the subsidiary SpareBank 1 Markets as from the second quarter of 2015. SpareBank 1 Markets became a subsidiary on 1 April 2015 when SpareBank 1 SMN integrated its markets activity into SpareBank 1 Markets and at the same time increased its holding to 73.3 per cent. Consequently, the result as of 31 December 2015 is the result of second to fourth quarter. The stake was increased to 73.5 per cent in the fourth quarter as a result of a stock issue. In the reporting of the first quarter of 2015 and previously, the segment Markets comprised SpareBank 1 SMN's own markets activity in the parent bank. The result for the first quarter of 2015 is from the second quarter moved to the column “Uncollated”. For a further description of the transaction involving SpareBank 1 Markets, see note 2 - critical estimates and assessment concerning the use of accounting principles – in the Quarterly report. The Group has changed its presentation of accrued interest as from the first quarter of 2015. Accrued interest is now presented together with the underlying financial instrument. It was previously presented as other assets and other liabilities. Historical figures for 2014 and 2013 are similarly restated. As of 1 January 2014 the bank's SME portfolio was split up and assigned to Retail Banking and Corporate Banking respectively. Limited companies are transferred to Corporate Banking. Sole proprietorships, agricultural customers and associations etc are transferred to Retail Banking. Historical data have not been reworked owing to the difficulty of reconstructing such data at a sufficiently precise level. In the segment information, data for Retail customers for 2013 are exclusive sole proprietorships, agricultural customers and associations. Historical data for Corporate customers are the former Large Corporates. The SME portfolio is treated as a separate business line in figures for 2013.
7.1. Extract from income statement
Group (in NOK million) 31 Dec.2015
Retail
Market
Corporate
Market
SpareBank
1 Markets
Eiendoms
Megler 1
Midt-
Norge
SpareBank 1
Finans Midt-
Norge AS
SpareBank 1
Regnskapshu
set SMN AS
SpareBank
1 Gruppen BN Bank Uncollated Total
Net interest 907 922 -2 4 154 -0 - - -112 1,872
Allocated 41 48 - - - - - - -89 -
Total interest income 948 971 -2 4 154 -0 - - -202 1,872
Commission income and other income 715 180 56 360 33 197 - - 5 1,545
Net profit on financial investments 1 13 50 - - - 251 41 101 458
Total income* 1,663 1,164 104 364 187 197 251 41 -96 3,876
Total operating expenses 779 353 188 317 97 162 35 1,931
Ordinary operating profit 884 810 -85 47 91 35 251 41 -131 1,945
Loss on loans, guarantees etc. 11 151 - - 8 - - - -2 169
Result before tax incl investments held for
sale 873 659 -85 47 83 35 251 41 -129 1,776
Post-tax return on equity** 15.8 % 12.4 % 10.7 %
Balance sheet
Loans and advances to customers 84,981 37,226 - - 4,376 - - - 796 127,378
adv. of this to Boligkreditt and Næringskreditt -32,061 -1,343 - - - - - - 0 -33,404
Individual allowance for impairment on loan -28 -146 - - -7 - - - -2 -183
Group allowance for impairment on loan -95 -264 - - -18 - - - 1 -376
Other assets 140 3 1,456 281 4 144 1,509 1,157 33,803 38,499
Total assets 52,937 35,476 1,456 281 4,355 144 1,509 1,157 34,598 131,914
Deposits to customers 33,534 30,367 - - - - - - 188 64,090
Other liabilities and equity 19,402 5,108 1,456 281 4,355 144 1,509 1,157 34,410 67,824
Total liabilites 52,937 35,476 1,456 281 4,355 144 1,509 1,157 34,598 131,914 **) As from the third quarter 2014, calculation of capital employed in Retail Banking and Corporate Banking is based on regulatory capital. This capital is grossed up to 13.5 percent.
40
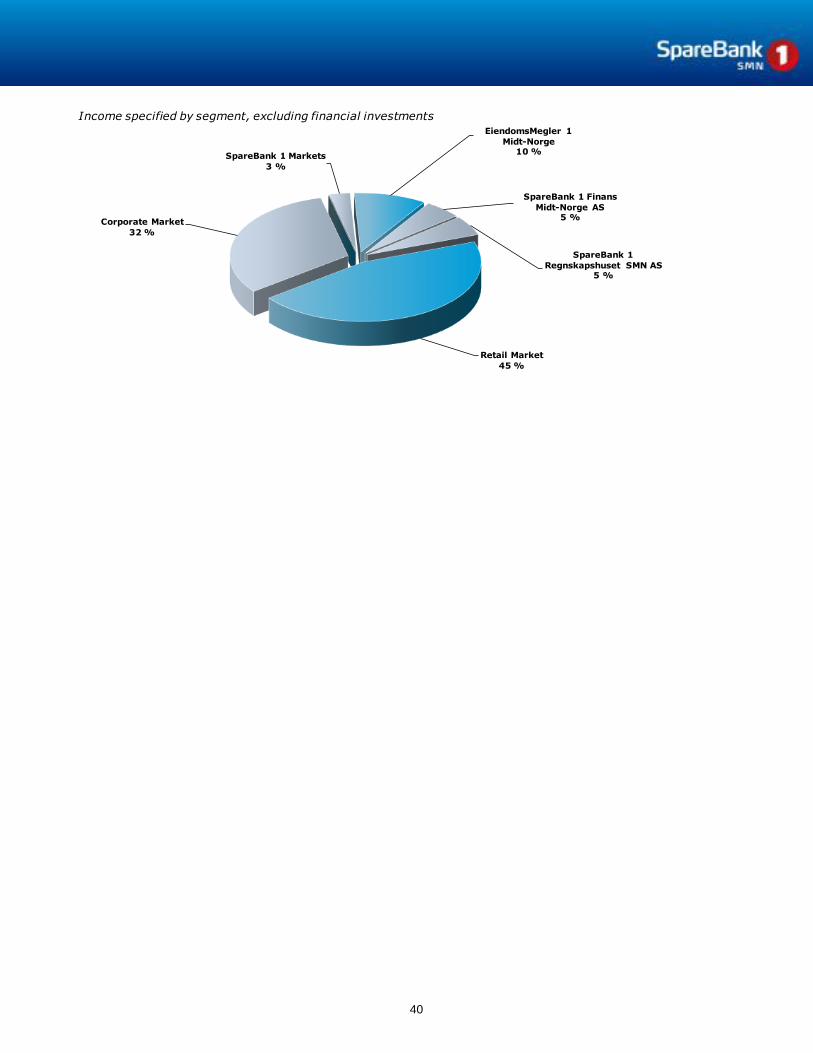
Retail Market
45 %
Corporate Market
32 %
SpareBank 1 Markets
3 %
EiendomsMegler 1
Midt-Norge10 %
SpareBank 1 Finans
Midt-Norge AS5 %
SpareBank 1
Regnskapshuset SMN AS5 %
Income specified by segment, excluding financial investments
41
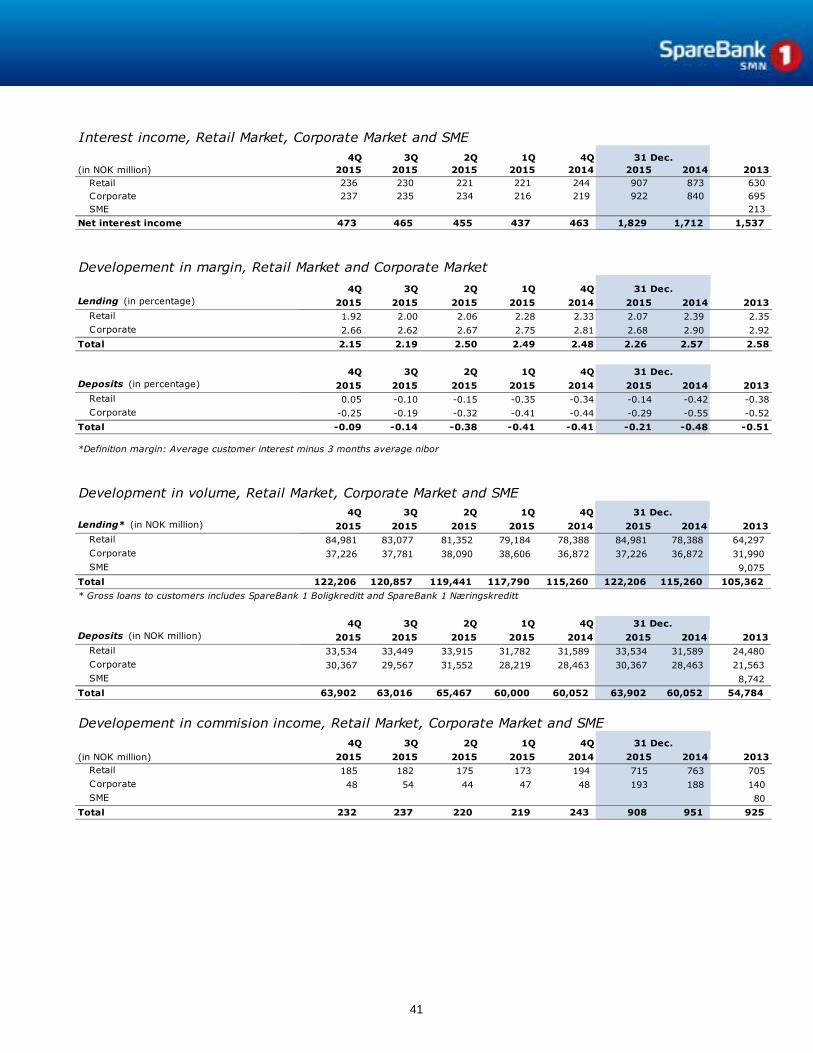
Interest income, Retail Market, Corporate Market and SME
4Q 3Q 2Q 1Q 4Q
(in NOK million) 2015 2015 2015 2015 2014 2015 2014 2013
Retail 236 230 221 221 244 907 873 630
Corporate 237 235 234 216 219 922 840 695
SME 213
Net interest income 473 465 455 437 463 1,829 1,712 1,537
31 Dec.
Developement in margin, Retail Market and Corporate Market
4Q 3Q 2Q 1Q 4Q
Lending (in percentage) 2015 2015 2015 2015 2014 2015 2014 2013
Retail 1.92 2.00 2.06 2.28 2.33 2.07 2.39 2.35
Corporate 2.66 2.62 2.67 2.75 2.81 2.68 2.90 2.92
Total 2.15 2.19 2.50 2.49 2.48 2.26 2.57 2.58
4Q 3Q 2Q 1Q 4Q
Deposits (in percentage) 2015 2015 2015 2015 2014 2015 2014 2013
Retail 0.05 -0.10 -0.15 -0.35 -0.34 -0.14 -0.42 -0.38
Corporate -0.25 -0.19 -0.32 -0.41 -0.44 -0.29 -0.55 -0.52
Total -0.09 -0.14 -0.38 -0.41 -0.41 -0.21 -0.48 -0.51
*Definition margin: Average customer interest minus 3 months average nibor
31 Dec.
31 Dec.
Development in volume, Retail Market, Corporate Market and SME
4Q 3Q 2Q 1Q 4Q
Lending* (in NOK million) 2015 2015 2015 2015 2014 2015 2014 2013
Retail 84,981 83,077 81,352 79,184 78,388 84,981 78,388 64,297
Corporate 37,226 37,781 38,090 38,606 36,872 37,226 36,872 31,990
SME 9,075
Total 122,206 120,857 119,441 117,790 115,260 122,206 115,260 105,362
* Gross loans to customers includes SpareBank 1 Boligkreditt and SpareBank 1 Næringskreditt
4Q 3Q 2Q 1Q 4Q
Deposits (in NOK million) 2015 2015 2015 2015 2014 2015 2014 2013
Retail 33,534 33,449 33,915 31,782 31,589 33,534 31,589 24,480
Corporate 30,367 29,567 31,552 28,219 28,463 30,367 28,463 21,563
SME 8,742
Total 63,902 63,016 65,467 60,000 60,052 63,902 60,052 54,784
31 Dec.
31 Dec.
Developement in commision income, Retail Market, Corporate Market and SME
4Q 3Q 2Q 1Q 4Q
(in NOK million) 2015 2015 2015 2015 2014 2015 2014 2013
Retail 185 182 175 173 194 715 763 705
Corporate 48 54 44 47 48 193 188 140
SME 80
Total 232 237 220 219 243 908 951 925
31 Dec.
42
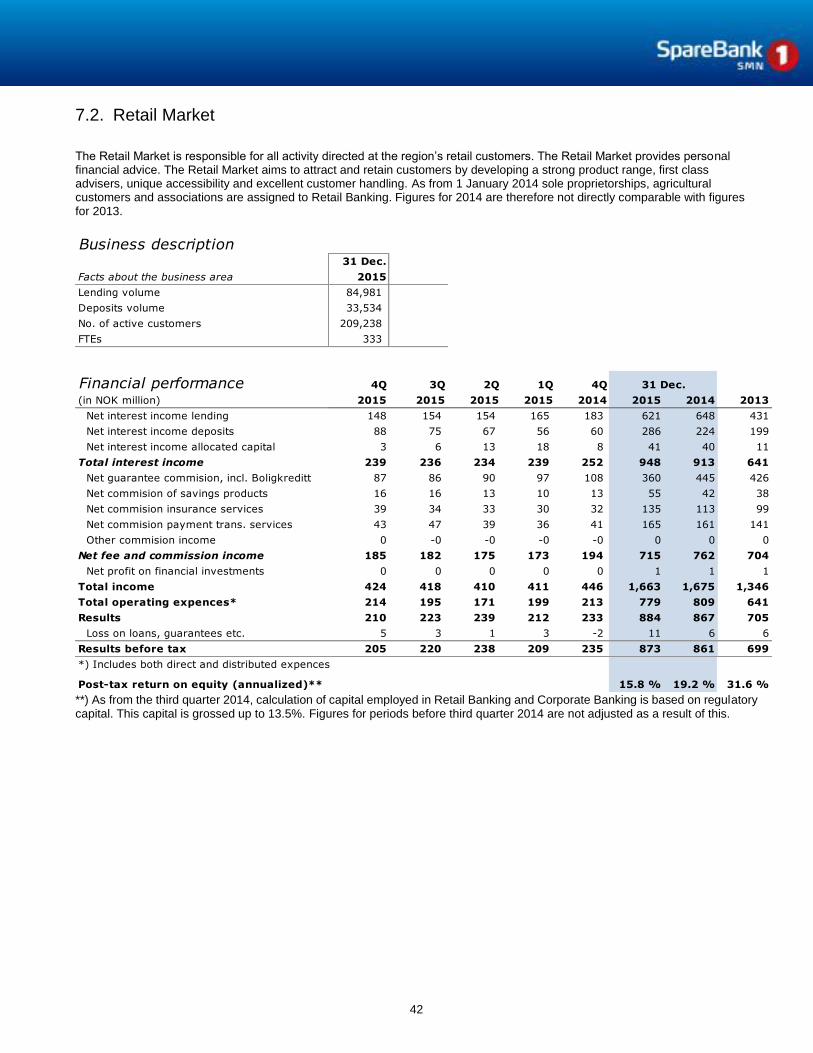
7.2. Retail Market
The Retail Market is responsible for all activity directed at the region’s retail customers. The Retail Market provides personal financial advice. The Retail Market aims to attract and retain customers by developing a strong product range, first class advisers, unique accessibility and excellent customer handling. As from 1 January 2014 sole proprietorships, agricultural customers and associations are assigned to Retail Banking. Figures for 2014 are therefore not directly comparable with figures for 2013.
Business description 31 Dec. 31 Dec.
Facts about the business area 2015 2014
Lending volume 84,981 78,388
Deposits volume 33,534 31,589
No. of active customers 209,238 185,478
FTEs 333 358
Financial performance 4Q 3Q 2Q 1Q 4Q
(in NOK million) 2015 2015 2015 2015 2014 2015 2014 2013
Net interest income lending 148 154 154 165 183 621 648 431
Net interest income deposits 88 75 67 56 60 286 224 199
Net interest income allocated capital 3 6 13 18 8 41 40 11
Total interest income 239 236 234 239 252 948 913 641
Net guarantee commision, incl. Boligkreditt 87 86 90 97 108 360 445 426
Net commision of savings products 16 16 13 10 13 55 42 38
Net commision insurance services 39 34 33 30 32 135 113 99
Net commision payment trans. services 43 47 39 36 41 165 161 141
Other commision income 0 -0 -0 -0 -0 0 0 0
Net fee and commission income 185 182 175 173 194 715 762 704
Net profit on financial investments 0 0 0 0 0 1 1 1
Total income 424 418 410 411 446 1,663 1,675 1,346
Total operating expences* 214 195 171 199 213 779 809 641
Results 210 223 239 212 233 884 867 705
Loss on loans, guarantees etc. 5 3 1 3 -2 11 6 6
Results before tax 205 220 238 209 235 873 861 699
*) Includes both direct and distributed expences
Post-tax return on equity (annualized)** 15.8 % 19.2 % 31.6 %
31 Dec.
**) As from the third quarter 2014, calculation of capital employed in Retail Banking and Corporate Banking is based on regulatory capital. This capital is grossed up to 13.5%. Figures for periods before third quarter 2014 are not adjusted as a result of this.

43
1.922.002.062.282.33
0.05-0.10-0.15-0.35-0.34
20152015201520152014
4Q3Q2Q1Q4Q
Development in margin
Lending margin Retail Deposits margin Retail
Definition margin: Average customer interest minus 3 months average nibor
85.083.1
81.479.278.4
50.0
55.0
60.0
65.0
70.0
75.0
80.0
85.0
20152015201520152014
4Q3Q2Q1Q4Q
NOK bill.
Development in lending volume Figures for 2014 incl. sole proprietorships, agricultural customers and associations

44
33.533.433.9
31.831.6
15.0
18.0
21.0
24.0
27.0
30.0
33.0
20152015201520152014
4Q3Q2Q1Q4Q
NOK bill.Development in deposits volumeFigures for 2014 incl. sole proprietorships, agricultural customers and associations

45
7.3. SME
The SME segment consists of costumers with an exposure size of +/- NOK 8m. As from 1 January 2014 the bank's SME portfolio is split up and assigned to Retail Banking and Corporate Banking respectively. This table shows historical data for the SME segment in 2013.
Financial performance 4Q 3Q 2Q 1Q
(in NOK million) 2013 2013 2013 2013 2013
Net interest income lending 51 53 49 47 200
Net interest income deposits 20 21 22 21 84
Net interest income allocated capital 1 1 1 0 3
Total interest income 72 74 72 69 286
Net guarantee commision, incl. Boligkreditt 4 5 5 4 18
Net commision of savings products 4 2 1 1 8
Net commision insurance services 4 5 5 4 18
Net commision payment trans. services 9 8 8 9 35
Net fee and commission income 21 20 19 19 79
Net profit on financial investments - 0 0 1 1
Total income 93 94 91 88 366
Total operating expences* 58 31 34 34 156
Results 35 63 58 54 209
Loss on loans, guarantees etc. -1 3 1 2 5
Results before tax 36 60 57 53 205
*) Includes both direct and distributed expences
Post-tax return on equity (annualized) 29.4 %

46
3.463.483.413.23
-0.36-0.32-0.24-0.20
2013201320132013
4Q3Q20132Q1Q
Development in margin
Lending margin SME Deposits margin SME
Definition margin: Average customer interest minus 3 months average nibor
9.19.18.88.6
.0
2.0
4.0
6.0
8.0
10.0
2013201320132013
4Q3Q20132Q1Q
NOK bill.
Development in lending volume

47
8.78.68.68.8
.0
4.0
8.0
12.0
2013201320132013
4Q3Q20132Q1Q
NOK bill.Development in deposits volume
48
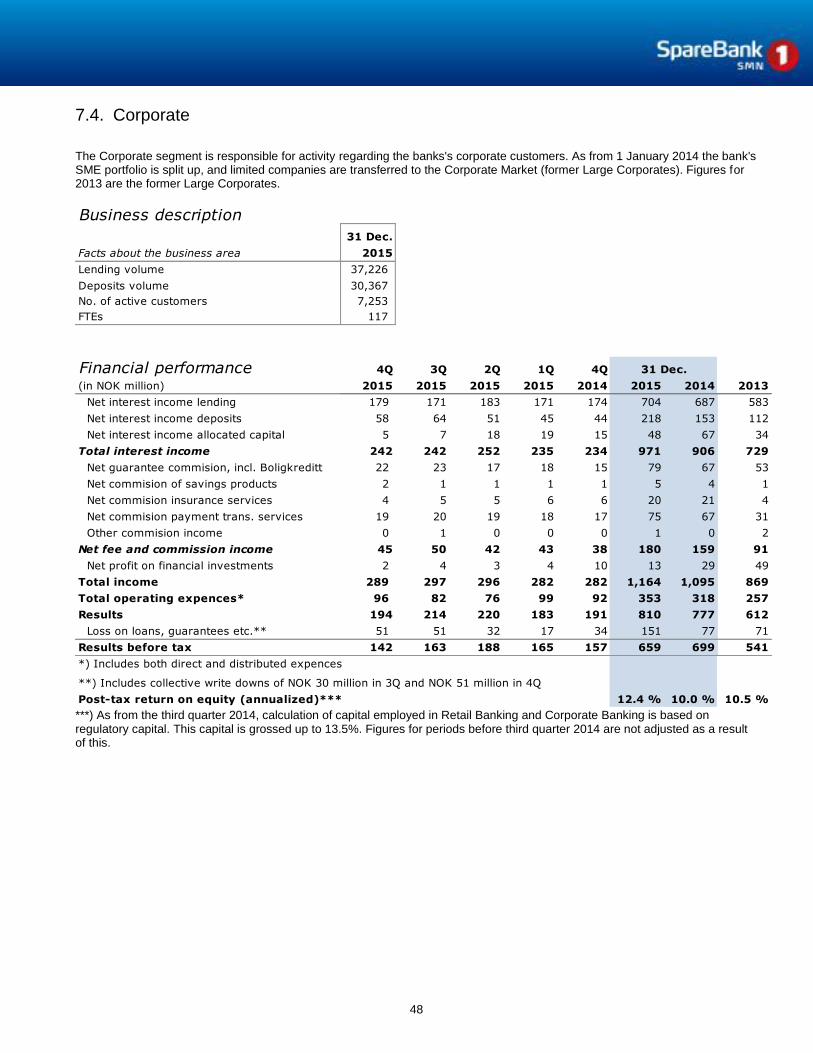
7.4. Corporate
The Corporate segment is responsible for activity regarding the banks's corporate customers. As from 1 January 2014 the bank's SME portfolio is split up, and limited companies are transferred to the Corporate Market (former Large Corporates). Figures for 2013 are the former Large Corporates.
Business description
31 Dec. 31 Dec.
Facts about the business area 2015 2014
Lending volume 37,226
Deposits volume 30,367
No. of active customers 7,253
FTEs 117
Financial performance 4Q 3Q 2Q 1Q 4Q
(in NOK million) 2015 2015 2015 2015 2014 2015 2014 2013
Net interest income lending 179 171 183 171 174 704 687 583
Net interest income deposits 58 64 51 45 44 218 153 112
Net interest income allocated capital 5 7 18 19 15 48 67 34
Total interest income 242 242 252 235 234 971 906 729
Net guarantee commision, incl. Boligkreditt 22 23 17 18 15 79 67 53
Net commision of savings products 2 1 1 1 1 5 4 1
Net commision insurance services 4 5 5 6 6 20 21 4
Net commision payment trans. services 19 20 19 18 17 75 67 31
Other commision income 0 1 0 0 0 1 0 2
Net fee and commission income 45 50 42 43 38 180 159 91
Net profit on financial investments 2 4 3 4 10 13 29 49
Total income 289 297 296 282 282 1,164 1,095 869
Total operating expences* 96 82 76 99 92 353 318 257
Results 194 214 220 183 191 810 777 612
Loss on loans, guarantees etc.** 51 51 32 17 34 151 77 71
Results before tax 142 163 188 165 157 659 699 541
*) Includes both direct and distributed expences
**) Includes collective write downs of NOK 30 million in 3Q and NOK 51 million in 4Q
Post-tax return on equity (annualized)*** 12.4 % 10.0 % 10.5 %
31 Dec.
***) As from the third quarter 2014, calculation of capital employed in Retail Banking and Corporate Banking is based on regulatory capital. This capital is grossed up to 13.5%. Figures for periods before third quarter 2014 are not adjusted as a result of this.

49
2.662.622.672.752.81
-0.25-0.19-0.32-0.41-0.44
20152015201520152014
4Q3Q2Q1Q4Q
Development in margin
Lending margin Corporates Deposit margin Corporates
Definition margin: Average customer interest minus 3 months average nibor.
37.237.838.138.636.9
15.0
20.0
25.0
30.0
35.0
40.0
20152015201520152014
4Q3Q2Q1Q4Q
NOK bill.
Development in lending volumeFigures for 2014 incl SME Ltd
50
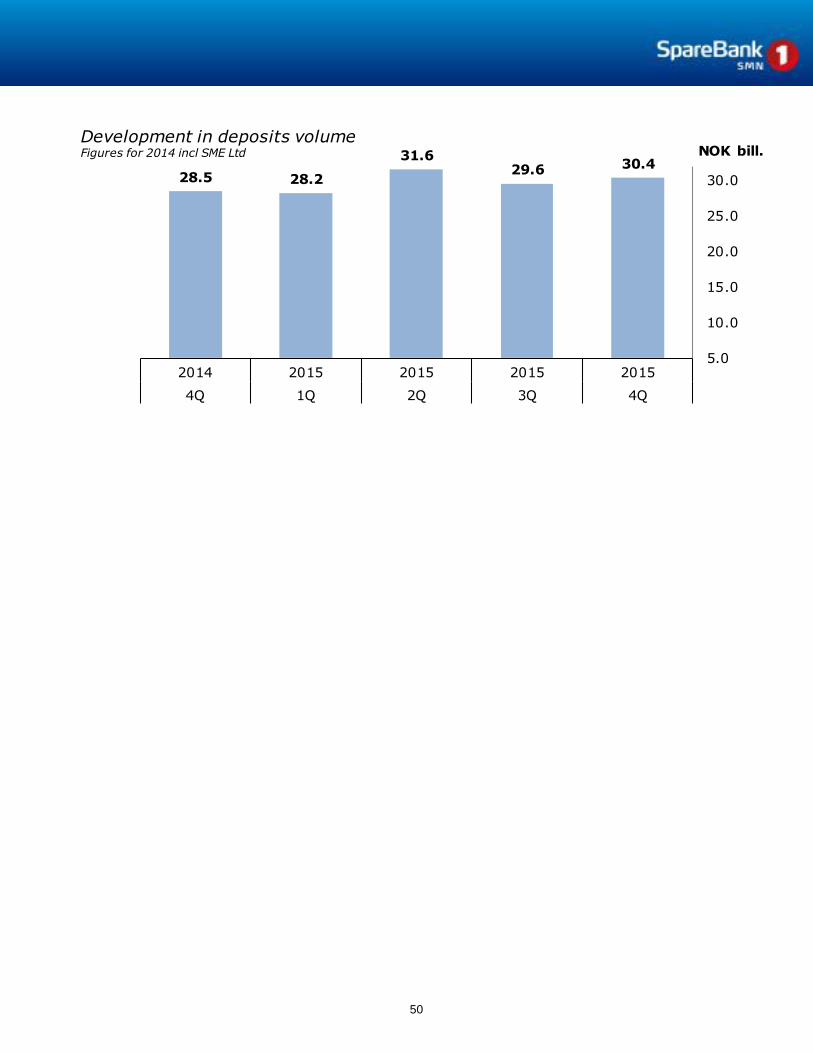
30.429.631.6
28.228.5
5.0
10.0
15.0
20.0
25.0
30.0
20152015201520152014
4Q3Q2Q1Q4Q
NOK bill.Development in deposits volumeFigures for 2014 incl SME Ltd

51
7.5. Subsidiaries
EiendomsMegler 1 Midt-Norge AS EiendomsMegler 1 Midt-Norge is a real estate agency, and has a solid market-leader position in Nord-Trøndelag and Sør-Trøndelag as well as Møre og Romsdal. The company has specialised operations which include separate units for project and commercial property broking. These operations complement its traditional residential agency business which to a greater degree will be a specialist function maintaining a local presence, co-located with banking, in various parts of Trondheim and the surrounding district. The company is owned by SpareBank 1 SMN (87 per cent), SpareBank 1 Nordvest (7.6 per cent) and SpareBank 1 Søre Sunnmøre (5.4 per cent).
Business description EiendomsMegler 1 Midt-Norge AS
Financial performance4Q 3Q 2Q 1Q 4Q
(in NOK million) 2015 2015 2015 2015 2014 2015 2014 2013
Net interest 2 1 1 1 3 4 5 7
Commission income and other income 78 90 109 83 89 360 359 368
Total income 80 91 109 83 92 364 364 375
Total operating expenses 72 81 88 76 83 317 313 314
Result before tax 8 10 21 8 9 47 51 61
31 Dec.
72
8188
7683 80
91
109
8392
89
-1
5
11
17
23
29
35
0
20
40
60
80
100
120
20152015201520152014
4Q3Q2Q1Q4Q
Result before tax
(NOK mill.)Cost and income
(NOK mill.)
Total operating expenses Total income Result before tax

52
SpareBank 1 Finans Midt-Norge AS SpareBank 1 Finans Midt-Norge is the region’s leading finance company and an active partner for businesses and private customers. SpareBank 1 Finans Midt-Norge offers car loans, boat loans, leasing and business loans to corporates and private individuals. The company services the market through its own sales operation and through the Bank’s offices and other partners. The company’s values are its easy access, prompt response, proactive stance, solution focus and probity. As of June 2015 eight new SamSpar banks joined as new owners and partners, bringing the Samspar banks’ stake in SpareBank 1 Finans Midt-Norge to 27.9 per cent. SpareBank 1 SMN reduced its holding in the company from 90.1 per cent to 72.1 per cent. With Samarbeidende Sparebanker on the owner side, the company has a presence in ten different counties dispersed across Mid- and South Norway, Nord- and Sør-Trøndelag, Møre og Romsdal, Sogn og Fjordane, Oppland, Buskerud, Telemark, Akershus, Vestfold and Østfold.
Business description SpareBank1 Finans Midt-Norge AS
Financial performance4Q 3Q 2Q 1Q 4Q
(in NOK million) 2015 2015 2015 2015 2014 2015 2014 2013
Total interest income 42 39 33 40 35 154 130 118
Commission income and other income 9 24 5 -5 -1 33 -4 -3
Net profit on financial investments 0 0 0 0 0 0 0 -1
Total income 51 63 38 35 34 187 126 116
Total operating expenses 29 41 14 13 13 97 50 45
Ordinary operating profit 23 22 23 23 20 91 75 70
Loss on loans, guarantees etc. 3 2 1 2 2 8 8 20
Total costs incl. loss on loans 32 43 16 14 16 105 58 65
Result before tax 19 20 22 21 18 83 68 51
31 Dec.
32
43
161416
51
63
383534
19
18
0
5
10
15
20
25
05
10152025303540455055606570
20152015201520152014
4Q3Q2Q1Q4Q
Result before tax
(NOK mill.)
Cost and income
(NOK mill.)
Total costs incl. loss on loans Total income Result before tax
53
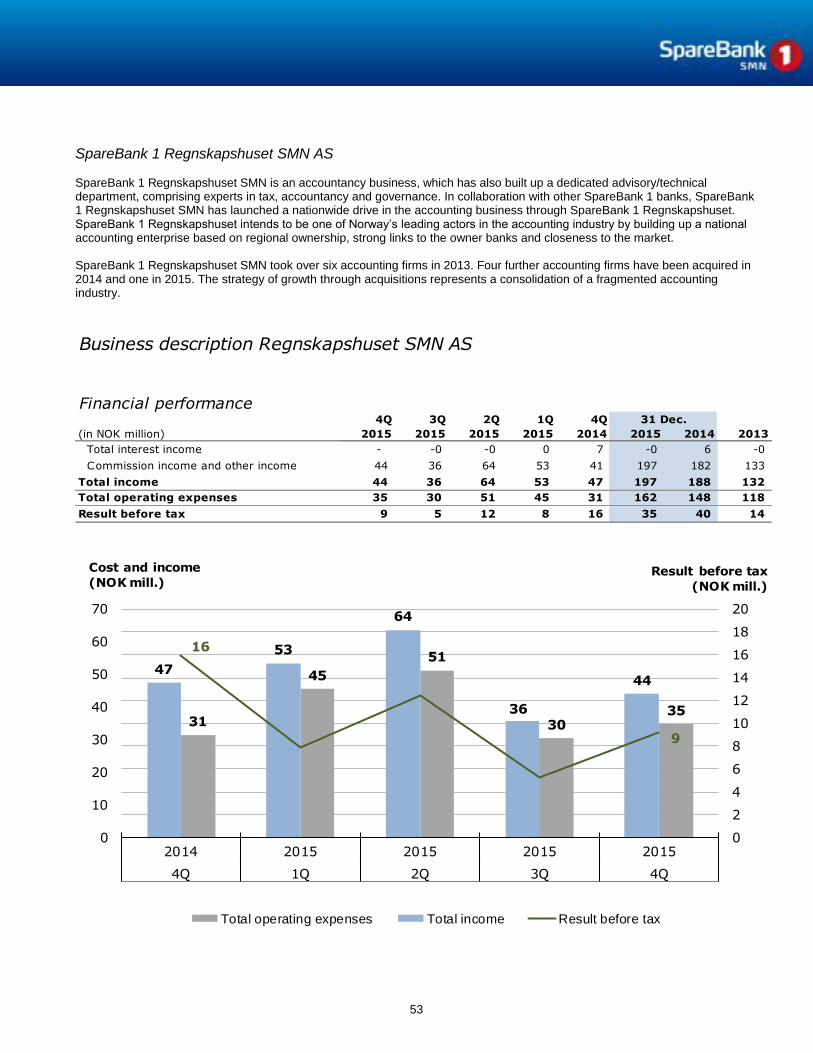
SpareBank 1 Regnskapshuset SMN AS SpareBank 1 Regnskapshuset SMN is an accountancy business, which has also built up a dedicated advisory/technical department, comprising experts in tax, accountancy and governance. In collaboration with other SpareBank 1 banks, SpareBank 1 Regnskapshuset SMN has launched a nationwide drive in the accounting business through SpareBank 1 Regnskapshuset. SpareBank 1 Regnskapshuset intends to be one of Norway’s leading actors in the accounting industry by building up a national accounting enterprise based on regional ownership, strong links to the owner banks and closeness to the market. SpareBank 1 Regnskapshuset SMN took over six accounting firms in 2013. Four further accounting firms have been acquired in 2014 and one in 2015. The strategy of growth through acquisitions represents a consolidation of a fragmented accounting industry.
Business description Regnskapshuset SMN AS
Financial performance4Q 3Q 2Q 1Q 4Q
(in NOK million) 2015 2015 2015 2015 2014 2015 2014 2013
Total interest income - -0 -0 0 7 -0 6 -0
Commission income and other income 44 36 64 53 41 197 182 133
Total income 44 36 64 53 47 197 188 132
Total operating expenses 35 30 51 45 31 162 148 118
Result before tax 9 5 12 8 16 35 40 14
31 Dec.
3530
51
45
31
44
36
64
53
47
9
16
0
2
4
6
8
10
12
14
16
18
20
0
10
20
30
40
50
60
70
20152015201520152014
4Q3Q2Q1Q4Q
Result before tax
(NOK mill.)
Cost and income
(NOK mill.)
Total operating expenses Total income Result before tax
54
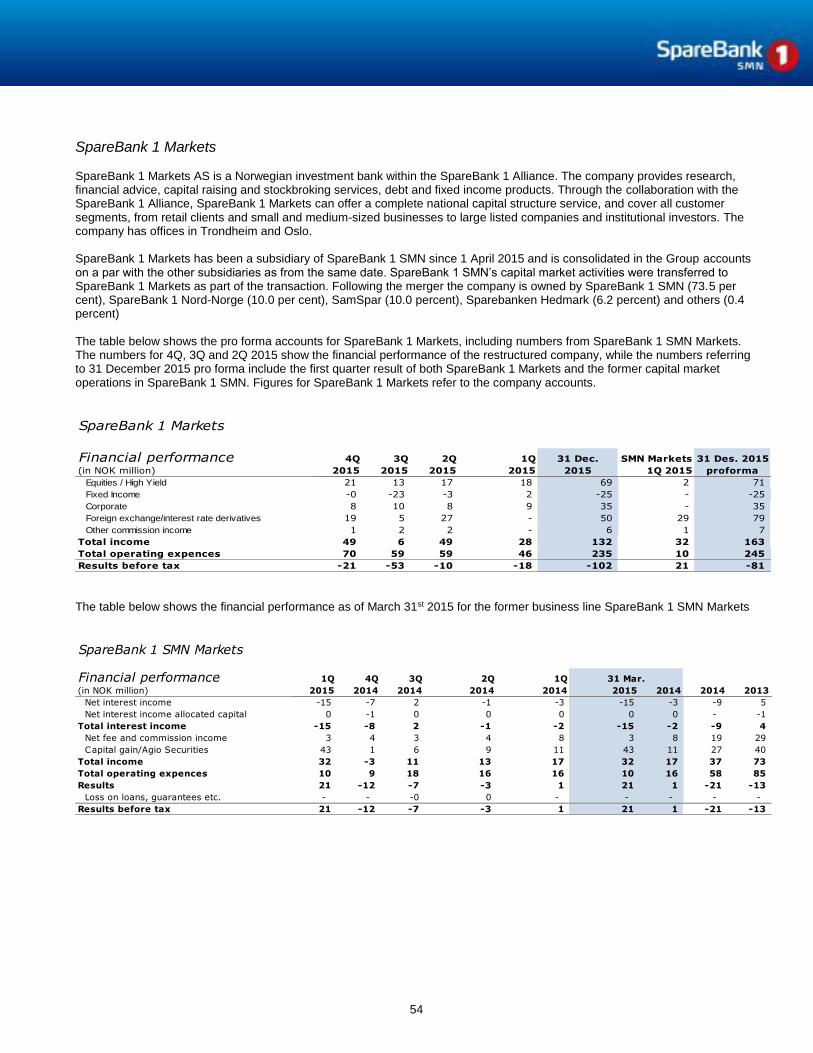
SpareBank 1 Markets SpareBank 1 Markets AS is a Norwegian investment bank within the SpareBank 1 Alliance. The company provides research, financial advice, capital raising and stockbroking services, debt and fixed income products. Through the collaboration with the SpareBank 1 Alliance, SpareBank 1 Markets can offer a complete national capital structure service, and cover all customer segments, from retail clients and small and medium-sized businesses to large listed companies and institutional investors. The company has offices in Trondheim and Oslo. SpareBank 1 Markets has been a subsidiary of SpareBank 1 SMN since 1 April 2015 and is consolidated in the Group accounts on a par with the other subsidiaries as from the same date. SpareBank 1 SMN’s capital market activities were transferred to SpareBank 1 Markets as part of the transaction. Following the merger the company is owned by SpareBank 1 SMN (73.5 per cent), SpareBank 1 Nord-Norge (10.0 per cent), SamSpar (10.0 percent), Sparebanken Hedmark (6.2 percent) and others (0.4 percent) The table below shows the pro forma accounts for SpareBank 1 Markets, including numbers from SpareBank 1 SMN Markets. The numbers for 4Q, 3Q and 2Q 2015 show the financial performance of the restructured company, while the numbers referring to 31 December 2015 pro forma include the first quarter result of both SpareBank 1 Markets and the former capital market operations in SpareBank 1 SMN. Figures for SpareBank 1 Markets refer to the company accounts.
SpareBank 1 Markets
Financial performance 4Q 3Q 2Q 1Q 31 Dec. SMN Markets 31 Des. 2015
(in NOK million) 2015 2015 2015 2015 2015 1Q 2015 proforma
Equities / High Yield 21 13 17 18 69 2 71
Fixed Income -0 -23 -3 2 -25 - -25
Corporate 8 10 8 9 35 - 35
Foreign exchange/interest rate derivatives 19 5 27 - 50 29 79
Other commission income 1 2 2 - 6 1 7
Total income 49 6 49 28 132 32 163
Total operating expences 70 59 59 46 235 10 245
Results before tax -21 -53 -10 -18 -102 21 -81 The table below shows the financial performance as of March 31st 2015 for the former business line SpareBank 1 SMN Markets
SpareBank 1 SMN Markets
Financial performance 1Q 4Q 3Q 2Q 1Q
(in NOK million) 2015 2014 2014 2014 2014 2015 2014 2014 2013
Net interest income -15 -7 2 -1 -3 -15 -3 -9 5
Net interest income allocated capital 0 -1 0 0 0 0 0 - -1
Total interest income -15 -8 2 -1 -2 -15 -2 -9 4
Net fee and commission income 3 4 3 4 8 3 8 19 29
Capital gain/Agio Securities 43 1 6 9 11 43 11 27 40
Total income 32 -3 11 13 17 32 17 37 73
Total operating expences 10 9 18 16 16 10 16 58 85
Results 21 -12 -7 -3 1 21 1 -21 -13
Loss on loans, guarantees etc. - - -0 0 - - - - -
Results before tax 21 -12 -7 -3 1 21 1 -21 -13
31 Mar.
55
Other subsidiaries Allegro Kapitalforvaltning: The company is licensed to carry on active asset management. It manages assets for external
public, private and institutional clients. The company’s services are sold exclusively through external distributors that are licensed to engage in such activity. The company has distribution agreements with a number of banks in the SpareBank 1 Alliance. SpareBank 1 Bilplan: The company delivers car fleet management solutions to the public and private sectors nationwide. The
company services the market through its own sales operation and through cooperation with SpareBank 1 Finans Midt-Norge, SpareBank 1 SR-Finans, SpareBank 1 Finans Nord-Norge and through the Bank’s office network. SpareBank 1 Invest: The companys' strategy is to carry out investments in regional seedcorn, venture and private equity funds
and to invest directly in growth companies with national/international market potential in the same market area. Property companies: Their mission is to own, operate and develop property. Property companies: SpareBank 1 SMN Kvartalet,
SpareBank 1 Bygget Steinkjer, Brannstasjonen SMN, St Olavs Plass 1 SMN, Jernbanegata 19 SMN, SpareBank 1 Bygget Trondheim, Bjerkeløkkja.

56
8. Development last ten years
Financial results
2005 2006 2007 2008 2009 2010 2011 2012 2013 2014
Net interest 974 1,024 1,139 1,350 1,325 1,317 1,392 1,477 1,616 1,790
Commission income and other income 537 580 671 610 756 855 919 1,139 1,463 1,512
Net return on financial investments 276 419 332 207 596 410 434 451 502 720
Total income 1,787 2,022 2,142 2,167 2,677 2,582 2,746 3,067 3,580 4,021
Staff costs 485 512 583 623 725 583 810 942 923 1,002
Other operating expenses 421 478 519 571 528 557 672 712 799 787
Total operating expenses 906 990 1,102 1,194 1,253 1,140 1,482 1,654 1,722 1,789
Result before losses 881 1,032 1,039 975 1,424 1,441 1,264 1,414 1,859 2,232
Loss on loans, guarantees etc. -38 -84 -6 202 277 132 27 58 101 89
Result before tax 919 1,116 1,045 773 1,147 1,309 1,236 1,355 1,758 2,143
Tax charge 199 219 200 156 210 260 255 295 388 362
Results investments held for sale, after tax -27 43 16 30 0
Net profit 720 898 846 617 937 1,022 1,024 1,077 1,400 1,782
(in NOK million)
Balance sheet*
2005 2006 2007 2008 2009 2010 2011 2012 2013 2014
Cash and loans to and claims on credit
institutions 2,123 2,323 3,878 4,548 1,260 2,532 4,075 4,091 5,984 5,965
CDs, bonds and other interest-bearing
securities 4,133 5,602 7,246 12,036 19,302 22,948 21,485 25,614 26,358 27,891
Gross loans to customers before write-downs 45,280 52,819 59,178 64,016 61,782 69,847 73,105 74,943 80,548 90,578
- Specified write-downs -236 -147 -116 -215 -219 -222 -172 -144 -173 -172
- Write-downs by loan category -278 -184 -185 -245 -289 -290 -290 -295 -295 -295
Other assets 3,304 2,765 1,502 4,540 2,704 3,182 3,252 3,766 2,938 2,080
Assets 54,327 63,178 71,503 84,679 84,541 97,997 101,455 107,975 115,360 126,047
Deposits from credit institutions 1,029 2,766 5,346 9,000 11,310 13,062 9,118 7,410 6,581 9,123
Deposits from and debt to customers 27,048 30,136 32,434 35,280 37,227 42,786 47,871 52,252 55,927 60,680
Debt created by issue of securities 18,036 21,911 23,950 29,680 24,070 29,625 31,306 33,121 36,806 39,254
Other liabilities 2,876 1,799 2,265 2,045 1,876 1,922 2,122 2,070 1,485 1,095
Subordinated loan capital 1,667 2,383 2,648 3,156 3,875 2,758 2,690 3,040 3,319 3,371
Total equity capital 3,671 4,183 4,860 5,518 6,183 7,846 8,348 10,082 11,242 12,524
Total liabilities and equity 54,327 63,178 71,503 84,679 84,541 97,997 101,455 107,975 115,360 126,047
(in NOK million)
*) The Group has changed its presentation of accrued interest as from the first quarter of 2015. Accrued interest is now presented together with the underlying financial instrument. It was previously presented as other assets and other liabilities. Historical figures for 2014 and 2013 are similarly restated, but earlier years have not been restated due to small changes
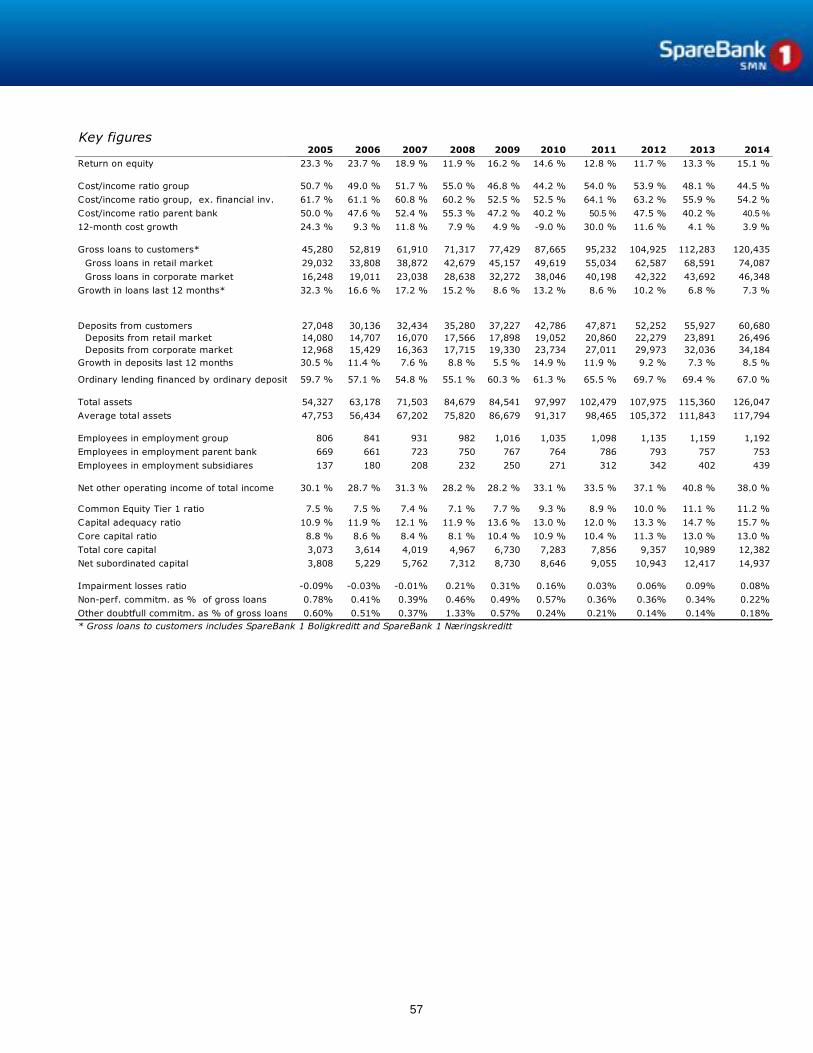
57
Key figures2005 2006 2007 2008 2009 2010 2011 2012 2013 2014
Return on equity 23.3 % 23.7 % 18.9 % 11.9 % 16.2 % 14.6 % 12.8 % 11.7 % 13.3 % 15.1 %
Cost/income ratio group 50.7 % 49.0 % 51.7 % 55.0 % 46.8 % 44.2 % 54.0 % 53.9 % 48.1 % 44.5 %
Cost/income ratio group, ex. financial inv. 61.7 % 61.1 % 60.8 % 60.2 % 52.5 % 52.5 % 64.1 % 63.2 % 55.9 % 54.2 %
Cost/income ratio parent bank 50.0 % 47.6 % 52.4 % 55.3 % 47.2 % 40.2 % 50.5 % 47.5 % 40.2 % 40.5 %
12-month cost growth 24.3 % 9.3 % 11.8 % 7.9 % 4.9 % -9.0 % 30.0 % 11.6 % 4.1 % 3.9 %
Gross loans to customers* 45,280 52,819 61,910 71,317 77,429 87,665 95,232 104,925 112,283 120,435
Gross loans in retail market 29,032 33,808 38,872 42,679 45,157 49,619 55,034 62,587 68,591 74,087
Gross loans in corporate market 16,248 19,011 23,038 28,638 32,272 38,046 40,198 42,322 43,692 46,348
Growth in loans last 12 months* 32.3 % 16.6 % 17.2 % 15.2 % 8.6 % 13.2 % 8.6 % 10.2 % 6.8 % 7.3 %
Deposits from customers 27,048 30,136 32,434 35,280 37,227 42,786 47,871 52,252 55,927 60,680
Deposits from retail market 14,080 14,707 16,070 17,566 17,898 19,052 20,860 22,279 23,891 26,496
Deposits from corporate market 12,968 15,429 16,363 17,715 19,330 23,734 27,011 29,973 32,036 34,184
Growth in deposits last 12 months 30.5 % 11.4 % 7.6 % 8.8 % 5.5 % 14.9 % 11.9 % 9.2 % 7.3 % 8.5 %
Ordinary lending financed by ordinary deposits 59.7 % 57.1 % 54.8 % 55.1 % 60.3 % 61.3 % 65.5 % 69.7 % 69.4 % 67.0 %
Total assets 54,327 63,178 71,503 84,679 84,541 97,997 102,479 107,975 115,360 126,047
Average total assets 47,753 56,434 67,202 75,820 86,679 91,317 98,465 105,372 111,843 117,794
Employees in employment group 806 841 931 982 1,016 1,035 1,098 1,135 1,159 1,192
Employees in employment parent bank 669 661 723 750 767 764 786 793 757 753
Employees in employment subsidiares 137 180 208 232 250 271 312 342 402 439
Net other operating income of total income 30.1 % 28.7 % 31.3 % 28.2 % 28.2 % 33.1 % 33.5 % 37.1 % 40.8 % 38.0 %
Common Equity Tier 1 ratio 7.5 % 7.5 % 7.4 % 7.1 % 7.7 % 9.3 % 8.9 % 10.0 % 11.1 % 11.2 %
Capital adequacy ratio 10.9 % 11.9 % 12.1 % 11.9 % 13.6 % 13.0 % 12.0 % 13.3 % 14.7 % 15.7 %
Core capital ratio 8.8 % 8.6 % 8.4 % 8.1 % 10.4 % 10.9 % 10.4 % 11.3 % 13.0 % 13.0 %
Total core capital 3,073 3,614 4,019 4,967 6,730 7,283 7,856 9,357 10,989 12,382
Net subordinated capital 3,808 5,229 5,762 7,312 8,730 8,646 9,055 10,943 12,417 14,937
Impairment losses ratio -0.09% -0.03% -0.01% 0.21% 0.31% 0.16% 0.03% 0.06% 0.09% 0.08%
Non-perf. commitm. as % of gross loans 0.78% 0.41% 0.39% 0.46% 0.49% 0.57% 0.36% 0.36% 0.34% 0.22%
Other doubtfull commitm. as % of gross loans 0.60% 0.51% 0.37% 1.33% 0.57% 0.24% 0.21% 0.14% 0.14% 0.18%
* Gross loans to customers includes SpareBank 1 Boligkreditt and SpareBank 1 Næringskreditt
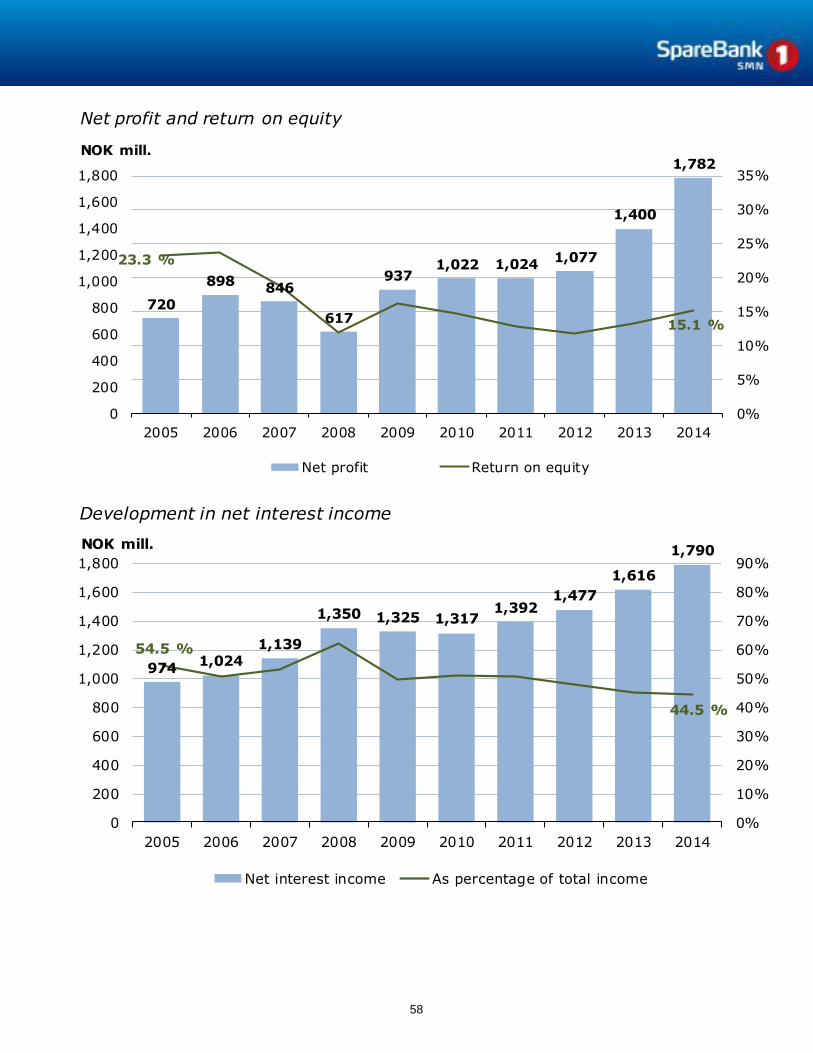
58
720
898846
617
9371,022 1,024
1,077
1,400
1,782
23.3 %
15.1 %
0%
5%
10%
15%
20%
25%
30%
35%
0
200
400
600
800
1,000
1,200
1,400
1,600
1,800
2005 2006 2007 2008 2009 2010 2011 2012 2013 2014
NOK mill.
Net profit and return on equity
Net profit Return on equity
9741,024
1,139
1,350 1,325 1,3171,392
1,477
1,616
1,790
54.5 %
44.5 %
0%
10%
20%
30%
40%
50%
60%
70%
80%
90%
0
200
400
600
800
1,000
1,200
1,400
1,600
1,800
2005 2006 2007 2008 2009 2010 2011 2012 2013 2014
NOK mill.
Development in net interest income
Net interest income As percentage of total income
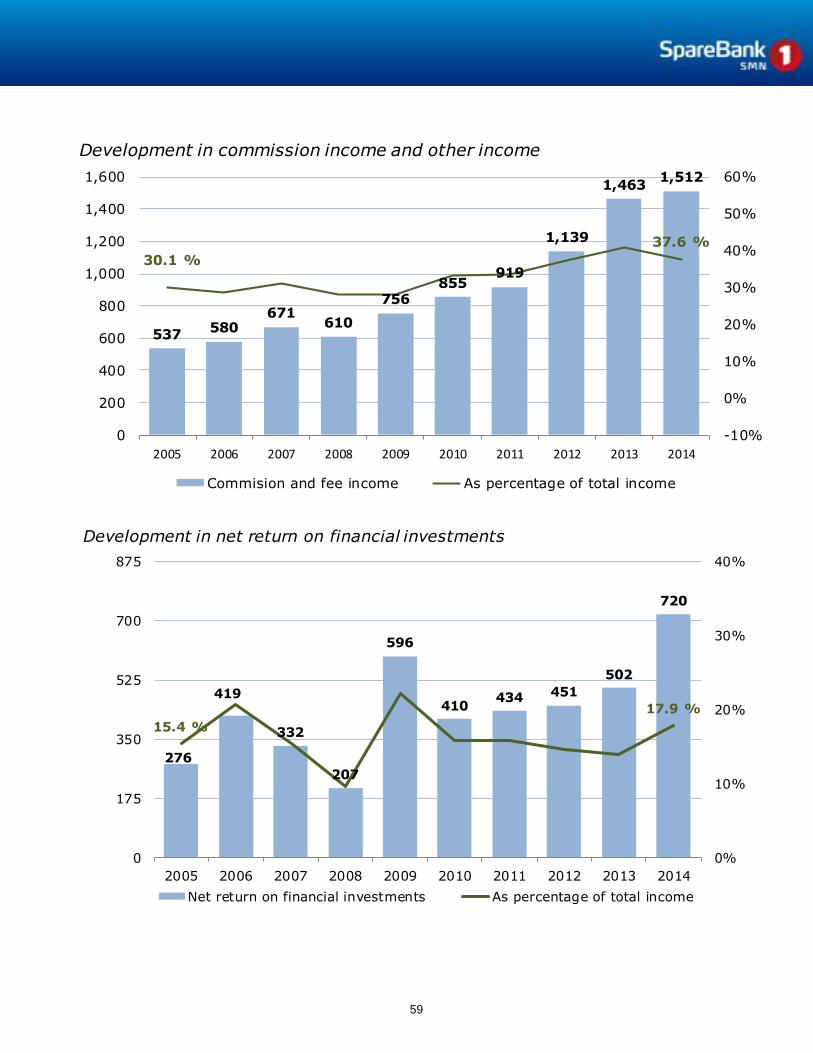
59
537580
671610
756855
919
1,139
1,4631,512
30.1 %
37.6 %
-10%
0%
10%
20%
30%
40%
50%
60%
0
200
400
600
800
1,000
1,200
1,400
1,600
2005 2006 2007 2008 2009 2010 2011 2012 2013 2014
Development in commission income and other income
Commision and fee income As percentage of total income
276
419
332
207
596
410434 451
502
720
15.4 %
17.9 %
0%
10%
20%
30%
40%
0
175
350
525
700
875
2005 2006 2007 2008 2009 2010 2011 2012 2013 2014
Development in net return on financial investments
Net return on financial investments As percentage of total income
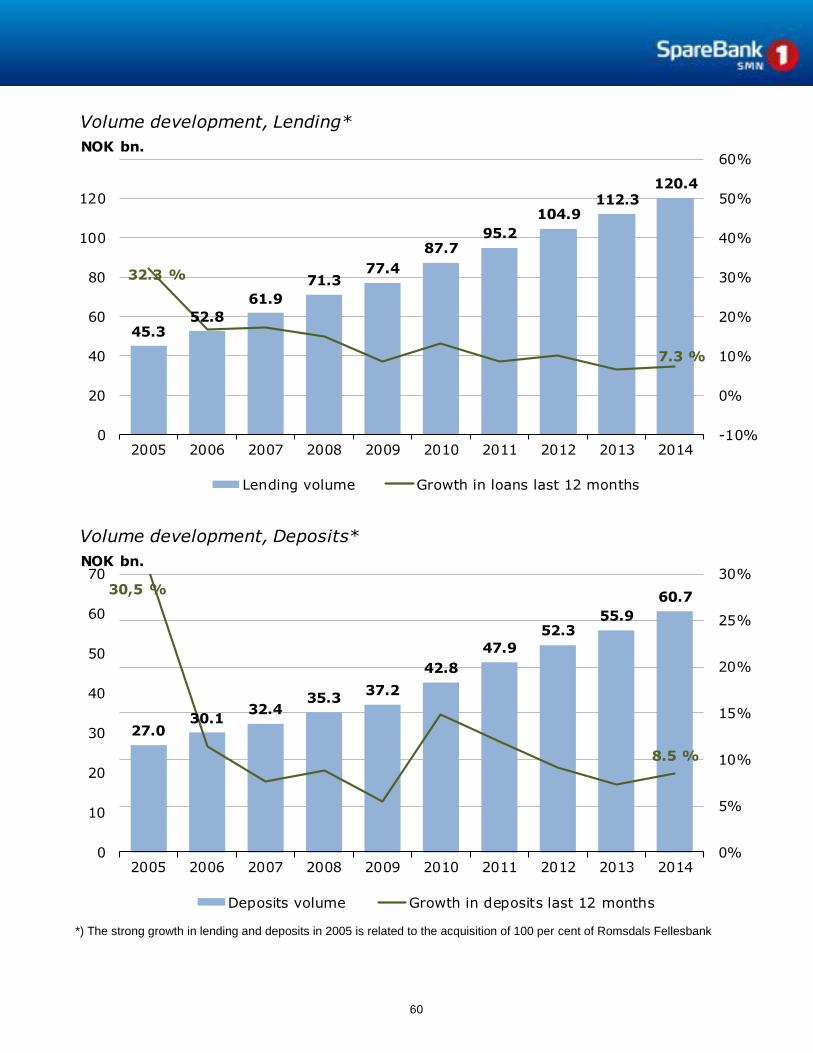
60
45.352.8
61.9
71.377.4
87.795.2
104.9112.3
120.4
32.3 %
7.3 %
-10%
0%
10%
20%
30%
40%
50%
60%
0
20
40
60
80
100
120
2005 2006 2007 2008 2009 2010 2011 2012 2013 2014
NOK bn.
Volume development, Lending*
Lending volume Growth in loans last 12 months
27.030.1
32.435.3
37.2
42.8
47.9
52.355.9
60.730,5 %
8.5 %
0%
5%
10%
15%
20%
25%
30%
0
10
20
30
40
50
60
70
2005 2006 2007 2008 2009 2010 2011 2012 2013 2014
NOK bn.
Volume development, Deposits*
Deposits volume Growth in deposits last 12 months
*) The strong growth in lending and deposits in 2005 is related to the acquisition of 100 per cent of Romsdals Fellesbank
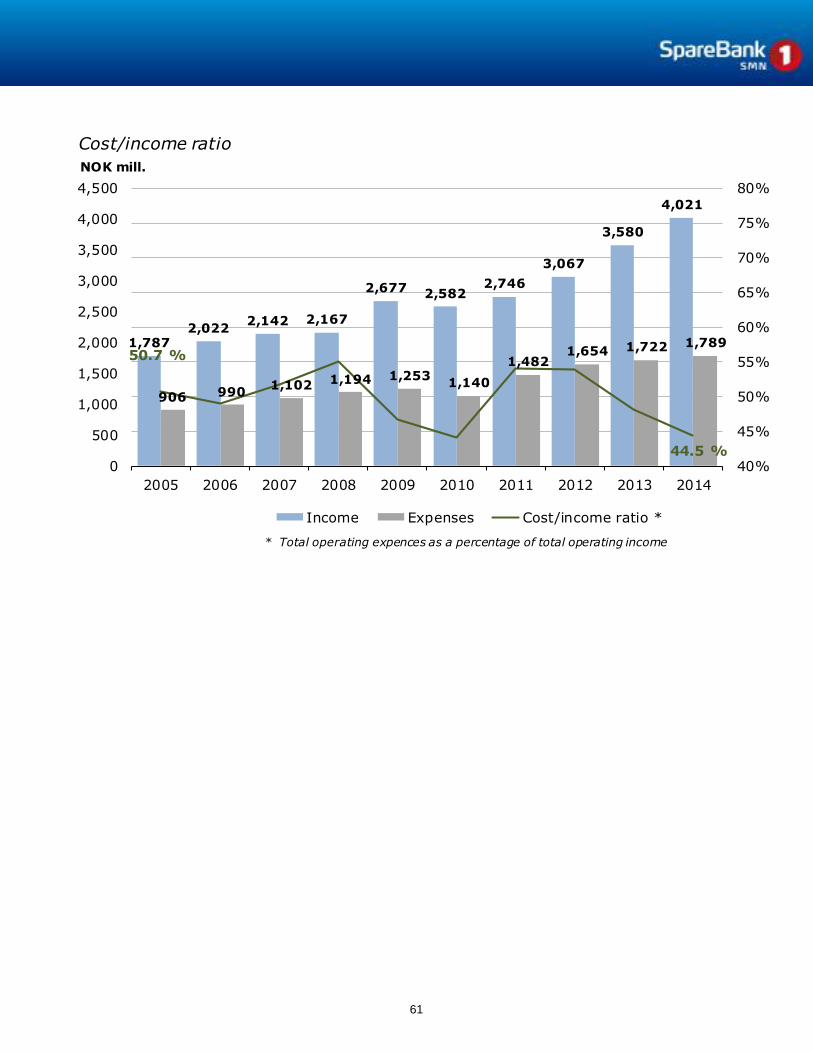
61
1,7872,022
2,142 2,167
2,677 2,5822,746
3,067
3,580
4,021
906 9901,102 1,194 1,253
1,140
1,4821,654 1,722 1,789
50.7 %
44.5 %40%
45%
50%
55%
60%
65%
70%
75%
80%
0
500
1,000
1,500
2,000
2,500
3,000
3,500
4,000
4,500
2005 2006 2007 2008 2009 2010 2011 2012 2013 2014
NOK mill.
Cost/income ratio
Income Expenses Cost/income ratio *
* Total operating expences as a percentage of total operating income

62
669 661723 750 767 764 786 793 757 753
137180
208232
250 271312
342 402439
2005 2006 2007 2008 2009 2010 2011 2012 2013 2014
Employees in employment
Parent bank Subsidaries

63
623
490 463
1,280
821
609542 517 517 517514
331 301
460508 512
462 439 468 467
1.4 %
0.4 %
0
250
500
750
1,000
1,250
1,500
0.0 %
0.5 %
1.0 %
1.5 %
2.0 %
2005 2006 2007 2008 2009 2010 2011 2012 2013 2014
NOK million
Net non-performing and impaired commitments
Gross non-perf. and impaired comm.
Individual and collective write-downs
Gross non-perf. and impaired comm. as % of net lending
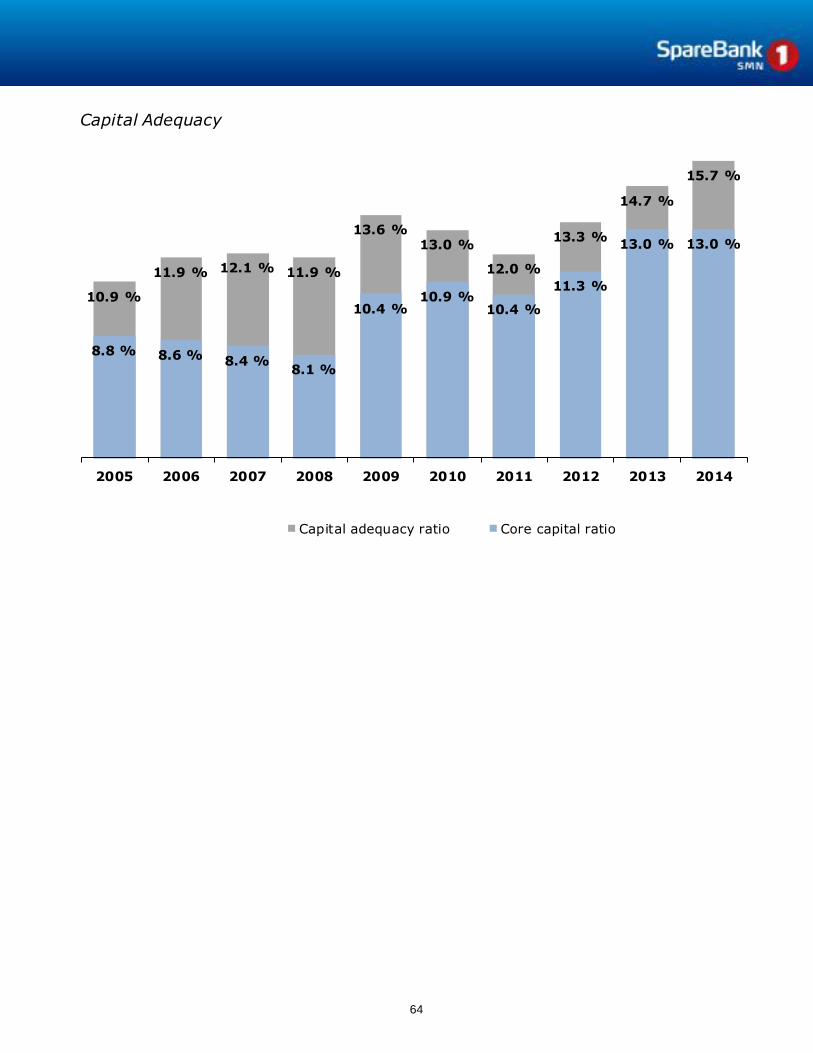
64
10.9 %
11.9 % 12.1 % 11.9 %
13.6 %13.0 %
12.0 %
13.3 %
14.7 %
15.7 %
8.8 % 8.6 % 8.4 %8.1 %
10.4 %10.9 %
10.4 %
11.3 %
13.0 % 13.0 %
2005 2006 2007 2008 2009 2010 2011 2012 2013 2014
Capital Adequacy
Capital adequacy ratio Core capital ratio