Embed Size (px)
Citation preview

INVESTOR RELATIONS PRESENTATION
Q3’2018

Overview …… 3 About CIB …… 12 Financial Review …… 27 Conclusion …… 37
TABLE OF
CONTENTS

Commercial International Bank | Investor Relations Presentation
Overview | About CIB | Financial Review | Conclusion
�3
Disclaimer
By attending the meeting where this presentation is made or distributed, or by reading the presentation slides, you agree with the following limitations:
• The information in this presentation may contain future projections and forward‐looking statements that reflect the bank’s current views with respect to future events and financial performance. These views are based on current assumptions which are subject to various risks and thus, may change over time
• No assurance can be given that projections will be achieved, future events will occur, or that the Bank’s assumptions are correct. Actual results may differ materially from those projected
• This document is provided for informational purposes only. It is not an offer to buy or sell CIB shares. Readers should take into account factors of uncertainty and risk when basing their investment decisions on information provided in this document
• Past performance cannot be relied on as a guide to future performance
• CIB relies on information obtained from sources believed to be reliable, but does not guarantee its accuracy or completeness

Commercial International Bank | Investor Relations Presentation
Overview | About CIB | Financial Review | Conclusion
�4
Egypt’s Fact Sheet
Industrial (27.62%) Agriculture (10.89%) Trade (11.02%)Construction (8.19%) Gross Exports (7.54%) Governmnet (5.55%)Mining (8.03%) Remittances (5.95%) Transportation (4.19%)Financial Services (2.88%) Tourism (2.32%) Suez Canal (1.49%)FDI (0.90%)**
Diversified Economy¹
Name Arab Republic of Egypt
Capital Cairo
Currency Egyptian Pound (EGP)
Total area c.1,002,000 sqm.km
Inhibited area 7.88% of total area
Governorates 27
Population 97.8mn²
Median age 24²*
Labor force/population 43.5%¹*
Unemployment rate 9.9%¹*
Most populous country in the Middle East
3rd most populous in Africa
Production age totals to c.50% of total population
Over 85% of the population is below 55 years
¹ CBE, Figures as of July/March 2017/2018 ² CAPMAS, as of 11/07/2018 ¹* CAPMAS, as of Q2’2017-2018
²* CIA, World Fact Book * CBE, Preliminary figure ** CBE, figure as of Q3’2017/2018
Country Profile
Favorable Demographics

Commercial International Bank | Investor Relations Presentation
Overview | About CIB | Financial Review | Conclusion
�5
Macro-Environment- Real Sector
Real GDP Growth* (%) Inflation (%)
Key Sector Growth rates****
*GDP at Factor Cost **CBE, figures as of Q4’2017/2018 *** GDP at Factor cost by economic activity (current prices) as of Apr./Jun.2017/2018 2CBE, figures as of Q4’2017/2018³ GDP/Capita (current prices), IMF, WEO Database, October 2018 **** As of Apr/Jun 17/18
0.0%
2.0%
4.0%
6.0%
8.0%
06/07 07/08 08/09 09/10 10/11 11/12 12/13 13/14 14/15 15/16 16/17 Apr-Jun 17-18
5.3%
3.6%
2.3%
3.4%
2.2%2.1%2.2%1.9%
5.1%4.7%
7.2%7.1%
Reform-led boom
Global Financial Crisis
Post-Uprising turmoil
0%
10%
20%
30%
40%
Apr'17 Jun'17 Aug'17 Oct'17 Dec'17 Feb'18 Apr'18 June'18 Aug'18
32.1%30.6%32.0%35.3%34.9%33.3%
30.5%
25.5%
19.9%
14.4%11.9%11.6%11.6%11.1%10.9%
8.5% 8.8%
16.0%
31.5%29.7%29.8%33.0%31.9%31.6%30.8%
26.0%21.9%
17.1%14.4%13.3%13.1%11.5%
14.4%13.5%14.2%
8.6%
Headline Inflation (%) Core Inflation (%)
0.00%
12.50%
25.00%
37.50%
50.00%
Agriculture Extractions Manufacturing industries Construction & buildingWholesale & retail tradeFinancial TourismTransportation and storageCommunications
12.50%4.10%
44.50%
3.40%4.00%11.00%
4.60%5.50%3.30%
Net International Reserve: $44bn (Sep’18)Current A/C balance: $-493.8mn2 LT external debt: $80.3bn2
ST external debt: $12.2bn2
c.80% of debt in LCY, held by public sector
Total GDP: EGP 1,060,997.9mn***
GDP/Capita: $12,697 (2017)³
Manageable debt Growth Opportunities
CONSUMPTION**
Private consumption/GDP: 81.9%Public consumption/GDP: 9.8%

Commercial International Bank | Investor Relations Presentation
Overview | About CIB | Financial Review | Conclusion
�6
External Sector (BOP)
Tourism& Remittance proceeds Foreign Direct Investment (FDI)*
Trade Deficit (% GDP)** Current Account balance (% GDP)**
0
7,500
15,000
22,500
30,000
2012/2013 2013/2014 2014/2015 2015/2016 2016/2017 2017/2018
9,804
4,380 3,768 7,370
5,073
9,752
26,393
17,453 17,077 19,330 18,519 18,668
Remittances * Tourism Revenue* 0
2,000
4,000
6,000
8,000
09/10 10/11 11/12 12/13 13/14 14/15 15/16 16/17 17/18
7,7207,916
6,9336,380
4,1783,7533,982
2,189
6,758
* In USD mn ** CBE, figures as of Q4 2017-2018
-16%
-12%
-8%
-4%
0%
2012/2013 2014/2015 2016/2017 Q2 16-17 Q4 16-17 Q2 17-18 Q4 17-18
-10.70%-11.20%-11.70%-11.50%
-15.90%
-4.00% -4.30% -3.90% -3.70% -3.60% -3.90% -3.70% -3.70%
-7%
-5%
-4%
-2%
0%
2014/2015 2016/2017 Q2 16-17 Q4 16-17 Q2 17-18 Q4 17-18
-3.60%
-5.90%-6.60%
-2.30% -2.00%
-1.20%-0.70% -0.70% -0.70% -0.80%
-0.20%

Commercial International Bank | Investor Relations Presentation
Overview | About CIB | Financial Review | Conclusion
�7
Fiscal Sector & Debt
Fiscal Budget Gross Domestic Debt/GDP ( % ) - Fiscal Year
External Debt/GDP - Fiscal Year
'-
450,000
900,000
1,350,000
1,800,000
2012/2013 2013/2014 2014/2015 2015/2016 2016/2017 July-Mar 17-18
6.70%
10.90%
12.50%
11.50%12.20%
13.00%
497,816
659,184
491,488 465,241 456,788
350,322
771,966 1,031,941 817,844 733,350 701,514 588,188
Total expenditure(EGP mn) Total Revenue ( EGP mn) Overall Deficit/GDP
0.00%
25.00%
50.00%
75.00%
100.00%
2012/2013 2013/2014 2014/2015 2015/2016 2016/2017 Q1'17-18 Q2'17-18 Q3'17-18 Q4'17-18
82.10% 85.30% 86.60%96.70% 91.10%
74.70% 76.90% 79.70% 83.30%
Gross Domestic Debt / GDP ( % )
0.00%
10.00%
20.00%
30.00%
40.00%
2012/2013 2013/2014 2014/2015 2015/2016 2016/2017 Q1'17-18 Q2'17-18 Q3'17-18 Q4'17-18
15.00% 15.10% 14.40%16.60%
33.60%36.10% 36.10% 36.80% 37.00%
External Debt/GDP ( Year-end June)
Commercial International Bank | Investor Relations Presentation
Overview | About CIB | Financial Review | Conclusion
�8
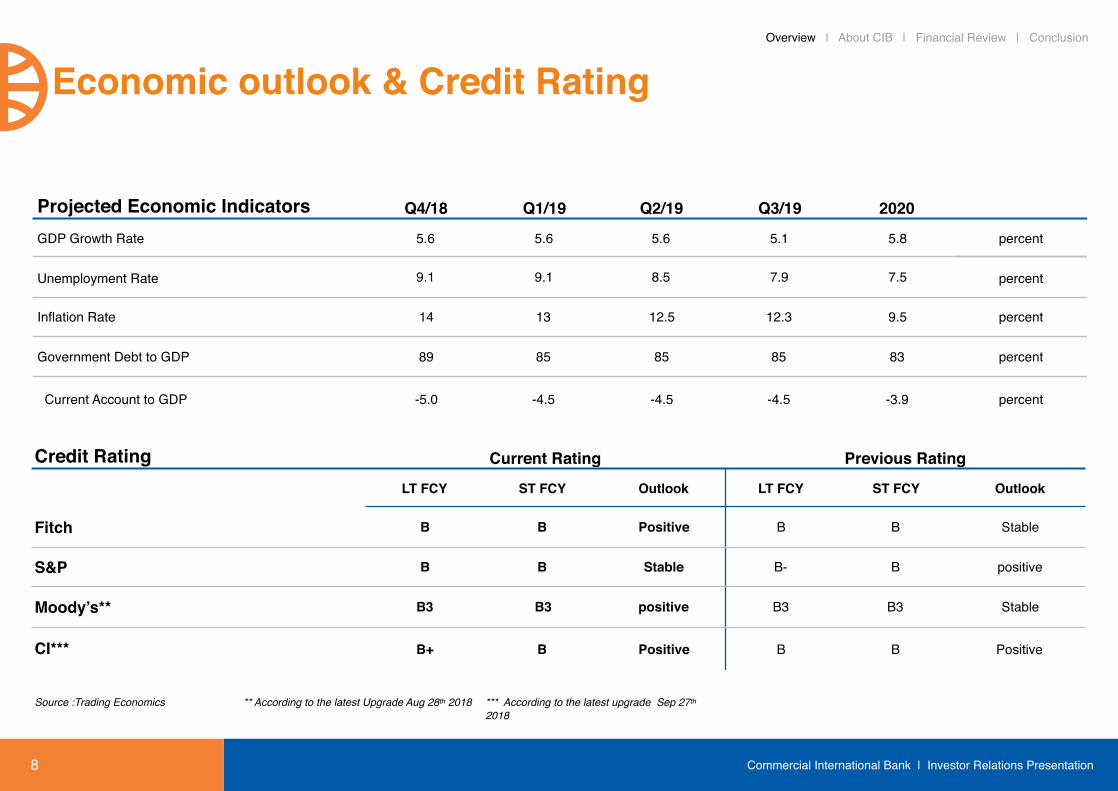
Economic outlook & Credit Rating
Source :Trading Economics ** According to the latest Upgrade Aug 28th 2018 *** According to the latest upgrade Sep 27th 2018
Projected Economic Indicators Q4/18 Q1/19 Q2/19 Q3/19 2020 GDP Growth Rate 5.6 5.6 5.6 5.1 5.8 percent
Unemployment Rate 9.1 9.1 8.5 7.9 7.5 percent
Inflation Rate 14 13 12.5 12.3 9.5 percent
Government Debt to GDP 89 85 85 85 83 percent
Current Account to GDP -5.0 -4.5 -4.5 -4.5 -3.9 percent
Credit Rating Current Rating Previous Rating
LT FCY ST FCY Outlook LT FCY ST FCY Outlook
Fitch B B Positive B B Stable
S&P B B Stable B- B positive
Moody’s** B3 B3 positive B3 B3 Stable
CI*** B+ B Positive B B Positive

Commercial International Bank | Investor Relations Presentation
Overview | About CIB | Financial Review | Conclusion
�9
Egypt’s Banking Sector
Total loans (EGP bn)
Loan growth (%)
Total deposits (EGP bn)
Deposit growth (%)
LDR (%)
Underleveraged
* After The Bank of Nova Scotia and The National Bank of Oman obtained approvals to cease operations in Egypt **GDP by expenditure at market price, Data as of June’18***As of August 2018 Figures as per CBE
Total # of banks: 38*Total bank lending facilities/GDP: 49.05%**Corporate loans/GDP: 40.35%**Household debt/GDP: 8.70%**Loans/Deposits: 45.26%***
10/11 11/12 12/13 13/14 14/15 15/16 16/17 Aug-18
1621
1418.4
937
713.66584545503471
10/11 11/12 12/13 13/14 14/15 15/16 16/17 Aug-18
3606
3042
21231740
143411911027965
10/11 11/12 12/13 13/14 14/15 15/16 16/17 June-18
49% 49%46%
41% 41%44% 46% 46%
10/11 11/12 12/13 13/14 14/15 15/16 16/17 17/18
1.51%6.79% 8.35% 7.16%
22.26%
31.23%
51.33%
14.16%
10/11 11/12 12/13 13/14 14/15 15/16 16/17 17/18
7.22% 6.42%
15.97%20.32% 21.42% 22.01%
43.29%
17.34%

Commercial International Bank | Investor Relations Presentation
Overview | About CIB | Financial Review | Conclusion
�10
Egypt’s Banking Sector (Cont’d)
Total # of branches
Total # of debit cards (‘000)*
Total # of ATMs
Total # of credit cards (‘000)
Total # of POS
Banking Reforms
Phase I (2005-2008): completedPhase II (2009- 2011): improving regulatory environment, adopting Basel II, increased focus on corporate governance, limit concentrated risk exposure and proprietary investmentPhase III (2011-2012): finalized fine-tuning of regulationsPhase IV (Ongoing): parallel run of existing regulations on capital adequacy and Basel II, finalizing data warehousing framework, final regulations on leverage ratio, 2nd discussion paper on LCR and NSFR, final regulations on ICAAP, Capital conservation buffer
* Including the number of prepaid debit cards from June 2013 until June 2015
17/18
16/17
15/16
14/15
13/14
12/13
11/12
10/11 3,573
3,610
3,651
3,710
3,766
3,882
4,009
4,155 17/18
16/17
15/16
14/15
13/14
12/13
11/12
10/11 4,953
5,489
6,283
6,870
7,855
9,031
10,701
11,754 17/18
16/17
15/16
14/15
13/14
12/13
11/12
10/11 32,911
40,046
45,716
51,384
55,876
64,349
68,630
72,503
17/18
16/17
15/16
14/15
13/14
12/13
11/12
10/11 10,636
11,193
12,677
13,910
16,243
13,201
17,562
15,829 17/18
16/17
15/16
14/15
13/14
12/13
11/12
10/11 1,738
1,790
2,100
2,334
2,575
3,825
5,858
4,365

Commercial International Bank | Investor Relations Presentation
Overview | About CIB | Financial Review | Conclusion
�11
Why Egypt?
Economic Environment
New Suez Canal New Cairo Administrative CapitalDevelopment Passage in Western Desert Golden Triangle in the SouthNorth Coast development plan1.5 million feddan reclamation project in New Valley
Attracts Investments
Mega Projects
Unveiling opportunities within SMEsInitiative to pay government employees via debit cardsIntegration of grey economyAttracting retail into banks (over 80% of adult population unbanked)
Financial Inclusion
Economy faced rising imbalances that led to weakening growth, high public debt, a widening current account deficit, and low official reserves hence the need for reformLiberalization of foreign exchange system to eliminate forex exchange shortages and encourage investment and exportsMonetary policy aimed at containing inflationTarget to decrease budget deficit to contain public debt by collecting more revenues through progressive taxation and cutting expenditure through eliminating fuel and energy subsidiesStrengthening social safety nets by increasing spending on food subsidies and cash transfers such as Takaful and Karama.Far-reaching structural reforms to promote higher and inclusive growth, increasing employment opportunities for youth and women
Reform Policy
Political Stability
Approved IMF Loan signaling a tremendous confidence boost in Egypt's ability to release its economic potential in a sustainable way Broad and increasing local consumer baseGovernment has finalized the new investment law, new industrial license act and the new bankruptcy law which will increase domestic investment & attract FDILow labor costs
Building new political structure General optimism about the political future in EgyptMoving to a more open political system
Among the most diverse in the MENA region

Commercial International Bank | Investor Relations Presentation
Overview | About CIB | Financial Review | Conclusion
�12
CIB at a Glance
1975 1987 1993 1996 1998 2006 2009 2014
Chase National Bank established
Chase Divestiture: Renamed CIB
IPO raising US$ 115mn; 150% oversubscribed
GDR US$ 120mn 22.2% of share capital
Strategic subsidiaries established to complement our core business
International Rating by S&P and Fitch: BBB-
Consortium led by Ripplewood; acquired
NBE 19% Stake
RW led consortium divested half
its holdings in to Actis
RW sold its remaining stake in CIB, marking
transition of strategic
partnership to Actis
Actis Sold 2.6% in open market in
March
Actis Sold remaining 6.5%
to Fairfax Financial Holdings Ltd
“Fairfax” in May

Commercial International Bank | Investor Relations Presentation
Overview | About CIB | Financial Review | Conclusion
�13
CIB’s Key Milestones
1975 1987 1993 1996 1997
1977 1989 1994 1997
First joint venture bank in Egypt; Chase National Bank
First private sector bank to create a dedicated division providing 24/7 banking services to shipping clients, with primary focus on business in Suez Canal
Following Chase Manhattan divesture due to a shift in their strategy, the Bank’s name was changed to Commercial International Bank (CIB)
CIB has been selected by the IATA to act as the BSP agent in Egypt, and remains the sole bank that offers this service to airline passengers
Egypt’s largest local bank IPO, oversubscription of 150% , 1.5 mn shares sold generating EGP 390 mn in proceeds
First Egyptian bank to have a GDR program on LSE
First bank to connect with the international SWIFT network
CIB concludes first & largest Euro syndicated loan (USD 200 mn)
First private sector bank with investment rating ‘BBB -‘ by S&P
First private sector bank with investment rating ‘BBB -‘ by Fitch IBCA
1998
2001
2005
• First Egyptian bank to register on NYSE; ADR Level 1
• First bank to introduce FX services for 5 currencies on ATM
• Only bank in Egypt to be awarded JP Morgan Quality Recognition Award (2005-2012)
• First bank in Egypt to execute EGP 200 mn R’epo transaction in the local market
2006

Commercial International Bank | Investor Relations Presentation
Overview | About CIB | Financial Review | Conclusion
�14
CIB’s Key Milestones (Cont’d)
2015
• First Egyptian bank to successfully pass external quality assurance on Internal Audit function
• First bank in Egypt to recognize conduct risk and establish a framework for it, despite the lack of regulatory requirement
• Only Egyptian bank recognized as ‘Best Bank in Egypt’ by 4 publications in the same year; Euromoney, Global Finance, EMEA Finance, & The Banker
2009• First Egyptian bank to establish a GTS
department• First and only local bank in Egypt to begin
enforcing Business Continuity Standards• CIB Foundation becomes the first in
Egypt to have its annual budget institutionalized as part of its founding institution’s by-laws, as CIB shareholders unanimously agreed to dedicate 1% of Bank’s net annual profit to the Foundation
2010
2012
• First Egyptian bank to establish a Sustainable Development Department
2013
• First Egyptian bank to receive JP Morgan Elite STP Award
• First Egyptian bank to upgrade its ADR to be traded on OTCQX platform US
2014
• First Egyptian bank to sign agreement with MCDR to issue debit cards for investors to collect cash dividends
• First co-branded credit card; Mileseverywhere, with EgyptAir
• First block trading transaction on the EGX, when Actis sols its 6.5%
• stake in CIB to Fairfax
2016
• Launched its mobile banking application, with various banking services and numerous features to conveniently manage the clients’ accounts
• First Egyptian bank recognized as an active member in the globally renowned United Nations Environmental Program - Financial Initiative
• For the first time in the Middle East and Africa, CIB was awarded “World’s Best Bank in the Emerging Markets” by Euromoney
• Won the ‘Socially Responsible Bank of the Year 2016’ award from African Banker
• Recognized for the first time for several awards, including:
• Best Bank in Egypt Supporting Women Owned and Women Run Businesses by the American Chamber of Commerce in Egypt
• Two awards in Achievement in Liquidity Risk and Operational Risk for Middle East & Africa by Asian Banker for 2016
• Best Retail Risk Management Initiative by Asian Banker for 2016
• Middle East Most Effective Recovery 2016 by BCI

Commercial International Bank | Investor Relations Presentation
Overview | About CIB | Financial Review | Conclusion
�15
Ownership
Ownership
CIB’s Associates
32.5%
23.5%
Private security
Premises protection
Cash-in-Transit (CIT)
Electronic security system
solutions
General and facility
management services
Touristic and governmental
concierge services
Registration and
Application Services
Loans and Credit Cards
Payment
Retail Cash Deposit and Withdrawals
Local and International Remittances
Drop In and Collection Services
Profile: Offers a full suite of security services;
Profile: an “Agent Bank” financial services;
ATM Outsourcing
Services
Fawry Plus is a newly established Joint Venture offering an “Agent Bank” financial services that acts on behalf of another bank or group of banks, which is an innovative delivery model that brings financial services providers closer to millions of un-banked population. “Fawry Plus” is expected to start operations in H2’2018
* CI Capital is now within the available for sale investment portfolio.On the back of CI Capital's Initial Public Offering and Capital Increase, CIB's stake in CI Capital was diluted to reach 7.56%.

Commercial International Bank | Investor Relations Presentation
Overview | About CIB | Financial Review | Conclusion
�16
• Retail customers (with special focus on Wealth and Plus)
• Business Banking (SMEs)
• The take-off for a world class consumer banking franchise
• Large and medium-size corporates (MNCs, institutions and banks)
• Project finance and syndicated loans• Treasury and capital Markets Services• Transactional banking services
• Market leader• Prime contributor to profitability
20.3%79.7%
74.8%25.2%
1,304,23511,227
Lines of Business
ProfileInstitutional Banking Consumer Banking
Profile
Focus
Contribution to loans
Contribution to deposits
# of customers
The information and figures are based on Managerial Accounting and according to CIB’s internal organization chart

Commercial International Bank | Investor Relations Presentation
Overview | About CIB | Financial Review | Conclusion
�17
Business Banking
• Launched unsecured lending products
• Expanded coverage area
• Built-up strong relationship team focused on larger corporates
• Launched segment based distribution model
• Launched simpler & faster turnaround products and bundles for small segment
• Accredited team members ‘Small Business Consultant”
• New digital channel platform launched for trade & cash management
• Innovative lending data based eligibility system
• New predictive models to detect fraud and provide early warning signals for borrowers with a high degree of accuracy
Formal launch with liability-led strategy
2013 2015 2016 2017 20182011
Serves SMEs and non-borrowing Corporates through a comprehensive range of financial solutions.
Covers all sectors and industries through over 100 highly trained Relationship Managers across Egypt.
Customer Segmentation
Large Business
MediumBusiness
SmallBusiness
CBE Segment Definition (Client Revenue)
Full Range of Financial Solutions
Above EGP 200mn
50mn-200mn
1mn-50mn
Deposit & Cash Management Products
Flexible Tailored Products
Fast loans, product bundles and e-solutions
2010
Pilot launch

Commercial International Bank | Investor Relations Presentation
Overview | About CIB | Financial Review | Conclusion
�18
Our Stock in a Nutshell
*Normalized after stock dividend as of 24/3/2016 ***As of 11/7/2018CIB’s market cap surpassed EGP 100bn in July, the highest ever in EGX history and 1st time a listed company reaches this Source: Bloomberg
Stock Activity*: COMI vs. EGX30
0
150
300
450
600
Mar-07 Aug-07 Jan-08 Jun-08 Nov-08 Apr-09 Sept-09 Feb-10 Jul-10 Dec-10 Jun-11 Nov-11 Apr-12 Sept-12 Feb-13 Jul-13 Dec-13 May-14 Oct-14 Mar-15 Aug-15 Jan-16 Jun-16 Jan-17 Jun-17 Nov-17 Apr-18
CIB Index EGX Price EGX30 Index
2012 2013 2014 2015 2016 2017 YTD 2018***Market Cap. (EGP) 20,646mn 29,329mn 44,673mn 43,691mn 93,463mn 94,826mn 94,011.7mn
Avg. Daily Volume 1.58mn 0.90mn 2.20mn 1.59mn 1.68mn 0.379mn 0.426mn
Avg. Daily Price (EGP) 18.85 24.26 41.30 42.30 46.67 78.43 83.50
Share Information 52 Weeks Performance
High EGP 96.50Low EGP 72.00
Shares outstanding 1,166,833,100Par value EGP 10.00 GDR convertibility 1:1
STOCK EXCHANGES TICKER
Listed Egyptian Stock Exchange (EGX) COMI
Listed London Stock Exchange (LSE) CBKD
Traded OTCQX Int’l Premier (Level 1 ADR prog.) CIBEY

Commercial International Bank | Investor Relations Presentation
Overview | About CIB | Financial Review | Conclusion
�19
Shareholding Structure
* Several wholly owned subsidiaries of Fairfax Financial Holdings Ltd (“Fairfax”)
Free Float by Region
Free Float by Category
North America (57.44%)Africa (13.47%)GCC (11.09%)UK & Ireland (7.46%)Continental Europe (6.39%)Rest of the World (4.15%)
Free Float (93.4%) Fairfax (6.6%)*Institutions (92.68%)Retail (7.32%)

Commercial International Bank | Investor Relations Presentation
Overview | About CIB | Financial Review | Conclusion
�20
❑ Reached 47 K Careem captains who are enrolled to Smart wallet platform.
❑ Acquired New to bank clients over Smart wallet through Fawry Plus ( Service provider) with around 53 K wallets.
Our Presence in Egypt
Figures are Year-to-Date (YTD)
Digital Banking InitiativesCIB’s footprint
Distribution Network Digital Banking
Total Branches and Units
Cairo
Alexandria
Sinai and Canal
Delta
Upper Egypt and Red Sea
Call Center Calls
IVR calls
Internet Banking Users
Smart Wallet Users
Mobile Banking Downloads
201
119
27
25
14
16
7,501,290
3,248,071
1,238,401
407,476
342,684
245,557
Website Visits
13,142
888 ATMs
POS

Commercial International Bank | Investor Relations Presentation
Overview | About CIB | Financial Review | Conclusion
�21
Corporate Governance
This commitment is supported by several mandates:
Internal policies, risk controls, and manuals have been put in place to ensure that all business aspects are not only covered, but well-governed (including risk management, compliance, audit, remuneration, evaluation, succession planning, code of conduct, and budgeting)Segregation of the role of Executive Management and Board of DirectorsDedicated Corporate Governance teamHighly skilled Investor Relations team
The Board’s main responsibilities include:
Setting the Bank’s overall strategy and overseeing its executionEstablishing internal control mechanismsSetting the Bank’s risk appetite and regularly monitoring performance indicators against approved, defined appetiteApproving IT Group strategy and review it periodically, especially with regards to the confidentiality of the Bank’s informationEnsuring that shareholders’ interests are being catered to
The Board carries on with its mandate to continuously improve the overall corporate governance framework by regularly reviewing and supervising the Bank’s practices
Commitment to Sound Corporate Governance Practices Continues to Define CIB
We take pride in our strong corporate governance structures which include:
Experienced team of professional executive directors and senior
management
Distinguished group of non-executive directors Competent board committees

Commercial International Bank | Investor Relations Presentation
Overview | About CIB | Financial Review | Conclusion
�22
Board of Directors
The Board and its committees are governed by well-defined charters that sets out its responsibilities and composition requirementsThe Board is supported by internal and external auditors
*Board composition for new term 2017-2019
CIB’s Board consists of 9 members;7 are non-executive and 5 are independent*
Hisham Ezz Al-Arab
Hussein Abaza
Jawaid Mirza
Yasser Hashem
Mark Richards
Sherif Kamel
Bijan Khosrowshahi
Amani Abou-Zeid
Magda Habib
Chairman and Managing Director
Chief Executive Officer and Board Member
Independent, Non-Executive Board Member
Non-Executive Board Member
Independent, Non-Executive Board Member
Independent, Non-Executive Board Member
Non-Executive Board Member
Independent, Non-Executive Board Member
Independent, Non-Executive Board Member
8 committees assist in fulfilling the Board’s responsibilities;
Audit Committee
Corporate Governance & Nomination Committee
Risk Committee
Operations & IT Committee
Compensation Committee
High Lending & Investment Committee
Management Committee
Non-executive
Executive

Commercial International Bank | Investor Relations Presentation
Overview | About CIB | Financial Review | Conclusion
�23
• Positioned as trade finance hub for Egypt & Africa• Focus on SMEs & underpenetrated retail banking segment• Capture the pent-up CAPEX and investments inflow on the
back of expected economic recovery
• Deepen understanding of customer behavior through data analytics
• Adding granularity to customer segments for a behavioral and lifestyle approach
• Development of need-based bundled value propositions
• Focus on operational efficiency , automation and productivity gains
• Digitize banking experience and work towards straight through processing
• Enforcing advanced business continuity, and security management best practices including cyber security
• Enforcing a social and environmental management system• Become Egypt’s number 1 “Green Bank”• Development in human capital and alignment to
accommodate with the digital transformation
Tomorrow
Our Strategy
Financial PerformanceDrivers
Quality loan growth, with focus on increasing product penetration and SoW
Deposit growth, specially from households
Transactional banking services
Customer Centricity
Adopting a customer relationship model
Offering bundled financial solutions and value-added services
Undertaking several service quality initiatives to improve customer satisfaction
Operational Efficiency
Centralization of Operations
Automation and process re-engineering
Core system upgrade
Organizational Development
Focus on learning and development
Reduction in our ecological footprint
Adoption of corporate governance best practices and solid CSR strategy
Today

Commercial International Bank | Investor Relations Presentation
Overview | About CIB | Financial Review | Conclusion
�24
Business Continuity & Resilience Management
Pioneer in implementing international standards and best practices; established in 2010; ahead of all major players in the market
Set a unique model within the Egyptian financial sector in Business Continuity industry; since 2014, CIB was shortlisted for 12 global and regional Business Continuity excellence awards from 3 of the most reputed organizations in the BCM industry worldwide. The bank is also ISO22301 Certified in Business Continuity.
Award winner of “Middle East Most Effective Recovery 2016” by Business Continuity Institute-UK (BCI) & “Business Continuity Team of the Year 2015” from Disaster Recovery Institute International-USA (DRII)
Certified ISO22301 in Business Continuity as the first Egyptian private bank to obtain this reputable accolade
Initiatives
CIB continues to invest in further improving its business continuity and recovery capabilities to ensure it provides sustainable and uninterrupted services to our customers
Progressive Disaster Recovery PlanningContinuous Alternate Sites EnhancementMoving towards Resilience ManagementCritical Suppliers ManagementAutomation and Performance Metrics Management

Commercial International Bank | Investor Relations Presentation
Overview | About CIB | Financial Review | Conclusion
�25
Cyber & Information Security
Security is a major area of focus for CIB; established in 2010; ahead of all major players in the market
Strong Security Governance & policies aligned with International Standards and Best Practices.
Certified Payment Cards Industry – Data Security Standards (PCI-DSS) since 2017.
Dedicated Information Security Compliance and Controls departments responsible for ensuring Bank maintains security posture status
Cyber Security Operations Center (SOC) for ongoing Monitoring and response for Security threats considered the first SOC operating with full in-house capabilities in the financial sector in Egypt, when launched in 2017.
Commitment towards a safer operational and business environment that supports the organization and customers’ benefits and well-being
Initiatives
CIB continues to invest in further improving its Cyber & Information Security capabilities to continuously protect its customers’, shareholders and provide secure banking services and unique customer experience.
Round the clock 24x7 Security Operations Center (SOC)
Focus on Data Protection
Moving towards ISO27001 Certification
Incident response Automation and efficiency
Continuous Investment in Security Infrastructure, technologies, and Workforce development

Commercial International Bank | Investor Relations Presentation
Overview | About CIB | Financial Review | Conclusion
�26
Awards and Recognition
Best Trade Finance Provider in Egypt - by
Global Finance
Best Treasury & Cash Management
Providers in Egypt - by Global Finance
Best Foreign Exchange Provider in
Egypt - By Global Finance
Best Bank in Egypt - by Global Finance
World’s Best Bank in the Emerging Markets-
Global Finance
Digital Bank of Distinction in Egypt-
Global Finance
Best Online Cash Management in Egypt-
Global Finance
Best Trade Finance Services in Egypt-
Global Finance
Best Online Portal Services in Egypt-
Global Finance
Best Information Security & Fraud
Management in Egypt- Global Finance
Best FX Services in North Africa- EMEA
Finance
Best Payment Services in North
Africa- EMEA Finance
2018
More awards available: https://www.cibeg.com/English/AboutCIB/Pages/Awards.aspx
Best Bank in Egypt - By Euromoney
Best Bank Transformation in the
Middle East - By Euromoney
Best Regional Bank - Northern Africa - By
African Banker
Best Sub custodian Bank in Egypt - by
Global Finance

Commercial International Bank | Investor Relations Presentation
Overview | About CIB | Financial Review | Conclusion
�27
REVENUESNPATROAEROAA
TOTAL ASSETSNET LOANS
NPLs/GROSS LOANS*COVERAGE RATIO*
CUSTOMER DEPOSITSLOAN TO DEPOSIT RATIO*
SHAREHOLDERS’ EQUITYCAR
EGP 15,163 mnEGP 7,019mn
31.8%3.01%
EGP 327,283mnEGP 104,432 mn
4.64%240%
EGP 280,581 mn41.93%
EGP 30,376 mn19.08%
EGP 11,030 mn; 9M17EGP 5,648 mn; 9M17
31.4%; 9M172.74%; 9M17
EGP 294,782 mn; Q4’17EGP 88,428 mn ;Q4’17
6.95%; Q4’17154 %; Q4’17
EGP 250,723 mn; Q4’1740.80%; Q4’17
EGP 28,439 mn; Q4’1718.0%; Q4’17
37% YoY24% YoY1% YoY10% Yoy
11% YtD18% YtD
-33% YtD56% YtD
12% YtD3% YtD
7% YtD6% YtD
Performance Snapshot: YTD 2018
*Ratios on a standalone basis This slide shows CIB’s 9M18 performance Figures on a consolidated basis unless otherwise stated
Commentary Comparison9M2018Key Indicators
Profitability
Assets
Funding
Equity & Capital
NIM*COST/INCOME
6.50%19.1%
4.94%; 9M1719.9%; 9M17
32% YoY -4% YoY
Efficiency
Asset Quality

Commercial International Bank | Investor Relations Presentation
Overview | About CIB | Financial Review | Conclusion
�28
Performance Snapshot: Profitability
Net Profit After Tax
Cost to Income& Expenses
Fees & Commission Break-down
Revenue Breakdown
Interest Income Break-down
*Ratios on a standalone basis This slide shows CIB’s YTD’ 2018 performance, figures on a consolidated basis unless otherwise stated figures stated in millions
0
2,000
4,000
6,000
8,000
9M15 9M16 9M17 9M18
7,019
5,6484,458
3,583
24%
24%27%
'-
4,250
8,500
12,750
17,000
9M15 9M16 9M17 9M18
15162.56
11030.3182017434
1854.4
1720.611351527 13308.203
9309.70170665907
Net Interest IncomeNon-Interest IncomeTotal Revenue
'-
7,500
15,000
22,500
30,000
9M15 9M16 9M17 9M18
27150.333
21008.359
13486.62310697.287
160.5
137.97
88.4574.3
13031.6449658.333
6954.2226656.455
13958.18911212.0536443.9513966.529
Credit Interest Treasury Bills Debt InstrumentsTotal Revenue
'(300)
575
1,450
2,325
3,200
9M15 9M16 9M17 9M18
2464.1732019.148
1385.7261382.3141274.686
890.948
669.958551.31195.00688.806
52.56960.4591094.4811039.394
663.199770.544
Credit Related Custody Fees Other Fees Total
18.00%
19.00%
20.00%
21.00%
22.00%
0
750
1,500
2,250
3,000
9M15 9M16 9M17 9M18
Adminstrative expenses Cost/Income
19.08%
20.47%
21.56%
19.20%2,948
2,2631,794
1,40919.20%
21.56%
20.47%
19.08%
0.00%
1.75%
3.50%
5.25%
7.00%
9M15 9M16 9M17 9M18
5.58% 5.68%4.94%
6.50%
Net Interest Margin

Commercial International Bank | Investor Relations Presentation
Overview | About CIB | Financial Review | Conclusion
�29
Performance Snapshot: Balance sheet
*Ratios on a standalone basis This slide shows CIB’s Q3 2018 performance, figures on a consolidated basis unless otherwise stated figures stated in millions
Split of Assets by type
Loans Breakdown Q3’ 2018
Loan portfolio by industry Q3’2018
Deposits Breakdown Q3’2018
20%
19%
24%1%2%
33%
2%FIManufacturingRel estateWholesale & retail tradeGovOther activitiesIndividual
Q3'18
Q2'18
Q1'18
Q4'17
Q3'17
'- 87,500 175,000 262,500 350,000
282885.66
294782
309749
312179.35
327282.32
7869.6
8850
10215
9853
12727.1
65403.257
75748
82634
78552
79394.691
87997.41
88428
95304
107082.69
104431.37
4599.5
7295
7170
6906.1
4113.1
54950.08
54478
45937
33938.9
48324.43
38891.26
45320
42307
51245.31
45038.6
23174.63
14663
26182
24601.35
33253.11
Cash & balances with CBE Due from Banks T-Bills Trading Financial AssetsLoans & Advances Investments Fixed & other assets Total assets
'-
75,000
150,000
225,000
300,000
Q3'17 Q4'17 Q1'18 Q2'18 Q3'18
117640.768119889.74108061.253102400.022101762.565
57563.25360615.67752323.17848834.62148613.817
60077.51559274.06355738.07553565.40153148.748
LCY FCY Total Loans
'-
150,000
300,000
450,000
600,000
Q3'17 Q4'17 Q1'18 Q2'18 Q3'18
280581.214266826.432256077.525250723.052247733.684
99119.93399304.88999916.23398010.51598739.205
181461.281167521.543156161.292152712.537148994.479
LCY FCY Total deposits

Commercial International Bank | Investor Relations Presentation
Overview | About CIB | Financial Review | Conclusion
�30
4.85%
136%
4.41%
155%
5.26%
158%
Performance Snapshot: Asset Quality
*Ratios on a standalone basis This slide shows CIB’s Q3 2018 performance Figures on a consolidated basis unless otherwise stated Figures stated in millions**Gross NPLs
NPLs by segment** (EGP Mn)
*NPL Ratio
*Coverage
9M159M14 9M16
6.94%
155%
9M17
Q3'18
Q2'18
Q1'18
Q4 '17
Q3'17
'- 1,875 3,750 5,625 7,500
7061.606
7120.106
5524.87
5391.204
5458.42
351
690
129
187
210
6,710
6,430
5,395
5,204
5,249 CorporateRetailTotal
4.64%
240%
9M18

Commercial International Bank | Investor Relations Presentation
Overview | About CIB | Financial Review | Conclusion
�31
Performance Snapshot :Funding Overview
Funding Structure
Customer Deposit Mix
Demand (33.26%)CDs (27.16%)Savings (22.64%)TDs (15.15%)Other (1.79%)
CIB’s funding structure has no wholesale funds
Due to Customers (94.50%)Other Liabilities (3.8%)Other Term Loans (1.24%)Due to Banks (0.46%)

Commercial International Bank | Investor Relations Presentation
Overview | About CIB | Financial Review | Conclusion
�32
Performance Snapshot: Funding & Capital
Loans to Deposit Ratio Capitalization
*Ratios on a standalone basis figures on a consolidated basis unless otherwise stated
0.00%
11.25%
22.50%
33.75%
45.00%
9M14 9M15 9M16 9M17 9M18
43.80%40.90%
38.30%41.10% 41.90%
Loan to deposit ratio*
15.00%
17.50%
20.00%
22.50%
25.00%
26
27.25
28.5
29.75
31
Q3'17 Q4'17 Q1'18 Q2'18 Q3'18
Equity (EGP bn) CAR%
19.08%
17.93%17.87%18.03%
16.95%
30.4
28.525
27.821
28.4
26.616.95%
18.03% 17.87% 17.93%
19.08%

Commercial International Bank | Investor Relations Presentation
Overview | About CIB | Financial Review | Conclusion
�33
10-Year Performance Summary
Starting 2009, CIB used IFRS * Figure on a standalone basis ** Ratio after appropriation Figures on a consolidated basis unless otherwise stated
Years 2008 2009 2010 2011 2012 2013 2014 2015 2016 2017Branches and Units 152 155 153 154 156 152 160 187 192 196Headcount 4,014 4,426 4,750 4,845 5,181 5,490 5,697 5,983 6,714 6,551
2008 2009 2010 2011 2012 2013 2014 2015 2016 2017
Total Assets (EGP mn) ROAA%**
2.692.712.952.942.93
2.51
2.03
2.922.892.62
295,098267,544
179,500143,813
113,75293,95785,50675,42564,25557,462
2.622.89 2.92
2.03
2.51
2.93 2.94 2.952.71 2.69
2008 2009 2010 2011 2012 2013 2014 2015 2016 2017
Net Loans (EGP bn) Deposits (EGP bn) Net Loans/Deposits
35.3%36.9%36.6%40.0%43.2%
53.2%57.0%55.5%
50.0%53.8%
250.7231.7155.2121.9796.878.771.563.454.848.9
88.485.456.848.841.841.941.135.227.426.3
53.8%50.0%
55.5% 57.0%53.2%
43.2% 40.0%36.6% 36.9% 35.3%
2008 2009 2010 2011 2012 2013 2014 2015 2016 2017
Net Income (EGP mn) ROAE%**
32.534.233.431.329.5
25.520.9
28.729.929.0
7,5166,009
4,7293,7413,0062,2261,6152,0201,7441,370
29.0 29.9 28.7
20.925.5
29.5 31.333.4 34.2 32.5
2008 2009 2010 2011 2012 2013 2014 2015 2016 2017
29.9%32.3% 33.1% 35.3%
28.0%22.9% 22.9%
20.5% 21.3% 20.3%
2.97% 2.97% 2.88% 2.82% 3.63% 3.96% 4.66% 3.98%6.70% 6.95%
15.0% 16.5% 16.9% 15.4% 15.7% 16.3% 16.8% 16.1% 14.0%18.0%
CAR** NPLs/Gross Loans* Cost:income*

Commercial International Bank | Investor Relations Presentation
Overview | About CIB | Financial Review | Conclusion
�34
Position Among Peers
Total Assets (EGP Bn) Net Income (EGP Mn) Gross Loans/Deposits
ROAE ROAA Deposits Market Share
CAR Cost/Income Loans Market Share
Peer Analysis figures as of June 2018
CAE
Alex
HSBC
AAIB
QNBA
CIB 312
234
215
90
87
48 CAE
Alex
AAIB
HSBC
QNBA
CIB 4,417
3,291
2,315
2,144
1,576
1,094 CIB
HSBC
Alex
AAIB
CAE
QNBA 66.9%
53.0%
52.6%
51.0%
46.8%
44.9%
AAIB
QNBA
CIB
Alex
CAE
HSBC 43.7%
41.7%
34.9%
31.1%
28.8%
13.8% AAIB
QNBA
CIB
Alex
CAE
HSBC 5.18%
4.66%
3.84%
2.91%
2.90%
2.01%
0%
2%
5%
7%
9%
Dec-13 Dec-14 Dec-15 Dec-16 Dec-17 Jun-18
1.9% 1.7% 1.4% 1.4% 1.1% 1.1%2.6% 2.3% 2.0% 1.9% 1.9% 2.0%
3.7% 4.1% 4.3% 4.6% 4.6% 4.4%3.7% 3.5%2.7% 2.6% 2.0% 2.0%
5.1% 5.5% 5.7% 5.8% 5.6% 5.4%
7.4% 7.8% 8.1% 8.4%7.5% 7.5%
CIB QNBA HSBC AAIB Alex CAE
0%
2%
5%
7%
9%
Dec-13 Dec-14 Dec-15 Dec-16 Dec-17 Jun-18
2.3% 2.1% 1.9% 1.5% 1.2% 1.3%
3.6% 3.3% 2.8% 2.4% 2.1% 2.1%
4.1% 3.7% 3.4%2.5% 2.4% 2.3%
4.7% 5.1% 4.9% 5.3% 5.5% 5.0%7.7% 8.0% 8.1% 7.5% 8.1% 7.9%
8.3% 8.5%8.0% 7.6% 7.0% 7.4%
CIB QNBA AAIB ALEX HSBC CAE
QNBA
CIB
Alex
CAE 19.6%
19.6%
17.9%
16.9% AAIB
CIB
QNBA
HSBC
CAE
Alex 34.7%
27.9%
25.9%
25.9%
21.1%
19.1%

Commercial International Bank | Investor Relations Presentation
Overview | About CIB | Financial Review | Conclusion
�35
Market Share
Sept-12 Dec-12 Mar-13 Jun-13 Sept-13 Dec-13 Mar-14 Jun-14 Sept-14 Dec-14 Mar-15 Jun-15 Sept-15 Dec-15 Mar-16 Jun-16 Sept-16 Dec-16 Mar-17 Jun-17 Sept-17 Dec-17 Mar-18 Jun-18 Jul-18 Aug-18
7.48%7.23%
7.51%7.67% 7.65%
7.37%7.56%
7.75%7.91% 7.84%
8.18% 8.22%8.37%
8.12%
8.45%
7.99%8.09%
8.40% 8.36%
8.06%7.80%
7.53%7.35%
7.48%7.66% 7.65%
8.52% 8.58% 8.52%8.32% 8.25% 8.28% 8.27%
8.43% 8.45% 8.54% 8.57%8.35%
8.18%7.95% 7.90%
7.20%7.03%
7.56%7.40% 7.32%
7.15%7.00% 6.97%
7.36%7.23% 7.26%
Total Loans Total Deposits
Loan Market Share as of Aug.’18 Deposit Market Share as of Aug.’18
Total Loans 7.26%
LCY Loans 5.55%FCY Loans 10.55%Household Loans 7.94%Institutional Loans 7.11%
Total Deposits 7.65%
LCY Deposits 6.41%FCY Deposits 11.65%Household Deposits 7.18%Institutional 8.62%
Latest available published ratios

Commercial International Bank | Investor Relations Presentation
Overview | About CIB | Financial Review | Conclusion
�36
Why CIB?
CIB’s financial performance Q3’2018 *Ratio on a standalone basis Figures on a consolidated basis unless otherwise stated ** As of 11/7/2018
Extremely skilled and experienced
Management Team
Highly qualified Board of Directors
Among the best Investor Relations
teams
Strong brand equity in the market
Conservative provisioning
policies
Prudent credit policies
Profitability
Asset Quality
Liquidity
KPIs
Largest in
Total revenues EGP 6,014mnNPAT EGP 2,595mn
Direct Coverage Ratio 240%*NPL/Gross loans 4.64%*
Gross LDR 41.93%High liquidity
ROAE 35.24%ROAA 3.25% Cost/income 16.77%
Deposits EGP 281bn
Total Assets EGP 327bn
Market Cap EGP 94bn**

Commercial International Bank | Investor Relations Presentation
Overview | About CIB | Financial Review | Conclusion
�37
Thank You!
For more information, please visit our website; www.cibeg.comTo read about the projects that the CIB Foundation has helped support, and to know ways in which you can donate, please visit www.cibfoundationegypt.org
Investor Relations contacts:
Sherif KhalilChief Communications Officer
Yasmine HemedaHead of IR
Nelly El ZeneinyIR Officer
Aya AboushadyIR Analyst
Headquarters:Nile Tower Building21/23 Charles De Gaulle St., GizaP.O Box 2430 CairoEgypt
Customer Service Hotline: 1966624/7 dedicated customer service short number


![Investor Relations - hanatourcompany.comhanatour]ir_presentation_june... · Investor Relations 1 Investor Relations Jun. 2009.(Korean) 2 ... (cf. 국내소비0.3% 증가, 자료:한국은행,2006)](https://img.dokumen.tips/doc/110x75/5a881d307f8b9a87368ecd91/investor-relations-hanatourirpresentationjuneinvestor-relations-1-investor.jpg)