Embed Size (px)
Citation preview

OFFERING CIRCULAR
6,000,000 Shares
5.125% Non-Cumulative Preferred Stock, Series L(stated value $50 per share)
This OÅering Circular relates to the oÅer of 6,000,000 shares of the 5.125% Non-Cumulative PreferredStock, Series L (the ""Preferred Stock'') of the Federal National Mortgage Association (""Fannie Mae''). ThePreferred Stock has a stated value and liquidation preference of $50 per share. Dividends at the rate of 5.125%per year will accrue from and including April 29, 2003. We will be required to pay dividends quarterly onMarch 31, June 30, September 30 and December 31 of each year, commencing June 30, 2003. However, we will berequired to pay dividends only when, as and if declared by our Board of Directors, or a duly authorized committeethereof, in its sole discretion out of funds legally available for such payment. The amount of dividends we will berequired to pay, if our Board declares them, may be increased if legislation is enacted that changes the InternalRevenue Code of 1986, as amended, to reduce the dividends-received deduction applicable to dividends on thePreferred Stock as set forth under ""Description of the Preferred StockÌDividendsÌChanges in the Dividends-Received Percentage.''
Dividends on the Preferred Stock will not be cumulative. Accordingly, if for any reason our Board ofDirectors does not declare a dividend on the Preferred Stock for a dividend period, we will have no obligation topay a dividend for that period, whether or not our Board declares dividends on the Preferred Stock for any futuredividend period. If, however, we have not paid or set aside for payment dividends on the Preferred Stock for adividend period, we may not pay dividends on our common stock for that period.
On or after April 29, 2008, we may redeem the Preferred Stock, in whole or in part, at any time or from timeto time, at our option at the redemption price of $50 per share plus the dividend (whether or not declared) forthe then-current quarterly dividend period accrued to but excluding the date of redemption.
The Preferred Stock will not have any voting rights, except as set forth under ""Description of the PreferredStockÌVoting Rights; Amendments.''
We will apply to list the Preferred Stock on the New York Stock Exchange (the ""NYSE'') under the symbol""FNMprL.'' If approved for listing, we expect trading of the Preferred Stock on the NYSE to commence within athirty-day period after the initial delivery of the Preferred Stock.
Our obligations under the terms of the Preferred Stock are only our obligations and are not thoseof the United States or of any instrumentality thereof other than Fannie Mae.
Initial Public Underwriting Proceeds toOÅering Price(1) Discount Fannie Mae(1)(2)
Per ShareÏÏÏÏÏÏÏÏÏÏÏÏÏÏÏÏÏÏÏÏÏÏÏÏÏÏÏÏÏÏÏÏÏÏÏÏÏÏÏÏÏ $50.00 $0.4375 $49.5625
Total(3)ÏÏÏÏÏÏÏÏÏÏÏÏÏÏÏÏÏÏÏÏÏÏÏÏÏÏÏÏÏÏÏÏÏÏÏÏÏÏÏÏÏÏ $300,000,000 $2,625,000 $297,375,000
(1) Plus accrued dividends, if any, from April 29, 2003.
(2) Before deducting estimated expenses of $300,000.
(3) Fannie Mae has granted the Underwriters an option to purchase up to an additional 900,000 shares of Preferred Stock to coveroverallotments, if any. If all such shares are purchased, the total Initial Public OÅering Price, Underwriting Discount andProceeds to Fannie Mae will be $345,000,000, $3,018,750 and $341,981,250, respectively. See ""Underwriting''.
Lehman Brothers Goldman, Sachs & Co.
Bear, Stearns & Co. Inc.
Deutsche Bank Securities
Utendahl Capital Partners, L.P.
The date of this OÅering Circular is April 24, 2003.

We are not required to register the Preferred Stock under the U.S. Securities Act of 1933, as amended.Accordingly, we have not Ñled a registration statement for the Preferred Stock with the U.S. Securities andExchange Commission (the ""SEC''). The shares of Preferred Stock are ""exempted securities'' within themeaning of the U.S. Securities Exchange Act of 1934, as amended (the ""Exchange Act''). Neither the SECnor any state securities commission has approved or disapproved the Preferred Stock or determined if thisOÅering Circular is truthful or complete. Any representation to the contrary is a criminal oÅense.
The distribution of this OÅering Circular and the oÅer, sale, and delivery of the Preferred Stock in certainjurisdictions may be restricted by law. Persons who come into possession of this OÅering Circular must informthemselves about and observe any applicable restrictions.
This OÅering Circular is not an oÅer to sell or a solicitation of an oÅer to buy any securities other than thePreferred Stock or an oÅer to sell or a solicitation of an oÅer to buy the Preferred Stock in any jurisdiction orin any other circumstance in which an oÅer or solicitation is unlawful or not authorized.
No person has been authorized to give any information or make any representations other than thosecontained in this OÅering Circular and, if given or made, such information or representations must not berelied upon as having been authorized. Neither the delivery of this OÅering Circular nor any sale madehereunder shall, under any circumstances, create an implication that there has been no change in the aÅairs ofFannie Mae since the date hereof, or in the case of facts set forth in the documents incorporated by referenceherein, since the respective dates thereof or that the information contained herein or therein is correct as toany time subsequent thereto.
TABLE OF CONTENTS
Description Page
Summary of the OÅering ÏÏÏÏÏÏÏÏÏÏÏÏÏÏÏÏÏÏÏÏÏÏÏÏÏÏÏÏÏÏÏÏÏÏÏÏÏÏÏÏÏÏÏÏÏÏÏÏÏÏÏÏÏÏÏÏ 3Fannie Mae ÏÏÏÏÏÏÏÏÏÏÏÏÏÏÏÏÏÏÏÏÏÏÏÏÏÏÏÏÏÏÏÏÏÏÏÏÏÏÏÏÏÏÏÏÏÏÏÏÏÏÏÏÏÏÏÏÏÏÏÏÏÏÏÏÏÏÏ 5Recent Developments ÏÏÏÏÏÏÏÏÏÏÏÏÏÏÏÏÏÏÏÏÏÏÏÏÏÏÏÏÏÏÏÏÏÏÏÏÏÏÏÏÏÏÏÏÏÏÏÏÏÏÏÏÏÏÏÏÏÏÏ 5Use of ProceedsÏÏÏÏÏÏÏÏÏÏÏÏÏÏÏÏÏÏÏÏÏÏÏÏÏÏÏÏÏÏÏÏÏÏÏÏÏÏÏÏÏÏÏÏÏÏÏÏÏÏÏÏÏÏÏÏÏÏÏÏÏÏÏÏ 9CapitalizationÏÏÏÏÏÏÏÏÏÏÏÏÏÏÏÏÏÏÏÏÏÏÏÏÏÏÏÏÏÏÏÏÏÏÏÏÏÏÏÏÏÏÏÏÏÏÏÏÏÏÏÏÏÏÏÏÏÏÏÏÏÏÏÏÏÏ 10Selected Financial Information ÏÏÏÏÏÏÏÏÏÏÏÏÏÏÏÏÏÏÏÏÏÏÏÏÏÏÏÏÏÏÏÏÏÏÏÏÏÏÏÏÏÏÏÏÏÏÏÏÏÏÏ 11Government Regulation and Charter ActÏÏÏÏÏÏÏÏÏÏÏÏÏÏÏÏÏÏÏÏÏÏÏÏÏÏÏÏÏÏÏÏÏÏÏÏÏÏÏÏÏÏÏ 13Description of the Preferred Stock ÏÏÏÏÏÏÏÏÏÏÏÏÏÏÏÏÏÏÏÏÏÏÏÏÏÏÏÏÏÏÏÏÏÏÏÏÏÏÏÏÏÏÏÏÏÏÏÏ 17Legality of Investment ÏÏÏÏÏÏÏÏÏÏÏÏÏÏÏÏÏÏÏÏÏÏÏÏÏÏÏÏÏÏÏÏÏÏÏÏÏÏÏÏÏÏÏÏÏÏÏÏÏÏÏÏÏÏÏÏÏÏ 22United States Taxation ÏÏÏÏÏÏÏÏÏÏÏÏÏÏÏÏÏÏÏÏÏÏÏÏÏÏÏÏÏÏÏÏÏÏÏÏÏÏÏÏÏÏÏÏÏÏÏÏÏÏÏÏÏÏÏÏÏÏ 23Underwriting ÏÏÏÏÏÏÏÏÏÏÏÏÏÏÏÏÏÏÏÏÏÏÏÏÏÏÏÏÏÏÏÏÏÏÏÏÏÏÏÏÏÏÏÏÏÏÏÏÏÏÏÏÏÏÏÏÏÏÏÏÏÏÏÏÏÏ 26Rating ÏÏÏÏÏÏÏÏÏÏÏÏÏÏÏÏÏÏÏÏÏÏÏÏÏÏÏÏÏÏÏÏÏÏÏÏÏÏÏÏÏÏÏÏÏÏÏÏÏÏÏÏÏÏÏÏÏÏÏÏÏÏÏÏÏÏÏÏÏÏÏÏ 27Accountants ÏÏÏÏÏÏÏÏÏÏÏÏÏÏÏÏÏÏÏÏÏÏÏÏÏÏÏÏÏÏÏÏÏÏÏÏÏÏÏÏÏÏÏÏÏÏÏÏÏÏÏÏÏÏÏÏÏÏÏÏÏÏÏÏÏÏÏ 27Validity of the Preferred Stock ÏÏÏÏÏÏÏÏÏÏÏÏÏÏÏÏÏÏÏÏÏÏÏÏÏÏÏÏÏÏÏÏÏÏÏÏÏÏÏÏÏÏÏÏÏÏÏÏÏÏÏ 27Additional Information About Fannie Mae ÏÏÏÏÏÏÏÏÏÏÏÏÏÏÏÏÏÏÏÏÏÏÏÏÏÏÏÏÏÏÏÏÏÏÏÏÏÏÏÏÏ 27Reconciliation of Core Business Earnings to GAAP Reported Results ÏÏÏÏÏÏÏÏÏÏÏÏÏÏÏÏÏÏ Appendix ACertiÑcate of DesignationÏÏÏÏÏÏÏÏÏÏÏÏÏÏÏÏÏÏÏÏÏÏÏÏÏÏÏÏÏÏÏÏÏÏÏÏÏÏÏÏÏÏÏÏÏÏÏÏÏÏÏÏÏÏÏÏ Appendix BAnnual Report on Form 10-K for the Fiscal Year Ended December 31, 2002 ÏÏÏÏÏÏÏÏÏÏÏÏ Appendix C
2

SUMMARY OF THE OFFERING
This summary highlights information contained elsewhere in, or incorporated by reference in, thisOÅering Circular. It does not contain all of the information you should consider before investing in thePreferred Stock. You also should read the more detailed information contained elsewhere in this OÅeringCircular and in the documents incorporated herein by reference.
Fannie Mae
Fannie Mae is a federally chartered and stockholder-owned corporation organized and existing under theFederal National Mortgage Association Charter Act. We are the largest investor in home mortgage loans inthe United States. We were established in 1938 as a United States government agency to providesupplemental liquidity to the mortgage market and were transformed into a stockholder-owned and privatelymanaged corporation by legislation enacted in 1968.
Description of the Preferred Stock
Issuer ÏÏÏÏÏÏÏÏÏÏÏÏÏÏÏÏÏÏÏÏÏÏÏÏÏÏÏÏ Fannie Mae
Securities OÅered ÏÏÏÏÏÏÏÏÏÏÏÏÏÏÏÏÏÏ 6,000,000 shares (assuming the Underwriters do not exercise theiroverallotment option) of 5.125% Non-Cumulative Preferred Stock,Series L, no par value, with a stated value and liquidation prefer-ence of $50 per share.
Dividends:Dividend Rate ÏÏÏÏÏÏÏÏÏÏÏÏÏÏÏÏÏÏÏ 5.125% per annum. Non-cumulative quarterly cash dividends at
the rate of 5.125% per year will accrue from and including April 29,2003.
Frequency of Payment ÏÏÏÏÏÏÏÏÏÏÏÏ Quarterly, when, as and if declared by the Board of Directors in itssole discretion, but only out of funds legally available for thepayment of dividends.
Payment Dates ÏÏÏÏÏÏÏÏÏÏÏÏÏÏÏÏÏÏ March 31, June 30, September 30, and December 31 of each year,commencing June 30, 2003.
DRD Protection ÏÏÏÏÏÏÏÏÏÏÏÏÏÏÏÏÏ If, prior to October 29, 2004, amendments to the Internal RevenueCode of 1986, as amended, are enacted that eliminate or reducethe percentage of the dividends-received deduction below 70%, theamount of dividends payable in respect of the Preferred Stock willbe adjusted to oÅset the eÅect of such reduction. However, noadjustment will be made to the extent that the percentage of thedividends-received deduction is reduced below 50%.
Preferences ÏÏÏÏÏÏÏÏÏÏÏÏÏÏÏÏÏÏÏÏÏÏÏ The Preferred Stock will be entitled to a preference, both as todividends and upon liquidation, over the common stock (and anyother junior stock) of Fannie Mae. The Preferred Stock will rankequally, both as to dividends and upon liquidation, with all othercurrently outstanding series of Fannie Mae preferred stock.
Optional Redemption ÏÏÏÏÏÏÏÏÏÏÏÏÏÏÏ On or after April 29, 2008, we may redeem the Preferred Stock, inwhole or in part, at any time or from time to time, at our option atthe redemption price of $50 per share plus an amount equal to thedividend for the then-current quarterly dividend period accrued to,but excluding the date of redemption (whether or not declared, butwithout accumulation of any dividends for prior dividend periods).
3

Holders of Preferred Stock will have no right to require theredemption of the Preferred Stock.
Liquidation Rights ÏÏÏÏÏÏÏÏÏÏÏÏÏÏÏÏÏ In the event of any dissolution or liquidation of Fannie Mae,holders of the Preferred Stock will be entitled to receive, out of anyassets available for distribution to stockholders, $50 per share plusthe dividend for the then-current quarterly dividend period accruedthrough the liquidation payment date.
Voting Rights ÏÏÏÏÏÏÏÏÏÏÏÏÏÏÏÏÏÏÏÏÏ None, except with respect to certain changes in the terms of thePreferred Stock
Preemptive and Conversion RightsÏÏÏÏ None
RatingÏÏÏÏÏÏÏÏÏÏÏÏÏÏÏÏÏÏÏÏÏÏÏÏÏÏÏÏ The Preferred Stock has been rated ""AA¿'' by Standard & Poor'sRatings Group, a Division of the McGraw-Hill Companies, ""Aa3''by Moody's Investors Service, Inc. and AA by Fitch, Inc.
Use of Proceeds ÏÏÏÏÏÏÏÏÏÏÏÏÏÏÏÏÏÏÏ To be added to the working capital of Fannie Mae and used forgeneral corporate purposes, including the repurchase of outstand-ing shares of our stock.
Transfer Agent, Dividend DisbursingAgent and Registrar ÏÏÏÏÏÏÏÏÏÏÏÏÏÏ EquiServe Trust Company, N.A.
NYSE Listing ÏÏÏÏÏÏÏÏÏÏÏÏÏÏÏÏÏÏÏÏÏ We will apply to list the Preferred Stock on the NYSE under thesymbol ""FNMprL''. If approved for listing, we expect trading onthe NYSE to commence within a thirty-day period after the initialdelivery of the Preferred Stock.
CUSIP Number ÏÏÏÏÏÏÏÏÏÏÏÏÏÏÏÏÏÏÏ 313586844
4

FANNIE MAE
Fannie Mae is a federally chartered and stockholder-owned corporation organized and existing under theFederal National Mortgage Association Charter Act, 12 U.S.C. Û 1716 et seq. (the ""Charter Act''). See""Government Regulation and Charter Act'' in this OÅering Circular and in our Annual Report on Form 10-Kfor the Ñscal year ended December 31, 2002, Ñled with the SEC on March 31, 2003 (""Form 10-K'') and""Additional Information About Fannie Mae'' in this OÅering Circular. We are the largest investor in homemortgage loans in the United States. We were established in 1938 as a United States government agency toprovide supplemental liquidity to the mortgage market and were transformed into a stockholder-owned andprivately managed corporation by legislation enacted in 1968.
Fannie Mae provides funds to the mortgage market by purchasing mortgage loans and mortgage-relatedsecurities from lenders, thereby replenishing their funds for additional lending. We acquire funds to purchasethese loans and mortgage-related securities by issuing debt securities to capital market investors, many ofwhom ordinarily would not invest in mortgages. In this manner, we are able to expand the total amount offunds available for housing.
Fannie Mae also issues mortgage-backed securities (""MBS''), receiving guaranty fees for our guaranteeof timely payment of principal and interest on MBS certiÑcates. We issue MBS primarily in exchange forpools of mortgage loans from lenders. The issuance of MBS enables us to further our statutory purpose ofincreasing the liquidity of residential mortgage loans.
In addition, Fannie Mae oÅers various services to lenders and others for a fee. These services includeissuing certain types of MBS and credit enhancements and providing technology services for originating andunderwriting loans. See ""Business'' in the Form 10-K and ""Additional Information About Fannie Mae'' inthis OÅering Circular.
Fannie Mae's principal oÇce is located at 3900 Wisconsin Avenue, N.W., Washington, D.C. 20016(telephone: (202) 752-7000).
RECENT DEVELOPMENTS
Fannie Mae reported results for the Ñrst quarter of 2003 on April 14, 2003. These reported results arebased on generally accepted accounting principles (""GAAP''). Management also tracks and analyzes FannieMae's Ñnancial results based on a supplemental non-GAAP measure called ""core business earnings''(previously referred to as ""operating net income'' or ""operating earnings''). While core business earnings isnot a substitute for GAAP net income, management relies on core business earnings in operating our businessbecause management believes that core business earnings provides both management and investors with abetter measure of our Ñnancial results and better reÖects risk management strategies than GAAP net income.Core business earnings was developed in conjunction with our January 1, 2001 adoption of FinancialAccounting Standard No. 133, Accounting for Derivative Instruments and Hedging Activities (""FAS 133''), toadjust for accounting diÅerences between alternative transactions used to hedge interest rate risk that producesimilar economic results but require diÅerent accounting treatment under FAS 133.
The diÅerence in the values and percentage changes between net income and core business earnings, andearnings per share (""EPS'') and core business EPS, are attributable to accounting diÅerences for interest ratehedges. Refer to Appendix A of this OÅering Circular for a reconciliation of our non-GAAP Ñnancialmeasures to GAAP results.
Reported Results
We reported net income of $1,941 million in the Ñrst quarter of 2003, up 60.5 percent from $1,209 millionin the Ñrst quarter of 2002. Diluted EPS was $1.93 in the Ñrst quarter of 2003, up 65.0 percent from $1.17 inthe Ñrst quarter of 2002.
Strong growth in net interest income contributed signiÑcantly to our reported results. Net interest incomefor the Ñrst quarter of 2003 was $3,368 million, up 38.6 percent from the Ñrst quarter of 2002. This increase
5

was in part attributable to an 11.7 percent rise in the average net investment balance and a 29 basis pointincrease in the net interest yield.
Our net interest yield averaged 160 basis points in the Ñrst quarter of 2003, compared with 131 basispoints in the Ñrst quarter of 2002. Our net interest yield beneÑted from an increase in the amount of purchasedoptions used as a substitute for callable debt, since the cost of these options is not included in our net interestincome or net interest yield. Prior to the adoption of FAS 133, we included the amortization of purchasedoption premiums as a component of interest expense. This amortization expense is now included as acomponent of purchased options expense on the income statement and excluded from interest expense. Netinterest margin, discussed below, is calculated consistently with our previous methodology.
In the Ñrst quarter of 2003 we recorded $625 million of mark-to-market losses on purchased optionscompared with $787 million in the Ñrst quarter of 2002. These unrealized losses were recorded in accordancewith FAS 133. The reduction in the unrealized losses positively aÅected reported results.
Core Business Earnings
Our core business earnings for the Ñrst quarter of 2003 were $1,850 million, a 21.8 percent increasecompared with $1,519 million in the Ñrst quarter of 2002. Core business diluted EPS for the Ñrst quarter of2003 was $1.84, or 24.3 percent above the Ñrst quarter of 2002. Growth in core business earnings and dilutedEPS was paced by a 10 basis point increase in the net interest margin, a 34.1 percent increase in guaranty feeincome, and a $110 million increase in fee and other income.
Business Volume
Our business volumeÌmortgages purchased for portfolio plus MBS issues acquired by other inves-torsÌtotaled $335.9 billion in the Ñrst quarter of 2003, compared with $197.8 billion in the Ñrst quarter of2002 and $304.5 billion in the fourth quarter of 2002. Business volume in the Ñrst quarter of 2003 consisted of$132.0 billion in portfolio purchases and $203.9 billion in MBS issues acquired by investors other than ourportfolio. This compares with $91.0 billion and $106.8 billion, respectively, in the Ñrst quarter of 2002.Retained commitments to purchase mortgages were $115.9 billion in the Ñrst quarter of 2003 compared with$50.8 billion in the Ñrst quarter of 2002. Outstanding portfolio commitments for mandatory delivery totaled$73.4 billion at March 31, 2003.
Our combined book of businessÌthe gross balance of mortgages held in portfolio and outstanding MBSand other mortgage-related securities guaranteed by us and held by other investorsÌgrew at a compoundannual rate of 24.7 percent during the Ñrst quarter of 2003, ending the period at $1.923 trillion. This growthresulted from a 13.3 percent annualized growth rate in the gross mortgage portfolio and a 34.0 percentannualized rate of growth in outstanding MBS.
Portfolio Investment Business Results
Our portfolio investment business manages the interest rate risk of our mortgage portfolio and otherinvestments. The results of this business are largely reÖected in core net interest income, which is net interestincome less the amortization expense of purchased options. Core net interest income for the Ñrst quarter of2003 was $2,604 million, up 22.8 percent from $2,120 million in the Ñrst quarter of 2002. This increase was inpart attributable to a 11.7 percent rise in the average net investment balance and a 10 basis point increase inthe net interest margin.
Our net investment balanceÌconsisting of our liquid investment portfolio together with our mortgageportfolio net of unrealized gains or losses on available for sale securities, deferred balances, and the allowancefor loan lossesÌaveraged $872 billion during the Ñrst quarter of 2003 compared with $781 billion during theÑrst quarter of 2002. The net investment balance was $885 billion at March 31, 2003. Our net interest marginaveraged 125 basis points in the Ñrst quarter of 2003 compared with 115 basis points in the Ñrst quarter of 2002and 114 basis points in the fourth quarter of 2002.
6

For the Ñrst quarter of 2003 we realized losses from debt repurchases and debt calls of $392.2 millioncompared with losses of $171.7 million in the Ñrst quarter of 2002. During the quarter we realized$377.8 million of losses on debt repurchases and $14.4 million of losses on debt calls. Debt repurchased anddebt called in the Ñrst quarter totaled $3.6 billion and $44.0 billion, respectively. We regularly call orrepurchase debt as part of our interest rate risk management program.
Credit Guaranty Business Results
Our credit guaranty business manages our credit risk. The results of this business are primarily reÖectedin guaranty fee income and credit-related losses. Guaranty fee income was $546.6 million in the Ñrst quarter of2003, a 34.1 percent increase compared with the Ñrst quarter of 2002. The increase in guaranty fee income wasin part attributable to a 22.7 percent rise in average outstanding MBS and a 9.1 percent increase in theeÅective guaranty fee rate on that business. The eÅective guaranty fee rate in the Ñrst quarter of 2003 was 20.3basis points compared with 18.6 basis points in the Ñrst quarter of 2002 and 20.4 basis points in the fourthquarter of 2002. The increase in the guaranty fee between the Ñrst quarters of 2003 and 2002 was a result ofhigher fee rates on new business, together with the faster amortization of deferred fees due to acceleratedprepayments.
Credit-related lossesÌcharge-oÅs plus foreclosed property incomeÌremained very low in the Ñrstquarter, in part attributable to a strong housing market and continued home price gains. Credit-related lossestotaled $20.4 million in the Ñrst quarter of 2003 compared with $21.5 million in the Ñrst quarter of 2002. Ourcredit loss rateÌcredit-related losses as a percentage of the average combined book of businessÌwas 0.4 basispoints in the Ñrst quarter of 2003 compared with 0.5 basis points in the Ñrst quarter of 2002.
Credit-related expense, which includes the provision for losses and foreclosed property income and is theamount recorded on our income statement, totaled $20.3 million in the Ñrst quarter of 2003, in line withcredit-related losses. Our loss provision was $23.0 million in the Ñrst quarter of 2003, compared with$28.3 million in the Ñrst quarter of 2002. Foreclosed property income was $2.7 million in the Ñrst quarter of2003 compared with income of $6.6 million in the Ñrst quarter of 2002, primarily due to gains on foreclosedproperty dispositions. Our allowance for loan losses and guaranty liability for MBS totaled $808 million atMarch 31, 2003, unchanged from December 31, 2002.
Our conventional single-family serious delinquency rate, an indicator of potential future loss activity, was0.59 percent at February 28, 2003, compared with 0.57 percent at December 31, 2002. Our reporting ofdelinquent loans has been expanded from ""at risk'' loans to include the performance of all seriously delinquentconventional loans, whether or not they beneÑt from credit enhancement.
Fee and Other Income
Fee and other income in the Ñrst quarter of 2003 totaled $113.3 million compared with $3.6 million in theÑrst quarter of 2002. The increase in Ñrst quarter volume from a strong reÑnancing market was primarilyresponsible for the increase of combined transaction, technology, and multifamily fees to $240.8 million,$154.1 million higher than the previous year. Partially oÅsetting these increased fees were higher operatinglosses from growth in tax-advantaged investments and lower other miscellaneous income.
Fee and other income includes technology fees, transaction fees, multifamily fees and other miscellane-ous items, and is net of operating losses from certain tax-advantaged investmentsÌprimarily investments inaÅordable housing which qualify for the low income housing tax credit. Tax credits associated with housingtax credit investments are included in the provision for federal income taxes.
Income Taxes
Provision for federal income taxes on net income was $706.9 million in the Ñrst quarter of 2003 comparedwith $362.3 million in the Ñrst quarter of 2002. The eÅective federal income tax rate on net income was27 percent in the Ñrst quarter of 2003, compared with 23 percent for the same period last year. The increase inthe eÅective rate is attributable to an increase in taxable income.
7

Provision for federal income taxes on core business earnings was $658.0 million in the Ñrst quarter of2003, compared with $529.2 million in the Ñrst quarter of 2002. The eÅective federal income tax rate on corebusiness earnings was 26 percent in the Ñrst quarter of 2003, unchanged from the same period last year.
Administrative Expenses
Administrative expenses totaled $343.8 million in the Ñrst quarter of 2003, up 18.5 percent from the Ñrstquarter of 2002. On January 1, 2003, we adopted the fair value method for accounting for stock-basedcompensation and began expensing all new stock-based compensation. The above-average growth in expensesis related primarily to our reengineering of our core technology infrastructure to enhance our ability to processand manage the risk on mortgage assets and the expensing of all new stock-based compensation.
The growth rate of administrative expenses in 2003 is expected to decline compared with 2002, butremain above historical levels as we complete our core infrastructure project.
Our ratio of administrative expense to the average combined book of business in the Ñrst quarter of 2003was .073 percent, unchanged from the Ñrst quarter of 2002. Our eÇciency ratioÌadministrative expensedivided by core taxable-equivalent revenueÌwas 9.5 percent in the Ñrst quarter of 2003 compared with10.2 percent in the Ñrst quarter of 2002.
Capital
Our core capital, which is the basis for our statutory minimum capital requirement, was $29.5 billion atMarch 31, 2003 compared with $28.1 billion at December 31, 2002 and $25.5 billion at March 31, 2002. Corecapital was an estimated $1,291 million above the statutory minimum at March 31, 2003. At December 31,2002, core capital was $877 million above the statutory minimum.
Total capital includes core capital and the total allowance for loan losses and guaranty liabilities for MBS,less any speciÑc loss allowances, and is the basis for the risk-based capital standard. Total capital was $30.3billion at March 31, 2003 compared with $28.9 billion at December 31, 2002 and $26.3 billion at March 31,2002. Our total capital exceeded the risk-based requirement by $11.4 billion as of December 31, 2002, thelatest period for which a risk-based capital requirement has been determined. The risk-based standard uses astress test to determine the amount of total capital we need to hold in order to protect against credit andinterest rate risk, and requires an additional 30 percent capital for management and operations risk. The higherof our risk-based or minimum capital standard is binding.
We repurchased 8.6 million shares of common stock during the Ñrst quarter of 2003, compared with7.5 million shares in the Ñrst quarter of 2002. At March 31, 2003 we had 981.0 million shares of commonstock outstanding compared with 988.8 million shares at December 31, 2002.
We had $8.5 billion of subordinated debt outstanding at March 31, 2003. Subordinated debt serves as animportant risk-bearing supplement to our equity capital, although it is not a component of core capital. Afterproviding for capital to support our oÅ-balance sheet MBS, our total capital and outstanding subordinateddebt as a percent of on-balance sheet assets was 3.7 percent at March 31, 2003. We issued $400 million ofpreferred stock during the Ñrst quarter of 2003. At March 31, 2003, preferred stock made up 10.4 percent ofour core capital.
Voluntary Disclosures
At March 31, 2003, our ratio of liquid assets to total assets was 6.7 percent compared with 6.9 percent atDecember 31, 2002. We have committed to maintain a portfolio of high-quality, liquid, non-mortgagesecurities equal to at least 5 percent of total assets.
At December 31, 2002, the present value of our net sensitivity of future credit losses to an immediate5 percent decline in home prices was $596 million, taking into account the beneÑcial eÅect of third-partycredit enhancements. This compares with $501 million at September 2002. The December 31 Ñgure reÖects a
8

gross credit loss sensitivity of $1,838 million before the eÅect of credit enhancements, and is net of projectedcredit risk sharing proceeds of $1,242 million.
Derivatives and FAS 133
We primarily use derivative instruments as substitutes for noncallable and callable debt issued in the cashmarkets to help match the cash Öow characteristics of our debt with those of our mortgages and reduce theinterest rate risk in our portfolio. We account for our derivatives under FAS 133.
FAS 133 requires that we mark to market on our income statement the changes in the time value, but notthe total value, of our purchased optionsÌinterest rate swaptions and interest rate caps. The marking tomarket of the time value of our purchased options during the Ñrst quarter of 2003 resulted in a net mark-to-market loss of $624.6 million compared with a net mark-to-market loss of $787.2 million in the Ñrst quarter of2002, which is reported on the purchased option expense line of the income statement. Purchased optionexpense in the Ñrst quarter of 2003 includes $764.3 million in amortization expense, which was included in netinterest income prior to FAS 133 and currently is included in core net interest income and in core businessearnings. This amortization expense represents the straight-line amortization of the up-front premium paid topurchase the options over the expected life of the options.
FAS 133 also requires that we record any change in the fair values of certain derivatives, primarilyinterest rate swaps we use as substitutes for noncallable debt, on our balance sheet in accumulated othercomprehensive income (""AOCI''), which is a separate component of stockholders' equity. For these types oftransactions FAS 133 does not require or permit noncallable debt to be marked to market. At March 31, 2003,the AOCI component of stockholders' equity included a reduction of $15.8 billion, or 1.9 percent of the netmortgage balance, from the marking to market of these derivatives. Accumulated other comprehensiveincome is not a component of core capital.
Our primary credit exposure on derivatives is that a counterparty might default on payments due, whichcould result in our having to replace the derivative with a diÅerent counterparty at a higher cost. Our exposureon derivative contracts (taking into account master settlement agreements that allow for netting of paymentsand excluding collateral received) was $3.256 billion at March 31, 2003. All of this exposure was tocounterparties rated A-/A3 or higher. We held $3.0 billion of collateral through custodians to oÅset the risk ofthe exposure for these instruments. Our exposure, net of collateral, was $256 million at March 31, 2003 versus$197 million at December 31, 2002.
USE OF PROCEEDS
We will add the net proceeds from the sale of the Preferred Stock to our working capital and use them forgeneral corporate purposes, including the repurchase of shares of our stock. We anticipate the need foradditional Ñnancing from time to time, including Ñnancing through various types of equity and debt securities.The amount and nature of such Ñnancings will depend upon a number of factors, including the volume of ourmaturing debt obligations, the volume of mortgage loan prepayments, the volume and type of mortgage loanswe purchase, and general market conditions.
9

CAPITALIZATION
The following table sets forth our capitalization as of December 31, 2002, and it is adjusted to give eÅectto the issuance of the Preferred Stock (before giving eÅect to the payment of estimated oÅering expenses andunderwriting discount, and assuming that the Underwriters' overallotment option is not exercised), and theissuance of the Variable Rate Non-Cumulative Preferred Stock, Series K, on March 18, 2003.
ActualAverage Average Outstanding atMaturity Cost(1) December 31, 2002 Adjusted
(Dollars in millions)
Debentures, notes, and bonds, net:Due within one year:
Short-term notes ÏÏÏÏÏÏÏÏÏÏÏÏÏÏÏÏÏÏÏÏÏÏÏÏÏÏÏÏÏÏÏÏÏ 3 mos. 1.55% $290,091 $290,091Universal Benchmark ÏÏÏÏÏÏÏÏÏÏÏÏÏÏÏÏÏÏÏÏÏÏÏÏÏÏÏÏÏ 5 mos. 4.89 37,376 37,376Universal Retail ÏÏÏÏÏÏÏÏÏÏÏÏÏÏÏÏÏÏÏÏÏÏÏÏÏÏÏÏÏÏÏÏÏÏ 0 mos. 9.52 73 73Universal Short-termÏÏÏÏÏÏÏÏÏÏÏÏÏÏÏÏÏÏÏÏÏÏÏÏÏÏÏÏÏÏ 7 mos. 1.48 3,440 3,440Universal StandardÏÏÏÏÏÏÏÏÏÏÏÏÏÏÏÏÏÏÏÏÏÏÏÏÏÏÏÏÏÏÏÏ 5 mos. 2.25 41,681 41,681Other(2) ÏÏÏÏÏÏÏÏÏÏÏÏÏÏÏÏÏÏÏÏÏÏÏÏÏÏÏÏÏÏÏÏÏÏÏÏÏÏÏÏ 0.27 9,751 9,751
Total due within one year ÏÏÏÏÏÏÏÏÏÏÏÏÏÏÏÏÏÏÏÏÏÏ 382,412 382,412
Due after one year:Universal Benchmark ÏÏÏÏÏÏÏÏÏÏÏÏÏÏÏÏÏÏÏÏÏÏÏÏÏÏÏÏÏ 5 yrs. 9 mos. 5.49% 291,429 291,429Universal Retail ÏÏÏÏÏÏÏÏÏÏÏÏÏÏÏÏÏÏÏÏÏÏÏÏÏÏÏÏÏÏÏÏÏÏ 10 yrs. 5 mos. 6.10 10,556 10,556Universal StandardÏÏÏÏÏÏÏÏÏÏÏÏÏÏÏÏÏÏÏÏÏÏÏÏÏÏÏÏÏÏÏÏ 4 yrs. 7 mos. 4.32 152,900 152,900Other ÏÏÏÏÏÏÏÏÏÏÏÏÏÏÏÏÏÏÏÏÏÏÏÏÏÏÏÏÏÏÏÏÏÏÏÏÏÏÏÏÏÏÏ 13 yrs. 10 mos. 8.30 13,685 13,685
Total due after one year ÏÏÏÏÏÏÏÏÏÏÏÏÏÏÏÏÏÏÏÏÏÏÏ 468,570 468,570
Total debentures, notes, and bonds ÏÏÏÏÏÏÏÏÏÏÏÏÏÏÏÏÏÏÏÏ $850,982 $850,982
Stockholders' equity:Preferred stock, $50 stated value;
100,000,000 shares authorizedÌ53,550,000 shares issued
at December 31, 2002;67,550,000 shares issued as adjusted ÏÏÏÏÏÏÏÏÏÏÏÏÏSeries D, 3,000,000 shares issuedÏÏÏÏÏÏÏÏÏÏÏÏÏÏÏÏ $ 150 $ 150Series E, 3,000,000 shares issuedÏÏÏÏÏÏÏÏÏÏÏÏÏÏÏÏ 150 150Series F, 13,800,000 shares issued ÏÏÏÏÏÏÏÏÏÏÏÏÏÏÏ 690 690Series G, 5,750,000 shares issuedÏÏÏÏÏÏÏÏÏÏÏÏÏÏÏÏ 288 288Series H, 8,000,000 shares issued ÏÏÏÏÏÏÏÏÏÏÏÏÏÏÏ 400 400Series I, 6,000,000 shares issued ÏÏÏÏÏÏÏÏÏÏÏÏÏÏÏÏ 300 300Series J, 14,000,000 shares issued ÏÏÏÏÏÏÏÏÏÏÏÏÏÏÏ 700 700Series K, 8,000,000 shares issuedÏÏÏÏÏÏÏÏÏÏÏÏÏÏÏÏ Ì 400Series L, 6,000,000 shares issuedÏÏÏÏÏÏÏÏÏÏÏÏÏÏÏÏ Ì 300
Common stock, $.525 stated value, no maximumauthorizationÌ1,129,090,420 shares outstanding ÏÏÏÏÏÏÏ 593 593
Additional paid-in capital ÏÏÏÏÏÏÏÏÏÏÏÏÏÏÏÏÏÏÏÏÏÏÏÏÏÏÏÏ 1,839 1,839Retained earningsÏÏÏÏÏÏÏÏÏÏÏÏÏÏÏÏÏÏÏÏÏÏÏÏÏÏÏÏÏÏÏÏÏÏÏ 29,385 29,385Accumulated other comprehensive lossÏÏÏÏÏÏÏÏÏÏÏÏÏÏÏÏÏ (11,792) (11,792)
22,703 23,403Less treasury stock, at costÌ140,245,667 shares(3) 6,415 6,415
Total stockholders' equity ÏÏÏÏÏÏÏÏÏÏÏÏÏÏÏÏÏÏÏÏÏÏÏÏÏÏÏÏ $ 16,288 $ 16,988
(1) Represents weighted-average cost, which includes the amortization of discounts, premiums, issuance costs, hedgingresults, and the eÅects of currency and debt swaps.
(2) Average maturity is indeterminate because the outstanding amount includes investment agreements that have varyingmaturities.
(3) Does not reÖect any repurchases of our stock that may be made using proceeds from the sale of the Preferred Stock.See ""Use of Proceeds.''
We frequently issue debentures, notes, and other debt obligations, and from time to time we redeem suchdebt obligations. The amount of debentures, notes, other debt obligations outstanding, and stockholders'equity on any date subsequent to December 31, 2002 may diÅer from that shown in the table above.
10

SELECTED FINANCIAL INFORMATION
The following selected Ñnancial data has been summarized or derived from our audited Ñnancialstatements. This data should be read in conjunction with ""Item 7ÌManagement's Discussion and Analysis ofFinancial Condition and Results of Operations,'' ""Item 1ÌBusiness,'' and our Ñnancial statements and relatednotes contained in the Form 10-K incorporated herein by reference and attached hereto as Appendix C.
Year Ended December 31,
2002 2001 2000 1999 1998
(Dollars and Shares in millions, except per common share amounts)
Income Statement Data:Interest incomeÏÏÏÏÏÏÏÏÏÏÏÏÏÏÏÏÏÏÏÏÏÏÏÏÏÏÏÏÏÏÏÏÏ $ 50,853 $ 49,170 $ 42,781 $ 35,495 $ 29,995Interest expense ÏÏÏÏÏÏÏÏÏÏÏÏÏÏÏÏÏÏÏÏÏÏÏÏÏÏÏÏÏÏÏÏ (40,287) (41,080) (37,107) (30,601) (25,885)
Net interest income ÏÏÏÏÏÏÏÏÏÏÏÏÏÏÏÏÏÏÏÏÏÏÏÏÏÏÏÏÏ 10,566 8,090 5,674 4,894 4,110Guaranty fee income ÏÏÏÏÏÏÏÏÏÏÏÏÏÏÏÏÏÏÏÏÏÏÏÏÏÏÏÏ 1,816 1,482 1,351 1,282 1,229Fee and other income (expense), net ÏÏÏÏÏÏÏÏÏÏÏÏÏÏ 232 151 (44) 191 275Provision for lossesÏÏÏÏÏÏÏÏÏÏÏÏÏÏÏÏÏÏÏÏÏÏÏÏÏÏÏÏÏÏ (128) (94) (122) (151) (245)Foreclosed property income (expense) ÏÏÏÏÏÏÏÏÏÏÏÏÏ 36 16 28 24 (16)Administrative expenses ÏÏÏÏÏÏÏÏÏÏÏÏÏÏÏÏÏÏÏÏÏÏÏÏÏ (1,219) (1,017) (905) (800) (708)Special contribution ÏÏÏÏÏÏÏÏÏÏÏÏÏÏÏÏÏÏÏÏÏÏÏÏÏÏÏÏÏ Ì (300) Ì Ì ÌPurchased options expense(1) ÏÏÏÏÏÏÏÏÏÏÏÏÏÏÏÏÏÏÏÏ (4,545) (37) Ì Ì ÌDebt extinguishments, netÏÏÏÏÏÏÏÏÏÏÏÏÏÏÏÏÏÏÏÏÏÏÏÏ (710) (524) 49 (14) (40)
Income before federal income taxes and cumulativeeÅect of change in accounting principle ÏÏÏÏÏÏÏÏÏÏ 6,048 7,767 6,031 5,426 4,605
Provision for federal income taxes ÏÏÏÏÏÏÏÏÏÏÏÏÏÏÏÏÏ (1,429) (2,041) (1,583) (1,514) (1,187)
Income before cumulative eÅect of change inaccounting principle ÏÏÏÏÏÏÏÏÏÏÏÏÏÏÏÏÏÏÏÏÏÏÏÏÏÏÏ 4,619 5,726 4,448 3,912 3,418
Cumulative eÅect of change in accounting principle,net of tax eÅect(2) ÏÏÏÏÏÏÏÏÏÏÏÏÏÏÏÏÏÏÏÏÏÏÏÏÏÏÏ Ì 168 Ì Ì Ì
Net income ÏÏÏÏÏÏÏÏÏÏÏÏÏÏÏÏÏÏÏÏÏÏÏÏÏÏÏÏÏÏÏÏÏÏÏÏ $ 4,619 $ 5,894 $ 4,448 $ 3,912 $ 3,418
Preferred stock dividendsÏÏÏÏÏÏÏÏÏÏÏÏÏÏÏÏÏÏÏÏÏÏÏÏÏ (99) (138) (121) (78) (66)
Net income available to common stockholdersÏÏÏÏÏÏÏ $ 4,520 $ 5,756 $ 4,327 $ 3,834 $ 3,352
Basic earnings per common share:Earnings before cumulative eÅect of change in
accounting principle ÏÏÏÏÏÏÏÏÏÏÏÏÏÏÏÏÏÏÏÏÏÏÏÏÏ $ 4.56 $ 5.58 $ 4.31 $ 3.75 $ 3.26Cumulative eÅect of change in accounting principle Ì .17 Ì Ì Ì
Net earnings ÏÏÏÏÏÏÏÏÏÏÏÏÏÏÏÏÏÏÏÏÏÏÏÏÏÏÏÏÏÏÏÏÏ $ 4.56 $ 5.75 $ 4.31 $ 3.75 $ 3.26
Diluted earnings per common share:Earnings before cumulative eÅect of change in
accounting principle ÏÏÏÏÏÏÏÏÏÏÏÏÏÏÏÏÏÏÏÏÏÏÏÏÏ $ 4.53 $ 5.55 $ 4.29 $ 3.72 $ 3.23Cumulative eÅect of change in accounting principle Ì .17 Ì Ì Ì
Net earnings ÏÏÏÏÏÏÏÏÏÏÏÏÏÏÏÏÏÏÏÏÏÏÏÏÏÏÏÏÏÏÏÏÏ $ 4.53 $ 5.72 $ 4.29 $ 3.72 $ 3.23
Cash dividends per common shareÏÏÏÏÏÏÏÏÏÏÏÏÏÏÏÏÏ $ 1.32 $ 1.20 $ 1.12 $ 1.08 $ .96Balance Sheet Data:
Mortgage portfolio, net ÏÏÏÏÏÏÏÏÏÏÏÏÏÏÏÏÏÏÏÏÏÏÏÏÏÏ $ 797,693 $705,324 $607,551 $522,921 $415,355Liquid assets ÏÏÏÏÏÏÏÏÏÏÏÏÏÏÏÏÏÏÏÏÏÏÏÏÏÏÏÏÏÏÏÏÏÏÏ 61,554 76,072 55,585 41,850 59,258Total assets ÏÏÏÏÏÏÏÏÏÏÏÏÏÏÏÏÏÏÏÏÏÏÏÏÏÏÏÏÏÏÏÏÏÏÏÏ 887,515 799,948 675,224 575,308 485,146Borrowings:
Due within one yearÏÏÏÏÏÏÏÏÏÏÏÏÏÏÏÏÏÏÏÏÏÏÏÏÏÏÏ 382,412 343,492 280,322 226,582 205,413Due after one year ÏÏÏÏÏÏÏÏÏÏÏÏÏÏÏÏÏÏÏÏÏÏÏÏÏÏÏÏ 468,570 419,975 362,360 321,037 254,878
Total liabilities ÏÏÏÏÏÏÏÏÏÏÏÏÏÏÏÏÏÏÏÏÏÏÏÏÏÏÏÏÏÏÏÏÏ 871,227 781,830 654,386 557,679 469,693Preferred stock ÏÏÏÏÏÏÏÏÏÏÏÏÏÏÏÏÏÏÏÏÏÏÏÏÏÏÏÏÏÏÏÏÏ 2,678 2,303 2,278 1,300 1,150Stockholders' equityÏÏÏÏÏÏÏÏÏÏÏÏÏÏÏÏÏÏÏÏÏÏÏÏÏÏÏÏÏ 16,288 18,118 20,838 17,629 15,453
11

Year ended December 31,
Core Business Earnings Data(3): 2002 2001 2000 1999 1998
(Dollars and Shares in millions, except per common share amounts)
Core business earnings(4)ÏÏÏÏÏÏÏÏÏÏÏÏÏÏÏÏÏÏÏÏÏÏÏÏÏÏÏ $ 6,394 $ 5,367 $ 4,448 $ 3,912 $ 3,418Total taxable-equivalent revenues(5)ÏÏÏÏÏÏÏÏÏÏÏÏÏÏÏÏÏÏ 11,896 10,187 7,825 6,975 6,272Net interest margin ÏÏÏÏÏÏÏÏÏÏÏÏÏÏÏÏÏÏÏÏÏÏÏÏÏÏÏÏÏÏÏ 1.15% 1.11% 1.01% 1.01% 1.03%Return on average assets(6) ÏÏÏÏÏÏÏÏÏÏÏÏÏÏÏÏÏÏÏÏÏÏÏÏÏ .76 .71 .71 .73 .78Return on average realized common equity(7) ÏÏÏÏÏÏÏÏÏ 26.1 25.4 25.2 25.0 25.2
December 31,
Other Data: 2002 2001 2000 1999 1998
Average eÅective guaranty fee rate ÏÏÏÏÏÏÏÏÏÏÏÏÏÏÏÏÏÏ .191% .190% .195% .193% .202%Credit loss ratio(8) ÏÏÏÏÏÏÏÏÏÏÏÏÏÏÏÏÏÏÏÏÏÏÏÏÏÏÏÏÏÏÏÏ .005 .006 .007 .011 .027Administrative expense ratio(9) ÏÏÏÏÏÏÏÏÏÏÏÏÏÏÏÏÏÏÏÏÏÏ .072 .071 .072 .071 .074EÇciency ratio(10) ÏÏÏÏÏÏÏÏÏÏÏÏÏÏÏÏÏÏÏÏÏÏÏÏÏÏÏÏÏÏÏÏ 10.2 10.0 11.6 11.5 11.3Dividend payout ratio ÏÏÏÏÏÏÏÏÏÏÏÏÏÏÏÏÏÏÏÏÏÏÏÏÏÏÏÏÏ 29.0 20.9 26.0 28.8 29.5Ratio of earnings to combined Ñxed charges and
preferred stock dividends(11) ÏÏÏÏÏÏÏÏÏÏÏÏÏÏÏÏÏÏÏÏÏÏ 1.15:1 1.19:1 1.16:1 1.17:1 1.17:1Mortgage purchases ÏÏÏÏÏÏÏÏÏÏÏÏÏÏÏÏÏÏÏÏÏÏÏÏÏÏÏÏÏÏÏ $ 370,641 $270,584 $154,231 $195,210 $188,448MBS issues acquired by others(12) ÏÏÏÏÏÏÏÏÏÏÏÏÏÏÏÏÏÏÏ 478,260 344,739 105,407 174,850 220,723Outstanding MBS(13) ÏÏÏÏÏÏÏÏÏÏÏÏÏÏÏÏÏÏÏÏÏÏÏÏÏÏÏÏÏÏ 1,029,456 858,867 706,684 679,169 637,143Weighted-average diluted common shares outstanding ÏÏ 997 1,006 1,009 1,031 1,037Return on average assets ÏÏÏÏÏÏÏÏÏÏÏÏÏÏÏÏÏÏÏÏÏÏÏÏÏÏÏ .55% .78% .71% .73% .78%Average equity to average assets ÏÏÏÏÏÏÏÏÏÏÏÏÏÏÏÏÏÏÏÏ 2.1 2.3 3.1 3.1 3.3Return on common equityÏÏÏÏÏÏÏÏÏÏÏÏÏÏÏÏÏÏÏÏÏÏÏÏÏÏ 30.2 39.8 25.6 25.2 25.2Core capital(14) ÏÏÏÏÏÏÏÏÏÏÏÏÏÏÏÏÏÏÏÏÏÏÏÏÏÏÏÏÏÏÏÏÏÏÏ $ 28,079 $ 25,182 $ 20,827 $ 17,876 $ 15,465Total capital(15)ÏÏÏÏÏÏÏÏÏÏÏÏÏÏÏÏÏÏÏÏÏÏÏÏÏÏÏÏÏÏÏÏÏÏÏ 28,871 25,976 21,634 18,677 16,257
(1) Represents the change in the fair value of the time value of purchased options under FAS 133, ""Accounting for DerivativeInstruments and Hedging Activities''.
(2) Represents the after-tax eÅect on income of the adoption of FAS 133 on January 1, 2001.(3) Core business earnings data are non-GAAP measures management uses to track and analyze our Ñnancial performance.
See ""Management's Discussion and Analysis of Financial Condition and Results of OperationsÌCore Business Earningsand Business Segment Results'' in the Form 10-K for additional discussion of these measures.
(4) Core business earnings is a non-GAAP measure developed by management, in conjunction with the adoption of FAS 133,to evaluate and assess the quality of Fannie Mae's earnings from its principal business activities on a consistent basis. Corebusiness earnings is presented on a net of tax basis and excludes the transition adjustment from the adoption of FAS 133and unrealized gains and losses on purchased options recorded under FAS 133, and includes purchased options premiumsamortized on a straight-line basis over the original estimated life of the option.
(5) Includes revenues net of operating losses on low-income housing tax credit limited partnerships (accounted for using theequity method of accounting) and amortization expense of purchased options premiums, plus taxable-equivalent adjust-ments for tax-exempt income and investment tax credits using the applicable federal income tax rate. This is a non-GAAPmeasure.
(6) Core business earnings less preferred stock dividends divided by average assets. This is a non-GAAP measure.(7) Core business earnings less preferred stock dividends divided by average realized common stockholders' equity (common
stockholders' equity excluding accumulated other comprehensive income). This is a non-GAAP measure.(8) Charge-oÅs, net of recoveries, and foreclosed property income (expense) as a percentage of average mortgage portfolio (on
an amortized cost basis) and average outstanding MBS.(9) Administrative expenses as a percentage of average net mortgage portfolio and average outstanding MBS.
(10) Administrative expenses as a percentage of taxable-equivalent revenues.(11) ""Earnings'' consists of (a) income before federal income taxes and cumulative eÅect of accounting changes and (b) Ñxed
charges. Fixed charges represent interest expense.(12) Includes MBS and other mortgage-related securities guaranteed by Fannie Mae.(13) Includes MBS and other mortgage-related securities guaranteed by Fannie Mae and held by investors other than Fannie
Mae.(14) The sum of (a) the stated value of common stock, (b) the stated value of outstanding noncumulative perpetual preferred
stock, (c) paid-in capital, and (d) retained earnings, less treasury stock. Core capital represents a regulatory measure ofcapital. Refer to Note 11 of the Ñnancial statements, ""Dividend Restrictions and Regulatory Capital Ratios,'' in theForm 10-K for a discussion of core capital.
(15) The sum of (a) core capital and (b) the total allowance for loan losses and guaranty liability for MBS, less (c) the speciÑcloss allowance. Total capital represents a regulatory measure of capital. SpeciÑc loss allowances totaled $19 million,$13 million, $2 million, $3 million, and $10 million for the years ended December 31, 2002, 2001, 2000, 1999, and 1998,respectively. Refer to Note 11 of the Ñnancial statements, ""Dividend Restrictions and Regulatory Capital Ratios,'' in theForm 10-K for a discussion of total capital.
12

GOVERNMENT REGULATION AND CHARTER ACT
Charter Act
We were established in 1938 under Title III of the National Housing Act as a government owned entity.In 1954, under the Federal National Mortgage Association Charter Act, the entity became a mixed-ownershipcorporate instrumentality of the United States. Under the Housing and Urban Development Act of 1968, theentity was divided into two separate institutions, the present Fannie Mae and Ginnie Mae. Fannie Maebecame an entirely stockholder-owned corporation, organized and existing under the Charter Act. TheCharter Act provides that the corporation will continue until dissolved by an act of Congress. The Charter Actwas further amended by the Federal Housing Enterprises Financial Safety and Soundness Act of 1992 (the""1992 Act'').
Under the Charter Act, our purpose is:
""to (1) provide stability in the secondary market for residential mortgages, (2) respond appropriately tothe private capital market, (3) provide ongoing assistance to the secondary market for residentialmortgages (including activities relating to mortgages on housing for low- and moderate-income familiesinvolving a reasonable economic return that may be less than the return earned on other activities) byincreasing the liquidity of mortgage investments and improving the distribution of investment capitalavailable for residential mortgage Ñnancing, ®and© (4) promote access to mortgage credit throughout thenation (including central cities, rural areas and underserved areas) by increasing the liquidity of mortgageinvestments and improving the distribution of investment capital available for residential mortgageÑnancing.''
The Charter Act authorizes us to ""deal in'' conventional mortgage loans, and ""purchase,'' ""sell,''""service,'' and ""lend on the security of'' such mortgages, subject to limitations on the quality of mortgagespurchased and credit enhancement requirements. Fannie Mae can act as a depositary, custodian, or Ñscalagent ""for its own account or as Ñduciary, and for the account of others.'' The Charter Act expressly enablesFannie Mae ""to lease, purchase, or acquire any property, real, personal, or mixed, or any interest therein, tohold, rent, maintain, modernize, renovate, improve, use, and operate such property, and to sell, for cash orcredit, lease, or otherwise dispose of the same, at such time and in such manner as and to the extent that itmay deem necessary or appropriate.'' The Charter Act also permits Fannie Mae to ""purchase,'' ""service,''""sell,'' ""lend on the security of'' and otherwise deal in loans or advances of credit for the purchase andinstallation of home improvements (so long as the loans are secured by a lien against the property to beimproved).
Under the Charter Act, we may not originate mortgage loans or advance funds on an interim basispending the sale of a mortgage in the secondary market. We may not purchase loans in excess of the amountof the current loan limits. (See ""BusinessÌFannie Mae Business StandardsÌPrincipal Balance Limits'' inthe Form 10-K). We may conduct business only in the United States, its territories and possessions, theDistrict of Columbia and the Commonwealth of Puerto Rico. Our activities must relate to housing, mortgagesand related Ñnancial products.
Thirteen members of our eighteen-member Board of Directors are elected by the holders of our commonstock. The President of the United States appoints the remaining Ñve members. The appointed directors mustinclude one person from the home building industry, one person from the mortgage lending industry, oneperson from the real estate industry, and one person from a consumer or community interest organization orwho has demonstrated a career commitment to providing low-income housing. Any member of the Board ofDirectors that is appointed by the President of the United States may be removed by the President for goodcause. All members of the Board of Directors are elected or appointed annually.
In general, the U.S. Department of Housing and Urban Development (""HUD'') and the OÇce ofFederal Housing Enterprise Oversight (""OFHEO'') oversee the activities of Fannie Mae. HUD has ""generalregulatory power'' over Fannie Mae. The 1992 Act established OFHEO to ensure that Fannie Mae isadequately capitalized and is operating safely.
13

The Secretary of the Treasury has the authority to approve Fannie Mae's issuance of debt obligations andmortgage-related securities. At the discretion of the Secretary of the Treasury of the United States, the U.S.Treasury may purchase obligations of Fannie Mae up to a maximum of $2.25 billion outstanding at any onetime. This facility has not been used since our transition from government ownership in 1968. Neither theUnited States nor any agency thereof is obligated to Ñnance our operations or to assist us in any other manner.The Federal Reserve Banks are authorized to act as depositories, custodians, and Ñscal agents for Fannie Mae,for the Bank's own account, or as Ñduciary.
Securities we issue are ""exempt securities'' under laws administered by the SEC to the same extent assecurities that are obligations of, or guaranteed as to principal and interest by, the United States. Registrationstatements with respect to oÅerings of our securities are not required to be Ñled with the SEC. In July 2002,we announced our voluntary initiative to register our common stock with the SEC under Section 12(g) of theExchange Act. The registration of our common stock became eÅective on March 31, 2003. As a result, we willÑle periodic reports with the SEC, including annual reports on Form 10-K, quarterly reports on Form 10-Q,and current reports on Form 8-K, together with any required exhibits. These Ñlings will be available on theSEC's Electronic Data Gathering, Analysis, and Retrieval (""EDGAR'') system at www.sec.gov. Registrationof our common stock with the SEC will not impact the status of our securities (including equity, debt andMBS) as ""exempt securities'' within the meaning of the laws administered by the SEC.
We are exempt from taxation by states, counties, municipalities, or local taxing authorities, except fortaxation by those authorities on our real property. We are not exempt from payment of federal corporateincome taxes. We also may conduct our business without regard to any qualiÑcation or similar statute in anystate of the United States, including the District of Columbia, the Commonwealth of Puerto Rico, and theterritories and possessions of the United States.
Regulatory Approval and Oversight
As a federally chartered corporation, Fannie Mae is subject to Congressional legislation and oversight andis regulated for various purposes by HUD, OFHEO and the U.S. Department of the Treasury, to the extentauthorized by statute. In addition, the Ñnancial institutions with whom we do business are subject to extensivefederal and state law and regulation. Changes to legislation, regulations or policy that impact us or ourbusiness partners could adversely or favorably aÅect the performance, development, or results of our business.
OFHEO, an independent oÇce within HUD, is responsible for ensuring that we are adequatelycapitalized and operating safely in accordance with the 1992 Act. OFHEO conducts on-site examinations ofFannie Mae for purposes of ensuring our Ñnancial safety and soundness. We are required to submit annual andquarterly reports of our Ñnancial condition and operations to OFHEO. OFHEO is authorized to levy annualassessments on Fannie Mae and the Federal Home Loan Mortgage Corporation (""Freddie Mac''), pursuantto annual Congressional appropriations, to cover OFHEO's reasonable expenses. OFHEO's formal enforce-ment powers include the power to impose temporary and Ñnal cease-and-desist orders and civil monetarypenalties on us and on our directors and executive oÇcers, provided certain conditions are met. OFHEO mayuse other informal supervisory tools of the type that are generally used by agencies with authority to regulateother Ñnancial institutions. In accordance with OFHEO regulation, Fannie Mae has elected to follow theapplicable corporate governance practices and procedures of the Delaware General Corporation Law, as itmay be amended from time to time. On January 21, 2003, OFHEO proposed regulations that would requireFannie Mae to Ñle with the SEC all reports, statements and forms relating to our common stock that arerequired to be Ñled under Sections 14(a) and (c) of the Exchange Act and the rules and regulations underthose sections and require Fannie Mae's directors and oÇcers to Ñle all reports and forms relating to ourcommon stock that are required to be Ñled under Section 16 of the Exchange Act and the rules andregulations under that section.
The Secretary of the Treasury has the authority to approve Fannie Mae's issuance of debt obligations andmortgage-related securities. The General Accounting OÇce is authorized to audit the programs, activities,receipts, expenditures, and Ñnancial transactions of Fannie Mae. The Secretary of HUD has generalregulatory authority to promulgate rules and regulations to carry out the purposes of the Charter Act,
14

excluding authority over matters granted exclusively to OFHEO. The Secretary of HUD has authority toapprove any new conventional mortgage program that is signiÑcantly diÅerent from those approved or engagedin prior to the 1992 Act. The Secretary must approve any new program unless it is not authorized by theCharter Act or the Secretary Ñnds that it is not in the public interest. The Secretary has adopted regulationsrelated to the program approval requirement. We are also required to meet certain goals established by theSecretary of HUD to promote aÅordable housing and to serve the housing needs of those in underserved areas.See ""BusinessÌHousing Goals'' in the Form 10-K.
Capital Requirements
The 1992 Act established minimum capital, risk-based capital, and critical capital requirements forFannie Mae. See also ""Item 7ÌManagement's Discussion and Analysis of Financial Condition and Results ofOperationsÌLiquidity and Capital ResourcesÌCapital ResourcesÌRegulatory Environment'' in theForm 10-K. OFHEO issued a Ñnal rule in 1996 that sets forth the minimum capital requirements for FannieMae and Freddie Mac, which are to be calculated, reported, and classiÑed on a quarterly basis. We were incompliance with the minimum capital rule as of December 31, 2002, and have been in compliance for everyreporting period since the rule became eÅective. OFHEO issued regulations in September 2001, assubsequently amended, to establish a risk-based capital test to be used to determine the amount of total capitalFannie Mae must hold to meet the risk-based capital standard. Fannie Mae and Freddie Mac are required tohold enough capital to withstand a severe 10-year stress period, characterized by extreme interest-ratemovements and credit losses occurring simultaneously, plus 30 percent of that amount for management andoperations risk. The risk-based capital test evaluates combined interest-rate and credit stress for both risingand declining interest-rate scenarios. The more stringent of these two scenarios determines the required risk-based capital. The test assumes that (1) interest rates increase or decrease by up to 600 basis points over theÑrst year, and remain constant at this new level for the remaining 9 years of the test; (2) severe creditconditions apply nationwide; and (3) we acquire no new business during this period except to meetoutstanding mortgage commitments. The regulations specify that ""benchmark loss experience'' will becombined with other assumptions and applied each quarter to our book of business to establish expected creditlosses based on the stress assumptions under the risk-based capital standard. The regulations also specify thehousing price index that OFHEO will use in connection with the standard and how the test will be used todetermine Fannie Mae's risk-based capital requirements. On March 31, 2003, OFHEO announced thatFannie Mae complied with the risk-based capital rule as of December 31, 2002. See ""Item 7ÌManagement'sDiscussion and Analysis of Financial Condition and Results of OperationsÌLiquidity and Capital Re-sourcesÌCapital ResourcesÌRegulatory Environment'' in the Form 10-K.
If we fail to meet the capital standards, OFHEO is permitted or required to take remedial measures,depending on the standards we fail to meet. Compliance with the capital standards could limit operations thatrequire intensive use of capital and restrict our ability to repay debt or pay dividends on our common stock.We are required to submit a capital restoration plan if we fail to meet any of the capital standards. If OFHEOdetermines that we are engaging in conduct not approved by the Director of OFHEO (the ""Director'') thatcould result in a rapid depletion of core capital or that the value of the property subject to mortgages we holdor have securitized has decreased signiÑcantly, or if OFHEO does not approve the capital restoration plan ordetermines that we have failed to make reasonable eÅorts to comply with the plan, OFHEO may takeremedial measures as if we were not meeting the capital standards we otherwise meet. The 1992 Act givesOFHEO authority, after following prescribed procedures, to appoint a conservator if we do not meet thecritical capital level.
Dividend Restrictions
The Charter Act as amended by the 1992 Act restricts the ability of our Board of Directors to makecapital distributions, including any dividends, in the following circumstances:
‚ Fannie Mae may not pay any dividend, without the approval of OFHEO, if the dividend paymentwould decrease our total capital below the risk-based capital level or our core capital below theminimum capital level.
15

‚ If we do not meet the risk-based capital standard but do meet the minimum capital standard, we maynot make any dividend payment that would cause us to fail to meet the minimum capital standard.
‚ If we meet neither the risk-based capital standard nor the minimum capital standard but do meet thecritical capital standard established under the 1992 Act, we may make a dividend payment only if wewould not fail to meet the critical capital standard as a result of the payment and the Director approvesthe payment after Ñnding that the payment satisÑes certain statutory conditions.
The Director has the authority to require us to submit a report to the Director regarding any capitaldistribution we declare before we make the distribution.
16

DESCRIPTION OF THE PREFERRED STOCK
We are authorized by the Charter Act to have preferred stock on such terms and conditions as our Boardof Directors may prescribe. On December 27, 1995, our Board of Directors amended our bylaws to authorizeus to issue up to 100,000,000 shares of preferred stock. To date, we have issued the following:
‚ on March 1, 1996, 7,500,000 shares of 6.41% Non-Cumulative Preferred Stock, Series A (stated value$50 per share) (the ""Series A Preferred Stock'');
‚ on April 12, 1996, 7,500,000 shares of 6.50% Non-Cumulative Preferred Stock, Series B (stated value$50 per share) (the ""Series B Preferred Stock'');
‚ on September 20, 1996, 5,000,000 shares of 6.45% Non-Cumulative Preferred Stock, Series C (statedvalue $50 per share) (the ""Series C Preferred Stock'');
‚ on September 30, 1998, 3,000,000 shares of 5.25% Non-Cumulative Preferred Stock, Series D (statedvalue $50 per share) (the ""Series D Preferred Stock'');
‚ on April 15, 1999, 3,000,000 shares of 5.10% Non-Cumulative Preferred Stock, Series E (stated value$50 per share) (the ""Series E Preferred Stock'');
‚ on March 20, 2000, 13,800,000 shares of Variable Rate Non-Cumulative Preferred Stock, Series F(stated value $50 per share) (the ""Series F Preferred Stock'');
‚ on August 8, 2000, 5,750,000 shares of Variable Rate Non-Cumulative Preferred Stock, Series G(stated value $50 per share) (the ""Series G Preferred Stock'');
‚ on April 6, 2001, 8,000,000 shares of 5.81% Non-Cumulative Preferred Stock, Series H (stated value$50 per share) (the ""Series H Preferred Stock'');
‚ on October 28, 2002, 6,000,000 shares of 5.375% Non-Cumulative Preferred Stock, Series I (statedvalue $50 per share (the ""Series I Preferred Stock'');
‚ on November 26, 2002, 14,000,000 shares of Variable Rate Non-Cumulative Preferred Stock, Series J(stated value $50 per share (the ""Series J Preferred Stock''); and
‚ on March 18, 2003, 8,000,000 shares of Variable Rate Non-Cumulative Preferred Stock, Series K(stated value $50 per share (the ""Series K Preferred Stock'').
We redeemed all of our outstanding Series A Preferred Stock on March 1, 2001, all of our outstandingSeries B Preferred Stock on February 28, 2002, and all of our outstanding Series C Preferred Stock on July 31,2002. In this OÅering Circular, we refer to the Series D Preferred Stock through the Series K Preferred Stockas the ""Outstanding Preferred Stock.''
The terms of the Preferred Stock will be established by a CertiÑcate of Designation of Terms of 5.125%Non-Cumulative Preferred Stock, Series L (the ""CertiÑcate of Designation''), adopted by a duly authorizedcommittee of our Board of Directors, which will be substantially in the form attached as Appendix B to thisOÅering Circular. The following is a brief description of the terms of the Preferred Stock; you also should readthe CertiÑcate of Designation for a full description of the Preferred Stock.
General
We have the right to create and issue additional shares of Preferred Stock and additional classes or seriesof stock that rank, as to dividends, liquidation or otherwise, prior to, on parity with or junior to the PreferredStock, without the consent of holders of the Preferred Stock. As of the date hereof, the shares of OutstandingPreferred Stock are the only shares of our preferred stock outstanding. The Preferred Stock will rank equallyas to the payment of dividends and the distribution of assets upon our dissolution, liquidation or winding upwith the Outstanding Preferred Stock.
The Preferred Stock has no par value, has a stated value and liquidation preference of $50 per share, and,upon issuance against full payment of the purchase price therefor, will be fully paid and nonassessable.
17

The Preferred Stock will not be subject to any mandatory redemption, sinking fund, or other similarprovisions. In addition, holders of Preferred Stock will have no right to require redemption of any shares ofPreferred Stock.
The Preferred Stock will not be convertible into or exchangeable for any of our other stock or obligationsand will have no preemptive rights.
EquiServe Trust Company, N.A., will be the transfer agent, dividend disbursing agent, and registrar forthe shares of Preferred Stock.
The obligations of Fannie Mae under the terms of the Preferred Stock are obligations of Fannie Maeonly and are not those of the United States or of any instrumentality thereof other than Fannie Mae.
Dividends
Dividends on shares of the Preferred Stock will not be mandatory. Holders of record of Preferred Stock asthey appear on our books and records (the ""Holders'') will be entitled to receive, when, as and if declared byour Board of Directors, or a duly authorized committee thereof, in its sole discretion out of funds legallyavailable for dividend payments, non-cumulative, quarterly cash dividends that will accrue from and includingApril 29, 2003 and will be payable on March 31, June 30, September 30, and December 31 of each year (eacha ""Dividend Payment Date''), commencing June 30, 2003, at the annual rate of $2.5625 per share (withouttaking into account any adjustments as described below under ""Changes in the Dividends-ReceivedPercentage''). We will pay dividends on the Preferred Stock to the Holders on the relevant record date Ñxedby the Board of Directors, or a duly authorized committee thereof, which may not be earlier than 45 days orlater than 10 days prior to the applicable Dividend Payment Date. If declared, the initial dividend, which willbe for the period from and including April 29, 2003 to but excluding June 30, 2003, will be $0.4342 per shareand, thereafter, if declared, quarterly dividends will be $0.6406 per share. After the initial dividend, thedividend period relating to a Dividend Payment Date will be the period from and including the precedingDividend Payment Date to but excluding the Dividend Payment Date. If a Dividend Payment Date is not aBusiness Day, we will pay dividends (if declared) on the Preferred Stock on the succeeding Business Day,without interest from that Dividend Payment Date to the date of actual payment. A ""Business Day'' is any dayother than a Saturday, Sunday, or other day on which banking institutions in New York, New York areauthorized or required by law to close. We will compute dividends payable on the Preferred Stock for anyperiod greater or less than a full dividend period on the basis of a 360-day year consisting of twelve 30-daymonths. The amount of dividends per share payable at redemption will be rounded to the fourth digit after thedecimal point. (If the Ñfth digit to the right of the decimal point is Ñve or greater, the fourth digit will berounded up by one.)
The Preferred Stock will rank prior to our common stock with respect to the payment of dividends to theextent provided in the CertiÑcate of Designation. As a result, unless dividends have been declared and paid orset apart (or ordered to be set apart) on the Preferred Stock for the then current quarterly dividend period, nodividend may be declared or paid or set apart for payment on our common stock (or on any of our other stockranking, as to the payment of dividends, junior to the Preferred Stock), other than dividends or distributionspaid in shares of, or options, warrants or rights to subscribe for or purchase shares of, our common stock or anyof our other stock ranking junior to the Preferred Stock as to the payment of dividends and the distribution ofassets upon our dissolution, liquidation or winding up. When dividends are not paid in full upon the PreferredStock and all of our other classes or series of stock, if any, ranking on a parity as to the payment of dividendswith the Preferred Stock, all dividends declared upon shares of Preferred Stock and all of our other such stockwill be declared pro rata so that the amount of dividends declared per share on the Preferred Stock and allsuch other stock will in all cases bear to each other the same ratio that accrued dividends per share on theshares of Preferred Stock (including any adjustment in the amount of dividends payable due to changes in theDividends-Received Percentage (as deÑned below) but without, in the case of any non-cumulative preferredstock, accumulation of unpaid dividends for prior dividend periods) and each other stock bear to each other.
Dividends on the Preferred Stock will not be cumulative. If we do not pay a dividend on the PreferredStock, the Holders of Preferred Stock will have no claim in respect of such non-payment so long as no
18

dividend (other than those referred to in the preceding paragraph) is paid on our common stock (or any of ourother stock ranking, as to the payment of dividends, junior to the Preferred Stock) for the then-currentquarterly dividend period.
The Board of Directors, or a duly authorized committee thereof, may, in its discretion, choose to paydividends on the Preferred Stock without the payment of any dividends on our common stock (or any of ourother stock ranking, as to the payment of dividends, junior to the Preferred Stock).
No dividends may be declared or paid or set apart for payment on any shares of the Preferred Stock if atthe same time any arrears exist or default exists in the payment of dividends on any outstanding class or seriesof our stock ranking prior to the Preferred Stock with respect to the payment of dividends. At the time ofissuance of the Preferred Stock, there will be no class or series of our stock which ranks prior to the PreferredStock with respect to the payment of dividends.
Holders of Preferred Stock will not be entitled to any dividends, whether payable in cash or property,other than as described above and will not be entitled to interest, or any sum in lieu of interest, in respect ofany dividend payment.
See also ""Regulatory Matters'' for a description of certain regulatory restrictions on our payment ofdividends.
Changes in the Dividends-Received Percentage. If, prior to October 29, 2004, one or more amendmentsto the Internal Revenue Code of 1986, as amended (the ""Code''), are enacted that eliminate or reduce thepercentage of the dividends-received deduction applicable to the Preferred Stock (currently 70 percent) asspeciÑed in section 243(a)(1) of the Code or any successor provision (the ""Dividends-Received Percent-age''), certain adjustments may be made in respect of the dividends payable by us, and Post Declaration DateDividends and Retroactive Dividends (as such terms are deÑned below) may become payable, as describedbelow.
The amount of each dividend payable (if declared) per share of Preferred Stock for dividend paymentsmade on or after the eÅective date of such change in the Code will be adjusted by multiplying the amount ofthe dividend that would otherwise be payable (before adjustment) by a factor, which will be the numberdetermined in accordance with the following formula (the ""DRD Formula''), and rounding the result to thenearest cent (with one-half cent rounded up):
1 ¿.35(1¿.70)1¿.35(1¿DRP)
For purposes of the DRD Formula, ""DRP'' means the Dividends-Received Percentage (expressed as adecimal) applicable to the dividend in question; provided, however, that if the Dividends-Received Percentageapplicable to the dividend in question shall be less than 50%, then the DRP shall equal .50. No amendment tothe Code, other than a change in the percentage of the dividends-received deduction applicable to thePreferred Stock as set forth in section 243(a)(1) of the Code or any successor provision, will give rise to anadjustment. Notwithstanding the foregoing provisions, if, with respect to any such amendment, we receiveeither an unqualiÑed opinion of nationally recognized independent tax counsel selected by us or a private letterruling or similar form of assurance from the Internal Revenue Service (the ""IRS'') to the eÅect that such anamendment does not apply to a dividend payable on the Preferred Stock, then such amendment will not resultin the adjustment provided for pursuant to the DRD Formula with respect to such dividend. The opinionreferenced in the previous sentence shall be based upon the legislation amending or establishing the DRP orupon a published pronouncement of the IRS addressing such legislation. Unless the context otherwiserequires, references to dividends in this OÅering Circular will mean dividends as adjusted by the DRDFormula. Our calculation of the dividends payable as so adjusted shall be Ñnal and not subject to review.
Notwithstanding the foregoing, if any such amendment to the Code is enacted after the dividend payableon a Dividend Payment Date has been declared but before such dividend is paid, the amount of the dividendpayable on such Dividend Payment Date will not be increased; instead, additional dividends (the ""PostDeclaration Date Dividends''), equal to the excess, if any, of (1) the product of the dividend paid by us on
19

such Dividend Payment Date and the DRD Formula (where the DRP used in the DRD Formula would beequal to the greater of the Dividends-Received Percentage applicable to the dividend in question and .50) over(2) the dividend paid by us on such Dividend Payment Date, will be payable (if declared) to Holders ofPreferred Stock on the record date applicable to the next succeeding Dividend Payment Date.
If any such amendment to the Code is enacted and the reduction in the Dividends-Received Percentageretroactively applies to a Dividend Payment Date as to which we previously paid dividends on the PreferredStock (each, an ""AÅected Dividend Payment Date''), we will pay (if declared) additional dividends (the""Retroactive Dividends'') to Holders of Preferred Stock on the record date applicable to the next succeedingDividend Payment Date (or, if such amendment is enacted after the dividend payable on such DividendPayment Date has been declared, to Holders of Preferred Stock on the record date applicable to the secondsucceeding Dividend Payment Date following the date of enactment), in an amount equal to the excess of(1) the product of the dividend paid by us on each AÅected Dividend Payment Date and the DRD Formula(where the DRP used in the DRD Formula would be equal to the greater of the Dividends-ReceivedPercentage and .50 applied to each AÅected Dividend Payment Date) over (2) the sum of the dividend paidby us on each AÅected Dividend Payment Date. We will only make one payment of Retroactive Dividends forany such amendment. Notwithstanding the foregoing provisions, if, with respect to any such amendment, wereceive either an unqualiÑed opinion of nationally recognized independent tax counsel selected by us or aprivate letter ruling or similar form of assurance from the IRS to the eÅect that such amendment does notapply to a dividend payable on an AÅected Dividend Payment Date for the Preferred Stock, then suchamendment will not result in the payment of Retroactive Dividends with respect to such AÅected DividendPayment Date. The opinion referenced in the previous sentence shall be based upon the legislation amendingor establishing the DRP or upon a published pronouncement of the IRS addressing such legislation.
Notwithstanding the foregoing, we will not make any adjustment in our dividends payable, and we willnot be required to pay Post Declaration Date Dividends or Retroactive Dividends, in respect of the enactmenton or after October 29, 2004 of any amendment to the Code that eliminates or reduces the Dividends-Received Percentage.
In the event that the amount of dividends payable per share of the Preferred Stock is adjusted pursuant tothe DRD Formula and/or Post Declaration Date Dividends or Retroactive Dividends are to be paid, we willgive notice of each such adjustment and, if applicable, any Post Declaration Date Dividends and RetroactiveDividends to the Holders of Preferred Stock.
Optional Redemption
The Preferred Stock will not be redeemable prior to April 29, 2008. On or after that date, subject to thenotice provisions set forth below and subject to any further limitations which may be imposed by law, we, atour option, may redeem the Preferred Stock, in whole or in part, at any time or from time to time, out of fundslegally available therefor, at the redemption price of $50 per share plus an amount equal to the dividend(whether or not declared) for the then-current quarterly dividend period accrued to but excluding the date ofredemption, including any adjustments in dividends payable due to changes in the Dividends-ReceivedPercentage but without accumulation of unpaid dividends on the Preferred Stock for prior dividend periods. Ifless than all of the outstanding shares of the Preferred Stock are to be redeemed, we will select shares to beredeemed from the outstanding shares not previously called for redemption by lot or pro rata (as nearly aspossible) or by any other method that the Board of Directors, or a duly authorized committee thereof, in itssole discretion deems equitable.
We will give notice of any such redemption by mail to Holders of Preferred Stock not less than 30 daysprior to the date Ñxed by the Board of Directors, or duly authorized committee thereof, for such redemption.Each notice will state the number of shares of Preferred Stock to be redeemed and, if fewer than all of theshares of Preferred Stock held by the applicable Holder are to be redeemed, the number of shares to beredeemed from such Holder, the redemption price, the redemption date and the place at which such Holder'scertiÑcate(s) representing shares of the Preferred Stock must be presented upon such redemption.
20

Under certain circumstances, we may need the approval of the Director prior to exercising our right toredeem shares of Preferred Stock. See ""Regulatory Matters.''
Once proper notice has been given, from and after the redemption date, dividends on the Preferred Stockcalled for redemption will cease to accrue and such Preferred Stock called for redemption will no longer bedeemed outstanding, and all rights of the Holders thereof as registered holders of the Preferred Stock willcease.
Liquidation Rights
Upon any voluntary or involuntary dissolution, liquidation or winding up of Fannie Mae, after payment orprovision for our liabilities and the expenses of such dissolution, liquidation or winding up, the Holders of theoutstanding shares of the Preferred Stock will be entitled to receive the amount of $50 per share plus anamount equal to the dividend (whether or not declared) for the then-current quarterly dividend periodaccrued to but excluding the date of such liquidation payment, including any adjustments in dividends payabledue to changes in the Dividends-Received Percentage but without accumulation of unpaid dividends on thePreferred Stock for prior dividend periods, out of our assets or proceeds thereof available for distribution tostockholders, before any payment or distribution of assets is made to holders of our common stock (or any ofour other stock ranking, as to the distribution of assets upon our dissolution, liquidation or winding up, juniorto the Preferred Stock). If our assets available for distribution in such event are insuÇcient to pay in full theaggregate amount payable to Holders of the Preferred Stock and holders of all other classes or series of ourstock, if any, ranking, as to the distribution of assets upon our dissolution, liquidation or winding up, equallywith the Preferred Stock, the assets will be distributed to the Holders of Preferred Stock and holders of suchother stock pro rata, based on the full respective preferential amounts to which they are entitled (including anyadjustments in dividends payable due to changes in the Dividends-Received Percentage but without, in thecase of any noncumulative preferred stock, accumulation of unpaid dividends for prior dividend periods).After payment of the full amount of the distribution of assets upon our dissolution, liquidation or winding up towhich they are entitled, the Holders of Preferred Stock will not be entitled to any further participation in anyof our distributions of assets.
Notwithstanding the foregoing, Holders of Preferred Stock will not be entitled to be paid any amount inrespect of our dissolution, liquidation or winding up until holders of any class or series of our stock ranking, asto the distribution of our assets upon dissolution, liquidation or winding up, prior to the Preferred Stock havebeen paid all amounts to which such classes or series are entitled. At the time of issuance of the PreferredStock, there will be no class or series of our stock ranking prior to the Preferred Stock with respect to thedistribution of assets upon our dissolution, liquidation or winding up.
Neither the sale, lease or exchange (for cash, shares of stock, securities or other consideration) of all orsubstantially all of our property and assets, nor our merger, consolidation or combination into or with any othercorporation, nor the merger, consolidation or combination of any other corporation or entity into or with us,shall be deemed to be a dissolution, liquidation or winding up, voluntary or involuntary, for the purposes ofthese provisions on liquidation rights.
Regulatory Matters
Holders of Preferred Stock are entitled to receive cash dividends if, as and when declared by the Board ofDirectors. However, certain provisions of the 1992 Act may operate to restrict the ability of the Board ofDirectors to declare dividends in certain circumstances. The 1992 Act established our risk-based capital,minimum capital and critical capital requirements. OFHEO released risk-based capital regulations for us andFreddie Mac on September 13, 2001. Until one year after the Ñnal regulations establishing the risk-basedcapital test are in eÅect, a dividend may be paid without the prior approval of the Director if we meet theminimum capital level and the dividend payment would not decrease our core capital below such level. See""Government Regulation and Charter Act.''
One year after Ñnal regulations establishing the risk-based capital test take eÅect, a dividend may be paidwithout the prior approval of the Director if we meet both the risk-based capital and minimum capital levels
21

and the dividend payment would not decrease our total capital below the risk-based capital level or our corecapital below the minimum capital level. If we meet either the risk-based capital standard or the minimumcapital standard, we may make a dividend payment without obtaining the approval of the Director only if thedividend payment would not cause us to fail to meet another capital standard. At any time when we do notmeet the risk-based capital standard but meet the minimum capital standard, we are prohibited from making adividend payment that would cause us to fail to meet the minimum capital standard. If we meet neither therisk-based capital standard nor the minimum capital standard but do meet the critical capital standardestablished under the 1992 Act, we may make a dividend payment only if we would not fail to meet the criticalcapital standard as a result of such payment and the Director approves the payment after Ñnding that itsatisÑes certain statutory conditions. The Director has the authority to require us to submit a report to theDirector regarding any capital distribution (including any dividend) declared by us before we make thedistribution. See ""Government Regulation and Charter Act'' and ""Management's Discussion and Analysis ofFinancial Condition and Results of OperationsÌLiquidity and Capital ResourcesÌRegulatory Environment''in the Form 10-K regarding our applicable capital standards.
Voting Rights; Amendments
Except as provided below, the Holders of Preferred Stock will not be entitled to any voting rights.
Without the consent of the Holders of Preferred Stock, we may amend, alter, supplement, or repeal anyterms of the Preferred Stock:
‚ to cure any ambiguity, or to cure, correct or supplement any provision contained in the CertiÑcate ofDesignation that may be defective or inconsistent; or
‚ to make any other provision with respect to matters or questions arising with respect to the PreferredStock that is not inconsistent with the provisions of the CertiÑcate of Designation, so long as suchaction does not materially and adversely aÅect the interests of the Holders of Preferred Stock.
The following are deemed not to materially and adversely aÅect the interests of the Holders of PreferredStock:
‚ any increase in the amount of authorized or issued Preferred Stock; or
‚ the creation and issuance, or an increase in the authorized or issued amount, of any other class or seriesof our stock, whether ranking prior to, on a parity with or junior to the Preferred Stock as to dividendsor liquidation or otherwise.
Otherwise, the terms of the Preferred Stock may be amended, altered, supplemented, or repealed onlywith the consent of the Holders of at least two-thirds of the outstanding shares of Preferred Stock. On mattersrequiring their consent, Holders of Preferred Stock will be entitled to one vote per share.
New York Stock Exchange Listing
We will apply to list the Preferred Stock on the NYSE under the symbol ""FNMprL''. If approved forlisting, we expect trading of the Preferred Stock on the NYSE to commence within a thirty-day period afterthe initial delivery of the Preferred Stock.
LEGALITY OF INVESTMENT
National banks may purchase, hold, and invest in for their own accounts the shares of Preferred Stockwithout regard to limitations generally applicable to investment securities. The Preferred Stock would besubject to a 100% risk weighting for capital adequacy purposes.
Federal savings associations and federal savings banks may invest in the shares of Preferred Stock withoutregard to limitations generally applicable to investments. Preferred Stock held by a federal savings associationor federal savings bank would be subject to a 100% risk weighting for capital adequacy purposes.
22

Federally insured state-chartered banks, state-chartered savings banks, and state-chartered savings andloan associations may invest in the shares of Preferred Stock to the extent permitted by the SecondaryMortgage Market Enhancement Act of 1984 (""SMMEA'') and by applicable state law, after complying withany procedures imposed by the state. Preferred Stock held by such an institution would be subject to a 100%risk weighting for federal capital adequacy purposes.
Federal credit unions may purchase the shares of Preferred Stock without regard to limitations generallyapplicable to investments.
The shares of Preferred Stock are ""stock . . . of a corporation which is an instrumentality of the UnitedStates'' within the meaning of Û 7701(a)(19)(C)(ii) of the Code for purposes of the 60 percent of assetslimitation applicable to domestic building and loan associations
In addition to the speciÑc authorizations discussed above, Û 106(a)(1) of SMMEA provides that anyperson, trust, corporation, partnership, association, business trust or business entity created pursuant to orexisting under the laws of the United States or any state (including the District of Columbia and Puerto Rico)(an ""investor'') is authorized to purchase, hold and invest in securities issued or guaranteed by us (includingthe shares of Preferred Stock) to the same extent that such investor is authorized to purchase, hold or invest inobligations issued or guaranteed as to principal and interest by the United States or any agency orinstrumentality thereof. Prior to October 4, 1991, states were authorized by SMMEA to enact legislation thateither prohibited or limited an investor's authority to purchase, hold or invest in securities issued or guaranteedby us. To the best of our knowledge, 18 states currently have legislation limiting to varying extents the abilityof certain entities (in most cases, insurance companies) to invest in securities issued or guaranteed by us,including the shares of Preferred Stock.
Notwithstanding the above, investors should consult their legal advisors to determine whether and towhat extent the shares of Preferred Stock constitute legal investments for such investors or are eligible to beused as security for borrowings. The foregoing does not take into consideration the application of statutes,regulations, orders, guidelines or agreements generally governing investments made by a particular investor,including but not limited to ""prudent investor'' provisions, safety and soundness conditions and percentage-of-assets limits. The regulatory authorities that administer the legal provisions referred to above generally reservediscretion whether securities, such as the Preferred Stock, that are otherwise acceptable for investment may bepurchased or pledged by the institutions subject to their jurisdiction. An institution under the jurisdiction ofthe Comptroller of the Currency, the Board of Governors of the Federal Reserve System, the Federal DepositInsurance Corporation, the OÇce of Thrift Supervision, the National Credit Union Administration, or anyother federal or state agency with similar authority should review any applicable regulations, policy statementsand guidelines before purchasing the Preferred Stock.
UNITED STATES TAXATION
The Preferred Stock and payments thereon generally are subject to taxation. Therefore, you shouldconsider the tax consequences of owning Preferred Stock before acquiring it.
In the opinion of Dewey Ballantine LLP, our special tax counsel, the following discussion correctlydescribes the principal aspects of the U.S. federal income tax treatment of U.S. Persons (as deÑned below)that are beneÑcial holders of the Preferred Stock (""Shareholders''). This discussion does not address the U.S.federal income tax treatment of Shareholders that are not U.S. Persons. This discussion is based on the Code,its legislative history, existing and proposed Treasury regulations, revenue rulings and judicial decisions,changes to any of which subsequent to the date of this OÅering Circular may aÅect, possibly on a retroactivebasis, the tax consequences described herein.
This summary discusses only the Preferred Stock purchased in this oÅering and held as a capital asset(within the meaning of federal tax law). This discussion does not purport to address all of the U.S. federalincome tax consequences that may be applicable to particular investors in light of their individual circum-stances or to Shareholders subject to special rules, such as dealers in securities, tax-exempt organizations, lifeinsurance companies, persons liable for alternative minimum tax, persons that hold the Preferred Stock as part
23

of a straddle or a hedging or conversion transaction, certain Ñnancial institutions and certain securities traders.In addition, this discussion does not address taxes imposed by any state, local or foreign taxing jurisdiction. Inall cases, investors are advised to consult their own tax advisors regarding the U.S. federal tax consequences tothem of holding, owning and disposing of Preferred Stock, as well as any tax consequences arising under thelaws of any state or other taxing jurisdiction.
For purposes of this discussion, ""U.S. Person'' generally means (1) a citizen or individual resident of theUnited States, (2) a corporation or partnership created or organized in or under the laws of the United Statesor any political subdivision thereof, (3) an estate the income of which is includible in its gross income for U.S.federal income tax purposes without regard to its source, or (4) a trust if a court within the United States isable to exercise primary supervision over its administration and at least one U.S. Person has the authority tocontrol all substantial decisions of the trust.
Dividends
Dividends declared and paid on the Preferred Stock will be dividends for U.S. federal income taxpurposes to the extent paid out of our current or accumulated earnings and proÑts, as determined for federalincome tax purposes, and will be taxable as ordinary income. Although we expect that our current andaccumulated earnings and proÑts will be such that all dividends paid with respect to the Preferred Stock willqualify as dividends for federal income tax purposes, we cannot guarantee that result. Our accumulatedearnings and proÑts and our current earnings and proÑts in future years will depend in signiÑcant part on ourfuture proÑts or losses, which we cannot accurately predict. To the extent that the amount of any dividend paidon a share of Preferred Stock exceeds our current or accumulated earnings and proÑts for federal income taxpurposes attributable to that share, the dividend will be treated Ñrst as a return of capital (rather than asordinary income) and will be applied against and reduce the Shareholder's adjusted tax basis in that share ofPreferred Stock. The amount of any such dividend in excess of the Shareholder's adjusted tax basis will thenbe taxed as capital gain. For purposes of the remainder of this discussion, it is assumed that dividends paidwith respect to the Preferred Stock will constitute dividends for U.S. federal income tax purposes.
Dividends received by Shareholders that are corporations generally will be eligible for the 70-percentdividends-received deduction under section 243 of the Code. The 70-percent dividends-received deduction willnot be available with respect to a dividend received on Preferred Stock that a Shareholder has held for 45 daysor less (including the day of disposition, but excluding the day of acquisition) during the 90-day periodbeginning on the day which is 45 days before the date on which the Preferred Stock becomes ex-dividend. Ifthe dividend is attributable to a period or periods aggregating more than 366 days, the dividends-receiveddeduction will be available only if the Shareholder has held the Preferred Stock for more than 90 days(including the day of disposition, but excluding the day of acquisition) during the 180-day period beginning90 days before the date on which the Preferred Stock becomes ex-dividend. The length of time that acorporate shareholder is deemed to have held stock for these purposes is reduced by periods during which theshareholder's risk of loss with respect to the stock is diminished by reason of the existence of certain options,contracts to sell, short sales or other similar transactions. The aggregate dividends-received deduction alloweda corporate shareholder cannot exceed 70 percent of its taxable income (with certain adjustments). Moreover,the dividends-received deduction may be reduced if the stock is ""debt Ñnanced.'' Stock is ""debt Ñnanced'' if acorporate shareholder incurs indebtedness ""directly attributable'' to a ""portfolio stock'' investment in anothercompany, which would include an investment in the Preferred Stock.
The Bush Administration has released a legislative proposal regarding dividends that is targeted ateliminating double corporate taxation. The proposal would permit corporations to distribute nontaxabledividends, but only to the extent that those dividends are paid out of income taxed at the corporate level. As ofthe date of this OÅering Circular, it is impossible to predict whether Congress will enact the Administration'sproposal into law and, if so, the form or eÅective date of that legislation.
24

Dispositions, Including Redemptions
Any sale, exchange, redemption (except as discussed below) or other disposition of the Preferred Stockgenerally will result in taxable gain or loss equal to the diÅerence between the amount realized upon thedisposition and the Shareholder's adjusted tax basis in the Preferred Stock. Such gain or loss will be capitalgain or loss and will be long-term capital gain or loss if the holding period for the Preferred Stock exceeds oneyear. Tax rates on capital gain for individual Shareholders vary depending on each Shareholder's income andholding period for the Preferred Stock. Shareholders that are individuals should contact their own tax advisorsfor more information or for the capital gains tax rate applicable to speciÑc shares of Preferred Stock. Thededuction of capital losses is subject to certain limitations.
A redemption of Preferred Stock may be treated as a dividend, rather than as payment in exchange forthe Preferred Stock, unless the redemption is ""not essentially equivalent to a dividend'' with respect to theShareholder within the meaning of section 302(b)(1) of the Code, ""is in complete redemption of all of thestock'' of Fannie Mae held by the Shareholder as described in section 302(b)(3) of the Code or otherwisemeets the requirements of one of the other exceptions from dividend treatment provided in section 302(b) ofthe Code. In applying these rules, the Shareholder must take into account not only the Preferred Stock andour other stock that it owns directly, but also the Preferred Stock and our other stock that it constructivelyowns within the meaning of section 318 of the Code. Because of the complex nature of these rules, eachShareholder should consult its tax advisor to determine whether a redemption of Preferred Stock will betreated as a dividend or as payment in exchange for the Preferred Stock. If the redemption payment is treatedas a dividend, the rules discussed above under ""Dividends'' apply.
Information Reporting and Backup Withholding
Payments of dividends on shares of Preferred Stock and payments of proceeds upon the sale orredemption of Preferred Stock generally are required to be reported to the IRS except in the case of abeneÑcial holder that is an ""exempt recipient.'' Individuals generally are not exempt recipients, whereascorporations and certain other entities generally are exempt recipients.
Backup withholding of U.S. federal income tax may apply to payments made with respect to shares ofPreferred Stock, as well as to payments of proceeds from the sale of shares of Preferred Stock, to Shareholdersthat are not exempt recipients and that fail to provide certain identifying information (such as the taxpayeridentiÑcation number of the Shareholder) in the manner required.
The U.S. federal income tax discussion set forth above is included for general information only and maynot be applicable depending upon a Shareholder's particular situation. Each Shareholder should consult itsown tax advisor with respect to the tax consequences to it of the ownership and disposition of the PreferredStock, including the tax consequences under the tax laws of the United States, states, localities, countriesother than the United States and any other taxing jurisdiction and the possible eÅects of changes in such taxlaws.
25

UNDERWRITING
Subject to the terms and conditions set forth in the underwriting agreement (the ""UnderwritingAgreement''), we have agreed to sell to each of the underwriters named below (collectively, the ""Underwrit-ers''), and each of the Underwriters, for whom Lehman Brothers Inc. (the ""Representative'') is acting asrepresentative, has severally agreed to purchase, the number of shares of Preferred Stock set forth opposite itsname below:
Underwriter Number of Shares
Lehman Brothers Inc. ÏÏÏÏÏÏÏÏÏÏÏÏÏÏÏÏÏÏÏÏÏÏÏÏÏÏÏÏÏÏÏÏÏÏÏÏÏÏÏÏÏÏÏÏÏÏÏÏ 2,400,000
Goldman, Sachs & Co. ÏÏÏÏÏÏÏÏÏÏÏÏÏÏÏÏÏÏÏÏÏÏÏÏÏÏÏÏÏÏÏÏÏÏÏÏÏÏÏÏÏÏÏÏÏÏÏ 1,800,000
Bear, Stearns & Co. Inc. ÏÏÏÏÏÏÏÏÏÏÏÏÏÏÏÏÏÏÏÏÏÏÏÏÏÏÏÏÏÏÏÏÏÏÏÏÏÏÏÏÏÏÏÏÏ 600,000
Deutsche Bank Securities Inc. ÏÏÏÏÏÏÏÏÏÏÏÏÏÏÏÏÏÏÏÏÏÏÏÏÏÏÏÏÏÏÏÏÏÏÏÏÏÏÏÏÏ 600,000
Utendahl Capital Partners, L.P. ÏÏÏÏÏÏÏÏÏÏÏÏÏÏÏÏÏÏÏÏÏÏÏÏÏÏÏÏÏÏÏÏÏÏÏÏÏÏÏÏ 600,000
TotalÏÏÏÏÏÏÏÏÏÏÏÏÏÏÏÏÏÏÏÏÏÏÏÏÏÏÏÏÏÏÏÏÏÏÏÏÏÏÏÏÏÏÏÏÏÏÏÏÏÏÏÏÏÏÏ 6,000,000
In the Underwriting Agreement, the Underwriters have severally agreed, subject to the terms andconditions set forth therein, to purchase all the Preferred Stock oÅered hereby if any is purchased.
The Representative has advised us that the Underwriters propose initially to oÅer the Preferred Stock tothe public at the initial public oÅering price set forth on the cover page of this OÅering Circular, and to certaindealers at such price less a concession not in excess of $0.2875 per share. The Underwriters may allow, andsuch dealers may reallow, a discount not in excess of $0.15 per share on sales to certain other dealers. After theinitial public oÅering, the public oÅering price, concession and discount may be changed.
We have granted the Underwriters an option exercisable for 30 days after the date of this OÅeringCircular to purchase up to an aggregate of 900,000 additional shares of Preferred Stock solely to coveroverallotments, if any. If the Underwriters exercise their overallotment option, the Underwriters have severallyagreed, subject to certain conditions, to purchase approximately the same percentage thereof that the numberof shares to be purchased by each of them, as shown in the foregoing table, bears to the 6,000,000 shares ofPreferred Stock oÅered.
Prior to this oÅering, there has been no public market for the Preferred Stock. We will apply to list thePreferred Stock on the NYSE under the symbol ""FNMprL.'' If accepted for listing, we expect that trading ofthe Preferred Stock on the NYSE will commence within a thirty-day period after the initial delivery of thePreferred Stock. The Representative has advised us that it intends to make a market in the Preferred Stockprior to the commencement of trading on the NYSE, but are not obligated to do so and may discontinue anysuch market making at any time without notice.
In the Underwriting Agreement, we and the Underwriters have agreed to indemnify each other againstand contribute toward certain liabilities.
The Underwriters and certain aÇliates thereof engage in transactions with and perform services for us inthe ordinary course of business.
The Underwriters may engage in certain transactions that stabilize the price of the Preferred Stock.These transactions may include entering stabilizing bids, which means the placing of a bid or the eÅecting of apurchase for the purpose of pegging, Ñxing or maintaining the price of the Preferred Stock. Neither we nor theUnderwriters make any representation or prediction as to the direction or magnitude of any eÅect that thetransactions described above may have on the price of the Preferred Stock. The Underwriters are not requiredto engage in any of these transactions. When so doing, the Underwriters act on their own behalf and not as ourrepresentatives. Any such transactions, if commenced, may be discontinued at any time.
26

RATING
Standard & Poor's Ratings Group, a Division of the McGraw-Hill Companies, has assigned the PreferredStock a rating of ""AA¿'', Moody's Investors Service, Inc. has assigned a rating of ""Aa3,'' and Fitch, Inc. hasassigned a rating of ""AA''. A security rating is not a recommendation to buy, sell or hold securities and maybe subject to revision or may be withdrawn at any time by the assigning rating organization.
ACCOUNTANTS
The audited Ñnancial statements of Fannie Mae as of December 31, 2002 and for each of the years in thethree-year period ended December 31, 2002, included in Appendix C and incorporated herein by reference,have been included in reliance upon the report of KPMG LLP, independent certiÑed public accountants, andupon the authority of that Ñrm as experts in accounting and auditing. The audit reports covering theDecember 31, 2001 and 2002 Ñnancial statements refer to a change in the accounting for derivative Ñnancialinstruments.
VALIDITY OF THE PREFERRED STOCK
The validity of the Preferred Stock will be passed upon for us by Sidley Austin Brown & Wood LLP,New York, New York, and for the Underwriters by Sullivan & Cromwell LLP, Washington, D.C. CertainU.S. federal income tax matters will be passed upon for us by Dewey Ballantine LLP, Washington, D.C.
ADDITIONAL INFORMATION ABOUT FANNIE MAE
We are incorporating by reference in this OÅering Circular the documents listed below that we publishfrom time to time. This means that we are disclosing information to you by referring you to those documents.The documents incorporated by reference are considered part of this OÅering Circular, so you should read thisOÅering Circular, and any applicable supplements or amendments, together with those documents.
You should rely only on the information provided or incorporated by reference in this OÅering Circular,and you should rely only on the most current information.
The following documents are incorporated by reference in this OÅering Circular:
‚ our most recent Form 10-K; and;
‚ any Form 10-K's, Quarterly Reports on Form 10-Q and Current Reports on Form 8-K (""Form 8-K'')that we Ñle with the SEC after the date of this OÅering Circular and prior to the termination of theoÅering of the Preferred Stock. Information we ""furnish'' to the SEC on Form 8-K shall not beincorporated by reference in this OÅering Circular.
You may read our SEC Ñlings and other information about Fannie Mae at the oÇces of the New YorkStock Exchange, the Chicago Stock Exchange and the PaciÑc Exchange. Our SEC Ñlings also will beavailable at the SEC's website at www.sec.gov. You also may read and copy any document we Ñle with theSEC by visiting the SEC's Public Reference Room at 450 Fifth Street, NW, Washington, DC 20549. Pleasecall the SEC at 1-800-SEC-0330 for further information about the operation of the Public Reference Room.We are providing the address of the SEC's internet site solely for the information of prospective investors. Wedo not intend the internet address to be an active link. This means that information which appears on theSEC's website is not incorporated into this OÅering Circular, except as speciÑcally stated in this OÅeringCircular.
You can obtain copies of the periodic reports we Ñle with the SEC and a copy of this OÅering Circularwithout charge from our OÇce of Investor Relations, Fannie Mae, 3900 Wisconsin Avenue, NW, Washing-ton, DC 20016, telephone: (202) 752-7115. The periodic reports that we Ñle with the SEC and this OÅeringCircular will be also available on our website at www.fanniemae.com.
Other than the documents speciÑcally incorporated by reference herein, the information on our website isnot part of or incorporated by reference in this OÅering Circular.
27

Appendix A
Reconciliation of Core Business Earnings to GAAP Reported Results
Dollars and shares in millions, except per share amounts
Quarter Ended Quarter EndedMarch 31, 2003 March 31, 2002
Core CoreBusiness Reconciling Reported Business Reconciling ReportedEarnings Items Results Earnings Items Results
Net interest income ÏÏÏÏÏÏÏÏÏÏÏÏÏÏÏÏÏÏÏÏÏÏÏÏÏ $3,368.4 $ Ì $3,368.4 $2,430.4 $ Ì $2,430.4Purchased options amortization expense(1) ÏÏÏÏÏ (764.3) 764.3 Ì (310.2) 310.2 Ì
Core net interest income ÏÏÏÏÏÏÏÏÏÏÏÏÏÏÏÏÏÏÏÏÏ 2,604.1 764.3 3,368.4 2,120.2 310.2 2,430.4Guaranty fee income (expense) ÏÏÏÏÏÏÏÏÏÏÏÏÏÏÏ 546.6 Ì 546.6 407.6 Ì 407.6Fee and other income (expense), netÏÏÏÏÏÏÏÏÏÏÏ 113.3 Ì 113.3 3.6 Ì 3.6Credit-related expenses ÏÏÏÏÏÏÏÏÏÏÏÏÏÏÏÏÏÏÏÏÏÏ (20.3) Ì (20.3) (21.7) Ì (21.7)Administrative expensesÏÏÏÏÏÏÏÏÏÏÏÏÏÏÏÏÏÏÏÏÏÏ (343.8) Ì (343.8) (290.1) Ì (290.1)
Purchased options expense under FAS 133(2)ÏÏÏ Ì (624.6) (624.6) Ì (787.2) (787.2)Debt extinguishments, net ÏÏÏÏÏÏÏÏÏÏÏÏÏÏÏÏÏÏÏÏ (392.2) Ì (392.2) (171.7) Ì (171.7)
Income before federal income taxes ÏÏÏÏÏÏÏÏÏÏÏÏ 2,507.7 139.7 2,647.4 2,047.9 (477.0) 1,570.9Provision for federal income taxes(3) ÏÏÏÏÏÏÏÏÏÏ (658.0) (48.9) (706.9) (529.2) 166.9 (362.3)
Net income ÏÏÏÏÏÏÏÏÏÏÏÏÏÏÏÏÏÏÏÏÏÏÏÏÏÏÏÏ $1,849.7 $ 90.8 $1,940.5 $1,518.7 $(310.1) $1,208.6
Preferred stock dividends ÏÏÏÏÏÏÏÏÏÏÏÏÏÏÏÏÏÏÏÏÏ $ (30.3) $ Ì $ (30.3) $ (32.8) $ Ì $ (32.8)Weighted average diluted common shares
outstanding ÏÏÏÏÏÏÏÏÏÏÏÏÏÏÏÏÏÏÏÏÏÏÏÏÏÏÏÏÏÏ 990.2 Ì 990.2 1,001.7 Ì 1,001.7Diluted earnings per common share ÏÏÏÏÏÏÏÏÏÏÏ $ 1.84 $ 0.09 $ 1.93 $ 1.48 $ (0.31) $ 1.17
Core BusinessReported Results Earnings
Quarter Ended Quarter Ended3/31/03 3/31/02 3/31/03 3/31/02
Net interest income ÏÏÏÏÏÏÏÏÏÏÏÏÏÏÏÏÏÏÏÏÏÏÏÏÏÏÏÏÏÏÏÏÏÏÏÏÏÏÏÏ $ 3,368.4 $ 2,430.4 $ 3,368.4 $ 2,430.4Taxable-equivalent adjustment on tax-exempt investments(4)ÏÏÏÏÏ 122.9 123.0 122.9 123.0
Taxable-equivalent net interest income ÏÏÏÏÏÏÏÏÏÏÏÏÏÏÏÏÏÏÏÏÏÏÏÏ $ 3,491.3 $ 2,553.4 3,491.3 2,553.4
Purchased options amortization expense ÏÏÏÏÏÏÏÏÏÏÏÏÏÏÏÏÏÏÏÏÏÏÏ (764.3) (310.2)
Taxable-equivalent core net interest incomeÏÏÏÏÏÏÏÏÏÏÏÏÏÏÏÏÏÏÏÏ $ 2,727.0 $ 2,243.2
Average net investment balance ÏÏÏÏÏÏÏÏÏÏÏÏÏÏÏÏÏÏÏÏÏÏÏÏÏÏÏÏÏÏ $871,939 $780,769 $871,939 $780,769Average investment yieldÏÏÏÏÏÏÏÏÏÏÏÏÏÏÏÏÏÏÏÏÏÏÏÏÏÏÏÏÏÏÏÏÏÏÏÏ 5.94% 6.49% 5.94% 6.49%Average borrowing cost ÏÏÏÏÏÏÏÏÏÏÏÏÏÏÏÏÏÏÏÏÏÏÏÏÏÏÏÏÏÏÏÏÏÏÏÏÏ 4.51% 5.36% 4.51% 5.36%Purchased options amortization expense ÏÏÏÏÏÏÏÏÏÏÏÏÏÏÏÏÏÏÏÏÏÏÏ 0.37% 0.16%Average core borrowing cost(5)ÏÏÏÏÏÏÏÏÏÏÏÏÏÏÏÏÏÏÏÏÏÏÏÏÏÏÏÏÏÏ 4.88% 5.52%Net interest yield, taxable-equivalent basis(6) ÏÏÏÏÏÏÏÏÏÏÏÏÏÏÏÏÏÏ 1.60% 1.31%Net interest margin, taxable-equivalent basis(7) ÏÏÏÏÏÏÏÏÏÏÏÏÏÏÏÏ 1.25% 1.15%Net interest income ÏÏÏÏÏÏÏÏÏÏÏÏÏÏÏÏÏÏÏÏÏÏÏÏÏÏÏÏÏÏÏÏÏÏÏÏÏÏÏÏ $ 3,368.4 $ 2,430.4 $ 3,368.4 $ 2,430.4Guaranty fee income ÏÏÏÏÏÏÏÏÏÏÏÏÏÏÏÏÏÏÏÏÏÏÏÏÏÏÏÏÏÏÏÏÏÏÏÏÏÏÏ 546.6 407.6 546.6 407.6Fee and other income (expense), net ÏÏÏÏÏÏÏÏÏÏÏÏÏÏÏÏÏÏÏÏÏÏÏÏÏ 113.3 3.6 113.3 3.6
Total revenuesÏÏÏÏÏÏÏÏÏÏÏÏÏÏÏÏÏÏÏÏÏÏÏÏÏÏÏÏÏÏÏÏÏÏÏÏÏÏÏÏÏ 4,028.3 2,841.6 4,028.3 2,841.6
Investment tax credits(8) ÏÏÏÏÏÏÏÏÏÏÏÏÏÏÏÏÏÏÏÏÏÏÏÏÏÏÏÏÏÏÏÏÏÏÏ 216.3 185.5 216.3 185.5Tax-exempt investments(4) ÏÏÏÏÏÏÏÏÏÏÏÏÏÏÏÏÏÏÏÏÏÏÏÏÏÏÏÏÏÏÏÏÏ 122.9 123.0 122.9 123.0
Total taxable-equivalent adjustments ÏÏÏÏÏÏÏÏÏÏÏÏÏÏÏÏÏÏÏÏÏÏ 339.2 308.5 339.2 308.5
Taxable-equivalent revenues ÏÏÏÏÏÏÏÏÏÏÏÏÏÏÏÏÏÏÏÏÏÏÏÏÏÏÏÏÏÏÏÏÏ $ 4,367.5 $ 3,150.1 4,367.5 3,150.1
Purchased options amortization expense ÏÏÏÏÏÏÏÏÏÏÏÏÏÏÏÏÏÏÏÏÏÏÏ (764.3) (310.2)
Core taxable-equivalent revenues ÏÏÏÏÏÏÏÏÏÏÏÏÏÏÏÏÏÏÏÏÏÏÏÏÏÏÏÏÏ $ 3,603.2 $ 2,839.9
A-1

(1) This amount represents the straight-line amortization of purchased options expense allocated to interest expense overthe original expected life of the options. Included in core business earnings instead of the unrealized gains and losseson purchased options to make it consistent with the accounting for the embedded options in our callable debt and thevast majority of our mortgages.
(2) This amount represents unrealized gains and losses on purchased options recorded in accordance with FAS 133.
(3) The reconciling item represents the net federal income tax eÅect of core business earnings adjustments based on theapplicable federal income tax rate of 35 percent.
(4) ReÖects non-GAAP adjustments to permit comparison of yields on tax-exempt and taxable assets based on a 35percent marginal tax rate.
(5) Includes the eÅect of purchased options amortization expense allocated to interest expense over the original expectedlife of the options.
(6) Annualized taxable-equivalent net interest income divided by the weighted average net investment balance.
(7) Annualized taxable-equivalent core net interest income divided by the weighted average net investment balance.
(8) Represents non-GAAP adjustments for tax credits related to losses on certain aÅordable housing tax-advantagedequity investments and other investment tax credits using a 35% marginal tax rate.
A-2

APPENDIX B
CERTIFICATE OF DESIGNATION OF TERMS OF5.125% NON-CUMULATIVE PREFERRED STOCK, SERIES L
1. Designation, Par Value and Number of Shares.
The designation of the series of preferred stock of the Federal National Mortgage Association (""FannieMae'') created by this resolution shall be ""5.125% Non-Cumulative Preferred Stock, Series L'' (the ""Series LPreferred Stock''), and the number of shares initially constituting the Series L Preferred Stock is 6,000,000*.Shares of Series L Preferred Stock will have no par value and a stated value and liquidation preference of $50per share. The Board of Directors of Fannie Mae, or a duly authorized committee thereof, in its solediscretion, may reduce the number of shares of Series L Preferred Stock, provided such reduction is not belowthe number of shares of Series L Preferred Stock then outstanding.
2. Dividends.
(a) Holders of record of Series L Preferred Stock (each individually a ""Holder'', or collectively the""Holders'') will be entitled to receive, when, as and if declared by the Board of Directors of Fannie Mae, or aduly authorized committee thereof, in its sole discretion out of funds legally available therefor, non-cumulativequarterly cash dividends which will accrue from and including April 29, 2003 and will be payable onMarch 31, June 30, September 30 and December 31 of each year (each, a ""Dividend Payment Date''),commencing June 30, 2003 at the annual rate of $2.5625 per share or 5.125% of the stated value andliquidation preference of $50 per share (without taking into account any adjustments referred to in clause(b) below). If a Dividend Payment Date is not a Business Day, the related dividend (if declared) will be paidon the next succeeding Business Day with the same force and eÅect as though paid on the Dividend PaymentDate, without any increase to account for the period from such Dividend Payment Date through the date ofactual payment. A ""Business Day'' shall mean any day other than a Saturday, Sunday, or a day on whichbanking institutions in New York, New York are authorized by law to close. Dividends will be paid to Holderson the record date Ñxed by the Board of Directors or a duly authorized committee thereof, which may not beearlier than 45 days or later than 10 days prior to the applicable Dividend Payment Date. If declared, theinitial dividend, which will be for the period from and including April 29, 2003 to but excluding June 30, 2003,will be $0.4342 per share and will be payable on June 30, 2003 and, thereafter, if declared, quarterly dividendswill be $0.6406 per share. After the initial dividend, the dividend period relating to a Dividend Payment Datewill be the period from and including the preceding Dividend Payment Date to but excluding the relatedDividend Payment Date. If Fannie Mae redeems the Series L Preferred Stock, the dividend that wouldotherwise be payable for the then-current quarterly dividend period accrued to but excluding the date ofredemption will be included in the redemption price of the shares redeemed and will not be separately payable.Dividends payable on the Series L Preferred Stock for any period greater or less than a full dividend periodwill be computed on the basis of a 360-day year consisting of twelve 30-day months. The amount of dividendsper share payable at redemption will be rounded to the fourth digit after the decimal point. (If the Ñfth digit tothe right of the decimal point is Ñve or greater, the fourth digit will be rounded up by one.)
(b) If, prior to October 29, 2004, one or more amendments to the Internal Revenue Code of 1986, asamended (the ""Code''), are enacted that eliminate or reduce the percentage of the dividends-receiveddeduction applicable to the Series L Preferred Stock as speciÑed in section 243(a)(1) of the Code or anysuccessor provision thereto (the ""Dividends-Received Percentage''), certain adjustments may be made inrespect of the dividends payable by Fannie Mae, and Post Declaration Date Dividends and RetroactiveDividends (as such terms are deÑned below) may become payable, as described below.
The amount of each dividend payable (if declared) per share of Series L Preferred Stock for dividendpayments made on or after the eÅective date of such change in the Code will be adjusted by multiplying theamount of the dividend payable pursuant to clause (a) of this Section 2 (before adjustment) by a factor,
* Plus up to 900,000 additional shares pursuant to the Underwriters' overallotment option.
B-1

which will be the number determined in accordance with the following formula (the ""DRD Formula''), androunding the result to the nearest cent (with one-half cent rounded up):
1¿.35(1¿.70)
1¿.35(1¿DRP)
For purposes of the DRD Formula, ""DRP'' means the Dividends-Received Percentage (expressed as adecimal) applicable to the dividend in question; provided, however, that if the Dividends-Received Percentageapplicable to the dividend in question shall be less than 50%, then the DRP shall equal .50. No amendment tothe Code, other than a change in the percentage of the dividends-received deduction applicable to the Series LPreferred Stock as set forth in section 243(a)(1) of the Code or any successor provision thereto, will give riseto an adjustment. Notwithstanding the foregoing provisions, if, with respect to any such amendment, FannieMae receives either an unqualiÑed opinion of nationally recognized independent tax counsel selected byFannie Mae or a private letter ruling or similar form of assurance from the Internal Revenue Service (the""IRS'') to the eÅect that such an amendment does not apply to a dividend payable on the Series L PreferredStock, then such amendment will not result in the adjustment provided for pursuant to the DRD Formula withrespect to such dividend. The opinion referenced in the previous sentence shall be based upon the legislationamending or establishing the DRP or upon a published pronouncement of the IRS addressing such legislation.Unless the context otherwise requires, references to dividends herein will mean dividends as adjusted by theDRD Formula. Fannie Mae's calculation of the dividends payable as so adjusted shall be Ñnal and not subjectto review.
Notwithstanding the foregoing, if any such amendment to the Code is enacted after the dividend payableon a Dividend Payment Date has been declared but before such dividend is paid, the amount of the dividendpayable on such Dividend Payment Date will not be increased; instead, additional dividends (the ""PostDeclaration Date Dividends''), equal to the excess, if any, of (1) the product of the dividend paid by FannieMae on such Dividend Payment Date and the DRD Formula (where the DRP used in the DRD Formulawould be equal to the greater of the Dividends-Received Percentage applicable to the dividend in question and.50) over (2) the dividend paid by Fannie Mae on such Dividend Payment Date, will be payable (if declared)to Holders on the record date applicable to the next succeeding Dividend Payment Date.
If any such amendment to the Code is enacted and the reduction in the Dividends-Received Percentageretroactively applies to a Dividend Payment Date as to which Fannie Mae previously paid dividends on theSeries L Preferred Stock (each, an ""AÅected Dividend Payment Date''), Fannie Mae will pay (if declared)additional dividends (the ""Retroactive Dividends'') to Holders on the record date applicable to the nextsucceeding Dividend Payment Date (or, if such amendment is enacted after the dividend payable on suchDividend Payment Date has been declared, to Holders on the record date applicable to the second succeedingDividend Payment Date following the date of enactment), in an amount equal to the excess of (1) the productof the dividend paid by Fannie Mae on each AÅected Dividend Payment Date and the DRD Formula (wherethe DRP used in the DRD Formula would be equal to the greater of the Dividends-Received Percentage and.50 applied to each AÅected Dividend Payment Date) over (2) the sum of the dividend paid by Fannie Maeon each AÅected Dividend Payment Date. Fannie Mae will only make one payment of Retroactive Dividendsfor any such amendment. Notwithstanding the foregoing provisions, if, with respect to any such amendment,Fannie Mae receives either an unqualiÑed opinion of nationally recognized independent tax counsel selectedby Fannie Mae or a private letter ruling or similar form of assurance from the IRS to the eÅect that suchamendment does not apply to a dividend payable on an AÅected Dividend Payment Date for the Series LPreferred Stock, then such amendment will not result in the payment of Retroactive Dividends with respect tosuch AÅected Dividend Payment Date. The opinion referenced in the previous sentence shall be based uponlegislation amending or establishing the DRP or upon a published pronouncement of the IRS addressing suchlegislation.
Notwithstanding the foregoing, no adjustment in the dividends payable by Fannie Mae shall be made,and no Post Declaration Date Dividends or Retroactive Dividends shall be payable by Fannie Mae, in respectof the enactment of any amendment to the Code on or after October 29, 2004 that eliminates or reduces theDividends-Received Percentage.
B-2

In the event that the amount of dividends payable per share of Series L Preferred Stock is adjustedpursuant to the DRD Formula and/or Post Declaration Date Dividends or Retroactive Dividends are to bepaid, Fannie Mae will cause notice of each such adjustment and, if applicable, Post Declaration DateDividends and Retroactive Dividends to be given as soon as practicable to the Holders of Series L PreferredStock.
(c) No dividend (other than dividends or distributions paid in shares of, or options, warrants or rights tosubscribe for or purchase shares of, the common stock of Fannie Mae or any other stock of Fannie Maeranking, as to the payment of dividends and the distribution of assets upon dissolution, liquidation or windingup of Fannie Mae, junior to the Series L Preferred Stock) may be declared or paid or set apart for payment onFannie Mae's common stock (or on any other stock of Fannie Mae ranking, as to the payment of dividends,junior to the Series L Preferred Stock) unless dividends have been declared and paid or set apart (or orderedto be set apart) on the Series L Preferred Stock for the then-current quarterly dividend period; provided,however, that the foregoing dividend preference shall not be cumulative and shall not in any way create anyclaim or right in favor of the Holders of Series L Preferred Stock in the event that dividends have not beendeclared or paid or set apart (or ordered to be set apart) on the Series L Preferred Stock in respect of any priordividend period. If the full dividend on the Series L Preferred Stock is not paid for any quarterly dividendperiod, the Holders of Series L Preferred Stock will have no claim in respect of the unpaid amount so long asno dividend (other than those referred to above) is paid on Fannie Mae's common stock (or any other stock ofFannie Mae ranking, as to the payment of dividends, junior to the Series L Preferred Stock) for such dividendperiod.
(d) The Board of Directors of Fannie Mae, or a duly authorized committee thereof, may, in itsdiscretion, choose to pay dividends on the Series L Preferred Stock without the payment of any dividends onFannie Mae's common stock (or any other stock of Fannie Mae ranking, as to the payment of dividends,junior to the Series L Preferred Stock).
(e) No full dividends shall be declared or paid or set apart for payment on any stock of Fannie Maeranking, as to the payment of dividends, on a parity with the Series L Preferred Stock for any period unless fulldividends have been declared and paid or set apart for payment on the Series L Preferred Stock for the then-current quarterly dividend period. When dividends are not paid in full upon the Series L Preferred Stock andall other classes or series of stock of Fannie Mae, if any, ranking, as to the payment of dividends, on a paritywith the Series L Preferred Stock, all dividends declared upon shares of Series L Preferred Stock and all suchother stock of Fannie Mae will be declared pro rata so that the amount of dividends declared per share ofSeries L Preferred Stock and all such other stock will in all cases bear to each other the same ratio thataccrued dividends per share of Series L Preferred Stock (including any adjustments in dividends payable dueto changes in the Dividends-Received Percentage but without, in the case of any noncumulative preferredstock, accumulation of unpaid dividends for prior dividend periods) and such other stock bear to each other.
(f) No dividends may be declared or paid or set apart for payment on any shares of Series L PreferredStock if at the same time any arrears exist or default exists in the payment of dividends on any outstandingclass or series of stock of Fannie Mae ranking, as to the payment of dividends, prior to the Series L PreferredStock.
(g) Holders of Series L Preferred Stock will not be entitled to any dividends, whether payable in cash orproperty, other than as herein provided and will not be entitled to interest, or any sum in lieu of interest, inrespect of any dividend payment.
3. Optional Redemption.
(a) The Series L Preferred Stock shall not be redeemable prior to April 29, 2008. On or after that date,subject to the notice provisions set forth in Section 3(b) below and subject to any further limitations whichmay be imposed by law, Fannie Mae may redeem the Series L Preferred Stock, in whole or in part, at anytime or from time to time, out of funds legally available therefor, at the redemption price of $50 per share plusan amount equal to the amount of the dividend (whether or not declared) for the then-current quarterlydividend period accrued to but excluding the date of such redemption, including any adjustments in dividends
B-3

payable due to changes in the Dividends-Received Percentage but without accumulation of unpaid dividendson the Series L Preferred Stock for prior dividend periods. If less than all of the outstanding shares of Series LPreferred Stock are to be redeemed, Fannie Mae will select the shares to be redeemed from the outstandingshares not previously called for redemption by lot or pro rata (as nearly as possible) or by any other methodthat the Board of Directors of Fannie Mae, or a duly authorized committee thereof, in its sole discretiondeems equitable.
(b) In the event Fannie Mae shall redeem any or all of the Series L Preferred Stock as aforesaid, FannieMae will give notice of any such redemption to Holders of Series L Preferred Stock not less than 30 days priorto the date Ñxed by the Board of Directors of Fannie Mae, or duly authorized committee thereof, for suchredemption. Each such notice will state: (1) the number of shares of Series L Preferred Stock to be redeemedand, if fewer than all of the shares of Series L Preferred Stock held by a Holder are to be redeemed, thenumber of shares to be redeemed from such Holder; (2) the redemption price; (3) the redemption date; and(4) the place at which a Holder's certiÑcate(s) representing shares of Series L Preferred Stock must bepresented upon such redemption. Failure to give notice, or any defect in the notice, to any Holder of Series LPreferred Stock shall not aÅect the validity of the proceedings for the redemption of shares of any otherHolder of Series L Preferred Stock being redeemed.
(c) Notice having been given as herein provided, from and after the redemption date, dividends on theSeries L Preferred Stock called for redemption shall cease to accrue and such Series L Preferred Stock calledfor redemption will no longer be deemed outstanding, and all rights of the Holders thereof as registeredholders of such shares of Series L Preferred Stock will cease. Upon surrender in accordance with said notice ofthe certiÑcate(s) representing shares of Series L Preferred Stock so redeemed (properly endorsed or assignedfor transfer, if the Board of Directors of Fannie Mae, or a duly authorized committee thereof, shall so requireand the notice shall so state), such shares shall be redeemed by Fannie Mae at the redemption price aforesaid.Any shares of Series L Preferred Stock that shall at any time have been redeemed shall, after suchredemption, be cancelled and not reissued. In case fewer than all the shares represented by any such certiÑcateare redeemed, a new certiÑcate shall be issued representing the unredeemed shares without cost to the Holderthereof.
(d) The Series L Preferred Stock will not be subject to any mandatory redemption, sinking fund or othersimilar provisions. In addition, Holders of Series L Preferred Stock will have no right to require redemption ofany shares of Series L Preferred Stock.
4. Liquidation Rights.
(a) Upon any voluntary or involuntary dissolution, liquidation or winding up of Fannie Mae, afterpayment or provision for the liabilities of Fannie Mae and the expenses of such dissolution, liquidation orwinding up, the Holders of outstanding shares of the Series L Preferred Stock will be entitled to receive out ofthe assets of Fannie Mae or proceeds thereof available for distribution to stockholders, before any payment ordistribution of assets is made to holders of Fannie Mae's common stock (or any other stock of Fannie Maeranking, as to the distribution of assets upon dissolution, liquidation or winding up of Fannie Mae, junior to theSeries L Preferred Stock), the amount of $50 per share plus an amount equal to the dividend (whether or notdeclared) for the then-current quarterly dividend period accrued to but excluding the date of such liquidationpayment, including any adjustments in dividends payable due to changes in the Dividends-ReceivedPercentage but without accumulation of unpaid dividends on the Series L Preferred Stock for prior dividendperiods.
(b) If the assets of Fannie Mae available for distribution in such event are insuÇcient to pay in full theaggregate amount payable to Holders of Series L Preferred Stock and holders of all other classes or series ofstock of Fannie Mae, if any, ranking, as to the distribution of assets upon dissolution, liquidation or winding upof Fannie Mae, on a parity with the Series L Preferred Stock, the assets will be distributed to the Holders ofSeries L Preferred Stock and holders of all such other stock pro rata, based on the full respective preferentialamounts to which they are entitled (including any adjustments in dividends payable due to changes in the
B-4

Dividends-Received Percentage but without, in the case of any noncumulative preferred stock, accumulationof unpaid dividends for prior dividend periods).
(c) Notwithstanding the foregoing, Holders of Series L Preferred Stock will not be entitled to be paidany amount in respect of a dissolution, liquidation or winding up of Fannie Mae until holders of any classes orseries of stock of Fannie Mae ranking, as to the distribution of assets upon dissolution, liquidation or windingup of Fannie Mae, prior to the Series L Preferred Stock have been paid all amounts to which such classes orseries are entitled.
(d) Neither the sale, lease or exchange (for cash, shares of stock, securities or other consideration) of allor substantially all of the property and assets of Fannie Mae, nor the merger, consolidation or combination ofFannie Mae into or with any other corporation or the merger, consolidation or combination of any othercorporation or entity into or with Fannie Mae, shall be deemed to be a dissolution, liquidation or winding up,voluntary or involuntary, for the purposes of this Section 4.
(e) After payment of the full amount of the distribution of assets upon dissolution, liquidation or windingup of Fannie Mae to which they are entitled pursuant to paragraphs (a), (b) and (c) of this Section 4, theHolders of Series L Preferred Stock will not be entitled to any further participation in any distribution of assetsby Fannie Mae.
5. No Conversion or Exchange Rights.
The Holders of shares of Series L Preferred Stock will not have any rights to convert such shares into orexchange such shares for shares of any other class or classes, or of any other series of any class or classes, ofstock or obligations of Fannie Mae.
6. No Pre-Emptive Rights.
No Holder of Series L Preferred Stock shall be entitled as a matter of right to subscribe for or purchase,or have any pre-emptive right with respect to, any part of any new or additional issue of stock of any classwhatsoever, or of securities convertible into any stock of any class whatsoever, or any other shares, rights,options or other securities of any class whatsoever, whether now or hereafter authorized and whether issued forcash or other consideration or by way of dividend.
7. Voting Rights; Amendments.
(a) Except as provided below, the Holders of Series L Preferred Stock will not be entitled to any votingrights, either general or special.
(b) Without the consent of the Holders of Series L Preferred Stock, Fannie Mae will have the right toamend, alter, supplement or repeal any terms of this CertiÑcate or the Series L Preferred Stock (1) to cureany ambiguity, or to cure, correct or supplement any provision contained in this CertiÑcate of Designation thatmay be defective or inconsistent with any other provision herein or (2) to make any other provision withrespect to matters or questions arising with respect to the Series L Preferred Stock that is not inconsistent withthe provisions of this CertiÑcate of Designation so long as such action does not materially and adversely aÅectthe interests of the Holders of Series L Preferred Stock; provided, however, that any increase in the amount ofauthorized or issued Series L Preferred Stock or the creation and issuance, or an increase in the authorized orissued amount, of any other class or series of stock of Fannie Mae, whether ranking prior to, on a parity with orjunior to the Series L Preferred Stock, as to the payment of dividends or the distribution of assets upondissolution, liquidation or winding up of Fannie Mae, or otherwise, will not be deemed to materially andadversely aÅect the interests of the Holders of Series L Preferred Stock.
(c) Except as set forth in paragraph (b) of this Section 7, the terms of this CertiÑcate or the Series LPreferred Stock may be amended, altered, supplemented, or repealed only with the consent of the Holders ofat least two-thirds of the shares of Series L Preferred Stock then outstanding, given in person or by proxy,either in writing or at a meeting of stockholders at which the Holders of Series L Preferred Stock shall vote
B-5

separately as a class. On matters requiring their consent, Holders of Series L Preferred Stock will be entitledto one vote per share.
(d) The rules and procedures for calling and conducting any meeting of Holders (including, withoutlimitation, the Ñxing of a record date in connection therewith), the solicitation and use of proxies at such ameeting, the obtaining of written consents, and any other aspect or matter with regard to such a meeting orsuch consents shall be governed by any rules that the Board of Directors of Fannie Mae, or a duly authorizedcommittee thereof, in its discretion, may adopt from time to time, which rules and procedures shall conform tothe requirements of any national securities exchange on which the Series L Preferred Stock are listed at thetime.
8. Additional Classes or Series of Stock.
The Board of Directors of Fannie Mae, or a duly authorized committee thereof, shall have the right atany time in the future to authorize, create and issue, by resolution or resolutions, one or more additionalclasses or series of stock of Fannie Mae, and to determine and Ñx the distinguishing characteristics and therelative rights, preferences, privileges and other terms of the shares thereof. Any such class or series of stockmay rank prior to, on a parity with or junior to the Series L Preferred Stock as to the payment of dividends orthe distribution of assets upon dissolution, liquidation or winding up of Fannie Mae, or otherwise.
9. Priority.
For purposes of this CertiÑcate of Designation, any stock of any class or series of Fannie Mae shall bedeemed to rank:
(a) Prior to the shares of Series L Preferred Stock, either as to the payment of dividends or thedistribution of assets upon dissolution, liquidation or winding up of Fannie Mae, if the holders of such class orseries shall be entitled to the receipt of dividends or of amounts distributable upon dissolution, liquidation orwinding up of Fannie Mae, as the case may be, in preference or priority to the Holders of shares of Series LPreferred Stock.
(b) On a parity with shares of Series L Preferred Stock, either as to the payment of dividends or thedistribution of assets upon dissolution, liquidation or winding up of Fannie Mae, whether or not the dividendrates or amounts, dividend payment dates or redemption or liquidation prices per share, if any, be diÅerentfrom those of the Series L Preferred Stock, if the holders of such class or series shall be entitled to the receiptof dividends or of amounts distributable upon dissolution, liquidation or winding up of Fannie Mae, as the casemay be, in proportion to their respective dividend rates or amounts or liquidation prices, without preference orpriority, one over the other, as between the holders of such class or series and the Holders of shares of Series LPreferred Stock.
(c) Junior to shares of Series L Preferred Stock, either as to the payment of dividends or the distributionof assets upon dissolution, liquidation or winding up of Fannie Mae, if such class shall be common stock ofFannie Mae or if the Holders of shares of Series L Preferred Stock shall be entitled to the receipt of dividendsor of amounts distributable upon dissolution, liquidation or winding up of Fannie Mae, as the case may be, inpreference or priority over the holders of such class or series.
(d) The shares of Preferred Stock of Fannie Mae designated ""5.25% Non-Cumulative Preferred Stock,Series D'' (the ""Series D Preferred Stock''), ""5.10% Non-Cumulative Preferred Stock, Series E'' (the""Series E Preferred Stock''), ""Variable Rate Non-Cumulative Preferred Stock, Series F'' (the ""Series FPreferred Stock''), ""Variable Rate Non-Cumulative Preferred Stock, Series G'' (the ""Series G PreferredStock''), ""5.81% Non-Cumulative Preferred Stock, Series H'' (the ""Series H Preferred Stock'') , ""5.375%Non-Cumulative Preferred Stock, Series I'' (the ""Series I Preferred Stock''), ""Variable Rate Non-Cumulative Preferred Stock, Series J (the ""Series J Preferred Stock'') and ""Variable Rate Non-CumulativePreferred Stock, Series K'' (the ""Series K Preferred Stock'') shall be deemed to rank on a parity with sharesof Series L Preferred Stock as to the payment of dividends and the distribution of assets upon dissolution,liquidation or winding up of Fannie Mae. Accordingly, the holders of record of Series D Preferred Stock, the
B-6

holders of record of Series E Preferred Stock, the holders of record of Series F Preferred Stock, the holders ofrecord of Series G Preferred Stock, the holders of record of Series H Preferred Stock, the holders of record ofSeries I Preferred Stock, the holders of record of Series J Preferred Stock, the holders of record of Series KPreferred Stock and the holders of record of Series L Preferred Stock shall be entitled to the receipt ofdividends and of amounts distributable upon dissolution, liquidation or winding up of Fannie Mae, as the casemay be, in proportion to their respective dividend rates or amounts or liquidation prices, without preference orpriority, one over the other.
10. Transfer Agent, Dividend Disbursing Agent and Registrar.
Fannie Mae hereby appoints EquiServe Trust Company, N.A., as its initial transfer agent, dividenddisbursing agent and registrar for the Series L Preferred Stock. Fannie Mae may at any time designate anadditional or substitute transfer agent, dividend disbursing agent and registrar for the Series L Preferred Stock.
11. Notices.
Any notice provided or permitted by this CertiÑcate of Designation to be made upon, or given orfurnished to, the Holders of Series L Preferred Stock by Fannie Mae shall be made by Ñrst-class mail, postageprepaid, to the addresses of such Holders as they appear on the books and records of Fannie Mae. Such noticeshall be deemed to have been suÇciently made upon deposit thereof in the United States mail. Notwithstand-ing anything to the contrary contained herein, in the case of the suspension of regular mail service or by reasonof any other cause it shall be impracticable, in Fannie Mae's judgment, to give notice by mail, then suchnotiÑcation may be made, in Fannie Mae's discretion, by publication in a newspaper of general circulation inThe City of New York or by hand delivery to the addresses of Holders as they appear on the books and recordsof Fannie Mae.
Receipt and acceptance of a share or shares of the Series L Preferred Stock by or on behalf of a Holdershall constitute the unconditional acceptance by such Holder (and all others having beneÑcial ownership ofsuch share or shares) of all of the terms and provisions of this CertiÑcate of Designation. No signature orother further manifestation of assent to the terms and provisions of this CertiÑcate of Designation shall benecessary for its operation or eÅect as between Fannie Mae and the Holder (and all such others).
B-7

®THIS PAGE INTENTIONALLY LEFT BLANK©

Appendix C
Annual Report on Form 10-KFor the fiscal year ended December 31, 2002, Ñled with the SEC on March 31, 2003

®THIS PAGE INTENTIONALLY LEFT BLANK©

UNITED STATES SECURITIES AND EXCHANGE COMMISSIONWashington, D.C. 20549
Form 10-KANNUAL REPORT PURSUANT TO SECTION 13 OR 15(d)
OF THE SECURITIES EXCHANGE ACT OF 1934
For the Ñscal year ended December 31, 2002
Commission File No.: 0-50231
Federal National Mortgage Association(Exact name of registrant as speciÑed in its charter)
Fannie MaeFederally chartered corporation 52-0883107
(State or other jurisdiction of (I.R.S. Employerincorporation or organization) IdentiÑcation No.)
3900 Wisconsin Avenue, NW 20016(Zip Code)Washington, DC
(Address of principal executive oÇces)
Registrant's telephone number, including area code: (202) 752-7000
Securities registered pursuant to Section 12(b) of the Act:None
Securities registered pursuant to Section 12(g) of the Act:Common Stock, without par value
(Title of class)
Indicate by check mark whether the registrant (1) has Ñled all reports required to be Ñled by Section 13or 15(d) of the Securities Exchange Act of 1934 during the preceding 12 months (or for such shorter periodthat the registrant was required to Ñle such reports), and (2) has been subject to such Ñling requirements forthe past 90 days. Yes n No ¥
Indicate by check mark if disclosure of delinquent Ñlers pursuant to Item 405 of Regulation S-K is notcontained herein, and will not be contained, to the best of registrant's knowledge, in deÑnitive proxy orinformation statements incorporated by reference in Part III of this Form 10-K or any amendment to thisForm 10-K. ¥
Indicate by check mark whether the registrant is an accelerated Ñler (as deÑned in Exchange ActRule 12b-2). Yes n No ¥
As of the close of business on February 28, 2003, there were 986,925,508 shares of common stockoutstanding. As of June 28, 2002 (the last business day of Registrant's most recent second Ñscal quarter), theaggregate market value of the common stock held by non-aÇliates of the registrant was approximately$73,217 million. As of February 28, 2003, the aggregate market value of the common stock held by non-aÇliates of the registrant was approximately $63,262 million.
DOCUMENTS INCORPORATED BY REFERENCE
Material contained in the registration statement of Fannie Mae on Form 10 Ñled with the Securities andExchange Commission on March 31, 2003 is incorporated by reference in Part II, Item 5, and Part III of thisForm 10-K.

TABLE OF CONTENTS
Page
PART I ÏÏÏÏÏÏÏÏÏÏÏÏÏÏÏÏÏÏÏÏÏÏÏÏÏÏÏÏÏÏÏÏÏÏÏÏÏÏÏÏÏÏÏÏÏÏÏÏÏÏÏÏÏÏÏÏÏÏÏÏÏÏÏÏÏÏÏÏÏÏÏÏÏÏÏÏÏÏ 1Item 1. Business ÏÏÏÏÏÏÏÏÏÏÏÏÏÏÏÏÏÏÏÏÏÏÏÏÏÏÏÏÏÏÏÏÏÏÏÏÏÏÏÏÏÏÏÏÏÏÏÏÏÏÏÏÏÏÏÏÏÏÏÏÏÏÏÏÏÏÏÏ 1
OverviewÏÏÏÏÏÏÏÏÏÏÏÏÏÏÏÏÏÏÏÏÏÏÏÏÏÏÏÏÏÏÏÏÏÏÏÏÏÏÏÏÏÏÏÏÏÏÏÏÏÏÏÏÏÏÏÏÏÏÏÏÏÏÏÏÏÏÏÏ 1Introduction ÏÏÏÏÏÏÏÏÏÏÏÏÏÏÏÏÏÏÏÏÏÏÏÏÏÏÏÏÏÏÏÏÏÏÏÏÏÏÏÏÏÏÏÏÏÏÏÏÏÏÏÏÏÏÏÏÏÏÏÏÏÏÏ 1Business SegmentsÏÏÏÏÏÏÏÏÏÏÏÏÏÏÏÏÏÏÏÏÏÏÏÏÏÏÏÏÏÏÏÏÏÏÏÏÏÏÏÏÏÏÏÏÏÏÏÏÏÏÏÏÏÏÏÏÏÏ 1Additional Information ÏÏÏÏÏÏÏÏÏÏÏÏÏÏÏÏÏÏÏÏÏÏÏÏÏÏÏÏÏÏÏÏÏÏÏÏÏÏÏÏÏÏÏÏÏÏÏÏÏÏÏÏÏÏ 2
The Residential Mortgage MarketÏÏÏÏÏÏÏÏÏÏÏÏÏÏÏÏÏÏÏÏÏÏÏÏÏÏÏÏÏÏÏÏÏÏÏÏÏÏÏÏÏÏÏÏÏÏÏ 3Residential Mortgage Debt OutstandingÏÏÏÏÏÏÏÏÏÏÏÏÏÏÏÏÏÏÏÏÏÏÏÏÏÏÏÏÏÏÏÏÏÏÏÏÏÏÏÏ 3Our Role in the Secondary Mortgage Market ÏÏÏÏÏÏÏÏÏÏÏÏÏÏÏÏÏÏÏÏÏÏÏÏÏÏÏÏÏÏÏÏÏÏÏ 4
Fannie Mae Business StandardsÏÏÏÏÏÏÏÏÏÏÏÏÏÏÏÏÏÏÏÏÏÏÏÏÏÏÏÏÏÏÏÏÏÏÏÏÏÏÏÏÏÏÏÏÏÏÏÏÏ 4Principal Balance LimitsÏÏÏÏÏÏÏÏÏÏÏÏÏÏÏÏÏÏÏÏÏÏÏÏÏÏÏÏÏÏÏÏÏÏÏÏÏÏÏÏÏÏÏÏÏÏÏÏÏÏÏÏÏ 4Loan-to-Value Ratios ÏÏÏÏÏÏÏÏÏÏÏÏÏÏÏÏÏÏÏÏÏÏÏÏÏÏÏÏÏÏÏÏÏÏÏÏÏÏÏÏÏÏÏÏÏÏÏÏÏÏÏÏÏÏÏ 5Underwriting Guidelines ÏÏÏÏÏÏÏÏÏÏÏÏÏÏÏÏÏÏÏÏÏÏÏÏÏÏÏÏÏÏÏÏÏÏÏÏÏÏÏÏÏÏÏÏÏÏÏÏÏÏÏÏÏ 5The Mortgage Seller or Servicer ÏÏÏÏÏÏÏÏÏÏÏÏÏÏÏÏÏÏÏÏÏÏÏÏÏÏÏÏÏÏÏÏÏÏÏÏÏÏÏÏÏÏÏÏÏÏ 6
Mortgage Committing and Servicing Arrangements ÏÏÏÏÏÏÏÏÏÏÏÏÏÏÏÏÏÏÏÏÏÏÏÏÏÏÏÏÏÏÏÏ 6Single-Family Mortgage Commitments ÏÏÏÏÏÏÏÏÏÏÏÏÏÏÏÏÏÏÏÏÏÏÏÏÏÏÏÏÏÏÏÏÏÏÏÏÏÏÏÏ 6Servicing Arrangements ÏÏÏÏÏÏÏÏÏÏÏÏÏÏÏÏÏÏÏÏÏÏÏÏÏÏÏÏÏÏÏÏÏÏÏÏÏÏÏÏÏÏÏÏÏÏÏÏÏÏÏÏÏ 6
Business SegmentsÏÏÏÏÏÏÏÏÏÏÏÏÏÏÏÏÏÏÏÏÏÏÏÏÏÏÏÏÏÏÏÏÏÏÏÏÏÏÏÏÏÏÏÏÏÏÏÏÏÏÏÏÏÏÏÏÏÏÏÏ 7Portfolio Investment Business ÏÏÏÏÏÏÏÏÏÏÏÏÏÏÏÏÏÏÏÏÏÏÏÏÏÏÏÏÏÏÏÏÏÏÏÏÏÏÏÏÏÏÏÏÏÏÏÏ 7Credit Guaranty Business ÏÏÏÏÏÏÏÏÏÏÏÏÏÏÏÏÏÏÏÏÏÏÏÏÏÏÏÏÏÏÏÏÏÏÏÏÏÏÏÏÏÏÏÏÏÏÏÏÏÏÏÏ 10Fee-Based Services ÏÏÏÏÏÏÏÏÏÏÏÏÏÏÏÏÏÏÏÏÏÏÏÏÏÏÏÏÏÏÏÏÏÏÏÏÏÏÏÏÏÏÏÏÏÏÏÏÏÏÏÏÏÏÏÏÏ 13
Housing Goals ÏÏÏÏÏÏÏÏÏÏÏÏÏÏÏÏÏÏÏÏÏÏÏÏÏÏÏÏÏÏÏÏÏÏÏÏÏÏÏÏÏÏÏÏÏÏÏÏÏÏÏÏÏÏÏÏÏÏÏÏÏÏÏ 14Competition ÏÏÏÏÏÏÏÏÏÏÏÏÏÏÏÏÏÏÏÏÏÏÏÏÏÏÏÏÏÏÏÏÏÏÏÏÏÏÏÏÏÏÏÏÏÏÏÏÏÏÏÏÏÏÏÏÏÏÏÏÏÏÏÏÏ 14Employees ÏÏÏÏÏÏÏÏÏÏÏÏÏÏÏÏÏÏÏÏÏÏÏÏÏÏÏÏÏÏÏÏÏÏÏÏÏÏÏÏÏÏÏÏÏÏÏÏÏÏÏÏÏÏÏÏÏÏÏÏÏÏÏÏÏÏ 16Government Regulation and Charter ActÏÏÏÏÏÏÏÏÏÏÏÏÏÏÏÏÏÏÏÏÏÏÏÏÏÏÏÏÏÏÏÏÏÏÏÏÏÏÏÏÏ 16
Charter Act ÏÏÏÏÏÏÏÏÏÏÏÏÏÏÏÏÏÏÏÏÏÏÏÏÏÏÏÏÏÏÏÏÏÏÏÏÏÏÏÏÏÏÏÏÏÏÏÏÏÏÏÏÏÏÏÏÏÏÏÏÏÏÏ 16Regulatory Approval and OversightÏÏÏÏÏÏÏÏÏÏÏÏÏÏÏÏÏÏÏÏÏÏÏÏÏÏÏÏÏÏÏÏÏÏÏÏÏÏÏÏÏÏÏÏ 17Capital Requirements ÏÏÏÏÏÏÏÏÏÏÏÏÏÏÏÏÏÏÏÏÏÏÏÏÏÏÏÏÏÏÏÏÏÏÏÏÏÏÏÏÏÏÏÏÏÏÏÏÏÏÏÏÏÏÏ 18Dividend Restrictions ÏÏÏÏÏÏÏÏÏÏÏÏÏÏÏÏÏÏÏÏÏÏÏÏÏÏÏÏÏÏÏÏÏÏÏÏÏÏÏÏÏÏÏÏÏÏÏÏÏÏÏÏÏÏÏ 18
Item 2. Properties ÏÏÏÏÏÏÏÏÏÏÏÏÏÏÏÏÏÏÏÏÏÏÏÏÏÏÏÏÏÏÏÏÏÏÏÏÏÏÏÏÏÏÏÏÏÏÏÏÏÏÏÏÏÏÏÏÏÏÏÏÏÏÏÏÏÏÏ 19Item 3. Legal Proceedings ÏÏÏÏÏÏÏÏÏÏÏÏÏÏÏÏÏÏÏÏÏÏÏÏÏÏÏÏÏÏÏÏÏÏÏÏÏÏÏÏÏÏÏÏÏÏÏÏÏÏÏÏÏÏÏÏÏÏÏÏ 19Item 4. Submission of Matters to a Vote of Security HoldersÏÏÏÏÏÏÏÏÏÏÏÏÏÏÏÏÏÏÏÏÏÏÏÏÏÏÏÏÏÏÏ 19
PART IIÏÏÏÏÏÏÏÏÏÏÏÏÏÏÏÏÏÏÏÏÏÏÏÏÏÏÏÏÏÏÏÏÏÏÏÏÏÏÏÏÏÏÏÏÏÏÏÏÏÏÏÏÏÏÏÏÏÏÏÏÏÏÏÏÏÏÏÏÏÏÏÏÏÏÏÏÏÏ 19Item 5. Market for Registrant's Common Equity and Related Stockholder Matters ÏÏÏÏÏÏÏÏÏÏÏÏ 19Item 6. Selected Financial Data ÏÏÏÏÏÏÏÏÏÏÏÏÏÏÏÏÏÏÏÏÏÏÏÏÏÏÏÏÏÏÏÏÏÏÏÏÏÏÏÏÏÏÏÏÏÏÏÏÏÏÏÏÏÏÏ 20Item 7. Management's Discussion and Analysis of Financial Condition and Results of Operations ÏÏÏ 22
Forward-Looking Information ÏÏÏÏÏÏÏÏÏÏÏÏÏÏÏÏÏÏÏÏÏÏÏÏÏÏÏÏÏÏÏÏÏÏÏÏÏÏÏÏÏÏÏÏÏÏÏÏÏÏ 22Organization of Information ÏÏÏÏÏÏÏÏÏÏÏÏÏÏÏÏÏÏÏÏÏÏÏÏÏÏÏÏÏÏÏÏÏÏÏÏÏÏÏÏÏÏÏÏÏÏÏÏÏÏÏÏ 232002 Overview ÏÏÏÏÏÏÏÏÏÏÏÏÏÏÏÏÏÏÏÏÏÏÏÏÏÏÏÏÏÏÏÏÏÏÏÏÏÏÏÏÏÏÏÏÏÏÏÏÏÏÏÏÏÏÏÏÏÏÏÏÏÏÏ 23About Fannie Mae ÏÏÏÏÏÏÏÏÏÏÏÏÏÏÏÏÏÏÏÏÏÏÏÏÏÏÏÏÏÏÏÏÏÏÏÏÏÏÏÏÏÏÏÏÏÏÏÏÏÏÏÏÏÏÏÏÏÏÏ 25Results of Operations ÏÏÏÏÏÏÏÏÏÏÏÏÏÏÏÏÏÏÏÏÏÏÏÏÏÏÏÏÏÏÏÏÏÏÏÏÏÏÏÏÏÏÏÏÏÏÏÏÏÏÏÏÏÏÏÏÏ 26
Net Interest Income ÏÏÏÏÏÏÏÏÏÏÏÏÏÏÏÏÏÏÏÏÏÏÏÏÏÏÏÏÏÏÏÏÏÏÏÏÏÏÏÏÏÏÏÏÏÏÏÏÏÏÏÏÏÏÏÏ 27Guaranty Fee Income ÏÏÏÏÏÏÏÏÏÏÏÏÏÏÏÏÏÏÏÏÏÏÏÏÏÏÏÏÏÏÏÏÏÏÏÏÏÏÏÏÏÏÏÏÏÏÏÏÏÏÏÏÏÏÏ 29Fee and Other Income (Expense)ÏÏÏÏÏÏÏÏÏÏÏÏÏÏÏÏÏÏÏÏÏÏÏÏÏÏÏÏÏÏÏÏÏÏÏÏÏÏÏÏÏÏÏÏÏ 30Credit-Related ExpensesÏÏÏÏÏÏÏÏÏÏÏÏÏÏÏÏÏÏÏÏÏÏÏÏÏÏÏÏÏÏÏÏÏÏÏÏÏÏÏÏÏÏÏÏÏÏÏÏÏÏÏÏÏ 30Administrative ExpensesÏÏÏÏÏÏÏÏÏÏÏÏÏÏÏÏÏÏÏÏÏÏÏÏÏÏÏÏÏÏÏÏÏÏÏÏÏÏÏÏÏÏÏÏÏÏÏÏÏÏÏÏÏ 31Special Contribution ÏÏÏÏÏÏÏÏÏÏÏÏÏÏÏÏÏÏÏÏÏÏÏÏÏÏÏÏÏÏÏÏÏÏÏÏÏÏÏÏÏÏÏÏÏÏÏÏÏÏÏÏÏÏÏÏ 32Purchased Options Expense ÏÏÏÏÏÏÏÏÏÏÏÏÏÏÏÏÏÏÏÏÏÏÏÏÏÏÏÏÏÏÏÏÏÏÏÏÏÏÏÏÏÏÏÏÏÏÏÏÏÏ 32Debt Extinguishments ÏÏÏÏÏÏÏÏÏÏÏÏÏÏÏÏÏÏÏÏÏÏÏÏÏÏÏÏÏÏÏÏÏÏÏÏÏÏÏÏÏÏÏÏÏÏÏÏÏÏÏÏÏÏÏ 32
i

Page
Income TaxesÏÏÏÏÏÏÏÏÏÏÏÏÏÏÏÏÏÏÏÏÏÏÏÏÏÏÏÏÏÏÏÏÏÏÏÏÏÏÏÏÏÏÏÏÏÏÏÏÏÏÏÏÏÏÏÏÏÏÏÏÏÏ 33Cumulative EÅect of Change in Accounting Principle ÏÏÏÏÏÏÏÏÏÏÏÏÏÏÏÏÏÏÏÏÏÏÏÏÏÏÏÏ 33
Core Business Earnings and Business Segment Results ÏÏÏÏÏÏÏÏÏÏÏÏÏÏÏÏÏÏÏÏÏÏÏÏÏÏÏÏÏ 33Core Business EarningsÏÏÏÏÏÏÏÏÏÏÏÏÏÏÏÏÏÏÏÏÏÏÏÏÏÏÏÏÏÏÏÏÏÏÏÏÏÏÏÏÏÏÏÏÏÏÏÏÏÏÏÏÏÏ 33Taxable-Equivalent RevenuesÏÏÏÏÏÏÏÏÏÏÏÏÏÏÏÏÏÏÏÏÏÏÏÏÏÏÏÏÏÏÏÏÏÏÏÏÏÏÏÏÏÏÏÏÏÏÏÏÏ 37Core Net Interest Income ÏÏÏÏÏÏÏÏÏÏÏÏÏÏÏÏÏÏÏÏÏÏÏÏÏÏÏÏÏÏÏÏÏÏÏÏÏÏÏÏÏÏÏÏÏÏÏÏÏÏÏ 38Business Segment ResultsÏÏÏÏÏÏÏÏÏÏÏÏÏÏÏÏÏÏÏÏÏÏÏÏÏÏÏÏÏÏÏÏÏÏÏÏÏÏÏÏÏÏÏÏÏÏÏÏÏÏÏÏ 40
OÅ-Balance Sheet TransactionsÏÏÏÏÏÏÏÏÏÏÏÏÏÏÏÏÏÏÏÏÏÏÏÏÏÏÏÏÏÏÏÏÏÏÏÏÏÏÏÏÏÏÏÏÏÏÏÏÏ 53Guaranteed MBS and Other Mortgage-Related Securities ÏÏÏÏÏÏÏÏÏÏÏÏÏÏÏÏÏÏÏÏÏÏÏÏ 53CommitmentsÏÏÏÏÏÏÏÏÏÏÏÏÏÏÏÏÏÏÏÏÏÏÏÏÏÏÏÏÏÏÏÏÏÏÏÏÏÏÏÏÏÏÏÏÏÏÏÏÏÏÏÏÏÏÏÏÏÏÏÏÏÏ 54
Application of Critical Accounting Policies ÏÏÏÏÏÏÏÏÏÏÏÏÏÏÏÏÏÏÏÏÏÏÏÏÏÏÏÏÏÏÏÏÏÏÏÏÏÏÏ 55Allowance for Loan Losses and Guaranty Liability for MBS ÏÏÏÏÏÏÏÏÏÏÏÏÏÏÏÏÏÏÏÏÏÏ 55Deferred Price Adjustments ÏÏÏÏÏÏÏÏÏÏÏÏÏÏÏÏÏÏÏÏÏÏÏÏÏÏÏÏÏÏÏÏÏÏÏÏÏÏÏÏÏÏÏÏÏÏÏÏÏÏ 57Time Value of Purchased OptionsÏÏÏÏÏÏÏÏÏÏÏÏÏÏÏÏÏÏÏÏÏÏÏÏÏÏÏÏÏÏÏÏÏÏÏÏÏÏÏÏÏÏÏÏÏ 59
Risk Management ÏÏÏÏÏÏÏÏÏÏÏÏÏÏÏÏÏÏÏÏÏÏÏÏÏÏÏÏÏÏÏÏÏÏÏÏÏÏÏÏÏÏÏÏÏÏÏÏÏÏÏÏÏÏÏÏÏÏÏÏ 61Interest Rate Risk Management ÏÏÏÏÏÏÏÏÏÏÏÏÏÏÏÏÏÏÏÏÏÏÏÏÏÏÏÏÏÏÏÏÏÏÏÏÏÏÏÏÏÏÏÏÏÏ 61Credit Risk Management ÏÏÏÏÏÏÏÏÏÏÏÏÏÏÏÏÏÏÏÏÏÏÏÏÏÏÏÏÏÏÏÏÏÏÏÏÏÏÏÏÏÏÏÏÏÏÏÏÏÏÏÏ 75Operations Risk Management ÏÏÏÏÏÏÏÏÏÏÏÏÏÏÏÏÏÏÏÏÏÏÏÏÏÏÏÏÏÏÏÏÏÏÏÏÏÏÏÏÏÏÏÏÏÏÏÏ 94
Liquidity and Capital Resources ÏÏÏÏÏÏÏÏÏÏÏÏÏÏÏÏÏÏÏÏÏÏÏÏÏÏÏÏÏÏÏÏÏÏÏÏÏÏÏÏÏÏÏÏÏÏÏÏ 96Liquidity ÏÏÏÏÏÏÏÏÏÏÏÏÏÏÏÏÏÏÏÏÏÏÏÏÏÏÏÏÏÏÏÏÏÏÏÏÏÏÏÏÏÏÏÏÏÏÏÏÏÏÏÏÏÏÏÏÏÏÏÏÏÏÏÏÏÏ 96Capital Resources ÏÏÏÏÏÏÏÏÏÏÏÏÏÏÏÏÏÏÏÏÏÏÏÏÏÏÏÏÏÏÏÏÏÏÏÏÏÏÏÏÏÏÏÏÏÏÏÏÏÏÏÏÏÏÏÏÏÏ 97
Performance Outlook ÏÏÏÏÏÏÏÏÏÏÏÏÏÏÏÏÏÏÏÏÏÏÏÏÏÏÏÏÏÏÏÏÏÏÏÏÏÏÏÏÏÏÏÏÏÏÏÏÏÏÏÏÏÏÏÏÏ 100New Accounting Standards ÏÏÏÏÏÏÏÏÏÏÏÏÏÏÏÏÏÏÏÏÏÏÏÏÏÏÏÏÏÏÏÏÏÏÏÏÏÏÏÏÏÏÏÏÏÏÏÏÏÏÏÏ 100
Accounting for Stock Compensation ÏÏÏÏÏÏÏÏÏÏÏÏÏÏÏÏÏÏÏÏÏÏÏÏÏÏÏÏÏÏÏÏÏÏÏÏÏÏÏÏÏÏÏ 100Guarantor's Accounting and Disclosure Requirements for GuaranteesÏÏÏÏÏÏÏÏÏÏÏÏÏÏÏ 101Special Purpose Entities (""SPEs'')ÏÏÏÏÏÏÏÏÏÏÏÏÏÏÏÏÏÏÏÏÏÏÏÏÏÏÏÏÏÏÏÏÏÏÏÏÏÏÏÏÏÏÏÏ 101
Item 7A. Quantitative and Qualitative Disclosures About Market Risk ÏÏÏÏÏÏÏÏÏÏÏÏÏÏÏÏÏÏÏÏÏÏÏÏ 102Item 8. Financial Statements and Supplementary Data ÏÏÏÏÏÏÏÏÏÏÏÏÏÏÏÏÏÏÏÏÏÏÏÏÏÏÏÏÏÏÏÏÏÏÏÏ 103Item 9. Changes in and Disagreements With Accountants on Accounting and Financial
Disclosure ÏÏÏÏÏÏÏÏÏÏÏÏÏÏÏÏÏÏÏÏÏÏÏÏÏÏÏÏÏÏÏÏÏÏÏÏÏÏÏÏÏÏÏÏÏÏÏÏÏÏÏÏÏÏÏÏÏÏÏÏÏÏÏÏÏ 151
PART III ÏÏÏÏÏÏÏÏÏÏÏÏÏÏÏÏÏÏÏÏÏÏÏÏÏÏÏÏÏÏÏÏÏÏÏÏÏÏÏÏÏÏÏÏÏÏÏÏÏÏÏÏÏÏÏÏÏÏÏÏÏÏÏÏÏÏÏÏÏÏÏÏÏÏÏÏÏ 151Item 10. Directors and Executive OÇcers of the Registrant ÏÏÏÏÏÏÏÏÏÏÏÏÏÏÏÏÏÏÏÏÏÏÏÏÏÏÏÏÏÏÏÏÏ 151
Section 16(a) BeneÑcial Ownership Reporting Compliance ÏÏÏÏÏÏÏÏÏÏÏÏÏÏÏÏÏÏÏÏÏÏÏÏÏ 151Item 11. Executive CompensationÏÏÏÏÏÏÏÏÏÏÏÏÏÏÏÏÏÏÏÏÏÏÏÏÏÏÏÏÏÏÏÏÏÏÏÏÏÏÏÏÏÏÏÏÏÏÏÏÏÏÏÏÏÏÏ 151Item 12. Security Ownership of Certain BeneÑcial Owners and Management and Related
Stockholder Matters ÏÏÏÏÏÏÏÏÏÏÏÏÏÏÏÏÏÏÏÏÏÏÏÏÏÏÏÏÏÏÏÏÏÏÏÏÏÏÏÏÏÏÏÏÏÏÏÏÏÏÏÏÏÏÏÏ 151Item 13. Certain Relationships and Related Transactions ÏÏÏÏÏÏÏÏÏÏÏÏÏÏÏÏÏÏÏÏÏÏÏÏÏÏÏÏÏÏÏÏÏÏÏ 151Item 14. Controls and Procedures ÏÏÏÏÏÏÏÏÏÏÏÏÏÏÏÏÏÏÏÏÏÏÏÏÏÏÏÏÏÏÏÏÏÏÏÏÏÏÏÏÏÏÏÏÏÏÏÏÏÏÏÏÏÏÏ 151
PART IV ÏÏÏÏÏÏÏÏÏÏÏÏÏÏÏÏÏÏÏÏÏÏÏÏÏÏÏÏÏÏÏÏÏÏÏÏÏÏÏÏÏÏÏÏÏÏÏÏÏÏÏÏÏÏÏÏÏÏÏÏÏÏÏÏÏÏÏÏÏÏÏÏÏÏÏÏÏ 152Item 15. Exhibits, Financial Statement Schedules and Reports on Form 8-K ÏÏÏÏÏÏÏÏÏÏÏÏÏÏÏÏÏÏ 152SIGNATURES ÏÏÏÏÏÏÏÏÏÏÏÏÏÏÏÏÏÏÏÏÏÏÏÏÏÏÏÏÏÏÏÏÏÏÏÏÏÏÏÏÏÏÏÏÏÏÏÏÏÏÏÏÏÏÏÏÏÏÏÏÏÏÏÏÏÏÏÏÏÏÏÏ 153CERTIFICATIONS ÏÏÏÏÏÏÏÏÏÏÏÏÏÏÏÏÏÏÏÏÏÏÏÏÏÏÏÏÏÏÏÏÏÏÏÏÏÏÏÏÏÏÏÏÏÏÏÏÏÏÏÏÏÏÏÏÏÏÏÏÏÏÏÏÏÏÏÏ 155
ii

PART I
Item 1. Business
Overview
Introduction
At Fannie Mae (formally, the Federal National Mortgage Association), our purpose is to facilitate theÖow of low-cost mortgage capital in order to increase the availability and aÅordability of homeownership forlow-, moderate-, and middle-income Americans. We operate under a federal charter and our primaryregulator is the OÇce of Federal Housing Enterprise Oversight (""OFHEO''). However, we are a private,shareholder-owned company. The U.S. government does not guarantee, directly or indirectly, Fannie Mae'sdebt securities or other obligations.
Fannie Mae is the nation's largest source of funds for mortgage lenders and investors, providing resourcesfor our customers to make additional mortgage loans or investments in mortgage-related securities. Weprovide liquidity to the mortgage market for the beneÑt of borrowers; however, we do not lend money directlyto consumers. We operate exclusively in the secondary mortgage market by purchasing mortgages andmortgage-related securities, including Fannie Mae mortgage-related securities, from primary market institu-tions, such as commercial banks, savings and loan associations, mortgage companies, securities dealers andother investors. We provide additional liquidity in the secondary mortgage market by issuing and guaranteeingmortgage-related securities.
We also oÅer fee-based services to our customers that facilitate our purpose and mission. These servicesinclude issuing and administering a variety of mortgage-related securities, providing credit enhancements andoÅering technology products to aid in originating and underwriting mortgage loans.
Fannie Mae expands equal housing access and opportunity in America by helping our lender customersreach the nation's underserved families and communities. In 1994, we launched our Trillion DollarCommitment to provide $1 trillion in home Ñnancing for 10 million families traditionally underserved bymainstream mortgage Ñnance. After achieving that goal ahead of plan, in 2000 Fannie Mae announced a new,redoubled aÅordable housing plan, our $2 trillion American Dream Commitment», to serve 18 millionunderserved families by 2010.
Under the American Dream Commitment, Fannie Mae has pledged to promote mortgage consumerrights, including broader, more equal access to lowest-cost mortgage credit; Ñght mortgage discrimination andlead the housing market in serving minority families, including a pledge to provide $700 billion in Ñnancing for4.6 million minority households; address the unique housing needs of women-headed households, youngfamilies, new immigrants, seniors, and urban and rural dwellers; strengthen inner-city communities and oldersuburban areas; provide new technologies to mortgage lenders and consumers in order to lower mortgageÑnancing costs; and increase the supply of aÅordable rental housing.
Fannie Mae was established in 1938 as a United States government-owned entity to provide supplemen-tal liquidity to the secondary market for residential mortgages and to promote access to mortgage creditthroughout the nation. We became a stockholder-owned and privately-managed corporation by legislationenacted in 1968, which we refer to as the ""Charter Act'' (the Federal National Mortgage Association CharterAct, 12 U.S.C. Û1716 et seq.). Our common stock is traded primarily on the New York Stock Exchange underthe symbol ""FNM.''
Business Segments
We provide liquidity in the secondary mortgage market through our two primary business segments: theportfolio investment business and the credit guaranty business.
In the portfolio investment business, we purchase loans and mortgage-related securities from mortgagelenders, which replenishes those lenders' funds for making additional mortgage loans. We also purchase loans,mortgage-related securities and other investments from securities dealers, investors and other market
1

participants. In addition, our liquid investment portfolio invests in high quality, short-term, non-mortgageassets that can provide us with liquidity as the need arises. We acquire the funds to purchase these loans,mortgage-related securities and other investments from our equity capital and by selling debt securities todomestic and international capital markets investors. By doing so, we expand the total amount of fundsavailable to Ñnance housing in the United States. Income from our portfolio investment business comesprimarily from the diÅerence, or spread, between the yield on mortgage loans and other investments in ourportfolio and our borrowing costs.
In the credit guaranty business, we receive fees for our guaranty of timely payment of scheduled principaland interest on mortgage-related securities guaranteed by Fannie Mae and held by investors other than FannieMae. For segment reporting purposes, we also allocate a fee comparable to an MBS guaranty fee from theportfolio investment business to the credit guaranty business for management of the credit risk on mortgageportfolio investments. The guaranty fees we charge are based on the credit risk we assume, the costs ofadministering the mortgage-related securities and market and competitive factors. In a typical mortgage-related securities transaction, a lender will deliver mortgage loans to us that it has originated or purchased. Weplace these loans in a trust and issue certiÑcates evidencing beneÑcial interests in the trust, then deliver thecertiÑcates with our guaranty to the lender or its designee. The lender may then hold the mortgage-relatedsecurities as an investment or sell the securities in the market to replenish its funds for additional lending. Thisactivity provides liquidity to the lender because mortgage-related securities, with Fannie Mae's guaranty, aremore readily marketable than mortgage loans without this guaranty.
We have described our business segments in more detail under ""Business Ì Overview Ì BusinessSegments.''
Additional Information
In this document, we refer to both whole loans and participation interests in loans as ""loans,'' ""mortgageloans'' and ""mortgages.'' The term ""mortgage'' also is used to refer to the deed of trust or other securityinstrument securing a loan. The terms ""loans'' and ""mortgage loans'' may include loans secured bymanufactured housing. Mortgage loans secured by four or fewer dwelling units are referred to as ""single-family'' mortgage loans and mortgage loans secured by more than four dwelling units are referred to as""multifamily'' mortgage loans. We use the term ""mortgage-related securities'' generally to refer to mortgagepass-through trust certiÑcates representing beneÑcial interests in pools of mortgage loans or other mortgage-related securities. The term ""MBS'' (mortgage-backed securities) speciÑcally refers to mortgage-relatedsecurities we issue and on which we guarantee timely payment of scheduled principal and interest.
Debt, equity and mortgage-related securities we issue are exempt from registration under the SecuritiesAct of 1933 and are ""exempted securities'' under the Securities Exchange Act of 1934. In July 2002, weannounced a voluntary initiative to register our common stock, without par value, with the Securities andExchange Commission under Section 12(g) of the Securities Exchange Act of 1934. The registration of ourcommon stock became eÅective on March 31, 2003. Registration of our common stock does not impact theexempt status of debt, equity and mortgage-related securities we issue.
We Ñle reports, proxy statements and other information with the Securities and Exchange Commission,beginning in 2003. You may read and copy any materials we Ñle with the SEC at the SEC's Public ReferenceRoom at 450 Fifth Street, NW, Washington, DC 20549. You may obtain information on the operation of thePublic Reference Room by calling the SEC at 1-800-SEC-0330. The SEC maintains an Internet site(http://www.sec.gov) that contains reports, proxy statements, and other information that we Ñle with theSEC. You may also inspect our SEC reports and other information at the New York Stock Exchange, Inc.,20 Broad Street, New York, NY 10005 or obtain them, free of charge, from our website athttp://www.fanniemae.com. We are providing the addresses of the SEC's and our Internet sites solely for theinformation of investors. We do not intend the Internet addresses to be active links.
2

The Residential Mortgage Market
Residential Mortgage Debt Outstanding
The housing market in which we operate consists of the supply, or ""stock,'' of total outstanding residentialmortgages. In its Flow of Funds Accounts, the Board of Governors of the Federal Reserve System estimatesand publishes Ñgures each quarter on the stock of residential mortgages. The total residential mortgage debtoutstanding Ñgures published by the Federal Reserve include loans secured by single-family properties andmultifamily properties. As of December 31, 2002, the latest date for which information is available, theFederal Reserve's estimate for total residential mortgage debt outstanding was $7 trillion. (See ""Business ÌFannie Mae Business Standards Ì Principal Balance Limits'' for a discussion of the limits on mortgages wepurchase.) The following table shows the Federal Reserve's estimate for residential mortgage debt outstandingfor the last 12 years.
MultifamilyMortgage DebtOutstanding
Single-familyMortgage DebtOutstanding
0
20001000
40003000
60005000
$80007000
2002
2000
1998
1996
1994
1992
1990
We expect growth in residential mortgage debt outstanding over the next ten years to be driven by thefollowing factors:
‚ Household Formation. Household formation represents the number of new households that will needhomes. Household formation is a principal driver of demand for homes. Growth in householdformation is driven by growth in the population and ""headship rates,'' the rate at which the populationforms into households.
‚ Homeownership Rates. Homeownership rates reÖect the percentage of the population that owns ahome. As reported by the Census Bureau, Department of Commerce, the national homeownership rategrew at approximately one-half a percent a year during the decade of the 1990s, rising from 64 percentto over 67 percent. The growth in homeownership rates was driven by increased aÅordability of homes,improved technology (e.g., automated underwriting), and low downpayment lending. We expect futuregrowth in homeownership rates to be driven by economic growth, increases in minority homeownershiprates, and demographic trends as baby-boomers move into age groups that traditionally experiencehigher homeownership rates. We anticipate that minority homeownership rates will beneÑt from ashortage in rental housing, the expansion of more Öexible, low downpayment lending, and taxincentives.
‚ Home Price Appreciation. Home price appreciation reÖects the combined eÅect of two components:the underlying rate of inÖation and the amount that home prices appreciate net of inÖation. Homeprice appreciation allows current homeowners to borrow against the additional equity in their homesand causes new homebuyers to borrow more to Ñnance the purchase of a home. Home prices havetypically appreciated faster than inÖation. While inÖation and home price appreciation over inÖationwere relatively low for most of the 1990s, home price appreciation over inÖation returned to morehistorical levels in the latter part of the decade. Home price appreciation in the current decade willdepend upon the demand and supply for housing. We expect the supply of housing to be somewhatconstrained relative to demand due to limited availability of land and the increase of land use controls.
3

‚ Debt-to-Value Ratios. The debt-to-value ratio represents the percentage of total housing value that isÑnanced with mortgage debt. Over the past 50 years, homeowners have steadily increased thepercentage of their home value that is Ñnanced with debt, from around 20 percent to 44.4 percent atthe end of 2002. This increase reÖects the rising prices of homes, the increased popularity of cash-outreÑnancing as a means to tap equity wealth, availability of home equity lines of credit, and increasedlower downpayment lending. Growth in the mortgage debt-to-value ratio over the coming decade willbe driven by continued expansion of lower downpayment lending, and increased use by homeowners ofthe equity, or value, in their homes for other purposes.
As of December 31, 2002, Fannie Mae held 11 percent of total residential mortgage debt outstanding inour mortgage portfolio, which includes mortgage-related securities. MBS issued by Fannie Mae and held byinvestors other than Fannie Mae represented an additional 15 percent of total residential mortgage debtoutstanding.
Our Role in the Secondary Mortgage Market
Our lender customers are part of the primary mortgage market, where mortgages are originated and fundsare loaned to borrowers. Primary market lenders include mortgage companies, savings and loan associations,commercial banks, credit unions, and state and local housing Ñnance agencies.
Lenders sell mortgages into the ""secondary market,'' where mortgages are bought and sold by variousinvestors. Secondary market investors include Fannie Mae, the Federal Home Loan Mortgage Corporation(""Freddie Mac''), the Federal Home Loan Banks, pension funds, insurance companies, securities dealers, andother Ñnancial institutions. Lenders may sell their mortgages into the secondary market in the form of wholeloans or in the form of mortgage-related securities. For lenders that want to hold or sell mortgages in the formof mortgage-related securities, we may create those securities for them.
As the secondary market leader, Fannie Mae's central role in providing a steady stream of mortgagefunds to lenders across the country is supported by technologies that help us manage our risks and make theprocess of buying a home quicker, easier, and less expensive. We have developed an automated underwritingsystem for single-family mortgage loans that our lender customers are using nationwide, and allows consumersto obtain loan approval more quickly and consistently, and with lower closing costs than ever before.
We purchase mortgage loans for our portfolio and exchange mortgage-related securities for mortgageloans from over two thousand primary market lenders that have a selling and servicing contract with us. Fiveof those customers accounted for approximately 50 percent of the single-family mortgage loans that wepurchased or guaranteed in 2002. Ten lender customers accounted for approximately 63 percent of the single-family mortgage loans that we purchased or guaranteed in 2002. In addition, we purchase mortgage loans andmortgage-related securities from securities dealers, investors and other participants in the secondary market.
Fannie Mae Business Standards
The mortgage loans we purchase or guarantee must meet standards required by the Charter Act,including maximum principal balance limits and credit enhancement requirements. The Charter Act alsorequires that, so far as practicable and in our judgment, the mortgage loans be of a quality, type, and class thatmeet, generally, the purchase standards imposed by private institutional mortgage investors. Consistent withthose requirements, and with the purposes for which we were chartered, we establish additional eligibilitycriteria and policies for the mortgage loans we purchase or guaranty, and for the sellers and servicers of thosemortgage loans. Servicers are the entities that collect loan payments and perform other administrativefunctions with respect to the mortgage loans we purchase or guarantee.
Principal Balance Limits
Our purchase and guaranty of single-family ""conventional'' mortgage loans (loans not federally insured orguaranteed) are subject to certain maximum original principal balance limits, often referred to as the""conforming loan limit.'' For 2002, the limit for a one-family residence was $300,700 (except for loans secured
4

by properties in Alaska, Hawaii, Guam, and the Virgin Islands). Higher principal balance limits apply to loanssecured by properties in those areas or secured by two- to four-family residences. We can adjust the maximumprincipal balance limits applicable to conventional single-family mortgage loans annually based on the year-to-year change in the national average price of a one-family house as surveyed by the Federal Housing FinanceBoard each October. In November 2002, the limit for loans acquired in 2003, secured by a one-familyresidence, was increased to $322,700. There are no statutory limits on the maximum principal balance ofmultifamily mortgage loans that we purchase or guarantee. Mortgage loans insured by the Federal HousingAdministration (""FHA'') are subject to separate statutory maximum amount limitations. There are nostatutory limits on the principal balance of loans guaranteed by the Department of Veterans AÅairs (""VA'')or by the Rural Housing Service (""RHS'').
Loan-to-Value Ratios
The loan-to-value ratio requirements for loans we purchase or guaranty may vary depending upon avariety of factors such as the loan purpose, the number of dwelling units in the property securing the loan, therepayment terms, borrower credit history, and FHA or VA loan-to-value limits. Depending upon these factors,the loan-to-value ratio for loans we purchase or guarantee can be in excess of 100 percent.
The Charter Act requires credit enhancement on any conventional single-family mortgage loan that wepurchase or guarantee if it has a loan-to-value ratio over 80 percent at the time of purchase or guaranty. Creditenhancement may take several forms, including insurance or a guaranty issued by a qualiÑed insurer,repurchase arrangements with the seller of the mortgage loans, and seller-retained participation interests. Wemay require credit enhancement in excess of the minimum required to satisfy this provision of the CharterAct.
Underwriting Guidelines
We have established underwriting guidelines for the purchase or guaranty of mortgage loans to eÅectivelymanage the risk of loss from borrower defaults. Lenders determine whether to make mortgage loans andfrequently have several investors to whom they sell loans. When originating loans to be purchased orguaranteed by Fannie Mae, lenders look to our underwriting guidelines. We designed these guidelines to assessthe creditworthiness of the borrower, as well as the value of the mortgaged property relative to the amount ofthe mortgage loan. At our discretion, we may grant waivers from these underwriting guidelines. We alsoreview and change these guidelines from time to time. As part of our aÅordable housing initiatives, wecontinue to introduce new underwriting criteria in an attempt to make the mortgage Ñnance system moreaccessible to minorities, low- and moderate-income families, underserved and rural residents, and people withspecial housing needs. In addition, we continue to look for more eÅective methods of assessing thecreditworthiness of potential borrowers and property values.
We generally rely on lender representations and warranties that the mortgage loans we purchase orguaranty conform to our applicable guidelines. We also perform quality control reviews of selected loans tomonitor compliance with the guidelines. In the event that a lender is found to have breached itsrepresentations with respect to a loan's compliance with the guidelines, we can require that the lenderrepurchase the loan, indemnify us against any loss or, in some cases, share a greater percentage of any loss.
Over the last several years, we have enhanced Desktop Underwriter», our automated underwritingsystem, to assist lenders in applying Fannie Mae underwriting standards for single-family loans. DesktopUnderwriter is designed to help lenders process mortgage applications in a more eÇcient and accurate mannerand to apply our underwriting criteria consistently, objectively, and in a more customized manner to allprospective borrowers. If Desktop Underwriter provides an ""approve/eligible'' or ""expanded approval/eligible'' recommendation to a lender regarding a loan application, we waive certain representations by thelender as long as the information that was submitted by the lender through Desktop Underwriter is accurateand the lender complies with other speciÑed requirements.
5

The Mortgage Seller or Servicer
Before we approve a lender or other customer to become a seller or servicer, we require that it meetcertain standards which include demonstrating, to our satisfaction, that it:
‚ has a proven ability to originate or service the type of mortgages for which our approval is beingrequested;
‚ employs a staÅ with adequate experience;
‚ has as one of its principal business purposes the origination or servicing of residential mortgages;
‚ is properly licensed, or otherwise authorized, to originate, sell, or service residential mortgages in eachof the jurisdictions in which it does business;
‚ meets Ñnancial criteria and standards;
‚ has quality control and management systems to evaluate and monitor the overall quality of its loanproduction and servicing activities; and
‚ is adequately covered by a Ñdelity bond and errors and omissions insurance.
We enter into a written mortgage selling and servicing contract with each approved customer. In thiscontract, the customer agrees to a number of obligations, including ongoing compliance with the foregoingprovisions to our satisfaction.
Mortgage Committing and Servicing Arrangements
Single-Family Mortgage Commitments
We enter into master agreements with lenders to facilitate ongoing transactions. Mortgage loans deliveredto us for pooling into MBS generally require a master agreement, while mortgage loans purchased in cashtransactions may or may not be under a master agreement. Pursuant to a master agreement, a lender agrees todeliver a speciÑed volume of mortgage loans over a speciÑed period of time, usually 12 months.
The master agreement usually requires mandatory delivery by the lender of an agreed upon volume, butmay also contain an amount that is optional for the lender to deliver after it has met the required mandatorydelivery commitment. If a lender does not deliver the mandatory portion of the speciÑed volume, we mayassess a buyout fee based on the undelivered amount. The optional portion of the volume does not obligate thelender to sell loans to us.
Whether or not there is a master agreement, we purchase mortgage loans for our portfolio pursuant to""mandatory delivery commitments,'' which can be for either standard or negotiated loan products. Underthese commitments, lenders are obligated to sell to us the mortgage loans described in the commitment at anagreed-upon price and within an agreed-upon time period (generally from one to ninety days for Ñxed-ratemortgages and from one to sixty days for adjustable-rate mortgages). If a lender is unable to deliver some orall of the mortgage loans required under a mandatory delivery commitment during the term of thecommitment, the lender may repurchase the remaining balance of the commitment for a ""pair-oÅ'' fee. Wemay assess the pair-oÅ fee based on the amount of the commitment being paired oÅ and the diÅerencebetween the commitment price and the current price.
Servicing Arrangements
Mortgage loans held in our mortgage portfolio or in a trust for holders of our MBS may be serviced onlyby an approved servicer. We do not service mortgage loans directly. Typically, lenders who sell single-familymortgage loans and conventional multifamily loans to Fannie Mae initially service the mortgage loans they sellto us. There is an active market in which lenders sell servicing rights to other servicers. In addition, we may attimes engage a servicing entity to service loans on our behalf due to termination of a servicer or for otherreasons.
6

Mortgage servicers collect and remit principal and interest payments, administer escrow accounts,evaluate transfers of ownership interests, respond to requests for partial releases of security, and handleproceeds from casualty and condemnation losses. For problem loans, servicing includes negotiating workoutsand, if necessary, inspecting and preserving properties and processing foreclosures and bankruptcies. In thecase of multifamily loans, servicing also may include performing routine property inspections, evaluating theÑnancial condition of owners, and administering various types of agreements (including agreements regardingreplacement reserves, completion or repair, and operations and maintenance). We compensate servicersprimarily by permitting them to retain a speciÑed portion of each interest payment on a serviced mortgageloan, called a ""servicing fee.'' The weighted average servicing fee for conventional single-family loans ownedor guaranteed by Fannie Mae in 2002 was .389 percent. We have the right to remove servicing responsibilitiesfrom any lender under criteria established in our contractual arrangements with lenders.
Business Segments
Portfolio Investment Business
Overview. Our portfolio investment business has two principal components: a mortgage portfolio and aliquid investment portfolio. The mortgage portfolio purchases mortgage loans, mortgage-related securities, andother investments from lenders, securities dealers, investors, and other market participants. The liquidinvestment portfolio primarily purchases readily marketable, high credit quality, non-mortgage securities fromsecurities dealers. The securities have short term maturities or can be sold as a source of funds to meet ourcash Öow needs. We fund the purchase of assets for our mortgage and liquid investment portfolios primarily byborrowing money in the domestic and international capital markets through the sale of debt securities. Wederive income from the diÅerence, or ""spread,'' between the yield we earn on our portfolio investments and theinterest we pay on our borrowings.
The following diagram illustrates the basic structure of how we purchase a loan and fund that mortgageportfolio investment.
7

1
2 3
Mortgage Portfolio Loan Purchase
Fannie Mae
Consumers
Lenders
Mortgages
Mortgages
$$$
$$$
$$$
Lender sells mortgage loans to Fannie Mae
Fannie Mae issues debt securities to investors to
finance loan purchase
Lender originates
mortgage loans with consumer
Debt Securities
Lenders originate mortgages with consumers and may decide to sell them as whole loans. Fannie Mae purchases the loans for its portfolio, and issues debt in the capital markets to fund the purchases.
Investors
Most of the single-family mortgage loans in our mortgage portfolio or backing mortgage-related securitiesin our portfolio may be prepaid by the borrower at any time without penalty. We, therefore, bear the risk thatif our mortgage assets are paid oÅ as interest rates decline, or as a result of other factors, we may not be able toprepay the outstanding indebtedness used to Ñnance those assets or to reinvest the prepayment proceeds at arate at or above our borrowing costs. If interest rates rise, our debt costs could rise faster than the yield on ourmortgage assets and thereby reduce our interest spread. In contrast, most multifamily loans contain aprepayment premium that compensates us for the loss of yield in the event of a prepayment, or provide someother mechanism to protect us from prepayment risk. We actively manage our mortgage portfolio to mitigateprepayment risks. Our approach to managing interest rate risk includes three central elements. First, weattempt to fund purchases of mortgage assets with liabilities that have similar cash Öow patterns through timeand in diÅerent interest rate environments. We use a combination of debt securities and interest ratederivatives to achieve the appropriate funding mix. Second, we regularly assess the mortgage portfolio'sexposure to changes in interest rates using a diverse set of analyses and measures. Third, we establishappropriate parameters for taking rebalancing actions that meet our objectives, and undertake rebalancingactions as necessary.
Our mortgage portfolio is also exposed to the credit risk that borrowers may fail to repay mortgage loansheld in our portfolio or backing mortgage-related securities held in our portfolio. Our credit guaranty businessis responsible for managing mortgage credit risk on loans and mortgage-related securities held in our portfolioand mortgage-related securities guaranteed by us that are held by other investors. Accordingly, for segmentreporting purposes, we allocate a fee comparable to an MBS guaranty fee from the portfolio investmentbusiness to the credit guaranty business for management of the credit risk on the mortgage loans andmortgage-related securities held in the portfolio. Likewise, all mortgage-related credit expenses are allocatedto the credit guaranty business. We establish a loss reserve for credit risk allocated to the credit guaranty
8

business. This intersegment allocation of a credit risk management fee and mortgage-related credit expenseshas no impact on Fannie Mae's reported net income.
Mortgage Portfolio
Assets Purchased. Fannie Mae purchases primarily single-family, conventional, Ñxed- or adjustable-rate, Ñrst lien mortgage loans, or mortgage-related securities backed by such loans. In addition, we purchaseloans insured by the FHA, loans guaranteed by the VA or RHS, manufactured housing loans, multifamilymortgage loans, subordinate mortgage loans (e.g., loans secured by second liens) and other mortgage-relatedsecurities. See ""Item 7 Ì Management's Discussion and Analysis of Financial Condition and Results ofOperations Ì Business Segment Results Ì Portfolio Investment Business Ì Mortgage Portfolio Ì Table 8''for information on the composition of our mortgage portfolio.
Maturities. Fannie Mae purchases conventional, single-family Ñxed-rate mortgages with originalmaturities of up to 30 years and conventional, single-family adjustable-rate mortgages (""ARMs'') withmaturities of up to 40 years. Only a small portion of ARMs we purchase have maturities of more than30 years. The multifamily mortgage loans we purchase generally are Ñxed-rate loans with maturities of up to30 years.
Payment Structure; Balloon Payments. The majority of Ñxed-rate mortgage loans we purchase providefor equal or ""level'' monthly installments of principal and interest. Some of these loans have larger or""balloon'' payments due 5, 7, or 10 years after origination, but with monthly payments based on longer (e.g.,30-year) amortization schedules. Most of the 7-year balloon single-family mortgage loans permit the borrowerto reÑnance the balloon payment at maturity with a 23-year Ñxed-rate mortgage loan if certain requirementsare satisÑed. Many of the multifamily mortgage loans have balloon payments due 5, 7, 10, or 15 years afterorigination, but with payments based on 25- or 30-year amortization schedules.
Adjustable-Rate Mortgage Loans. The interest rates on ARMs are determined by formulas providingfor automatic adjustment, up or down, at speciÑed intervals in accordance with changes in speciÑed indices.Fixed-period ARMs have an interest rate that is Ñxed for the Ñrst 2 to 10 years, and is adjusted at speciÑedintervals after the initial period. The payments of interest, or principal and interest, on substantially all ARMsadjust (up or down) after the interest rate on the loan is adjusted because of changes in the applicable index.We currently purchase single-family ARMs only if the ARMs limit the amount the interest rate may changeover the life of the loan. We purchase a small amount of ARMs that may permit negative amortization. Wegenerally require that those loans be reamortized at least annually to limit the amount of negative amortizationthat may accrue.
We also purchase certain ARMs, called reverse mortgages, that provide for periodic installments ofprincipal to be paid to the borrower. Over the life of these loans, interest and certain other fees accrue on thebalance of the payments made to the borrower. Generally, the loan is due when the borrower no longeroccupies the property. We currently purchase reverse mortgages only if the reverse mortgages are subject to alimit on the amount the interest rate may change over the life of the loan. Most of the reverse mortgages wepurchase are guaranteed by the Federal government.
Liquid Investment Portfolio
The liquid investment portfolio serves principally as a source of liquidity and an investment vehicle forour surplus capital. If our access to the debt capital markets is ever impeded, we Ñrst will utilize assets in ourliquid investment portfolio to generate cash to meet our liquidity needs. We may use funds received atmaturity of the short-term investments in the portfolio or sell assets from the portfolio to generate those funds.The liquid investment portfolio primarily invests in high quality securities that are readily marketable or haveshort-term maturities. The liquid investment portfolio does not invest in mortgage loans or mortgage-relatedsecurities.
We have set a goal to maintain liquid assets equal to at least 5 percent of total on balance-sheet assets.Our ratio of liquid assets to total assets at December 31, 2002 and 2001 was 6.9 percent and 9.5 percent,
9

respectively. Because our liquid assets are maintained for liquidity purposes and not principally as aninvestment business, the income generated from these investments is considerably lower than the incomegenerated by mortgage portfolio investments. See ""Item 7 Ì Management's Discussion and Analysis ofFinancial Condition and Results of Operations Ì Business Segment Results Ì Portfolio Investment Busi-ness Ì Nonmortgage Investments Ì Tables 11 and 12'' for information on our liquid investment portfolio.
Credit Guaranty Business
Overview. Our credit guaranty business has primary responsibility for managing our mortgage creditrisk. Credit risk is the risk of nonpayment by borrowers and counterparties. The primary source of income forthe credit guaranty business is fees we receive for our guaranty of the timely payment of scheduled principaland interest on MBS that are held by other investors, less the cost of providing this service. In addition, theportfolio investment business compensates the credit guaranty business, for segment reporting purposes,through a fee comparable to an MBS guaranty fee. Consequently, we generally allocate mortgage creditexpenses, including credit losses, to the credit guaranty business for business segment reporting purposes. Thecredit guaranty business also provides investment capital to the portfolio investment business for which it isallocated income, and earns interest income on the temporary investment of principal and interest paymentson mortgage loans underlying MBS prior to remittance to investors.
Our credit guaranty business manages Fannie Mae's mortgage credit risk through sound asset acquisitionpractices, use of credit enhancements, active management of the credit book of business, and aggressiveproblem loan management. We share mortgage credit risk with third parties as an integral part of our riskmanagement strategy. In our credit enhancement arrangements, we bear institutional counterparty risk thatthe parties assuming credit enhancement obligations may be unable to meet their contractual obligations.Mortgage credit enhancements are primarily mortgage insurance, lender recourse, and other risk sharingcontracts. We routinely monitor the risks associated with credit enhancement and other risk sharingarrangements. We have provided a detailed description of how we manage the mortgage-related credit riskassociated with the credit guaranty business, as well as other types of credit risk, in ""Item 7 Ì Management'sDiscussion and Analysis of Financial Condition and Results of Operations Ì Risk Management Ì CreditRisk Management.''
The following diagram illustrates the basic structure of how we create a typical MBS in the case where alender chooses to sell the MBS to a third party.
10

3
2
1
MBS Guaranty Process
Lender sells guaranteed
MBS to investors
Fannie Mae
Fannie Mae creates MBS from pools of mortgages and returns MBS to Lenders. Fannie Mae
retains credit risk, for which we receive a guaranty fee.
Lender originates loan with consumer
Consumers
Lenders
Mortgage
MBS
MBS Mortgages
$$$
$$$
Investors
In the credit guaranty business, lenders originate mortgages with consumers. They “swap” the loans for MBS with Fannie Mae assuming the credit risk on the loans and guaranteeing the timely payment of scheduled principal and interest on the MBS, for which Fannie Mae receives a guaranty fee. Fannie Mae returns the MBS to the lender, who sells it to investors.
MBS. We create both single-class and multi-class MBS. The MBS represent beneÑcial interests inpools of mortgage loans or in other mortgage-related securities. The MBS, and the mortgage loans andmortgage-related securities backing MBS, are not assets of Fannie Mae, except when we acquire them formortgage portfolio investment purposes.
We create MBS backed by mortgage loans bearing interest at either Ñxed or adjustable rates, and securedby Ñrst or subordinate liens on either single-family or multifamily residential properties. Mortgage loans can beeither conventional mortgage loans or government guaranteed or insured mortgage loans. Conventional single-family and multifamily loans are subject to the underwriting guidelines applicable to our loan purchases. Themajority of our outstanding MBS represent beneÑcial interests in conventional Ñxed-rate Ñrst mortgage loanssecured by single-family dwellings.
We are the trustee for each trust and hold the underlying mortgage loans or mortgage-related securitiesseparate and apart from our assets, for the beneÑt of the certiÑcateholders.
Single-Class MBS. Single-class MBS are MBS that are typically created through single-lendertransactions in which a lender delivers mortgage loans in exchange for MBS representing beneÑcial interests inthose mortgage loans and our guaranty. Another form of single-class MBS, referred to as ""Fannie Majors»'',allows multiple lenders to pool mortgage loans that are delivered to us and, in exchange, receive MBSrepresenting each lender's proportionate share of the larger pool. We also create single-class MBS referred toas ""Fannie Megas»'' or ""Megas.'' Megas are pass-through certiÑcates backed by pooled multiple single-classMBS with similar characteristics and/or other pooled Megas with similar characteristics. Megas are issued intransactions in which a lender or investment banker exchanges pooled single-class MBS and/or other pooledMegas for newly issued Mega certiÑcates.
11

Principal and interest from the mortgage loans underlying the single-class MBS are passed through to thecertiÑcateholders less a fee for servicing the mortgage loans and a fee for our guaranty. We guarantee thetimely payment of scheduled principal due on the underlying mortgage loans and interest at the MBS pass-through rate to the certiÑcateholders, even if we have not received the payments on the underlying mortgageloans. In other words, through our guaranty to certiÑcateholders, we assume the credit risk of borrowerdefaults on the underlying mortgage loans, as well as any risk arising from a default or bankruptcy of the sellerand servicer of the loans.
We have a responsibility to certiÑcateholders for the servicing of the mortgage loans underlying the MBSand certain other mortgage-related securities, although we do not directly service the mortgage loans. See""Item 1 Ì Business Ì Fannie Mae Business Standards Ì Servicing Arrangements.'' We are also responsiblefor certain administrative functions, such as the collection and receipt of payments from the contract servicer,maintaining accounting records for each trust, and for the distribution of payments and reports due tocertiÑcateholders.
The MBS TBA Market. Single-class MBS outstanding constituted approximately 75 percent of FannieMae's total MBS outstanding as of December 31, 2002. The vast majority of these MBS are sold by lendersinto the ""TBA'' (""to be announced'') securities market. A TBA trade represents a contract for the purchaseor sale of single-family mortgage-related securities to be delivered at a future agreed-upon date. The speciÑcpool numbers that will be delivered to fulÑll the trade obligation or terms of the contract are unknown at thetime of the trade. Parties to a TBA trade agree upon the issuer and product type to be delivered (denoted by apool preÑx), the coupon or interest rate of the security to be delivered, the settlement date of the trade, theamount of securities to be delivered, and the price of those securities. The single-class MBS that ultimatelywill be delivered, and the loans backing that MBS, frequently have not been created or originated at the timeof the TBA trade, even though a price for the securities is agreed to at that time. A TBA trade may be enteredinto as much as several months before actual settlement of that trade. TBA sales enable the originating lenderto hedge its interest rate risk and ""lock-in'' interest rates for mortgage loan applicants throughout the loanorigination process. A lender may satisfy its delivery requirement under a TBA trade by delivering anymortgage-related security meeting the agreed-upon terms.
Multi-Class MBS. We also create and guarantee multi-class MBS, such as real estate mortgageinvestment conduits, commonly referred to as ""REMICs'', certain grantor trust certiÑcates, and strippedmortgage-backed certiÑcates, commonly referred to as ""SMBS''. REMICs are a vehicle by which an issuercan restructure interest and principal payments on mortgage assets into separately tradeable interests. Byredirecting the cash Öows from the underlying mortgage assets, we can create a security having several classes,also called ""tranches,'' which, among other things, may have diÅerent coupon rates, average lives, repaymentsensitivities and Ñnal maturities. SMBS operate in a manner similar to REMICs, though we typically useSMBS to create tranches that pay only principal or only interest. We generally receive one-time fees forswapping mortgage loans, MBS and other mortgage-related securities for our multi-class MBS. If the multi-class MBS are backed by whole loans or securities we have not already guaranteed, we may receive a guarantyfee in addition to a transaction fee. We otherwise receive no separate guaranty fees for these transactionsbecause we have already assumed the credit risk on the underlying securities and receive guaranty fees for thatassumption on the underlying securities.
Multi-class MBS provide a variety of cash Öow options for investors. In multi-class MBS, each class isentitled to diÅerent cash Öows. For example, these cash Öows may consist of (1) principal only payments fromthe underlying mortgage loans, (2) interest only payments from the underlying mortgage loans, or (3) diÅer-ent percentages of principal and interest payments. In addition, the timing of payments may vary among theclasses of REMIC certiÑcates. For example, a REMIC class may receive payments for only a limited periodduring the life of the trust. Our multi-class MBS may be backed directly by mortgage loans or by othermortgage-related securities, including single-class MBS, REMIC certiÑcates, grantor trust certiÑcates, ormortgage-related securities of an issuer other than Fannie Mae. In general, our guaranty for multi-classmortgage-related securities covers timely payment of scheduled principal and interest due on these certiÑcatesand ultimate payment of principal by the date speciÑed for each class of certiÑcates. We have created alimited number of subordinated REMIC classes that are not guaranteed by Fannie Mae. Most Fannie Mae
12

multi-class mortgage-related securities are created in transactions in which an investment banker, or lessfrequently a lender or a mortgage banker, exchanges mortgage loans or mortgage-related securities, or acombination of both, for the newly-issued Fannie Mae multi-class MBS.
Guaranty Fees. We receive guaranty fees for our guaranty of timely payment of scheduled principal andinterest on MBS. When we create an MBS, we establish a guaranty fee for the MBS, taking into considerationthe credit risk associated with the loans backing the MBS. We either (1) determine a weighted averageguaranty fee based on the characteristics of the loans in the trust and assign that fee to each loan in the trust or(2) assign each loan in the trust a guaranty fee based on its risk characteristics. In the latter instance, ourweighted average guaranty fee for the MBS may increase or decrease over time depending upon prepaymentactivity. Guaranty fees generally are paid to us on a monthly basis from a portion of the interest paymentsreceived on the underlying mortgage loans, as long as the loans are in the MBS. Guaranty fees are typicallycalculated for MBS at the loan level as a percent of the unpaid principal balance remaining on a loan. Themonthly guaranty fee may be adjusted up or down through a cash payment to or from the lender at the timethe MBS is issued.
The aggregate amount of guaranty fees we receive in any Ñnancial statement period depends primarilyupon the amount of Fannie Mae MBS outstanding during that Ñnancial statement period and on theapplicable guaranty fee rates. The amount of MBS outstanding is inÖuenced by factors including the rates atwhich the underlying mortgage loans are repaid, the rate of defaults on loans or breaches of lenderrepresentations resulting in repurchases from the pool, and the rate at which we issue new MBS and purchaseor sell MBS in our mortgage portfolio business. In general, when prevailing interest rates decline below theinterest rates on loans underlying outstanding MBS, both the rate of mortgage loan prepayments and theissuance of new MBS are likely to increase. Conversely, when interest rates rise above the interest rates onmortgage loans underlying our outstanding MBS, the rate of mortgage loan prepayments and new MBSissuance is likely to slow. The rate of principal prepayments also is inÖuenced by a variety of economic,demographic, and other factors.
Delinquencies and REO. We manage loans in partnership with our servicers to minimize the frequencyof foreclosure and the severity of loss in the event of foreclosure. When a loan is in default, generally theservicer takes appropriate loss mitigation steps or, if necessary, pursues foreclosure on behalf of Fannie Mae. Ifa mortgage is liquidated through foreclosure or deed in lieu of foreclosure we would acquire the underlyingproperty (as real estate owned, or ""REO'') and attempt to sell the REO. If the defaulted loan backs an MBS,we may repurchase the loan out of the MBS trust and pay the principal balance on the loan to the MBScertiÑcateholders when the loan is delinquent by four or more consecutive monthly payments (or eightbiweekly installments.) This is generally our current practice given the level of interest rates, because it isoften less expensive for us to fund the purchase of the loan at our lower borrowing cost than to continue to passthrough to the investor the coupon rate of the MBS. We have a policy to repurchase the loan if it is delinquentby twenty-four consecutive months or at the time of foreclosure, if it is still in the MBS trust at that time. Aslong as the loan or REO remains in the MBS trust, we continue to pay scheduled principal and interest to thecertiÑcateholders and defer payment of the remaining principal balance until the earlier of the repurchase ofthe loan from the MBS trust, the sale of the REO or the third year following foreclosure.
The level of delinquencies and number of REO are aÅected by economic conditions, loss mitigationeÅorts (which include contacting delinquent borrowers to oÅer a repayment plan, loan modiÑcation,preforeclosure sale, or other options), contractual provisions in credit enhancements, and a variety of otherfactors. We manage the risk of delinquencies and REO, including the risk on loans and mortgage-relatedsecurities held in our mortgage portfolio, as described in ""Item 7 Ì Management's Discussion and Analysis ofFinancial Condition and Results of Operations Ì Risk Management Ì Credit Risk Management.''
Fee-Based Services
We oÅer services to lenders and other customers in return for fees. These include transaction fees forissuing and administering REMICs, SMBS, Fannie Megas and certain grantor trust securities, and facilitatingsecurities transactions.
13

We also receive fee income in return for providing technology-related services, such as DesktopUnderwriter, Desktop Originator», and other on-line services. These services provide lenders the ability tounderwrite mortgage loans electronically, communicate with third-party originators, access our loan pricingschedules, and enter into sale commitments with us on a real-time basis.
We also facilitate securities transactions for customers. For this service, we may earn a spread on thepurchase and sale of MBS and certain other mortgage-related securities, such as Ginnie Mae certiÑcates, ormay receive a fee from the customer. In addition, we receive fee income through other activities, such asproviding credit enhancements and other investment alternatives for customers.
Housing Goals
The Federal Housing Enterprises Financial Safety and Soundness Act (the ""1992 Act'') requires theSecretary of the U.S. Department of Housing and Urban Development (""HUD'') to establish a low-andmoderate-income, an underserved areas, and a special aÅordable housing goal for loans purchased orguaranteed by Fannie Mae. We are required to submit an annual report to the House Committee on FinancialServices, the Senate Committee on Banking, Housing and Urban AÅairs, and the Secretary of HUDregarding our performance in meeting the housing goals. By regulation, HUD has established the low- andmoderate-income housing goal at 50 percent of the total number of dwelling units Ñnanced by eligiblemortgage purchases annually, the underserved areas housing goal at 31 percent, and the special aÅordablehousing goal, a more targeted measure, at 20 percent. ""Eligible mortgage purchases'' include MBS guaranteesbut exclude several activities, including the purchase or guaranty of non-conventional mortgages andmortgages on second homes, commitments to purchase or guarantee mortgages at a later date, and equityinvestments in low-income housing tax credits. For the year ended December 31, 2002, ""eligible mortgagepurchases'' represented approximately 97% of our business volume. In addition, HUD has established FannieMae's targeted multifamily subgoal at $2.85 billion.
Each of these goals applies annually during 2001 through 2003. If HUD does not establish diÅerent goalsfor 2004 and after, the goals will continue at the current levels. The goals also include certain provisions thatreduce penalties for missing data and provide incentive points for serving small multifamily and owner-occupied rental housing. A loan may be counted in more than one category of goals. If HUD determines thatFannie Mae has failed to meet its housing goals and that achievement of the goals was feasible, taking intoaccount market and economic conditions and Fannie Mae's Ñnancial condition, Fannie Mae must submit ahousing plan to HUD describing the actions it will take to meet the goal in the next calendar year. If HUDdetermines that Fannie Mae has failed to submit a housing plan or failed to make a good faith eÅort to complywith the plan, HUD may take certain administrative actions. The following table shows Fannie Mae's housinggoals and results for the past three years.
2002 2001 2000
Housing Goals Goal(1) Result Goal(1) Result Goal(1) Result
(Dollars in billions)
Low- and moderate-income housingÏÏÏÏÏÏÏÏÏÏÏÏÏÏÏÏÏÏÏÏ 50.0% 51.8% 50.0% 51.6% 42.0% 49.5%
Underserved areas ÏÏÏÏÏÏÏÏÏÏÏÏÏÏÏÏÏÏÏÏÏÏÏÏÏÏÏÏÏÏÏÏÏÏÏ 31.0 32.8 31.0 32.5 24.0 31.0
Special aÅordable housing ÏÏÏÏÏÏÏÏÏÏÏÏÏÏÏÏÏÏÏÏÏÏÏÏÏÏÏÏ 20.0 21.4 20.0 21.6 14.0 22.3
Multifamily minimum in special aÅordable housingÏÏÏÏÏÏÏ $2.85 $7.22 $2.85 $7.40 $1.30 $3.78
(1) Goals are expressed as a percentage of the total number of dwelling units Ñnanced through eligible mortgagepurchases during the period, except for the targeted multifamily goal.
Competition
In the case of single-family mortgage loans, Fannie Mae competes, within the limits prescribed by theCharter Act, for the purchase of mortgage loans for our own portfolio, for the guaranty of mortgage credit risk,and for the issuance in the secondary mortgage market of mortgage-related securities. For single-familyproducts, we compete with Freddie Mac (another government-sponsored enterprise with a mission, authority,and regulatory oversight that are virtually identical to our own), commercial banks, savings and loan
14

associations, savings banks, pension funds, insurance companies, securities dealers, and other Ñnancial entitiesthat purchase single-family mortgage loans or mortgage-related securities for their own portfolio or poolsingle-family mortgage loans for sale to investors as whole loans or mortgage-related securities. We competewith the Federal Home Loan Banks, which also Ñnance single-family mortgage loans through a variety ofprograms that were initiated in 1997. We compete with mortgage insurers, bond insurers, and other Ñnancialguarantors that provide mortgage credit guaranty services on loans and pools of loans.
Commercial banks and thrifts are the largest participants in the U.S. mortgage industry. Banks and thriftsoriginate mortgages (which we are not empowered to do under the Charter Act), have access to low cost,FDIC-insured deposits and can borrow advances from Federal Home Loan Banks. There has been signiÑcantconsolidation among commercial banks and thrifts, increasing the size of individual organizations andresulting in concentration in the banking industry. This has created larger institutions with the scale necessaryto permit them to securitize their own mortgages and manage large and complex portfolios. As institutionsbecome larger, they have increasing bargaining power in their negotiations with Fannie Mae, and are able tooÅer us volume in return for lower guaranty fees and customization of services.
We compete with the FHA insurance program, a program of HUD, for the business of guaranteeing thecredit performance of mortgage loans and, because of the eligibility of such FHA-insured loans forsecuritization by the Government National Mortgage Association (""Ginnie Mae''), an entity within HUD,with Ginnie Mae as well. The base maximum principal balance for loans eligible for the FHA insuranceprogram is 48 percent of our loan limit. The loan limit for FHA-insured loans in high-cost areas is as much as87 percent of our limit. These higher FHA limits may result in increased competition for our credit guarantybusiness.
We compete primarily on the basis of price, products, structures, and services oÅered. Competition basedon advances in technology-related and other fee-based services continues to increase, as do the types andnature of the products oÅered by us and other market participants. Our market share of loans purchased forcash or swapped for mortgage-related securities is aÅected by the volume of mortgage loans oÅered for sale inthe secondary market by loan originators and other market participants and the amount purchased by ourcompetitors.
In the case of multifamily mortgage loans, we generally compete with government housing programs,Freddie Mac, insurance companies, and the same kinds of entities we compete with in the single-familymarket. In addition, there is competition for multifamily mortgage loans from certain entities typicallysponsored by investment banks and commercial banks that purchase such loans and pool them for sale toinvestors in the commercial mortgage-related securities market. Such entities are referred to as ""conduits,''and their role in the multifamily mortgage market has increased signiÑcantly over the last Ñve years. Conduitscontinue to be a strong source of competition.
Competition is particularly intense for multifamily mortgage loans eligible for government subsidies,which have low-income rent and occupancy restrictions. Commercial banks contemplating merger orexpansion plans seek to fund such loans to secure favorable review under the Community Reinvestment Actand may either hold such loans as an investment or sell them to a secondary market investor. We compete forthese investments in the secondary market to meet our housing goals.
Under the 1992 Act, the Secretary of HUD must approve any new Fannie Mae or Freddie Macconventional mortgage program that is signiÑcantly diÅerent from those approved or engaged in prior to thatAct's enactment. Our ability to compete could be aÅected by this requirement. See ""Government Regulationand Charter Act.''
Competition also is a consideration in connection with the issuance of Fannie Mae's debt securities. Wecompete with Freddie Mac, the Federal Home Loan Bank system, and other government-sponsored entitiesfor funds raised through the issuance of unsecured debt in the ""agency'' debt market. Increases in the issuanceof unsecured debt by other government-sponsored entities generally, and in the issuance of callable debt inparticular, may have an adverse eÅect on the issuance of our unsecured debt or result in the issuance of suchdebt at higher interest rates than would otherwise be the case. In addition, the availability and cost of funds
15

raised through the issuance of certain types of unsecured debt may be adversely aÅected by regulatoryinitiatives that may reduce investments by depository institutions in unsecured debt with greater than normalvolatility or interest-rate sensitivity.
Employees
As of February 28, 2003, Fannie Mae employed approximately 4,800 permanent personnel.
Government Regulation and Charter Act
Charter Act
We were established in 1938 under Title III of the National Housing Act as a government owned entity.In 1954, under the Federal National Mortgage Association Charter Act, the entity became a mixed-ownershipcorporate instrumentality of the United States. Under the Housing and Urban Development Act of 1968, theentity was divided into two separate institutions, the present Fannie Mae and Ginnie Mae. Fannie Maebecame an entirely stockholder-owned corporation, organized and existing under the Charter Act. TheCharter Act provides that the corporation will continue until dissolved by an act of Congress. The Charter Actwas further amended by the 1992 Act.
Under the Charter Act, our purpose is:
""to (1) provide stability in the secondary market for residential mortgages, (2) respond appropriately tothe private capital market, (3) provide ongoing assistance to the secondary market for residentialmortgages (including activities relating to mortgages on housing for low-and moderate-income familiesinvolving a reasonable economic return that may be less than the return earned on other activities) byincreasing the liquidity of mortgage investments and improving the distribution of investment capitalavailable for residential mortgage Ñnancing, ®and© (4) promote access to mortgage credit throughout thenation (including central cities, rural areas and underserved areas) by increasing the liquidity of mortgageinvestments and improving the distribution of investment capital available for residential mortgageÑnancing.''
The Charter Act authorizes us to ""deal in'' conventional mortgage loans, and ""purchase,'' ""sell,''""service,'' and ""lend on the security of'' such mortgages, subject to limitations on the quality of mortgagespurchased and credit enhancement requirements. Fannie Mae can act as a depositary, custodian, or Ñscalagent ""for its own account or as Ñduciary, and for the account of others.'' The Charter Act expressly enablesFannie Mae ""to lease, purchase, or acquire any property, real, personal, or mixed, or any interest therein, tohold, rent, maintain, modernize, renovate, improve, use, and operate such property, and to sell, for cash orcredit, lease, or otherwise dispose of the same, at such time and in such manner as and to the extent that itmay deem necessary or appropriate.'' The Charter Act also permits Fannie Mae to ""purchase,'' ""service,''""sell,'' ""lend on the security of'' and otherwise deal in loans or advances of credit for the purchase andinstallation of home improvements (so long as the loans are secured by a lien against the property to beimproved).
Under the Charter Act, we may not originate mortgage loans or advance funds on an interim basispending the sale of a mortgage in the secondary market. We may not purchase loans in excess of the amountof the current loan limits. (See ""BusinessÌFannie Mae Business StandardsÌPrincipal Balance Limits.'') Wemay conduct business only in the United States, its territories and possessions, the District of Columbia andthe Commonwealth of Puerto Rico. Our activities must relate to housing, mortgages and related Ñnancialproducts.
Thirteen members of our eighteen-member Board of Directors are elected by the holders of our commonstock. The President of the United States appoints the remaining Ñve members. The appointed directors mustinclude one person from the home building industry, one person from the mortgage lending industry, oneperson from the real estate industry, and one person from a consumer or community interest organization orwho has demonstrated a career commitment to providing low-income housing. Any member of the Board ofDirectors that is appointed by the President of the United States may be removed by the President for goodcause. All members of the Board of Directors are elected or appointed annually.
16

In general, HUD and OFHEO oversee the activities of Fannie Mae. HUD has ""general regulatorypower'' over Fannie Mae. The 1992 Act established OFHEO to ensure that Fannie Mae is adequatelycapitalized and is operating safely.
The Secretary of the Treasury has the authority to approve Fannie Mae's issuance of debt obligations andmortgage-related securities. At the discretion of the Secretary of the Treasury of the United States, theU.S. Treasury may purchase obligations of Fannie Mae up to a maximum of $2.25 billion outstanding at anyone time. This facility has not been used since our transition from government ownership in 1968. Neither theUnited States nor any agency thereof is obligated to Ñnance our operations or to assist us in any other manner.The Federal Reserve Banks are authorized to act as depositories, custodians, and Ñscal agents for Fannie Mae,for the Bank's own account, or as Ñduciary.
Securities we issue are ""exempt securities'' under laws administered by the SEC to the same extent assecurities that are obligations of, or guaranteed as to principal and interest by, the United States. Registrationstatements with respect to oÅerings of our securities are not Ñled with the SEC. In July 2002, we announcedour voluntary initiative to register our common stock with the SEC under Section 12(g) of the SecuritiesExchange Act of 1934. The registration of our common stock became eÅective on March 31, 2003. As aresult, we will Ñle periodic reports with the SEC, including annual reports on Form 10-K, quarterly reports onForm 10-Q, and current reports on Form 8-K, together with any required exhibits. These Ñlings will beavailable on the SEC's Electronic Data Gathering, Analysis, and Retrieval (""EDGAR'') system atwww.sec.gov. Registration of our common stock with the SEC will not impact the status of our securities(including equity, debt and MBS) as exempt securities within the meaning of the laws administered by theSEC.
We are exempt from taxation by states, counties, municipalities, or local taxing authorities, except fortaxation by those authorities on our real property. We are not exempt from payment of federal corporateincome taxes. We also may conduct our business without regard to any qualiÑcation or similar statute in anystate of the United States, including the District of Columbia, the Commonwealth of Puerto Rico, and theterritories and possessions of the United States.
Regulatory Approval and Oversight
As a federally chartered corporation, Fannie Mae is subject to Congressional legislation and oversight andis regulated for various purposes by HUD, OFHEO and the U.S. Department of the Treasury, to the extentauthorized by statute. In addition, the Ñnancial institutions with whom we do business are subject to extensivefederal and state law and regulation. Changes to legislation, regulations or policy that impact us or ourbusiness partners could adversely or favorably aÅect the performance, development, or results of our business.
OFHEO, an independent oÇce within HUD, is responsible for ensuring that we are adequatelycapitalized and operating safely in accordance with the 1992 Act. OFHEO conducts on-site examinations ofFannie Mae for purposes of ensuring our Ñnancial safety and soundness. We are required to submit annual andquarterly reports of our Ñnancial condition and operations to OFHEO. OFHEO is authorized to levy annualassessments on Fannie Mae and Freddie Mac, pursuant to annual Congressional appropriations, to coverOFHEO's reasonable expenses. OFHEO's formal enforcement powers include the power to impose temporaryand Ñnal cease-and-desist orders and civil monetary penalties on us and on our directors and executive oÇcers,provided certain conditions are met. OFHEO may use other informal supervisory tools of the type that aregenerally used by agencies with authority to regulate other Ñnancial institutions. In accordance with OFHEOregulation, Fannie Mae has elected to follow the applicable corporate governance practices and procedures ofthe Delaware General Corporation Law, as it may be amended from time to time. On January 21, 2003,OFHEO proposed regulations that would require Fannie Mae to Ñle with the SEC all reports, statements andforms relating to our common stock that are required to be Ñled under Sections 14(a) and (c) of theExchange Act and the rules and regulations under those sections and require Fannie Mae's directors andoÇcers to Ñle all reports and forms relating to our common stock that are required to be Ñled under Section 16of the Exchange Act and the rules and regulations under that section.
The Secretary of the Treasury has the authority to approve Fannie Mae's issuance of debt obligations andmortgage-related securities. The General Accounting OÇce is authorized to audit the programs, activities,
17

receipts, expenditures, and Ñnancial transactions of Fannie Mae. The Secretary of HUD has generalregulatory authority to promulgate rules and regulations to carry out the purposes of the Charter Act,excluding authority over matters granted exclusively to OFHEO. The Secretary of HUD has authority toapprove any new conventional mortgage program that is signiÑcantly diÅerent from those approved or engagedin prior to the 1992 Act. The Secretary must approve any new program unless it is not authorized by theCharter Act or the Secretary Ñnds that it is not in the public interest. The Secretary has adopted regulationsrelated to the program approval requirement. We are also required to meet certain goals established by theSecretary of HUD to promote aÅordable housing and to serve the housing needs of those in underserved areas.See ""Business Ì Housing Goals.''
Capital Requirements
The 1992 Act established minimum capital, risk-based capital, and critical capital requirements forFannie Mae. See also ""Item 7 Ì Management's Discussion and Analysis of Financial Condition and Resultsof Operations Ì Liquidity and Capital Resources Ì Capital Resources Ì Regulatory Environment.''OFHEO issued a Ñnal rule in 1996 that sets forth the minimum capital requirements for Fannie Mae andFreddie Mac, which are to be calculated, reported, and classiÑed on a quarterly basis. We were in compliancewith the minimum capital rule as of December 31, 2002, and have been in compliance for every reportingperiod since the rule became eÅective. OFHEO issued regulations in September 2001, as subsequentlyamended, to establish a risk-based capital test to be used to determine the amount of total capital Fannie Maemust hold to meet the risk-based capital standard. Fannie Mae and Freddie Mac are required to hold enoughcapital to withstand a severe 10-year stress period, characterized by extreme interest-rate movements andcredit losses occurring simultaneously, plus 30 percent of that amount for management and operations risk.The risk-based capital test evaluates combined interest-rate and credit stress for both rising and declininginterest-rate scenarios. The more stringent of these two scenarios determines the required risk-based capital.The test assumes that (1) interest rates increase or decrease by up to 600 basis points over the Ñrst year, andremain constant at this new level for the remaining 9 years of the test; (2) severe credit conditions applynationwide; and (3) we acquire no new business during this period except to meet outstanding mortgagecommitments. The regulations specify that ""benchmark loss experience'' will be combined with otherassumptions and applied each quarter to our book of business to establish expected credit losses based on thestress assumptions under the risk-based capital standard. The regulations also specify the housing price indexthat OFHEO will use in connection with the standard and how the test will be used to determine FannieMae's risk-based capital requirements. On March 31, 2003, OFHEO announced that Fannie Mae compliedwith the risk-based capital rule as of December 31, 2002. See ""Item 7 Ì Management's Discussion andAnalysis of Financial Condition and Results of Operations Ì Liquidity and Capital Resources Ì CapitalResources Ì Regulatory Environment.''
If we fail to meet the capital standards, OFHEO is permitted or required to take remedial measures,depending on the standards we fail to meet. Compliance with the capital standards could limit operations thatrequire intensive use of capital and restrict our ability to repay debt or pay dividends on our common stock.We are required to submit a capital restoration plan if we fail to meet any of the capital standards. If OFHEOdetermines that we are engaging in conduct not approved by the Director that could result in a rapid depletionof core capital or that the value of the property subject to mortgages we hold or have securitized has decreasedsigniÑcantly, or if OFHEO does not approve the capital restoration plan or determines that we have failed tomake reasonable eÅorts to comply with the plan, OFHEO may take remedial measures as if we were notmeeting the capital standards we otherwise meet. The 1992 Act gives OFHEO authority, after followingprescribed procedures, to appoint a conservator if we do not meet the critical capital level.
Dividend Restrictions
The Charter Act as amended by the 1992 Act restricts the ability of our Board of Directors to makecapital distributions, including any dividends, in the following circumstances:
‚ Fannie Mae may not pay any dividend, without the approval of OFHEO, if the dividend paymentwould decrease our total capital below the risk-based capital level or our core capital below theminimum capital level.
18

‚ If we do not meet the risk-based capital standard but do meet the minimum capital standard, we maynot make any dividend payment that would cause us to fail to meet the minimum capital standard.
‚ If we meet neither the risk-based capital standard nor the minimum capital standard but do meet thecritical capital standard established under the 1992 Act, we may make a dividend payment only if wewould not fail to meet the critical capital standard as a result of the payment and the Director ofOFHEO approves the payment after Ñnding that the payment satisÑes certain statutory conditions.
The Director has the authority to require us to submit a report to the Director regarding any capitaldistribution we declare before we make the distribution.
Item 2. Properties
We own our principal oÇce, which is located at 3900 Wisconsin Avenue, NW, Washington, DC, oÇcesat 3939 Wisconsin Avenue, NW, and 4250 Connecticut Avenue, NW, in Washington, DC, and two facilitiesin Herndon, Virginia. These owned facilities total approximately 829,000 square feet of space. In addition, welease 375,000 square feet of oÇce space at 4000 Wisconsin Avenue, NW, which is adjacent to Fannie Mae'sprincipal oÇce. The present lease for 4000 Wisconsin Avenue expires in 2008, and we have options to extendthe lease for up to 10 additional years, in 5-year increments. We also lease an additional 377,000 square feet ofoÇce space in four locations in Washington, D.C. and suburban Virginia.
We maintain oÇces in leased premises in Pasadena, California; Atlanta, Georgia; Chicago, Illinois;Philadelphia, Pennsylvania; and Dallas, Texas. In addition, we have 54 ""Fannie Mae Partnership OÇces'' inleased premises around the United States which work with cities, rural areas, and underserved communities.
Item 3. Legal Proceedings
In the ordinary course of business, we are involved in legal proceedings that arise in connection withproperties acquired either through foreclosure on properties securing delinquent mortgage loans we own or byreceiving deeds to those properties in lieu of foreclosure. For example, claims related to possible tort liabilityarise from time to time, primarily in the case of single-family REO.
We are a party to legal proceedings from time to time arising from our relationships with our seller/servicers. Disputes with lenders concerning their loan origination or servicing obligations to us, or disputesconcerning termination by us (for any of a variety of reasons) of a lender's authority to do business with us asa seller and/or servicer, can result in litigation. Also, loan servicing and Ñnancing issues have resulted fromtime to time in claims against us brought as putative class actions for borrowers. We also are a party to legalproceedings from time to time arising from other aspects of our business and administrative policies.
Claims and proceedings of all types are subject to many uncertain factors that generally cannot bepredicted with assurance. However, in the case of the legal proceedings and claims that are currently pendingagainst us, management believes that their outcome will not have a material adverse eÅect on our Ñnancialcondition, results of operations or cashÖows.
Item 4. Submission of Matters to a Vote of Security Holders
None.
PART II
Item 5. Market for Registrant's Common Equity and Related Stockholder Matters
Information on the market for our common stock and related stockholder matters is set forth underItem 9 of the Form 10 we Ñled on March 31, 2003 (the ""Form 10'') and incorporated by reference herein.
19

Item 6. Selected Financial Data
The following selected Ñnancial data have been summarized or derived from our audited Ñnancialstatements. This Ñnancial information should be read in conjunction with ""Item 7 Ì Management'sDiscussion and Analysis of Financial Condition and Results of Operations,'' ""Item 1 Ì Business,'' and ourÑnancial statements and related notes, included elsewhere in this report.
Year Ended December 31,
Income Statement Data: 2002 2001 2000 1999 1998
(Dollars and shares in millions, except per common share amounts)
Interest income ÏÏÏÏÏÏÏÏÏÏÏÏÏÏÏÏÏÏÏÏÏÏÏÏÏÏÏÏÏÏÏÏÏÏÏÏ $ 50,853 $ 49,170 $ 42,781 $ 35,495 $ 29,995Interest expenseÏÏÏÏÏÏÏÏÏÏÏÏÏÏÏÏÏÏÏÏÏÏÏÏÏÏÏÏÏÏÏÏÏÏÏÏ (40,287) (41,080) (37,107) (30,601) (25,885)
Net interest income ÏÏÏÏÏÏÏÏÏÏÏÏÏÏÏÏÏÏÏÏÏÏÏÏÏÏÏÏÏÏÏÏ 10,566 8,090 5,674 4,894 4,110Guaranty fee incomeÏÏÏÏÏÏÏÏÏÏÏÏÏÏÏÏÏÏÏÏÏÏÏÏÏÏÏÏÏÏÏÏ 1,816 1,482 1,351 1,282 1,229Fee and other income (expense), netÏÏÏÏÏÏÏÏÏÏÏÏÏÏÏÏÏÏ 232 151 (44) 191 275Provision for losses ÏÏÏÏÏÏÏÏÏÏÏÏÏÏÏÏÏÏÏÏÏÏÏÏÏÏÏÏÏÏÏÏÏ (128) (94) (122) (151) (245)Foreclosed property income (expense)ÏÏÏÏÏÏÏÏÏÏÏÏÏÏÏÏÏ 36 16 28 24 (16)Administrative expenseÏÏÏÏÏÏÏÏÏÏÏÏÏÏÏÏÏÏÏÏÏÏÏÏÏÏÏÏÏÏ (1,219) (1,017) (905) (800) (708)Special contribution ÏÏÏÏÏÏÏÏÏÏÏÏÏÏÏÏÏÏÏÏÏÏÏÏÏÏÏÏÏÏÏÏ Ì (300) Ì Ì ÌPurchased options expense(1) ÏÏÏÏÏÏÏÏÏÏÏÏÏÏÏÏÏÏÏÏÏÏÏÏÏ (4,545) (37) Ì Ì ÌDebt extinguishments, net ÏÏÏÏÏÏÏÏÏÏÏÏÏÏÏÏÏÏÏÏÏÏÏÏÏÏÏ (710) (524) 49 (14) (40)
Income before federal income taxes and cumulative eÅectof change in accounting principle ÏÏÏÏÏÏÏÏÏÏÏÏÏÏÏÏÏÏÏ 6,048 7,767 6,031 5,426 4,605
Provision for federal income taxesÏÏÏÏÏÏÏÏÏÏÏÏÏÏÏÏÏÏÏÏÏ (1,429) (2,041) (1,583) (1,514) (1,187)
Income before cumulative eÅect of change in accountingprinciple ÏÏÏÏÏÏÏÏÏÏÏÏÏÏÏÏÏÏÏÏÏÏÏÏÏÏÏÏÏÏÏÏÏÏÏÏÏÏÏÏ 4,619 5,726 4,448 3,912 3,418
Cumulative eÅect of change in accounting principle, netof tax eÅect(2) ÏÏÏÏÏÏÏÏÏÏÏÏÏÏÏÏÏÏÏÏÏÏÏÏÏÏÏÏÏÏÏÏÏÏÏ Ì 168 Ì Ì Ì
Net income ÏÏÏÏÏÏÏÏÏÏÏÏÏÏÏÏÏÏÏÏÏÏÏÏÏÏÏÏÏÏÏÏÏÏÏÏÏÏÏ $ 4,619 $ 5,894 $ 4,448 $ 3,912 $ 3,418
Preferred stock dividends ÏÏÏÏÏÏÏÏÏÏÏÏÏÏÏÏÏÏÏÏÏÏÏÏÏÏÏÏ (99) (138) (121) (78) (66)
Net income available to common stockholders ÏÏÏÏÏÏÏÏÏÏ $ 4,520 $ 5,756 $ 4,327 $ 3,834 $ 3,352
Basic earnings per common share:Earnings before cumulative eÅect of change in
accounting principle ÏÏÏÏÏÏÏÏÏÏÏÏÏÏÏÏÏÏÏÏÏÏÏÏÏÏÏÏ $ 4.56 $ 5.58 $ 4.31 $ 3.75 $ 3.26Cumulative eÅect of change in accounting principle ÏÏÏ Ì .17 Ì Ì Ì
Net earningsÏÏÏÏÏÏÏÏÏÏÏÏÏÏÏÏÏÏÏÏÏÏÏÏÏÏÏÏÏÏÏÏÏÏÏÏÏ $ 4.56 $ 5.75 $ 4.31 $ 3.75 $ 3.26
Diluted earnings per common share:Earnings before cumulative eÅect of change in
accounting principle ÏÏÏÏÏÏÏÏÏÏÏÏÏÏÏÏÏÏÏÏÏÏÏÏÏÏÏÏ $ 4.53 $ 5.55 $ 4.29 $ 3.72 $ 3.23Cumulative eÅect of change in accounting principle ÏÏÏ Ì .17 Ì Ì Ì
Net earningsÏÏÏÏÏÏÏÏÏÏÏÏÏÏÏÏÏÏÏÏÏÏÏÏÏÏÏÏÏÏÏÏÏÏÏÏÏ $ 4.53 $ 5.72 $ 4.29 $ 3.72 $ 3.23
Cash dividends per common share ÏÏÏÏÏÏÏÏÏÏÏÏÏÏÏÏÏÏÏÏ $ 1.32 $ 1.20 $ 1.12 $ 1.08 $ .96
December 31,
Balance Sheet Data: 2002 2001 2000 1999 1998
Mortgage portfolio, net ÏÏÏÏÏÏÏÏÏÏÏÏÏÏÏÏÏÏÏÏÏÏÏÏÏÏÏÏÏÏ $797,693 $705,324 $607,551 $522,921 $415,355Liquid assets ÏÏÏÏÏÏÏÏÏÏÏÏÏÏÏÏÏÏÏÏÏÏÏÏÏÏÏÏÏÏÏÏÏÏÏÏÏÏ 61,554 76,072 55,585 41,850 59,258Total assets ÏÏÏÏÏÏÏÏÏÏÏÏÏÏÏÏÏÏÏÏÏÏÏÏÏÏÏÏÏÏÏÏÏÏÏÏÏÏÏ 887,515 799,948 675,224 575,308 485,146Borrowings:
Due within one year ÏÏÏÏÏÏÏÏÏÏÏÏÏÏÏÏÏÏÏÏÏÏÏÏÏÏÏÏÏÏ 382,412 343,492 280,322 226,582 205,413Due after one year ÏÏÏÏÏÏÏÏÏÏÏÏÏÏÏÏÏÏÏÏÏÏÏÏÏÏÏÏÏÏÏ 468,570 419,975 362,360 321,037 254,878
Total liabilitiesÏÏÏÏÏÏÏÏÏÏÏÏÏÏÏÏÏÏÏÏÏÏÏÏÏÏÏÏÏÏÏÏÏÏÏÏÏ 871,227 781,830 654,386 557,679 469,693Preferred stockÏÏÏÏÏÏÏÏÏÏÏÏÏÏÏÏÏÏÏÏÏÏÏÏÏÏÏÏÏÏÏÏÏÏÏÏÏ 2,678 2,303 2,278 1,300 1,150Stockholders' equity ÏÏÏÏÏÏÏÏÏÏÏÏÏÏÏÏÏÏÏÏÏÏÏÏÏÏÏÏÏÏÏÏ 16,288 18,118 20,838 17,629 15,453
20

Year ended December 31,
Core Business Earnings Data(3): 2002 2001 2000 1999 1998
(Dollars and Shares in millions, except per common share amounts)
Core business earnings(4)ÏÏÏÏÏÏÏÏÏÏÏÏÏÏÏÏÏÏÏÏÏÏÏÏÏÏÏ $ 6,394 $ 5,367 $ 4,448 $ 3,912 $ 3,418Total taxable-equivalent revenues(5)ÏÏÏÏÏÏÏÏÏÏÏÏÏÏÏÏÏÏ 11,896 10,187 7,825 6,975 6,272Net interest margin ÏÏÏÏÏÏÏÏÏÏÏÏÏÏÏÏÏÏÏÏÏÏÏÏÏÏÏÏÏÏÏ 1.15% 1.11% 1.01% 1.01% 1.03%Return on average assets(6) ÏÏÏÏÏÏÏÏÏÏÏÏÏÏÏÏÏÏÏÏÏÏÏÏÏ .76 .71 .71 .73 .78Return on average realized common equity(7) ÏÏÏÏÏÏÏÏÏ 26.1 25.4 25.2 25.0 25.2
December 31,
Other Data: 2002 2001 2000 1999 1998
Average eÅective guaranty fee rate ÏÏÏÏÏÏÏÏÏÏÏÏÏÏÏÏÏÏ .191% .190% .195% .193% .202%Credit loss ratio(8) ÏÏÏÏÏÏÏÏÏÏÏÏÏÏÏÏÏÏÏÏÏÏÏÏÏÏÏÏÏÏÏÏ .005 .006 .007 .011 .027Administrative expense ratio(9) ÏÏÏÏÏÏÏÏÏÏÏÏÏÏÏÏÏÏÏÏÏÏ .072 .071 .072 .071 .074EÇciency ratio(10) ÏÏÏÏÏÏÏÏÏÏÏÏÏÏÏÏÏÏÏÏÏÏÏÏÏÏÏÏÏÏÏÏ 10.2 10.0 11.6 11.5 11.3Dividend payout ratio ÏÏÏÏÏÏÏÏÏÏÏÏÏÏÏÏÏÏÏÏÏÏÏÏÏÏÏÏÏ 29.0 20.9 26.0 28.8 29.5Ratio of earnings to combined Ñxed charges and
preferred stock dividends(11) ÏÏÏÏÏÏÏÏÏÏÏÏÏÏÏÏÏÏÏÏÏÏ 1.15:1 1.19:1 1.16:1 1.17:1 1.17:1Mortgage purchases ÏÏÏÏÏÏÏÏÏÏÏÏÏÏÏÏÏÏÏÏÏÏÏÏÏÏÏÏÏÏÏ $ 370,641 $270,584 $154,231 $195,210 $188,448MBS issues acquired by others(12) ÏÏÏÏÏÏÏÏÏÏÏÏÏÏÏÏÏÏÏ 478,260 344,739 105,407 174,850 220,723Outstanding MBS(13) ÏÏÏÏÏÏÏÏÏÏÏÏÏÏÏÏÏÏÏÏÏÏÏÏÏÏÏÏÏÏ 1,029,456 858,867 706,684 679,169 637,143Weighted-average diluted common shares outstanding ÏÏ 997 1,006 1,009 1,031 1,037Return on average assets ÏÏÏÏÏÏÏÏÏÏÏÏÏÏÏÏÏÏÏÏÏÏÏÏÏÏÏ .55% .78% .71% .73% .78%Average equity to average assets ÏÏÏÏÏÏÏÏÏÏÏÏÏÏÏÏÏÏÏÏ 2.1 2.3 3.1 3.1 3.3Return on common equityÏÏÏÏÏÏÏÏÏÏÏÏÏÏÏÏÏÏÏÏÏÏÏÏÏÏ 30.2 39.8 25.6 25.2 25.2Core capital(14) ÏÏÏÏÏÏÏÏÏÏÏÏÏÏÏÏÏÏÏÏÏÏÏÏÏÏÏÏÏÏÏÏÏÏÏ $ 28,079 $ 25,182 $ 20,827 $ 17,876 $ 15,465Total capital(15)ÏÏÏÏÏÏÏÏÏÏÏÏÏÏÏÏÏÏÏÏÏÏÏÏÏÏÏÏÏÏÏÏÏÏÏ 28,871 25,976 21,634 18,677 16,257
(1) Represents the change in the fair value of the time value of purchased options under FAS 133, ""Accounting for DerivativeInstruments and Hedging Activities'' (FAS 133).
(2) Represents the after-tax eÅect on income of the adoption of FAS 133 on January 1, 2001.(3) Core business earnings data are non-GAAP (generally accepted accounting principles) measures management uses to track
and analyze our Ñnancial performance. See ""Management's Discussion and Analysis of Financial Condition and Results ofOperationsÌCore Business Earnings and Business Segment Results'' for additional discussion of these measures.
(4) Core business earnings is a non-GAAP measure developed by management, in conjunction with the adoption of FAS 133,to evaluate and assess the quality of Fannie Mae's earnings from its principal business activities on a consistent basis. Corebusiness earnings is presented on a net of tax basis and excludes the transition adjustment from the adoption of FAS 133and unrealized gains and losses on purchased options recorded under FAS 133, and includes purchased options premiumsamortized on a straight-line basis over the original estimated life of the option.
(5) Includes revenues net of operating losses on low-income housing tax credit limited partnerships (accounted for using theequity method of accounting) and amortization expense of purchased options premiums, plus taxable-equivalent adjust-ments for tax-exempt income and investment tax credits using the applicable federal income tax rate. This is a non-GAAPmeasure.
(6) Core business earnings less preferred stock dividends divided by average assets. This is a non-GAAP measure.(7) Core business earnings less preferred stock dividends divided by average realized common stockholders' equity (common
stockholders' equity excluding accumulated other comprehensive income). This is a non-GAAP measure.(8) Charge-oÅs, net of recoveries, and foreclosed property income (expense) as a percentage of average mortgage portfolio (on
an amortized cost basis) and average outstanding MBS.(9) Administrative expenses as a percentage of average net mortgage portfolio and average outstanding MBS.
(10) Administrative expenses as a percentage of taxable-equivalent revenues.(11) ""Earnings'' consists of (a) income before federal income taxes and cumulative eÅect of accounting changes and (b) Ñxed
charges. Fixed charges represent interest expense.(12) Includes MBS and other mortgage-related securities guaranteed by Fannie Mae.(13) Includes MBS and other mortgage-related securities guaranteed by Fannie Mae and held by investors other than Fannie
Mae.(14) The sum of (a) the stated value of common stock, (b) the stated value of outstanding noncumulative perpetual preferred
stock, (c) paid-in capital, and (d) retained earnings, less treasury stock. Core capital represents a regulatory measure ofcapital. Refer to Note 11 of the Ñnancial statements, ""Dividend Restrictions and Regulatory Capital Ratios,'' for adiscussion of core capital.
(15) The sum of (a) core capital and (b) the total allowance for loan losses and guaranty liability for MBS, less (c) the speciÑcloss allowance. Total capital represents a regulatory measure of capital. SpeciÑc loss allowances totaled $19 million,$13 million, $2 million, $3 million, and $10 million for the years ended December 31, 2002, 2001, 2000, 1999, and 1998,respectively. Refer to Note 11 of the Ñnancial statements, ""Dividend Restrictions and Regulatory Capital Ratios,'' for adiscussion of total capital.
21

Item 7. Management's Discussion and Analysis of Financial Condition and Results of Operations
Forward-Looking Information
From time to time, we make forward-looking statements relating to matters such as our anticipatedÑnancial performance, business prospects, future business plans, Ñnancial condition, or other matters. Thisreport includes forward-looking statements that are not historical facts or explanations of historical data. Thewords ""believes,'' ""anticipates,'' ""expects,'' ""should'' and similar expressions generally identify forward-looking statements.
Forward-looking statements reÖect our management's expectations based on various assumptions andmanagement's estimates of trends and economic factors in the markets in which we are active, as well as ourbusiness plans. As such, forward-looking statements are subject to risks and uncertainties, and our actualresults may diÅer (possibly signiÑcantly) from those indicated in such statements. Among the factors thatmay aÅect the performance, development, or results of our business, and thereby cause actual results to diÅerfrom management's expressed expectations, are the following:
‚ signiÑcant changes in borrower preferences for Ñxed- or adjustable-rate mortgages, originator prefer-ences for selling mortgages in the secondary market, investor preferences for our securities versus otherinvestments, the availability of funding at attractive spreads in the Ñnancial markets (in particular fromcallable debt), and other factors aÅecting the overall mix of mortgage loans available for purchase, ourfunding opportunities, or our net interest margins;
‚ signiÑcant changes in housing price valuations, employment rates, or other factors aÅecting delin-quency or foreclosure levels and credit losses;
‚ signiÑcant changes in our policies or strategies, such as our underwriting requirements or our interestrate risk management, credit loss mitigation, or investment strategies;
‚ regulatory or legislative changes aÅecting us, our competitors, or the markets in which we are active,including changes in tax law or capital requirements applicable to us or our activities, or loss of certainexemptions or the Treasury's ability to purchase our obligations (see ""Item 1 Ì Business Ì Govern-ment Regulation and Charter Act'');
‚ competitive developments in the markets for mortgage purchases and for the sale of mortgage-relatedand debt securities, or signiÑcant changes in the rate of growth in conforming residential mortgagedebt;
‚ signiÑcant changes in the amount and rate of growth of our expenses, and the costs (and eÅects) oflegal or administrative proceedings (see ""Item 3 Ì Legal Proceedings'') or changes in accountingpolicies or practices;
‚ signiÑcant changes in general economic conditions or the monetary or Ñscal policy of the UnitedStates;
‚ unanticipated, substantial changes in interest rates. It is possible that sudden, severe swings in interestrates could have at least a short-term signiÑcant eÅect on our results; and
‚ political events in the United States and internationally.
We do not undertake to update any forward-looking statement in this document or that we may makefrom time to time.
22

ORGANIZATION OF INFORMATION
Management's Discussion and Analysis (""MD&A'') provides a narrative on Fannie Mae's Ñnancialperformance and condition that should be read in conjunction with the accompanying Ñnancial statements. Itincludes the following sections:
‚ 2002 Overview
‚ About Fannie Mae
‚ Results of Operations
‚ Core Business Earnings and Business Segment Results
‚ OÅ-Balance Sheet Transactions
‚ Application of Critical Accounting Policies
‚ Risk Management
‚ Liquidity and Capital Resources
‚ Performance Outlook
‚ New Accounting Standards
2002 OVERVIEW
2002 was a year of notable achievements for Fannie Mae. We produced strong Ñnancial results and madecontinued progress on our key strategic initiatives in an uncertain economic environment marked by signiÑcantinterest rate volatility and more intense competition for mortgages in the secondary market. We reported netincome of $4.619 billion and diluted earnings per share (""diluted EPS'') of $4.53 in 2002, compared with$5.894 billion and $5.72 in 2001, and $4.448 billion and $4.29 in 2000. Our reported results are based ongenerally accepted accounting principles (""GAAP''), which include the eÅects of our January 1, 2001adoption of Financial Accounting Standard No. 133 (""FAS 133''), Accounting for Derivative Instruments andHedging Activities. FAS 133 generates signiÑcant volatility in our reported net income because it requires thatwe record in our income changes in the time value portion of purchased options that we use to manage interestrate risk, but it does not allow us to record in earnings changes in the intrinsic value portion of some of thoseoptions or similar changes in the fair value of options in all of our callable debt or mortgage assets. We expectpurchased options expense to vary, often substantially, from period to period with changes in interest rates,expected interest rate volatility, and derivative activity.
The 22 percent decrease in our 2002 net income resulted primarily from a $4.508 billion increase inpurchased options expense, which occurred due to an increase in the notional amount of purchased optionsoutstanding and the declining interest rate environment. We recorded $4.545 billion in purchased optionsexpense in 2002, compared with $37 million in 2001. Excluding the impact of purchased options expense, weexperienced solid growth in our business operations. Taxable-equivalent net interest income increased29 percent over 2001 because of strong growth in our average net mortgage portfolio and actions taken during2002 and 2001 to lower our debt costs. Guaranty fee income increased 23 percent, primarily due to an increasein the volume of outstanding MBS. These increases were partially oÅset by a modest rise in credit-relatedexpenses and higher administrative expenses and losses on debt extinguishments.
Management also tracks and analyzes Fannie Mae's Ñnancial results based on a supplemental non-GAAP measure called ""core business earnings'' (previously referred to by us as ""operating net income'').While core business earnings is not a substitute for GAAP net income, we rely on core business earnings inoperating our business because we believe core business earnings provides our management and investors witha better measure of our Ñnancial results and better reÖects our risk management strategies than our GAAP netincome. We developed core business earnings in conjunction with our January 1, 2001 adoption of FAS 133 toadjust for accounting diÅerences between alternative transactions we use to hedge interest rate risk thatproduce similar economic results but require diÅerent accounting treatment under FAS 133. For example, our
23

core business earnings measure allows management and investors to evaluate the quality of earnings fromFannie Mae's principal business activities in a way that accounts for comparable hedging transactions in asimilar manner. We discuss our core business earnings results in ""MD&AÌCore Business Earnings andBusiness Segment Results.''
While the overall U.S. economy was weak during 2002, the U.S. housing market remained strong, withboth home sales and mortgage originations reaching record levels. The decline in mortgage interest ratesduring the third quarter of 2002 to the lowest levels since the 1960s sparked a reÑnance boom and fueledrecord reÑnance as well as purchase originations. Single-family mortgage originations in 2002 totaled$2.6 trillion, surpassing 2001's record of $2.0 trillion by 29 percent. Our marketÌresidential mortgage debtoutstandingÌincreased 12 percent in 2002 to $7.0 trillion as the demand for housing continued to grow,marking the Ñrst two consecutive years of double-digit residential mortgage debt outstanding (""MDO'')growth since 1988-1989.
During 2002, we made progress on several key strategic initiatives to support our mission of increasinghomeownership and aÅordable rental housing for all Americans. We align our strategies with and measure ourperformance against six long-term corporate goals.
1. Acknowledged Leadership in Increasing Access to AÅordable Housing: One of our most signiÑcantinitiatives to increase homeownership rates and serve 18 million targeted American families is our ten-year, $2 trillion American Dream Commitment. In 2002, we provided $670 billion for 5.5 million targetedfamilies to own or rent a home, bringing us almost two-thirds of the way toward achieving this ten-yeargoal in three years.
2. Leading Presence in the Secondary Market and Partner of Choice: Our goal is to be the secondarymarket partner of choice for mortgage lenders. We now have alliance agreements with 17 of the 30 largestlenders, and our business with smaller lenders has grown by over 150 percent during the past year. Weachieved a net gain in major partnership accounts during 2002. We have provided increased liquidity tomortgage markets by owning approximately 11 percent of mortgage debt outstanding and guaranteeing15 percent owned by other investors.
3. Optimal Risk Management: Our Ñnancial success depends on the ability of our two core lines of businessto eÅectively manage interest rate risk and credit risk on home mortgages. By taking an active, highlydisciplined approach in managing these risks, we have honed our risk management tools over the years toreduce our risk exposure, expand our service to American homebuyers, and deliver double-digit corebusiness earnings growth for the last 16 years through all kinds of economic scenarios.
4. Record Financial Performance: One of our key Ñnancial performance goals, announced in 1999, is a Ñve-year goal to double Fannie Mae's core business diluted earnings per share to $6.46 by the end of 2003.With an increase in core business earnings of nearly 90 percent over the last 4 years, we are on track toachieve this Ñve-year goal.
5. Corporate Culture to Enhance Strategy Execution: Developing a corporate culture that ensures a diverseand fully engaged workforce is critical in executing our key strategic initiatives and fulÑlling Fannie Mae'smission to help more families achieve the American Dream of homeownership. In 2002, Fannie Maereceived several awards in recognition of our commitment to being a world-class, diverse organization.
6. E-Commerce Company Infrastructure to Increase Capabilities and Lower Costs: Our e-commercestrategy is intended to help us grow our business, while lowering the cost of mortgages and reducing ourunderwriting risk. For example, by expanding utilization of Desktop Underwriter» (""DU''), our auto-mated underwriting system, we can help lenders streamline their processes and enhance further our creditrisk management eÅectiveness. Today, approximately 60 percent of our total single-family business isprocessed through DU. In addition, we committed signiÑcant resources in 2002 to upgrading our coretechnology infrastructure to enhance the acquisition of mortgages through multiple channels, facilitatenew products, and generate cost reductions for our customers.
24

Because of Fannie Mae's critical role in the housing Ñnance system, one of our core commitments is tomaintain the highest standard of transparency in our Ñnancial disclosures. In our on-going eÅorts to enhanceFannie Mae's transparency, we announced in 2002 our voluntary initiative to register Fannie Mae's commonstock with the Securities and Exchange Commission under Section 12(g) of the Securities Exchange Act of1934. This report is our Ñrst periodic report Ñled pursuant to our voluntary initiative.
ABOUT FANNIE MAE
Fannie Mae's purpose is to facilitate the Öow of low-cost mortgage capital to increase the availability andaÅordability of homeownership for low-, moderate-, and middle-income Americans. We operate under afederal charter, and our primary regulator is the OÇce of Federal Housing Enterprise Oversight (""OFHEO'').However, we are a private, shareholder-owned company. The U.S. government does not guarantee, directly orindirectly, Fannie Mae's debt securities or other obligations.
As the nation's largest source of funds for mortgage lenders and investors, Fannie Mae provides resourcesfor our customers to make additional mortgage loans or investments in mortgage-related securities. Weprovide liquidity to the mortgage market for the beneÑt of borrowers; however, we do not lend money directlyto consumers. We operate exclusively in the secondary mortgage market by purchasing mortgages andmortgage-related securities, including Fannie Mae MBS, from primary market institutions, such as commer-cial banks, savings and loan associations, mortgage companies, securities dealers, and other investors. Weprovide additional liquidity in the secondary market by issuing and guaranteeing mortgage-related securities.
We have two lines of business that generate revenue. These business lines also focus on managing our keybusiness risks. We measure the results of our lines of business based on core business earnings. We evaluatethe results of our business lines as though each were a stand-alone business. Hence, we allocate certain incomeand expenses to each line of business for purposes of business segment reporting. We eliminate certain inter-segment allocations in our consolidated core business earnings results (see ""MD&AÌCore Business Earningsand Business Segment Results'').
Portfolio Investment Business: The Portfolio Investment business has two principal components: amortgage portfolio and a liquid investment portfolio (""LIP''). The mortgage portfolio purchases mortgageloans, mortgage-related securities, and other investments from lenders, securities dealers, investors, and othermarket participants. The LIP serves as an alternative source of funds to meet our cash Öow needs by investingin high quality, short-term investments that provide an ongoing supply of funds. We can use these funds asnecessary for liquidity purposes or to reinvest in readily marketable, high credit quality securities that can besold to raise cash. We fund the purchase of the assets in our Portfolio Investment business from our equitycapital and by issuing debt in the global capital markets. The Portfolio Investment business generates proÑtsby ensuring that the interest income from the mortgages, MBS, mortgage-related securities, and liquidinvestments we purchase is greater than our borrowing costs. A primary measure of proÑtability for thePortfolio Investment business is our ""net interest margin''. Our net interest margin reÖects the diÅerencebetween taxable-equivalent income on our mortgage assets and non-mortgage investments and our borrowingexpense divided by average interest earning assets.
Our Portfolio Investment business focuses on managing Fannie Mae's interest rate risk. Interest rate riskis the risk that changes in interest rates could change cash Öows on our mortgage assets and debt in a way thatadversely aÅects Fannie Mae's earnings or long-term value.
Credit Guaranty Business: Our Credit Guaranty business has primary responsibility for managing all ofour mortgage credit risk. Credit risk is the risk of loss to future earnings and future cash Öows that may resultfrom the failure of a borrower or counterparty to fulÑll its contractual obligation to Fannie Mae. The CreditGuaranty business primarily generates income from guaranty fees for guaranteeing the timely payment ofscheduled principal and interest on mortgage-related securities we guarantee that are not owned by thePortfolio Investment business. The primary source of income for the Credit Guaranty business is the
25

diÅerence between the guaranty fees earned and the costs of providing this service. Income is also allocated tothe Credit Guaranty business for the following activities:
‚ Managing the credit risk on mortgage-related assets held by the Portfolio Investment business. ThePortfolio Investment business compensates the Credit Guaranty business through a guaranty feecomparable to an MBS guaranty fee. These fees are recognized as guaranty fee income by the CreditGuaranty business. Similarly, all credit expenses, including credit losses on loans and on MBS andother mortgage-related securities held in Fannie Mae's mortgage portfolio, are allocated to the CreditGuaranty business for business segment reporting purposes. Net interest income for the CreditGuaranty business is net of charges paid to the Portfolio Investment business for forgone interest ondelinquent loans.
‚ Providing capital to the Portfolio Investment business. The Portfolio Investment business alsocompensates the Credit Guaranty business for the temporary use of capital generated by the CreditGuaranty business, which the Portfolio Investment business uses to fund investments. This compensa-tion is classiÑed as net interest income.
‚ Temporarily investing principal and interest payments on loans underlying MBS and other mortgage-related securities prior to remittance to investors. Interest income on the temporary investment ofthese funds is allocated to the Credit Guaranty business.
Our Credit Guaranty business manages Fannie Mae's mortgage credit risk by managing the proÑle andquality of mortgages in the mortgage credit book of business, using credit enhancements to reduce our losses,assessing the sensitivity of credit losses to changes in economic conditions, and aggressively managing problemassets to mitigate losses.
Revenue growth in our business lines is driven fundamentally by growth in residential mortgage debtoutstanding. This market has usually been one of the strongest growth markets in the U.S. economy, typicallygrowing faster than the gross domestic product (""GDP''). During the 1990s, mortgage debt outstanding grew7 percent annually. Since 2000, MDO has grown at an average annual rate of 11.3 percent. Our economicprojections indicate an average annual growth rate of 8 to 10 percent during the current decade due to fourfundamental demographic and economic drivers: (1) projected growth in immigration, population, andhousehold formation; (2) increased rates of homeownership particularly by minorities, whose homeownershiprates lag the average by 20 percentage points; (3) continued growth in property values as the average homegrows larger, demand remains strong, and supply remains constrained because of land shortages and growthrestrictions; and (4) projected growth in debt-to-value ratios as consumers increasingly use the equity in theirhomes as a Ñnancial investment option. In addition, our business has typically grown faster than our marketbecause of our eÇciency, innovation, and low costs, which have helped make Fannie Mae a preferred sourceof liquidity for Ñxed-rate mortgages.
The expenses related to our lines of business stem largely from costs incurred to manage our two primarybusiness risksÌinterest rate risk and credit risk. We have highly skilled teams of experienced riskmanagement professionals who take an active, highly disciplined approach in managing these risks to meet ourobjective of delivering consistent earnings growth and target returns on capital in a wide range of economicenvironments. They have been successful in dispersing Fannie Mae's risk and loss exposure over the yearswithin the global Ñnancial system by developing various mortgage risk management tools that increase ourlevel of expertise and eÇciency in managing mortgage prepayment and credit risk.
RESULTS OF OPERATIONS
The following discussion of our results of operations is based on Fannie Mae's reported results. We havereclassiÑed certain amounts in our prior years' reported results to conform to our current presentation. Weprovide a separate discussion of our core business earnings and business segment results in ""MD&AÌCoreBusiness Earnings and Business Segment Results.''
26

Net Interest Income
Reported net interest income is the diÅerence between interest income and interest expense. Net interestincome represents a principal source of earnings for Fannie Mae and is aÅected by net volume, asset yield, andthe cost of debt and certain derivatives. Reported net interest income subsequent to our adoption of FAS 133only includes a portion of the cost associated with using purchased options to hedge the borrowers' prepaymentoption in mortgages. Prior to the adoption of FAS 133, we amortized purchased options premiums on astraight-line basis and reÖected the cost in our net interest income as a component of our interest expense.With the adoption of FAS 133, we now report the change in the fair value of the time value of purchasedoptions in a separate income statement category ""purchased options expense.'' We also present net interestincome and the related net interest yield on a taxable-equivalent basis to consistently reÖect income fromtaxable and tax-exempt investments based on a 35 percent marginal tax rate.
Table 1 presents Fannie Mae's net interest yield based on our reported net interest income adjusted fortax-exempt investments and average balances of mortgage assets, nonmortgage investments, and debt. The netinterest yield calculation subsequent to our adoption of FAS 133 does not fully reÖect the cost of ourpurchased options (see ""MD&AÌCore Business Earnings and Business Segment ResultsÌCore Net InterestIncome'' for a discussion of our supplemental non-GAAP measures, core net interest income and net interestmargin).
Table 1: Taxable-Equivalent Net Interest Income and Average Balances2002 2001 2000
(Dollars in millions)
Interest income:Mortgage portfolio ÏÏÏÏÏÏÏÏÏÏÏÏÏÏÏÏÏÏÏÏÏÏÏÏÏÏÏÏÏÏÏÏÏÏÏÏÏÏÏÏÏÏÏÏÏÏÏÏÏÏÏÏÏÏÏÏÏÏÏÏÏÏÏÏÏ $ 49,265 $ 46,478 $ 39,403Nonmortgage investments and cash equivalents ÏÏÏÏÏÏÏÏÏÏÏÏÏÏÏÏÏÏÏÏÏÏÏÏÏÏÏÏÏÏÏÏÏÏÏÏÏÏÏÏÏ 1,588 2,692 3,378
Total interest income ÏÏÏÏÏÏÏÏÏÏÏÏÏÏÏÏÏÏÏÏÏÏÏÏÏÏÏÏÏÏÏÏÏÏÏÏÏÏÏÏÏÏÏÏÏÏÏÏÏÏÏÏÏÏÏÏÏÏÏÏÏÏÏ 50,853 49,170 42,781
Interest expense(1):Short-term debt ÏÏÏÏÏÏÏÏÏÏÏÏÏÏÏÏÏÏÏÏÏÏÏÏÏÏÏÏÏÏÏÏÏÏÏÏÏÏÏÏÏÏÏÏÏÏÏÏÏÏÏÏÏÏÏÏÏÏÏÏÏÏÏÏÏÏÏ 2,978 5,897 4,204Long-term debtÏÏÏÏÏÏÏÏÏÏÏÏÏÏÏÏÏÏÏÏÏÏÏÏÏÏÏÏÏÏÏÏÏÏÏÏÏÏÏÏÏÏÏÏÏÏÏÏÏÏÏÏÏÏÏÏÏÏÏÏÏÏÏÏÏÏÏÏ 37,309 35,183 32,903
Total interest expenseÏÏÏÏÏÏÏÏÏÏÏÏÏÏÏÏÏÏÏÏÏÏÏÏÏÏÏÏÏÏÏÏÏÏÏÏÏÏÏÏÏÏÏÏÏÏÏÏÏÏÏÏÏÏÏÏÏÏÏÏÏÏÏ 40,287 41,080 37,107
Net interest income ÏÏÏÏÏÏÏÏÏÏÏÏÏÏÏÏÏÏÏÏÏÏÏÏÏÏÏÏÏÏÏÏÏÏÏÏÏÏÏÏÏÏÏÏÏÏÏÏÏÏÏÏÏÏÏÏÏÏÏÏÏÏÏÏÏÏ 10,566 8,090 5,674Taxable-equivalent adjustment on tax-exempt investments(2) ÏÏÏÏÏÏÏÏÏÏÏÏÏÏÏÏÏÏÏÏÏÏÏÏÏÏÏÏÏÏ 502 470 414
Taxable-equivalent net interest income ÏÏÏÏÏÏÏÏÏÏÏÏÏÏÏÏÏÏÏÏÏÏÏÏÏÏÏÏÏÏÏÏÏÏÏÏÏÏÏÏÏÏÏÏÏÏÏÏÏÏ $ 11,068 $ 8,560 $ 6,088
Average balances(3):Interest-earning assets(4):
Mortgage portfolio, net ÏÏÏÏÏÏÏÏÏÏÏÏÏÏÏÏÏÏÏÏÏÏÏÏÏÏÏÏÏÏÏÏÏÏÏÏÏÏÏÏÏÏÏÏÏÏÏÏÏÏÏÏÏÏÏÏÏÏÏÏÏ $735,943 $658,195 $553,531Nonmortgage investments and cash equivalents ÏÏÏÏÏÏÏÏÏÏÏÏÏÏÏÏÏÏÏÏÏÏÏÏÏÏÏÏÏÏÏÏÏÏÏÏÏÏÏÏÏ 68,658 58,811 51,490
Total interest-earning assets ÏÏÏÏÏÏÏÏÏÏÏÏÏÏÏÏÏÏÏÏÏÏÏÏÏÏÏÏÏÏÏÏÏÏÏÏÏÏÏÏÏÏÏÏÏÏÏÏÏÏÏÏÏÏÏÏÏÏÏ 804,601 717,006 605,021Interest-free funds(5) ÏÏÏÏÏÏÏÏÏÏÏÏÏÏÏÏÏÏÏÏÏÏÏÏÏÏÏÏÏÏÏÏÏÏÏÏÏÏÏÏÏÏÏÏÏÏÏÏÏÏÏÏÏÏÏÏÏÏÏÏÏ (23,992) (23,630) (20,595)
Total interest-earning assets funded by debt ÏÏÏÏÏÏÏÏÏÏÏÏÏÏÏÏÏÏÏÏÏÏÏÏÏÏÏÏÏÏÏÏÏÏÏÏÏÏÏÏÏÏÏÏÏÏ $780,609 $693,376 $584,426
Interest-bearing liabilities(1):Short-term debt ÏÏÏÏÏÏÏÏÏÏÏÏÏÏÏÏÏÏÏÏÏÏÏÏÏÏÏÏÏÏÏÏÏÏÏÏÏÏÏÏÏÏÏÏÏÏÏÏÏÏÏÏÏÏÏÏÏÏÏÏÏÏÏÏÏÏÏ $141,727 $137,078 $ 73,351Long-term debtÏÏÏÏÏÏÏÏÏÏÏÏÏÏÏÏÏÏÏÏÏÏÏÏÏÏÏÏÏÏÏÏÏÏÏÏÏÏÏÏÏÏÏÏÏÏÏÏÏÏÏÏÏÏÏÏÏÏÏÏÏÏÏÏÏÏÏÏ 638,882 556,298 511,075
Total interest-bearing liabilitiesÏÏÏÏÏÏÏÏÏÏÏÏÏÏÏÏÏÏÏÏÏÏÏÏÏÏÏÏÏÏÏÏÏÏÏÏÏÏÏÏÏÏÏÏÏÏÏÏÏÏÏÏÏÏÏÏÏ $780,609 $693,376 $584,426
Average interest rates(2, 3):Interest-earning assets:
Mortgage portfolio, net ÏÏÏÏÏÏÏÏÏÏÏÏÏÏÏÏÏÏÏÏÏÏÏÏÏÏÏÏÏÏÏÏÏÏÏÏÏÏÏÏÏÏÏÏÏÏÏÏÏÏÏÏÏÏÏÏÏÏÏÏÏ 6.73% 7.11% 7.16%Nonmortgage investments and cash equivalents ÏÏÏÏÏÏÏÏÏÏÏÏÏÏÏÏÏÏÏÏÏÏÏÏÏÏÏÏÏÏÏÏÏÏÏÏÏÏÏÏÏ 2.34 4.63 6.60
Total interest-earning assets ÏÏÏÏÏÏÏÏÏÏÏÏÏÏÏÏÏÏÏÏÏÏÏÏÏÏÏÏÏÏÏÏÏÏÏÏÏÏÏÏÏÏÏÏÏÏÏÏÏÏÏÏÏÏÏÏÏ 6.35 6.90 7.11Interest-free return(5) ÏÏÏÏÏÏÏÏÏÏÏÏÏÏÏÏÏÏÏÏÏÏÏÏÏÏÏÏÏÏÏÏÏÏÏÏÏÏÏÏÏÏÏÏÏÏÏÏÏÏÏÏÏÏÏÏÏÏÏÏÏÏÏ .18 .21 .25
Total interest-earning assets funded by debt ÏÏÏÏÏÏÏÏÏÏÏÏÏÏÏÏÏÏÏÏÏÏÏÏÏÏÏÏÏÏÏÏÏÏÏÏÏÏÏÏÏÏÏÏÏÏ 6.53 7.11 7.36
Interest-bearing liabilities(1):Short-term debt ÏÏÏÏÏÏÏÏÏÏÏÏÏÏÏÏÏÏÏÏÏÏÏÏÏÏÏÏÏÏÏÏÏÏÏÏÏÏÏÏÏÏÏÏÏÏÏÏÏÏÏÏÏÏÏÏÏÏÏÏÏÏÏÏÏÏÏ 1.90 4.16 5.70Long-term debtÏÏÏÏÏÏÏÏÏÏÏÏÏÏÏÏÏÏÏÏÏÏÏÏÏÏÏÏÏÏÏÏÏÏÏÏÏÏÏÏÏÏÏÏÏÏÏÏÏÏÏÏÏÏÏÏÏÏÏÏÏÏÏÏÏÏÏÏ 5.88 6.35 6.44
Total interest-bearing liabilitiesÏÏÏÏÏÏÏÏÏÏÏÏÏÏÏÏÏÏÏÏÏÏÏÏÏÏÏÏÏÏÏÏÏÏÏÏÏÏÏÏÏÏÏÏÏÏÏÏÏÏÏÏÏÏÏ 5.15 5.92 6.35
Net interest yield ÏÏÏÏÏÏÏÏÏÏÏÏÏÏÏÏÏÏÏÏÏÏÏÏÏÏÏÏÏÏÏÏÏÏÏÏÏÏÏÏÏÏÏÏÏÏÏÏÏÏÏÏÏÏÏÏÏÏÏÏÏÏÏÏÏÏÏÏ 1.38% 1.19% 1.01%
(1) ClassiÑcation of interest expense and interest-bearing liabilities as short-term or long-term is based on eÅective maturity or repricing date,taking into consideration the eÅect of derivative Ñnancial instruments.
(2) ReÖects non-GAAP adjustments to permit comparison of yields on tax-exempt and taxable assets based on 35 percent marginal tax rate.(3) Averages have been calculated on a monthly basis based on amortized cost.(4) Includes average balance of nonaccrual loans of $4.6 billion in 2002, $2.6 billion in 2001, and $2.1 billion in 2000.(5) Interest-free funds represent the portion of our investment portfolio funded by equity and non-interest bearing liabilities.
27

Taxable-equivalent net interest income totaled $11.068 billion in 2002, compared with $8.560 billion in2001 and $6.088 billion in 2000. The increase of $2.508 billion, or 29 percent, in taxable-equivalent net interestincome was due primarily to 12 percent growth in our average net mortgage portfolio and a higher net interestyield, which was favorably aÅected by the low interest rate environment and unusually steep yield curve. Asmortgage interest rates fell to the lowest level in 40 years and Ñxed-rate mortgage originations reached recordlevels, we took advantage of opportunities to grow our mortgage portfolio at attractive spreads relative to ourdebt costs. Our net interest yield continued to beneÑt and remained elevated during 2002 because of actionswe took during 2002 and 2001 to lower our debt costs by calling or retiring higher-cost debt and temporarilyreplacing it with shorter-term, lower-cost debt.
During 2001, taxable-equivalent net interest income increased $2.472 billion or 41 percent over 2000,partially due to the eÅect of the change in accounting for our purchased options under FAS 133. Our taxable-equivalent net interest income in 2001 does not include all of the cost of purchased options. However, ourtaxable-equivalent net interest income in 2000 includes $231 million of expense related to the amortization ofpurchased options premiums on a straight-line basis. Prior to the adoption of FAS 133, we recorded purchasedoptions premiums as interest expense in our reported net interest income. FAS 133 changed our accounting forpurchased options, requiring that we report changes in the fair value of the time value of purchased optionsinstead of expensing purchased options premiums on a straight-line basis. We report changes in the fair valueof the time value of our purchased options in a separate income statement category ""purchased optionsexpense.'' Our taxable-equivalent net interest income in 2001 also beneÑted from 19 percent growth in ouraverage net mortgage portfolio and a signiÑcant decrease in our debt costs that elevated our net interest yield.A reduction in intermediate-term rates during 2001 boosted mortgage reÑnancings and originations, fueling anincrease in the supply of mortgage assets in the secondary market and attractive mortgage-to-debt spreads.
Table 2 shows the changes in our reported and taxable-equivalent net interest income between 2002 and2001 and 2001 and 2000 attributable to changes in rates and volume on our mortgage assets, nonmortgageinvestments, and debt.
Table 2: Rate/Volume Analysis of Reported Net Interest Income
Attributable toChanges in(1)
Increase(Decrease) Volume Rate
(Dollars in millions)
2002 vs. 2001
Interest income:Mortgage portfolio ÏÏÏÏÏÏÏÏÏÏÏÏÏÏÏÏÏÏÏÏÏÏÏÏÏÏÏÏÏÏÏÏÏÏÏÏÏÏÏÏÏÏÏÏÏÏÏÏÏÏÏÏÏÏ $ 2,787 $5,292 $(2,505)Nonmortgage investments and cash equivalents ÏÏÏÏÏÏÏÏÏÏÏÏÏÏÏÏÏÏÏÏÏÏÏÏÏÏÏÏÏÏ (1,104) 394 (1,498)
Total interest income ÏÏÏÏÏÏÏÏÏÏÏÏÏÏÏÏÏÏÏÏÏÏÏÏÏÏÏÏÏÏÏÏÏÏÏÏÏÏÏÏÏÏÏÏÏÏÏÏÏÏÏÏ 1,683 5,686 (4,003)
Interest expense:(2)
Short-term debt ÏÏÏÏÏÏÏÏÏÏÏÏÏÏÏÏÏÏÏÏÏÏÏÏÏÏÏÏÏÏÏÏÏÏÏÏÏÏÏÏÏÏÏÏÏÏÏÏÏÏÏÏÏÏÏÏ (2,919) 194 (3,113)Long-term debtÏÏÏÏÏÏÏÏÏÏÏÏÏÏÏÏÏÏÏÏÏÏÏÏÏÏÏÏÏÏÏÏÏÏÏÏÏÏÏÏÏÏÏÏÏÏÏÏÏÏÏÏÏÏÏÏÏ 2,126 4,959 (2,833)
Total interest expense ÏÏÏÏÏÏÏÏÏÏÏÏÏÏÏÏÏÏÏÏÏÏÏÏÏÏÏÏÏÏÏÏÏÏÏÏÏÏÏÏÏÏÏÏÏÏÏÏÏÏÏ (793) 5,153 (5,946)
Change in net interest income ÏÏÏÏÏÏÏÏÏÏÏÏÏÏÏÏÏÏÏÏÏÏÏÏÏÏÏÏÏÏÏÏÏÏÏÏÏÏÏÏÏÏÏÏÏÏ $ 2,476 $ 533 $ 1,943
Change in taxable-equivalent adjustment on tax-exempt investments(3) ÏÏÏÏÏÏÏÏÏÏÏÏ 32
Change in taxable-equivalent net interest income ÏÏÏÏÏÏÏÏÏÏÏÏÏÏÏÏÏÏÏÏÏÏÏÏÏÏÏÏÏÏ $ 2,508
28

Attributable toChanges in(1)
Increase(Decrease) Volume Rate
(Dollars in millions)
2001 vs. 2000
Interest income:Mortgage portfolio ÏÏÏÏÏÏÏÏÏÏÏÏÏÏÏÏÏÏÏÏÏÏÏÏÏÏÏÏÏÏÏÏÏÏÏÏÏÏÏÏÏÏÏÏÏÏÏÏÏÏÏÏÏÏ $ 7,075 $7,393 $ (318)Nonmortgage investments and cash equivalents ÏÏÏÏÏÏÏÏÏÏÏÏÏÏÏÏÏÏÏÏÏÏÏÏÏÏÏÏÏÏ (686) 434 (1,120)
Total interest income ÏÏÏÏÏÏÏÏÏÏÏÏÏÏÏÏÏÏÏÏÏÏÏÏÏÏÏÏÏÏÏÏÏÏÏÏÏÏÏÏÏÏÏÏÏÏÏÏÏÏÏÏ 6,389 7,827 (1,438)
Interest expense:(2)
Short-term debt ÏÏÏÏÏÏÏÏÏÏÏÏÏÏÏÏÏÏÏÏÏÏÏÏÏÏÏÏÏÏÏÏÏÏÏÏÏÏÏÏÏÏÏÏÏÏÏÏÏÏÏÏÏÏÏÏ 1,693 2,945 (1,252)Long-term debtÏÏÏÏÏÏÏÏÏÏÏÏÏÏÏÏÏÏÏÏÏÏÏÏÏÏÏÏÏÏÏÏÏÏÏÏÏÏÏÏÏÏÏÏÏÏÏÏÏÏÏÏÏÏÏÏÏ 2,280 2,868 (588)
Total interest expense ÏÏÏÏÏÏÏÏÏÏÏÏÏÏÏÏÏÏÏÏÏÏÏÏÏÏÏÏÏÏÏÏÏÏÏÏÏÏÏÏÏÏÏÏÏÏÏÏÏÏÏ 3,973 5,813 (1,840)
Change in net interest income ÏÏÏÏÏÏÏÏÏÏÏÏÏÏÏÏÏÏÏÏÏÏÏÏÏÏÏÏÏÏÏÏÏÏÏÏÏÏÏÏÏÏÏÏÏÏ $ 2,416 $2,014 $ 402
Change in taxable-equivalent adjustment on tax-exempt investments(3) ÏÏÏÏÏÏÏÏÏÏÏÏ 56
Change in taxable-equivalent net interest income ÏÏÏÏÏÏÏÏÏÏÏÏÏÏÏÏÏÏÏÏÏÏÏÏÏÏÏÏÏÏ $ 2,472
(1) Combined rate/volume variances, a third element of the calculation, are allocated to the rate and volume variancesbased on their relative size.
(2) ClassiÑcation of interest expense and interest-bearing liabilities as short-term or long-term is based on eÅectivematurity or repricing date, taking into consideration the eÅect of derivative Ñnancial instruments.
(3) ReÖects non-GAAP adjustments to permit comparison of yields on tax-exempt and taxable assets based on a35 percent marginal tax rate.
Guaranty Fee Income
Guaranty fee income reported in our total corporate results and our average guaranty fee rate primarilyinclude guaranty fees we receive on mortgage-related securities we issue that are held by other investors. Weclassify guaranty fees on Fannie Mae mortgage-related securities held in our portfolio as net interest income.The guaranty fee income allocated for line of business reporting purposes to the Credit Guaranty business onmortgage-related securities held in our portfolio is eliminated by an equal and oÅsetting allocation of guarantyexpense to the Portfolio Investment business. We exclude the administrative costs of managing outstandingMBS and other mortgage-related securities from guaranty fee income.
Guaranty fee income increased 23 percent or $334 million in 2002 to $1.816 billion and 10 percent in2001 to $1.482 billion. The increases were driven primarily by a 22 percent increase in average outstandingMBS (MBS and other mortgage-related securities guaranteed by Fannie Mae and held by investors otherthan Fannie Mae) during 2002 and a 12 percent increase during 2001.
Our average guaranty fee rate on outstanding MBS during 2002 increased slightly to 19.1 basis pointsfrom 19.0 basis points in 2001. During the last half of 2002, our average eÅective guaranty fee rate rose as aresult of higher fee rates on new business and the faster amortization of deferred fees as we adjusted ourprepayment amortization rates to reÖect the acceleration of mortgage prepayments in the heavy reÑnanceenvironment. Our average eÅective guaranty fee rate declined by .5 basis points between 2000 and 2001,primarily due to increased competition and general market conditions. Recently, rates on new credit guarantyproducts have been higher because of our eÅorts to better align our pricing with the relative underlying risks ofloans we guarantee and expansion into market segments that demand higher guaranty fees. As a result of thesetrends, we anticipate a modest increase in our average eÅective guaranty fee rates in the future. Table 3presents our average eÅective guaranty fee rate for the past three years.
29

Table 3: Guaranty Fee Data
Year Ended December 31,
2002 2001 2000
(Dollars in millions)
Guaranty fee incomeÏÏÏÏÏÏÏÏÏÏÏÏÏÏÏÏÏÏÏÏÏÏÏÏÏÏÏÏÏÏÏÏÏÏÏÏÏÏÏÏÏÏÏÏÏÏÏÏÏÏÏÏÏ $ 1,816 $ 1,482 $ 1,351
Average balance of outstanding MBS(1)ÏÏÏÏÏÏÏÏÏÏÏÏÏÏÏÏÏÏÏÏÏÏÏÏÏÏÏÏÏÏÏÏÏÏÏÏÏ 950,232 779,647 694,165
Average eÅective guaranty fee rate (basis points) ÏÏÏÏÏÏÏÏÏÏÏÏÏÏÏÏÏÏÏÏÏÏÏÏÏÏÏÏ 19.1 19.0 19.5
(1) ""Outstanding MBS'' refers to MBS and other mortgage-related securities guaranteed by Fannie Mae and held byinvestors other than Fannie Mae. If an MBS has been resecuritized into another MBS, we only include the principalamount once in the outstanding balance.
Fee and Other Income (Expense), Net
Fee and other income (expense) consists of transaction fees, technology fees, multifamily fees, and othermiscellaneous items and is net of costs associated with the purchase of additional mortgage insurance toprotect against credit losses (""credit enhancement expense'') and operating losses from certain tax-advantagedinvestments in aÅordable housing projects. These tax-advantaged investments represent equity interests inlimited partnerships that own rental housing and generate tax credits, which reduce Fannie Mae's eÅectivefederal income tax rate. We account for the majority of these investments using the equity method. We do notguarantee any obligations of these partnerships, and our exposure is limited to the amount of our investments.We record the tax beneÑt related to these investments as a reduction in the provision for federal income taxesand as an increase in taxable-equivalent revenues.
We recorded $232 million of fee and other income in 2002, up from $151 million of income in 2001. The$81 million increase in fee and other income was driven by a $114 million increase in transaction andtechnology fees resulting primarily from increased REMIC transaction volumes and a $69 million increase innet gains from the sale of securities. These increases were oÅset partially by a $78 million increase in creditenhancement expenses and a $61 million increase in impairment write-downs on a variety of investments. Theincrease in credit enhancement expenses was attributable to an increase in the volume of business covered bycredit enhancements purchased directly by Fannie Mae, stemming from our expansion into new products andmarkets.
Fee and other income totaled $151 million for 2001, up $195 million over expense of $44 million recordedin 2000 primarily because of a $146 million increase in technology and transaction fees. The increase intechnology and transaction fees resulted largely from greater use of Fannie Mae's Desktop Underwriter andDesktop Originator systems and higher structured transaction fees, such as REMIC fees, attributable torecord mortgage business volumes. A hedging loss on an anticipated Benchmark Notes» issuance thatoccurred in April 2000 also contributed to the year-over-year increase in fee and other income in 2001.
Credit-Related Expenses
Credit-related expenses include foreclosed property expenses (income) and the provision for losses. In2002, we reclassiÑed recoveries in excess of charged-oÅ amounts on foreclosed properties from ""charge-oÅrecoveries'' to ""foreclosed property expense (income).'' In addition, with the rescission of the AmericanInstitute of CertiÑed Public Accountants (""AICPA'') Statement of Position 92-3, ""Accounting for ForeclosedAssets'' (""SOP 92-3'') in the fourth quarter of 2002, we now include estimated selling costs in thedetermination of our initial charge-oÅ when we foreclose on a loan. We adjusted our provision for losses toreÖect a charge equal to the net change in charge-oÅs. We have also retroactively reclassiÑed any excessrecoveries in previous periods for comparability purposes.
Credit-related expenses increased $14 million over 2001 to $92 million, primarily due to an increase inmultifamily credit-related losses stemming from two properties. We recorded a provision for losses of$128 million in 2002, an increase of $34 million over 2001. The increase in our provision was partially oÅset by$20 million in additional foreclosed property income primarily due to gains on foreclosed property dispositions.Foreclosed property income totaled $36 million in 2002, compared with $16 million in 2001. The 2002
30

increase in credit-related expenses follows a $16 million decline in 2001 that was largely due to a reduction inour provision for losses. Our provision for losses decreased $28 million in 2001 to $94 million. We also hadforgone interest on non-performing assets that reduced our net interest income by $148 million in 2002,$70 million in 2001, and $43 million in 2000. Although foreclosed single-family property acquisitionsincreased in 2002 to 19,500 from 14,486 in 2001 and 14,351 in 2000, average severities declined due to stronghome prices and credit enhancement proceeds.
We previously recorded gains from the sale of foreclosed properties and related mortgage insuranceclaims against our allowance for losses as a recovery of charge-oÅs. During 2002, we reclassiÑed these gains toforeclosed property expense (income). Additionally, the AICPA rescinded SOP 92-3 during the fourthquarter of 2002. Under SOP 92-3, we recorded selling costs related to the disposition of foreclosed propertiesin our income statement under foreclosed property expense (income). We now include selling costs in ourinitial charge-oÅ estimate. All prior periods have been reclassiÑed to conform to the current year presentation.The reclassiÑed amounts result in equal and oÅsetting changes to our provision for losses and foreclosedproperty expense (income) line items within our previously reported income statements. These reclassiÑca-tions have no impact on previously reported net income, total credit-related expenses, total credit-relatedlosses, or the combined balance of the allowance for loan losses and guaranty liability.
Despite signiÑcant growth in our book of business and overall weaker economic conditions during 2002and 2001, credit losses as a percentage of Fannie Mae's average book of business have steadily declined to .5basis points in 2002, from .6 basis points in 2001, and .7 basis points in 2000. Our book of business includesmortgages and MBS in our mortgage portfolio and outstanding MBS held by other investors. Credit lossesinclude charge-oÅs (net of recoveries) and foreclosed property income. The strong appreciation in homeprices during 2002 and 2001 helped in strengthening the credit risk proÑle of our book of business. In addition,we have been able to eÅectively manage credit risk by using credit enhancements to minimize our credit lossesduring the economic slowdown, monitoring and assessing the sensitivity of our credit risk to changes in theeconomic environment, and taking an aggressive approach to problem asset management.
Administrative Expenses
Administrative expenses include those costs incurred to run our daily operations, such as personnel costsand technology expenses.
Administrative expenses increased 20 percent to $1.219 billion in 2002. The above average growth inadministrative expenses was due primarily to costs incurred on a multi-year project initiated in 2001 to re-engineer our core infrastructure systems and expenses associated with relocating our primary data center. Inaddition, compensation expense increased 13 percent to $683 million in 2002, resulting primarily from a5 percent increase in the number of employees and annual salary increases.
Administrative expenses grew 12 percent to $1.017 billion in 2001 from $905 million in 2000, primarilydue to increased compensation expense related to 8 percent growth in the number of employees and annualsalary increases, increased costs related to the multi-year core infrastructure project, and a contribution of$10 million in 2001 to support victims and families of victims aÅected by the September 11 tragedy.
We evaluate growth in administrative expenses based on growth in taxable-equivalent revenues and ouraverage book of business. Taxable-equivalent revenues is a supplemental non-GAAP measure discussedfurther in ""MD&A Ì Core Business Earnings and Business Segment Results.'' While administrativeexpenses have grown in the past two years, the ratio of administrative expenses to taxable-equivalent revenues,which we refer to as our eÇciency ratio, has increased only modestly to 10.2 percent from 10.0 percent in2001. Our eÇciency ratio for 2002 and 2001 remained fairly steady and improved over the 11.6 percent level of2000 primarily due to strong growth in net interest income during both years. The ratio of administrativeexpenses to our average book of business has also remained relatively stable at .072 percent in 2002, comparedwith .071 percent in 2001, and .072 percent in 2000.
31

Special Contribution
Special contribution expense reÖects a contribution we made to the Fannie Mae Foundation.
We committed during the fourth quarter of 2001 to contribute $300 million of our common stock to theFannie Mae Foundation. The Fannie Mae Foundation creates aÅordable homeownership and housingopportunities through innovative partnerships and initiatives that build healthy, vibrant communities acrossthe United States. It is a separate, private, nonproÑt organization that we do not consolidate, but is supportedsolely by Fannie Mae. We expect the 2001 contribution to the Fannie Mae Foundation to reduce theFoundation's need for contributions over the next several years. We acquired the shares through open marketpurchases and contributed them to the Foundation in the Ñrst quarter of 2002.
Purchased Options Expense
Purchased options expense includes the change in the fair value of the time value of purchased options inaccordance with FAS 133. The change in the fair value of the time value of purchased options will vary fromperiod to period with changes in interest rates, market pricing of options, and our derivative activity.
Our reported income results for 2002 were unfavorably aÅected by $4.545 billion in purchased optionsexpense related to changes in the time value of purchased options, signiÑcantly more than the $37 millionexpense recorded in 2001. The substantial increase in expense during 2002 was caused by an increase in theaverage notional balance of caps and swaptions, two types of purchased options we commonly use to manageinterest rate risk, to $287 billion in 2002 from $154 billion in 2001, coupled with a sharp decline in interestrates that resulted in a decrease in time value. Under FAS 133, we are not allowed to recognize in earningschanges in the intrinsic value of some of these options, which, in combination with the fair value of options inour mortgage assets and callable debt, would have more than oÅset the decrease in the time value of theseoptions during 2002. Prior to the adoption of FAS 133 on January 1, 2001, we amortized premiums onpurchased options into interest expense on a straight-line basis. In 2000, we recorded $231 million inpurchased options amortization expense that is included as a component of net interest income.
During the fourth quarter of 2002, we reÑned our methodology for estimating the initial time value ofinterest rate caps at the date of purchase and prospectively adopted a preferred method that resulted in a$282 million pre-tax reduction in purchased options expense and increased our diluted EPS for 2002 by $.18.Under our previous valuation method, we treated the entire premium paid on purchased ""at-the-money'' capsas time value with no allocation to intrinsic value. Our new methodology allocates the initial purchase price toreÖect the value of individual caplets, some of which are above the strike rate of the cap, which results in ahigher intrinsic value and corresponding lower time value at the date of purchase. This approach is moreconsistent with our estimation of time value subsequent to the initial purchase date. This change does notaÅect the total expense that will be recorded in our income statement over the life of our caps and has noeÅect on our non-GAAP core business earnings measure.
Debt Extinguishments
Fannie Mae strategically repurchases or calls debt securities and related interest rate swaps on a regularbasis as part of our interest rate risk management eÅorts and to reduce future debt costs. We record gains andlosses on debt extinguishments in this category.
We recognized a pre-tax loss of $710 million in 2002 from the call and repurchase of debt, compared witha pre-tax loss of $524 million in 2001. Market conditions during 2002 and 2001 made it advantageous for us torepurchase $8 billion and $9 billion, respectively, of debt securities that were trading at historically widespreads to other Ñxed-income securities. We also called over $174 billion of high-coupon debt securities andnotional principal of interest rate swaps in 2002 and $173 billion in 2001. The weighted-average cost ofredeemed debt and interest rate swaps in 2002 and 2001 was 5.36 percent and 6.23 percent, respectively.During 2000, we repurchased or called $18 billion in debt securities and notional principal of interest rateswaps carrying a weighted-average cost of 7.10 percent and recognized a gain of $49 million.
During the second quarter of 2002, we adopted Financial Accounting Standard No. 145, Rescission ofFASB Statements No. 4, 44, and 64, Amendment of FASB Statement No. 13, and Technical Corrections(""FAS 145''). This standard eliminates the extraordinary treatment of the gains and losses on our debt
32

repurchases because debt extinguishment is a normal and recurring component of our interest rate riskmanagement strategy. For comparative purposes, we have reclassiÑed all prior periods to conform to thecurrent presentation.
Income Taxes
The provision for federal income taxes, including tax related to the cumulative eÅect of change inaccounting principle, decreased to $1.429 billion in 2002 from $2.131 billion in 2001. The 2002 decrease in taxexpense was primarily related to the tax beneÑt recorded on the increased purchased options expense. Our taxprovision totaled $1.583 billion in 2000. The combined eÅect of our low income housing tax credits and thereduction in our 2002 pre-tax income from purchased options expense caused our eÅective tax rate on reportednet income to decline to 24 percent from 27 percent in 2001 and 26 percent in 2000. Our eÅective tax ratebased on our core business earnings, which is adjusted for the impact of FAS 133 on our purchased options,was 27 percent in 2002 and 26 percent in 2001 and 2000. See ""MD&AÌCore Business Earnings and BusinessSegment Results.''
Cumulative EÅect of Change in Accounting Principle
EÅective January 1, 2001, we adopted FAS 133, as amended by Financial Accounting Standard No. 138,Accounting for Derivative Instruments and Certain Hedging ActivitiesÌan amendment of FASB StatementNo. 133. Our adoption of FAS 133 on January 1, 2001, resulted in a cumulative after-tax increase to income of$168 million ($258 million pre-tax) in 2001. The cumulative eÅect on earnings from the change in accountingprinciple was primarily attributable to recording the fair value of the time value of purchased options, whichare used as a substitute for callable debt securities.
CORE BUSINESS EARNINGS AND BUSINESS SEGMENT RESULTS
Management relies primarily on core business earnings, a supplemental non-GAAP measure developedin conjunction with our January 1, 2001 adoption of FAS 133, to evaluate Fannie Mae's Ñnancialperformance. While core business earnings is not a substitute for GAAP net income, we rely on core businessearnings in operating our business because we believe core business earnings provides our management andinvestors with a better measure of our Ñnancial results and better reÖects our risk management strategies thanour GAAP net income. Core business earnings excludes the unpredictable volatility in the time value ofpurchased options because we generally intend to hold these options to maturity, and we do not believe theperiod-to-period variability in our reported net income from changes in the time value of our purchasedoptions accurately reÖects the underlying risks or economics of our hedging strategy. Core business earningsincludes amortization of purchased options premiums on a straight-line basis over the original expected life ofthe options. The net amount of purchased options amortization expense recorded under our core businessearnings measure will equal the net amount of purchased options expense ultimately recorded under FAS 133in our reported net income over the life of our options. However, our amortization treatment is more consistentwith the accounting for embedded options in our callable debt and more accurately reÖects the underlyingeconomics of our use of purchased options as a substitute for issuing callable debtÌtwo alternate hedgingstrategies that are economically very similar but require diÅerent accounting under FAS 133.
Management also relies on several other non-GAAP performance measures related to core businessearnings to evaluate Fannie Mae's performance. These key performance measures include taxable-equivalentrevenues, core net interest income, and net interest margin. We discuss these measures further in this sectionand provide a discussion of our business segments, which we also evaluate based on core business earnings.Our core business earnings measures are not deÑned terms within GAAP and may not be comparable tosimilarly titled measures reported by other companies.
Core Business Earnings
We delivered record core business earnings in 2002 for the 16th consecutive year. Core business earningsincreased 19 percent over 2001 to $6.394 billion due primarily to strong mortgage portfolio and net interest
33

margin growth. Our core business earnings in 2001 grew 21 percent over 2000 to $5.367 billion, also due tostrong portfolio and net interest margin growth.
2002 Ñnancial highlights include:
‚ 17 percent increase in total taxable-equivalent revenues
‚ 12 percent growth in the average net mortgage portfolio
‚ 16 percent increase in the total book of business
‚ 4 basis point increase in the net interest margin
‚ Decline in our credit loss ratio to .5 basis points from .6 basis points in 2001
While our core business earnings measures should not be construed by investors as an alternative to netincome and other measures determined in accordance with GAAP, they are critical performance indicators forFannie Mae's management. Core business earnings is the primary Ñnancial performance measure used byFannie Mae's management not only in developing the Ñnancial plans of our lines of business and trackingresults, but also in establishing corporate performance targets and determining incentive compensation. Inaddition, the investment analyst community has traditionally relied on our core business earnings measures toevaluate Fannie Mae's earnings performance and to issue earnings guidance. We believe these measures alsocan serve as valuable assessment tools for investors to judge the quality of our earnings because they providemore consistent accounting and reporting for economically similar interest rate risk hedging transactions,which allows investors to more readily identify sustainable trends and gauge potential future earnings trends.
Table 4 shows our line of business and consolidated core business earnings results for 2002, 2001, and2000. We have reclassiÑed certain amounts in our prior years' results to conform to our current presentation.The only diÅerence in core business earnings and reported net income relates to the FAS 133 accountingtreatment for purchased options, which aÅects our Portfolio Investment business. The FAS 133 relatedreconciling items between our core business earnings and reported results have no eÅect on our CreditGuaranty business.
34

Table 4: Reconciliation of Core Business Earnings to Reported Results2002(1)
ReconcilingTotal Core Items Related
Portfolio Credit Business to Purchased ReportedInvestment Guaranty Earnings Options Results
(Dollars in millions)
Net interest income ÏÏÏÏÏÏÏÏÏÏÏÏÏÏÏÏÏÏÏÏÏÏÏÏÏÏÏÏÏÏÏÏÏ $ 9,869 $ 697 $10,566 $ Ì $10,566Purchased options amortization expense ÏÏÏÏÏÏÏÏÏÏÏÏÏÏÏÏ (1,814) Ì (1,814) 1,814 (a) Ì
Core net interest income ÏÏÏÏÏÏÏÏÏÏÏÏÏÏÏÏÏÏÏÏÏÏÏÏÏÏÏÏÏ 8,055 697 8,752 1,814 10,566Guaranty fee income (expense) ÏÏÏÏÏÏÏÏÏÏÏÏÏÏÏÏÏÏÏÏÏÏÏ (1,374) 3,190 1,816 Ì 1,816Fee and other income (expense), net ÏÏÏÏÏÏÏÏÏÏÏÏÏÏÏÏÏÏ 348 (116) 232 Ì 232Credit-related expenses(2) ÏÏÏÏÏÏÏÏÏÏÏÏÏÏÏÏÏÏÏÏÏÏÏÏÏÏÏÏ Ì (92) (92) Ì (92)Administrative expenses ÏÏÏÏÏÏÏÏÏÏÏÏÏÏÏÏÏÏÏÏÏÏÏÏÏÏÏÏÏ (357) (862) (1,219) Ì (1,219)Purchased options expense under FAS 133ÏÏÏÏÏÏÏÏÏÏÏÏÏÏ Ì Ì Ì (4,545)(b) (4,545)Debt extinguishments, netÏÏÏÏÏÏÏÏÏÏÏÏÏÏÏÏÏÏÏÏÏÏÏÏÏÏÏÏ (710) Ì (710) Ì (710)
Income before federal income taxesÏÏÏÏÏÏÏÏÏÏÏÏÏÏÏÏÏÏÏÏ 5,962 2,817 8,779 (2,731) 6,048Provision for federal income taxes ÏÏÏÏÏÏÏÏÏÏÏÏÏÏÏÏÏÏÏÏÏ (1,747) (638) (2,385) 956 (d) (1,429)
Net income ÏÏÏÏÏÏÏÏÏÏÏÏÏÏÏÏÏÏÏÏÏÏÏÏÏÏÏÏÏÏÏÏÏÏÏÏÏÏ $ 4,215 $2,179 $ 6,394 $(1,775) $ 4,619
2001(1)
ReconcilingTotal Core Items Related
Portfolio Credit Business to Purchased ReportedInvestment Guaranty Earnings Options Results
Net interest income ÏÏÏÏÏÏÏÏÏÏÏÏÏÏÏÏÏÏÏÏÏÏÏÏÏÏÏÏÏÏÏÏÏ $ 7,369 $ 721 $ 8,090 $ Ì $ 8,090Purchased options amortization expense ÏÏÏÏÏÏÏÏÏÏÏÏÏÏÏÏ (590) Ì (590) 590 (a) Ì
Core net interest income ÏÏÏÏÏÏÏÏÏÏÏÏÏÏÏÏÏÏÏÏÏÏÏÏÏÏÏÏÏ 6,779 721 7,500 590 8,090Guaranty fee income (expense) ÏÏÏÏÏÏÏÏÏÏÏÏÏÏÏÏÏÏÏÏÏÏÏ (1,109) 2,591 1,482 Ì 1,482Fee and other income (expense), net ÏÏÏÏÏÏÏÏÏÏÏÏÏÏÏÏÏÏ 211 (60) 151 Ì 151Credit-related expenses(2) ÏÏÏÏÏÏÏÏÏÏÏÏÏÏÏÏÏÏÏÏÏÏÏÏÏÏÏÏ Ì (78) (78) Ì (78)Administrative expenses ÏÏÏÏÏÏÏÏÏÏÏÏÏÏÏÏÏÏÏÏÏÏÏÏÏÏÏÏÏ (302) (715) (1,017) Ì (1,017)Special contribution ÏÏÏÏÏÏÏÏÏÏÏÏÏÏÏÏÏÏÏÏÏÏÏÏÏÏÏÏÏÏÏÏÏ (192) (108) (300) Ì (300)Purchased options expense under FAS 133ÏÏÏÏÏÏÏÏÏÏÏÏÏÏ Ì Ì Ì (37)(b) (37)Debt extinguishments, netÏÏÏÏÏÏÏÏÏÏÏÏÏÏÏÏÏÏÏÏÏÏÏÏÏÏÏÏ (524) Ì (524) Ì (524)
Income before federal income taxes and eÅect ofaccounting change ÏÏÏÏÏÏÏÏÏÏÏÏÏÏÏÏÏÏÏÏÏÏÏÏÏÏÏÏÏÏÏÏ 4,863 2,351 7,214 553 7,767
Cumulative eÅect of accounting change, net of tax eÅectÏÏ Ì Ì Ì 168 (c) 168Provision for federal income taxes ÏÏÏÏÏÏÏÏÏÏÏÏÏÏÏÏÏÏÏÏÏ (1,374) (473) (1,847) (194)(d) (2,041)
Net income ÏÏÏÏÏÏÏÏÏÏÏÏÏÏÏÏÏÏÏÏÏÏÏÏÏÏÏÏÏÏÏÏÏÏÏÏÏÏ $ 3,489 $1,878 $ 5,367 $ 527 $ 5,894
2000
ReconcilingTotal Core Items Related
Portfolio Credit Business to Purchased ReportedInvestment Guaranty Earnings Options Results
Net interest income ÏÏÏÏÏÏÏÏÏÏÏÏÏÏÏÏÏÏÏÏÏÏÏÏÏÏÏÏÏÏÏÏÏ $ 5,055 $ 619 $ 5,674 $Ì $ 5,674Purchased options amortization expense ÏÏÏÏÏÏÏÏÏÏÏÏÏÏÏÏ Ì Ì Ì Ì ÌCore net interest income ÏÏÏÏÏÏÏÏÏÏÏÏÏÏÏÏÏÏÏÏÏÏÏÏÏÏÏÏÏ 5,055 619 5,674 Ì 5,674
Guaranty fee income (expense) ÏÏÏÏÏÏÏÏÏÏÏÏÏÏÏÏÏÏÏÏÏÏÏ (1,079) 2,430 1,351 Ì 1,351Fee and other income (expense), net ÏÏÏÏÏÏÏÏÏÏÏÏÏÏÏÏÏÏ 27 (71) (44) Ì (44)Credit-related expenses(2) ÏÏÏÏÏÏÏÏÏÏÏÏÏÏÏÏÏÏÏÏÏÏÏÏÏÏÏÏ Ì (94) (94) Ì (94)Administrative expenses ÏÏÏÏÏÏÏÏÏÏÏÏÏÏÏÏÏÏÏÏÏÏÏÏÏÏÏÏÏ (254) (651) (905) Ì (905)Debt extinguishments, netÏÏÏÏÏÏÏÏÏÏÏÏÏÏÏÏÏÏÏÏÏÏÏÏÏÏÏÏ 49 Ì 49 Ì 49
Income before federal income taxesÏÏÏÏÏÏÏÏÏÏÏÏÏÏÏÏÏÏÏÏ 3,798 2,233 6,031 Ì 6,031Provision for federal income taxes ÏÏÏÏÏÏÏÏÏÏÏÏÏÏÏÏÏÏÏÏÏ (1,053) (530) (1,583) Ì (1,583)
Net income ÏÏÏÏÏÏÏÏÏÏÏÏÏÏÏÏÏÏÏÏÏÏÏÏÏÏÏÏÏÏÏÏÏÏÏÏÏÏ $ 2,745 $1,703 $ 4,448 $Ì $ 4,448
(1) Reported net income for 2002 and 2001 includes the eÅect of FAS 133, which was adopted on January 1, 2001.(2) Credit-related expenses include the income statement line items ""Provision for losses'' and ""Foreclosed property
expense (income).''
35

While the reconciling items to derive our core business earnings are signiÑcant components inunderstanding and assessing our reported results and Ñnancial performance, investors may not be able todirectly discern the underlying economic impact of our interest rate risk management strategies without ourcore business results. We believe our core business earnings measures help to improve transparency andenhance investors' understanding of our operations, as well as facilitate trend analysis. The speciÑc FAS 133related adjustments aÅecting our Portfolio Investment business that we identify in Table 4 include:
(a) Purchased options amortization expense: This amount represents the straight-line amortization ofpurchased options premiums over the original expected life of the options that we include in our core netinterest income. We include this amount in core business earnings instead of recording changes in thetime value of purchased options because it is more consistent with the accounting for the embeddedoptions in our callable debt and the vast majority of our mortgages.
(b) Purchased options expense: This amount, which is recorded in our income statement under purchasedoptions expense, represents changes in the fair value of the time value of purchased options recorded inaccordance with FAS 133. We exclude this amount from our core business earnings measure because theperiod-to-period Öuctuations in the time value portion of our options does not reÖect the economics of ourcurrent risk management strategy, which generally is to hold our purchased options to maturity orexercise date. Consequently, we do not expect to realize the period-to-period Öuctuations in time value.
(c) Cumulative after-tax gain upon adoption of FAS 133: This non-recurring amount represents the one-time transition recorded upon the adoption of FAS 133 on January 1, 2001. We exclude the transitiongain from core business earnings because it relates to unrealized gains on purchased options that wererecorded when we adopted FAS 133.
(d) Provision for federal income taxes adjustment: Represents the net federal income tax eÅect of corebusiness earnings adjustments based on the applicable federal income tax rate of 35 percent.
Core business earnings does not exclude any other accounting eÅects related to the application ofFAS 133 or any other non-FAS 133 related adjustments. The guaranty fee income that we allocate to theCredit Guaranty business for managing the credit risk on mortgage-related assets held by the PortfolioInvestment business is oÅset by a corresponding guaranty fee expense allocation to the Portfolio Investmentbusiness in our line of business results. Thus, there is no inter-segment elimination adjustment between ourtotal line of business guaranty fee income and our reported guaranty fee income. We allocate transaction feesreceived for structuring and facilitating securities transactions for our customers primarily to our PortfolioInvestment business. We allocate technology-related fees received for providing Desktop Underwriter andother on-line services and fees received for providing credit enhancement alternatives to our customersprimarily to our Credit Guaranty business.
As discussed in ""MD&AÌRisk ManagementÌInterest Rate RiskÌDerivative Instruments,'' we usevarious funding alternatives, including option-based derivative instruments, that produce similar economicresults to manage interest rate risk and protect against the prepayment option in mortgages. The adjustmentsmade to our Portfolio Investment business to derive core business earnings provide consistent accountingtreatment for purchased options and the embedded option in callable debt securitiesÌeconomically equivalentfunding transactionsÌby allocating the cost of purchased options on a straight-line basis over the originalexpected life of the option in a manner similar to our accounting for options in callable debt. We calculate theoriginal expected life of ""European'' options based on the exercise date. We calculate the original expected lifeof ""American'' options based on the expected life at the time the option is purchased. There is a diÅerence inthe original expected lives of European and American options because European options are exercisable onlyon one speciÑc date in the future, while American options are exercisable any time after a speciÑc future date.The actual life of an American option may diÅer from our original expected life because of movements ininterest rates subsequent to the exercise date that may aÅect the value and beneÑt of exercising the option at agiven time.
We can protect our net interest margin against changes in interest rates by either issuing callable debt tofund the purchase of mortgages or using a combination of callable debt, purchased options, and noncallable
36

debt. We generally use the method that helps us achieve our desired funding Öexibility and lowest cost. Ifinterest rates fall and our mortgages prepay, we have the option of retiring callable debt and issuing debt at alower rate to preserve our interest spread on new mortgage purchases. If interest rates fall and we have insteadused a combination of noncallable debt and purchased optionsÌsuch as a swaption that would allow us toenter into a pay-variable interest rate swapÌwe can exercise our option to allow us to pay a variable or lowerinterest rate and receive a Ñxed rate of interest. The Ñxed rate of interest that we receive would oÅset the costof our noncallable, Ñxed-rate debt. This hedging strategy would lower our funding costs and preserve our netinterest margin as interest rates fall in a manner very similar to retiring callable debt and issuing new, lowercost debt. However, because the accounting for this hedging strategy is diÅerent under FAS 133, the cost ofthe purchased option would not be reÖected in our reported net interest yield. We would be required to recordthe change in the fair value of the time value of the purchased option as a separate amount in our incomestatement. On the other hand, if interest rates increase, we would not exercise the option to call debt since thecost of issuing new debt would be higher. Similarly, we would not exercise the option provided by a purchasedswaption to enter a pay-variable swap because under a higher interest rate environment, we could enter into asimilar transaction with more favorable terms. See ""MD&AÌRisk ManagementÌInterest Rate RiskManagementÌDerivative Instruments'' for further discussion on how we use purchased options to simulatecallable debt.
If we issue noncallable debt and purchased options to fund the purchase of mortgages and protect againstthe prepayment option in mortgages, we are required under FAS 133 to record the unrealized period-to-periodÖuctuations in the changes in time value of the purchased options in earnings. If instead, we issue callable debtto fund the purchase of the same mortgages, the expense related to the option in our callable debt would berecognized ratably over the option period as part of interest expense. Although the two transactions producesimilar economic results, GAAP requires diÅerent accounting treatment. Under our core business earningsmeasure, the accounting treatment for purchased options is consistent and also comparable to the accountingtreatment applied to these items in periods prior to the adoption of FAS 133.
Taxable-Equivalent Revenues
Taxable-equivalent revenues represent total revenues adjusted to reÖect the beneÑts of investment taxcredits and tax-exempt income based on applicable federal income tax rates and is net of the straight-lineamortization of purchased options expense that would have been recorded prior to the adoption of FAS 133.For analytical purposes, we calculate revenues on a taxable-equivalent basis to measure income from loweryielding investments that are tax-exempt or generate tax credits on a basis comparable to higher yieldingtaxable investments.
Table 5 compares taxable-equivalent revenues and the components for 2002, 2001, and 2000.
37

Table 5: Taxable-Equivalent Revenues
Year Ended December 31,
2002 2001 2000
(Dollars in millions)
Net interest income ÏÏÏÏÏÏÏÏÏÏÏÏÏÏÏÏÏÏÏÏÏÏÏÏÏÏÏÏÏÏÏÏÏÏÏÏÏÏÏÏÏÏÏÏÏÏÏÏÏÏÏÏÏÏÏÏÏ $10,566 $ 8,090 $5,674
Guaranty fee incomeÏÏÏÏÏÏÏÏÏÏÏÏÏÏÏÏÏÏÏÏÏÏÏÏÏÏÏÏÏÏÏÏÏÏÏÏÏÏÏÏÏÏÏÏÏÏÏÏÏÏÏÏÏÏÏÏÏ 1,816 1,482 1,351
Fee and other income (expense), net(1) ÏÏÏÏÏÏÏÏÏÏÏÏÏÏÏÏÏÏÏÏÏÏÏÏÏÏÏÏÏÏÏÏÏÏÏÏÏÏÏÏÏ 232 151 (44)
Total revenues ÏÏÏÏÏÏÏÏÏÏÏÏÏÏÏÏÏÏÏÏÏÏÏÏÏÏÏÏÏÏÏÏÏÏÏÏÏÏÏÏÏÏÏÏÏÏÏÏÏÏÏÏÏÏÏÏÏÏÏÏ 12,614 9,723 6,981
Taxable-equivalent adjustments:
Investment tax credits(2)ÏÏÏÏÏÏÏÏÏÏÏÏÏÏÏÏÏÏÏÏÏÏÏÏÏÏÏÏÏÏÏÏÏÏÏÏÏÏÏÏÏÏÏÏÏÏÏÏÏÏÏÏ 594 584 430
Tax-exempt investments(3) ÏÏÏÏÏÏÏÏÏÏÏÏÏÏÏÏÏÏÏÏÏÏÏÏÏÏÏÏÏÏÏÏÏÏÏÏÏÏÏÏÏÏÏÏÏÏÏÏÏÏ 502 470 414
Purchased options amortization expense(4)ÏÏÏÏÏÏÏÏÏÏÏÏÏÏÏÏÏÏÏÏÏÏÏÏÏÏÏÏÏÏÏÏÏÏÏÏÏÏÏ (1,814) (590) Ì
Taxable-equivalent revenuesÏÏÏÏÏÏÏÏÏÏÏÏÏÏÏÏÏÏÏÏÏÏÏÏÏÏÏÏÏÏÏÏÏÏÏÏÏÏÏÏÏÏÏÏÏÏÏÏÏÏÏ $11,896 $10,187 $7,825
(1) Includes net losses on certain tax-advantaged investments totaling $225 million, $222 million, and $188 million in2002, 2001, and 2000, respectively.
(2) Represents non-GAAP taxable-equivalent adjustments for tax credits related to losses on certain aÅordable housingtax-advantaged equity investments and other investment tax credits using the applicable federal income tax rate of35 percent.
(3) ReÖects non-GAAP adjustments to permit comparisons of yields on tax-exempt and taxable assets based on a35 percent marginal tax rate.
(4) Represents non-GAAP adjustment for straight-line amortization of purchased options premiums that would havebeen recorded prior to the adoption of FAS 133 in 2001. This expense is included in net interest income in 2000.
Taxable-equivalent revenues increased 17 percent to $11.896 billion in 2002, compared with a 30 percentincrease in 2001 to $10.187 billion. The increase in both years was primarily attributable to growth in netinterest income resulting from the low rate environment that contributed to strong mortgage portfolio growthand a reduction in our average cost of debt relative to our mortgage asset yields. Tighter mortgage-to-debtspreads reduced mortgage portfolio growth during the Ñrst half of 2002 and slowed the increase in taxable-equivalent revenues to levels more in line with our expectations. Our 2001 growth rate was higher thanexpected because of the increased supply of mortgages in the secondary market and attractive mortgage-to-debt spreads.
Core Net Interest Income
Core net interest income and our related net interest margin are supplemental non-GAAP measures thatmanagement uses to evaluate Fannie Mae's performance. Core net interest income includes our reported netinterest income adjusted for the non-GAAP amortization of purchased options premiums on a straight-linebasis over the original expected life of the options to reÖect the cost associated with using purchased options tohedge the borrowers' prepayment option in mortgages. We also calculate core net interest income on a taxable-equivalent basis to determine our net interest margin. We believe these measures are beneÑcial in understand-ing and analyzing Fannie Mae's performance because they reÖect consistent accounting for purchased optionsand callable debt, two of the principal instruments we use interchangeably to hedge the prepayment option inour mortgage investments. These measures also consistently reÖect income from taxable and tax-exemptinvestments.
Table 6 reconciles taxable-equivalent core net interest income to our reported net interest income andpresents an analysis of our net interest margin based on the average balances and yields of mortgage assets,nonmortgage investments, and debt. Our taxable-equivalent core net interest income and net interest marginare signiÑcantly diÅerent than our reported taxable-equivalent net interest income and net interest yieldbecause our core measures include the amortization of our purchased options premiums on a straight-linebasis over the life of the option, which is not in accordance with GAAP.
38

Table 6: Taxable-Equivalent Core Net Interest Income and Average Balances
2002 2001 2000
(Dollars in millions)
Net interest income ÏÏÏÏÏÏÏÏÏÏÏÏÏÏÏÏÏÏÏÏÏÏÏÏÏÏÏÏÏÏÏÏÏÏÏÏÏÏÏÏÏÏÏÏÏÏÏÏÏÏÏÏÏ $ 10,566 $ 8,090 $ 5,674
Purchased options amortization expense(1)ÏÏÏÏÏÏÏÏÏÏÏÏÏÏÏÏÏÏÏÏÏÏÏÏÏÏÏÏÏÏÏÏÏ (1,814) (590) Ì
Core net interest income ÏÏÏÏÏÏÏÏÏÏÏÏÏÏÏÏÏÏÏÏÏÏÏÏÏÏÏÏÏÏÏÏÏÏÏÏÏÏÏÏÏÏÏÏÏÏÏÏÏ 8,752 7,500 5,674
Taxable-equivalent adjustment on tax-exempt investments(2) ÏÏÏÏÏÏÏÏÏÏÏÏÏÏÏÏÏ 502 470 414
Taxable-equivalent core net interest income ÏÏÏÏÏÏÏÏÏÏÏÏÏÏÏÏÏÏÏÏÏÏÏÏÏÏÏÏÏÏÏÏÏ $ 9,254 $ 7,970 $ 6,088
Average balances:(3)
Interest-earning assets:(4)
Mortgage portfolio, net ÏÏÏÏÏÏÏÏÏÏÏÏÏÏÏÏÏÏÏÏÏÏÏÏÏÏÏÏÏÏÏÏÏÏÏÏÏÏÏÏÏÏÏÏÏÏÏÏÏ $735,943 $658,195 $553,531
Nonmortgage investments and cash equivalents ÏÏÏÏÏÏÏÏÏÏÏÏÏÏÏÏÏÏÏÏÏÏÏÏÏÏÏÏ 68,658 58,811 51,490
Total interest-earning assetsÏÏÏÏÏÏÏÏÏÏÏÏÏÏÏÏÏÏÏÏÏÏÏÏÏÏÏÏÏÏÏÏÏÏÏÏÏÏÏÏÏÏÏÏÏÏÏ 804,601 717,006 605,021
Interest-free funds(5) ÏÏÏÏÏÏÏÏÏÏÏÏÏÏÏÏÏÏÏÏÏÏÏÏÏÏÏÏÏÏÏÏÏÏÏÏÏÏÏÏÏÏÏÏÏÏÏÏÏÏÏ (23,992) (23,630) (20,595)
Total interest-earning assets funded by debt ÏÏÏÏÏÏÏÏÏÏÏÏÏÏÏÏÏÏÏÏÏÏÏÏÏÏÏÏÏÏÏÏÏ $780,609 $693,376 $584,426
Interest-bearing liabilities:(6)
Short-term debtÏÏÏÏÏÏÏÏÏÏÏÏÏÏÏÏÏÏÏÏÏÏÏÏÏÏÏÏÏÏÏÏÏÏÏÏÏÏÏÏÏÏÏÏÏÏÏÏÏÏÏÏÏÏÏ $141,727 $137,078 $ 73,351
Long-term debt ÏÏÏÏÏÏÏÏÏÏÏÏÏÏÏÏÏÏÏÏÏÏÏÏÏÏÏÏÏÏÏÏÏÏÏÏÏÏÏÏÏÏÏÏÏÏÏÏÏÏÏÏÏÏÏ 638,882 556,298 511,075
Total interest-bearing liabilities ÏÏÏÏÏÏÏÏÏÏÏÏÏÏÏÏÏÏÏÏÏÏÏÏÏÏÏÏÏÏÏÏÏÏÏÏÏÏÏÏÏÏÏÏ $780,609 $693,376 $584,426
Average interest rates:(2, 3)
Interest-earning assets:
Mortgage portfolio, net ÏÏÏÏÏÏÏÏÏÏÏÏÏÏÏÏÏÏÏÏÏÏÏÏÏÏÏÏÏÏÏÏÏÏÏÏÏÏÏÏÏÏÏÏÏÏÏÏÏ 6.73% 7.11% 7.16%
Nonmortgage investments and cash equivalents ÏÏÏÏÏÏÏÏÏÏÏÏÏÏÏÏÏÏÏÏÏÏÏÏÏÏÏÏ 2.34 4.63 6.60
Total interest-earning assetsÏÏÏÏÏÏÏÏÏÏÏÏÏÏÏÏÏÏÏÏÏÏÏÏÏÏÏÏÏÏÏÏÏÏÏÏÏÏÏÏÏÏÏÏÏ 6.35 6.90 7.11
Interest-free return(5) ÏÏÏÏÏÏÏÏÏÏÏÏÏÏÏÏÏÏÏÏÏÏÏÏÏÏÏÏÏÏÏÏÏÏÏÏÏÏÏÏÏÏÏÏÏÏÏÏÏÏ .18 .21 .25
Total interest-earning assets funded by debt ÏÏÏÏÏÏÏÏÏÏÏÏÏÏÏÏÏÏÏÏÏÏÏÏÏÏÏÏÏÏÏÏÏ 6.53 7.11 7.36
Interest-bearing liabilities:(6)
Short-term debtÏÏÏÏÏÏÏÏÏÏÏÏÏÏÏÏÏÏÏÏÏÏÏÏÏÏÏÏÏÏÏÏÏÏÏÏÏÏÏÏÏÏÏÏÏÏÏÏÏÏÏÏÏÏÏ 2.15 4.28 5.70
Long-term debt ÏÏÏÏÏÏÏÏÏÏÏÏÏÏÏÏÏÏÏÏÏÏÏÏÏÏÏÏÏÏÏÏÏÏÏÏÏÏÏÏÏÏÏÏÏÏÏÏÏÏÏÏÏÏÏ 6.10 6.43 6.44
Total interest-bearing liabilities ÏÏÏÏÏÏÏÏÏÏÏÏÏÏÏÏÏÏÏÏÏÏÏÏÏÏÏÏÏÏÏÏÏÏÏÏÏÏÏÏÏÏ 5.38 6.00 6.35
Net interest marginÏÏÏÏÏÏÏÏÏÏÏÏÏÏÏÏÏÏÏÏÏÏÏÏÏÏÏÏÏÏÏÏÏÏÏÏÏÏÏÏÏÏÏÏÏÏÏÏÏÏÏÏÏÏ 1.15% 1.11% 1.01%
(1) ReÖects non-GAAP adjustment for straight-line amortization of purchased options premiums that would have beenrecorded prior to the adoption of FAS 133 in 2001.
(2) ReÖects non-GAAP adjustments to permit comparison of yields on tax-exempt and taxable assets based on a35 percent marginal tax rate.
(3) Averages have been calculated on a monthly basis based on amortized cost.
(4) Includes average balance of nonaccrual loans of $4.6 billion in 2002, $2.6 billion in 2001, and $2.1 billion in 2000.
(5) Interest-free funds represent the portion of our investment portfolio funded by equity and non-interest bearingliabilities.
(6) ClassiÑcation of interest expense and interest-bearing liabilities as short-term or long-term is based on eÅectivematurity or repricing date, taking into consideration the eÅect of derivative Ñnancial instruments. The cost of debtincludes expense for the amortization of purchased options.
Taxable-equivalent core net interest income totaled $9.254 billion in 2002, compared with $7.970 billionin 2001 and $6.088 billion in 2000. The $1.284 billion or 16 percent increase in taxable-equivalent core netinterest income during 2002 was due primarily to a 12 percent increase in our average net mortgage portfolioand a 4 basis point increase in the net interest margin to 1.15 percent. During 2001, taxable-equivalent corenet interest income increased $1.882 billion or 31 percent as the average net mortgage portfolio grew by19 percent, and the net interest margin expanded by 10 basis points to 1.11 percent. Table 7 shows the changesin taxable-equivalent core net interest income for 2002 and 2001 attributable to changes in rates and the
39

volume of our mortgage assets, nonmortgage investments, and debt and changes in purchased optionsamortization expense and taxable-equivalent adjustments.
Table 7: Rate/Volume Analysis of Core Net Interest Income
Attributable toChanges in(1)
Increase(Decrease) Volume Rate
(Dollars in millions)
2002 vs. 2001Interest income:
Mortgage portfolio ÏÏÏÏÏÏÏÏÏÏÏÏÏÏÏÏÏÏÏÏÏÏÏÏÏÏÏÏÏÏÏÏÏÏÏÏÏÏÏÏÏÏÏÏÏÏÏÏÏÏÏÏÏÏ $ 2,787 $5,292 $(2,505)Nonmortgage investments and cash equivalents ÏÏÏÏÏÏÏÏÏÏÏÏÏÏÏÏÏÏÏÏÏÏÏÏÏÏÏÏÏÏ (1,104) 394 (1,498)
Total interest income ÏÏÏÏÏÏÏÏÏÏÏÏÏÏÏÏÏÏÏÏÏÏÏÏÏÏÏÏÏÏÏÏÏÏÏÏÏÏÏÏÏÏÏÏÏÏÏÏÏÏÏÏ 1,683 5,686 (4,003)
Interest expense(2):Short-term debt ÏÏÏÏÏÏÏÏÏÏÏÏÏÏÏÏÏÏÏÏÏÏÏÏÏÏÏÏÏÏÏÏÏÏÏÏÏÏÏÏÏÏÏÏÏÏÏÏÏÏÏÏÏÏÏÏ (2,919) 194 (3,113)Long-term debtÏÏÏÏÏÏÏÏÏÏÏÏÏÏÏÏÏÏÏÏÏÏÏÏÏÏÏÏÏÏÏÏÏÏÏÏÏÏÏÏÏÏÏÏÏÏÏÏÏÏÏÏÏÏÏÏÏ 2,126 4,959 (2,833)
Total interest expense ÏÏÏÏÏÏÏÏÏÏÏÏÏÏÏÏÏÏÏÏÏÏÏÏÏÏÏÏÏÏÏÏÏÏÏÏÏÏÏÏÏÏÏÏÏÏÏÏÏÏÏ (793) 5,153 (5,946)
Change in net interest income ÏÏÏÏÏÏÏÏÏÏÏÏÏÏÏÏÏÏÏÏÏÏÏÏÏÏÏÏÏÏÏÏÏÏÏÏÏÏÏÏÏÏÏÏÏÏ $ 2,476 $ 533 $ 1,943
Change in purchased options amortization expense(3) ÏÏÏÏÏÏÏÏÏÏÏÏÏÏÏÏÏÏÏÏÏÏÏÏÏ (1,224)
Change in core net interest income ÏÏÏÏÏÏÏÏÏÏÏÏÏÏÏÏÏÏÏÏÏÏÏÏÏÏÏÏÏÏÏÏÏÏÏÏÏÏÏÏÏÏ 1,252Change in taxable-equivalent adjustment on tax-exempt investments(4) ÏÏÏÏÏÏÏÏÏÏ 32
Change in taxable-equivalent core net interest income ÏÏÏÏÏÏÏÏÏÏÏÏÏÏÏÏÏÏÏÏÏÏÏÏÏÏ $ 1,284
2001 vs. 2000Interest income:
Mortgage portfolio ÏÏÏÏÏÏÏÏÏÏÏÏÏÏÏÏÏÏÏÏÏÏÏÏÏÏÏÏÏÏÏÏÏÏÏÏÏÏÏÏÏÏÏÏÏÏÏÏÏÏÏÏÏÏ $ 7,075 $7,393 $ (318)Nonmortgage investments and cash equivalents ÏÏÏÏÏÏÏÏÏÏÏÏÏÏÏÏÏÏÏÏÏÏÏÏÏÏÏÏÏÏ (686) 434 (1,120)
Total interest income ÏÏÏÏÏÏÏÏÏÏÏÏÏÏÏÏÏÏÏÏÏÏÏÏÏÏÏÏÏÏÏÏÏÏÏÏÏÏÏÏÏÏÏÏÏÏÏÏÏÏÏÏ 6,389 7,827 (1,438)
Interest expense(2):Short-term debt ÏÏÏÏÏÏÏÏÏÏÏÏÏÏÏÏÏÏÏÏÏÏÏÏÏÏÏÏÏÏÏÏÏÏÏÏÏÏÏÏÏÏÏÏÏÏÏÏÏÏÏÏÏÏÏÏ 1,693 2,945 (1,252)Long-term debtÏÏÏÏÏÏÏÏÏÏÏÏÏÏÏÏÏÏÏÏÏÏÏÏÏÏÏÏÏÏÏÏÏÏÏÏÏÏÏÏÏÏÏÏÏÏÏÏÏÏÏÏÏÏÏÏÏ 2,280 2,868 (588)
Total interest expense ÏÏÏÏÏÏÏÏÏÏÏÏÏÏÏÏÏÏÏÏÏÏÏÏÏÏÏÏÏÏÏÏÏÏÏÏÏÏÏÏÏÏÏÏÏÏÏÏÏÏÏ 3,973 5,813 (1,840)
Change in net interest income ÏÏÏÏÏÏÏÏÏÏÏÏÏÏÏÏÏÏÏÏÏÏÏÏÏÏÏÏÏÏÏÏÏÏÏÏÏÏÏÏÏÏÏÏÏÏ $ 2,416 $2,014 $ 402
Change in purchased options amortization expense(3) ÏÏÏÏÏÏÏÏÏÏÏÏÏÏÏÏÏÏÏÏÏÏÏÏÏ (590)
Change in core net interest income ÏÏÏÏÏÏÏÏÏÏÏÏÏÏÏÏÏÏÏÏÏÏÏÏÏÏÏÏÏÏÏÏÏÏÏÏÏÏÏÏÏÏ 1,826Change in taxable-equivalent adjustment on tax-exempt investments(4) ÏÏÏÏÏÏÏÏÏÏ 56
Change in taxable-equivalent core net interest income ÏÏÏÏÏÏÏÏÏÏÏÏÏÏÏÏÏÏÏÏÏÏÏÏÏÏ $ 1,882
(1) Combined rate/volume variances, a third element of the calculation, are allocated to the rate and volume variancesbased on their relative size.
(2) ClassiÑcation of interest expense and interest-bearing liabilities as short-term or long-term is based on eÅectivematurity or repricing date, taking into consideration the eÅect of derivative Ñnancial instruments.
(3) ReÖects non-GAAP adjustment for straight-line amortization of purchased options premiums that would have beenrecorded prior to the adoption of FAS 133 in 2001.
(4) ReÖects non-GAAP adjustments to permit comparison of yields on tax-exempt and taxable assets based on a35 percent marginal tax rate.
Business Segment Results
Portfolio Investment Business
Core business earnings for our Portfolio Investment business totaled $4.215 billion in 2002, comparedwith $3.489 billion in 2001, and $2.745 billion in 2000. Core business earnings grew 21 percent in 2002, downfrom 27 percent growth in 2001. Growth in mortgage debt outstanding, combined with our ability to oÅerreliable, low-cost mortgage funds, helped us grow our average net mortgage portfolio by 12 percent in 2002
40

despite a record level of liquidations. The Portfolio Investment business also capitalized on opportunitiespresented by the decline in interest rates that began in 2001 to reduce our debt costs and increase the netinterest margin 4 basis points to 115 basis points. In 2001, the average net mortgage portfolio grew 19 percentand the net interest margin increased 10 basis points to 111 basis points.
Low mortgage rates boosted originations of Ñxed-rate mortgages in the primary market to record levels in2002. However, during the Ñrst half of 2002, primary market lenders retained a higher than traditional level ofmortgage loans in their own portfolios. The demand for mortgage investments also increased among othersecondary market participants. We believe this occurrence was in response to equity market volatility and theperceived safety of mortgage-related investments in a period of signiÑcant uncertainty about the impact of theeconomy on corporate creditworthiness. In addition, the steep yield curve lowered borrowing costs for banksand other primary market participants, which made it more attractive to hold mortgage investments. Theincreased competition for mortgages in the Ñrst half of 2002 resulted in tighter spreads between mortgageyields and our debt costs (mortgage-to-debt spreads), which slowed our overall portfolio growth. Our portfoliogrowth accelerated in the second half of the year as a sharp drop in mortgage rates sparked a reÑnancing wavethat increased the supply of mortgages in the secondary market and generated wider mortgage-to-debtspreads. We substantially increased our mortgage commitments in response to these more attractive spreads.We also experienced higher portfolio growth in 2001 because of attractive mortgage-to-debt spreads stemmingfrom an increased supply of mortgage assets in the secondary market because of a reduction in intermediate-term rates that boosted mortgage reÑnancings and originations.
The sharp decline in short-term interest rates relative to long-term interest rates during 2001 resulted in asteeper yield curve that persisted throughout 2002. Our net interest margin in 2002 continued to beneÑt fromactions taken during 2001 in response to opportunities presented by the unusually steep yield curve and lowshort-term interest rates. The Portfolio Investment business was able to replace signiÑcant amounts of calledor maturing debt in 2001 with lower cost, shorter-term debt more quickly than our mortgage assets matured orprepaid. These actions temporarily reduced our debt cost relative to asset yield and elevated our net interestmargin in 2001. Our net interest margin remained elevated in 2002 as the unusually steep yield curve and lowinterest rate environment persisted, and we called or otherwise retired additional high-cost debt.
Primary investing activities for the Portfolio Investment business include purchasing mortgage loans,mortgage-related securities, and other investments from lenders, securities dealers, investors, and other marketparticipants. The Portfolio Investment business also issues real estate mortgage investment conduits(""REMICs''), Megas, and SMBS as a source of fee income. The Portfolio Investment business maintains theLIP, which consists of nonmortgage investments and serves as an alternative source of liquidity and aninvestment vehicle for our surplus capital. Our primary Ñnancing activities involve issuing various debtsecurities to fund our mortgage purchases and other business activities.
Mortgage Portfolio
Our mortgage portfolio includes whole loan mortgages, mortgage-related securities, and other mortgageinvestments, including other agency securities purchased from lenders, securities dealers, investors, and othermarket participants. We grew our net mortgage portfolio by 13 percent to $798 billion at December 31, 2002.In comparison, we expanded our net mortgage portfolio by 16 percent in 2001. We grew our portfolio moreselectively and at a slower pace in 2002 in accordance with our disciplined approach to growth because oftighter mortgage-to-debt spreads during the Ñrst half of 2002. Table 8 shows the distribution of Fannie Mae'smortgage portfolio by product type.
41

Table 8: Mortgage Portfolio Composition(1)
2002 2001 2000 1999 1998
(Dollars in millions)MortgagesSingle-family:
Government insured or guaranteed ÏÏÏÏÏÏÏÏÏÏÏÏÏÏÏÏÏÏ $ 5,458 $ 5,070 $ 4,762 $ 4,472 $ 4,404
Conventional:Long-term, Ñxed-rate ÏÏÏÏÏÏÏÏÏÏÏÏÏÏÏÏÏÏÏÏÏÏÏÏÏÏÏ 103,220 96,417 87,005 86,787 87,739Intermediate-term, Ñxed-rate(2) ÏÏÏÏÏÏÏÏÏÏÏÏÏÏÏÏÏÏÏ 54,503 43,522 39,134 43,878 47,818Adjustable-rate ÏÏÏÏÏÏÏÏÏÏÏÏÏÏÏÏÏÏÏÏÏÏÏÏÏÏÏÏÏÏÏÏ 9,045 10,410 13,243 6,058 7,632
Total conventional single-family ÏÏÏÏÏÏÏÏÏÏÏÏÏÏ 166,768 150,349 139,382 136,723 143,189
Total single-family ÏÏÏÏÏÏÏÏÏÏÏÏÏÏÏÏÏÏÏÏÏÏÏÏÏÏÏÏÏÏÏÏÏ 172,226 155,419 144,144 141,195 147,593
Multifamily:Government insured or guaranteed ÏÏÏÏÏÏÏÏÏÏÏÏÏÏÏÏÏÏ 1,353 1,551 1,814 2,347 2,594Conventional ÏÏÏÏÏÏÏÏÏÏÏÏÏÏÏÏÏÏÏÏÏÏÏÏÏÏÏÏÏÏÏÏÏÏÏÏ 12,218 8,987 6,547 5,564 5,591
Total multifamilyÏÏÏÏÏÏÏÏÏÏÏÏÏÏÏÏÏÏÏÏÏÏÏÏÏÏÏÏÏÏÏÏÏÏÏ 13,571 10,538 8,361 7,911 8,185
Total mortgagesÏÏÏÏÏÏÏÏÏÏÏÏÏÏÏÏÏÏÏÏÏÏÏÏÏÏÏÏÏÏÏÏÏÏÏÏ $185,797 $165,957 $152,505 $149,106 $155,778
Mortgage-related securitiesSingle-family:
Government insured or guaranteed ÏÏÏÏÏÏÏÏÏÏÏÏÏÏÏÏÏÏ $ 33,293 $ 37,111 $ 39,404 $ 36,557 $ 17,401
Conventional:Long-term, Ñxed-rate ÏÏÏÏÏÏÏÏÏÏÏÏÏÏÏÏÏÏÏÏÏÏÏÏÏÏÏ 510,435 456,046 367,344 298,534 209,367Intermediate-term, Ñxed-rate(2) ÏÏÏÏÏÏÏÏÏÏÏÏÏÏÏÏÏÏÏ 39,409 25,890 27,965 25,317 23,948Adjustable-rate ÏÏÏÏÏÏÏÏÏÏÏÏÏÏÏÏÏÏÏÏÏÏÏÏÏÏÏÏÏÏÏÏ 13,946 10,355 13,892 8,049 4,241
Total conventional single-family ÏÏÏÏÏÏÏÏÏÏÏÏÏÏ 563,790 492,291 409,201 331,900 237,556
Total single-family ÏÏÏÏÏÏÏÏÏÏÏÏÏÏÏÏÏÏÏÏÏÏÏÏÏÏÏÏÏÏÏÏÏ 597,083 529,402 448,605 368,457 254,957
Multifamily:Government insured or guaranteed ÏÏÏÏÏÏÏÏÏÏÏÏÏÏÏÏÏÏ 7,370 6,481 5,370 4,392 2,765Conventional ÏÏÏÏÏÏÏÏÏÏÏÏÏÏÏÏÏÏÏÏÏÏÏÏÏÏÏÏÏÏÏÏÏÏÏÏ 7,050 5,636 3,642 1,986 1,015
Total multifamilyÏÏÏÏÏÏÏÏÏÏÏÏÏÏÏÏÏÏÏÏÏÏÏÏÏÏÏÏÏÏÏÏÏÏÏ 14,420 12,117 9,012 6,378 3,780
Total mortgage-related securitiesÏÏÏÏÏÏÏÏÏÏÏÏÏÏÏÏÏÏÏÏÏÏ $611,503 $541,519 $457,617 $374,835 $258,737
Mortgage portfolio, netSingle-family:
Government insured or guaranteed ÏÏÏÏÏÏÏÏÏÏÏÏÏÏÏÏÏÏ $ 38,751 $ 42,181 $ 44,166 $ 41,029 $ 21,805
Conventional:Long-term, Ñxed-rate ÏÏÏÏÏÏÏÏÏÏÏÏÏÏÏÏÏÏÏÏÏÏÏÏÏÏÏ 613,655 552,463 454,349 385,321 297,106Intermediate-term, Ñxed-rate(2) ÏÏÏÏÏÏÏÏÏÏÏÏÏÏÏÏÏÏÏ 93,912 69,412 67,099 69,195 71,766Adjustable-rate ÏÏÏÏÏÏÏÏÏÏÏÏÏÏÏÏÏÏÏÏÏÏÏÏÏÏÏÏÏÏÏÏ 22,991 20,765 27,135 14,107 11,873
Total conventional single-family ÏÏÏÏÏÏÏÏÏÏÏÏÏÏ 730,558 642,640 548,583 468,623 380,745
Total single-family ÏÏÏÏÏÏÏÏÏÏÏÏÏÏÏÏÏÏÏÏÏÏÏÏÏÏÏÏÏÏÏÏÏ 769,309 684,821 592,749 509,652 402,550
Multifamily:Government insured or guaranteed ÏÏÏÏÏÏÏÏÏÏÏÏÏÏÏÏÏÏ 8,723 8,032 7,184 6,739 5,359Conventional ÏÏÏÏÏÏÏÏÏÏÏÏÏÏÏÏÏÏÏÏÏÏÏÏÏÏÏÏÏÏÏÏÏÏÏÏ 19,268 14,623 10,189 7,550 6,606
Total multifamilyÏÏÏÏÏÏÏÏÏÏÏÏÏÏÏÏÏÏÏÏÏÏÏÏÏÏÏÏÏÏÏÏÏÏÏ 27,991 22,655 17,373 14,289 11,965
Total mortgage portfolioÏÏÏÏÏÏÏÏÏÏÏÏÏÏÏÏÏÏÏÏÏÏÏÏÏÏÏÏÏ 797,300 707,476 610,122 523,941 414,515Unamortized premium (discount) and deferred price
adjustments, net(3)ÏÏÏÏÏÏÏÏÏÏÏÏÏÏÏÏÏÏÏÏÏÏÏÏÏÏÏÏÏÏ 472 (2,104) (2,520) (964) 919Allowance for loan losses(4) ÏÏÏÏÏÏÏÏÏÏÏÏÏÏÏÏÏÏÏÏÏÏÏÏ (79) (48) (51) (56) (79)
Mortgage portfolio, net ÏÏÏÏÏÏÏÏÏÏÏÏÏÏÏÏÏÏÏÏÏÏÏÏÏÏÏÏÏÏ $797,693 $705,324 $607,551 $522,921 $415,355
(1) Amounts presented have been restated to conform to the current year presentation. Data represents unpaid principalbalance adjusted to include mark-to-market gains and losses on available-for-sale securities.
(2) Intermediate-term, Ñxed-rate consists of portfolio loans with contractual maturities at purchase equal to or less than20 years and MBS and other mortgage-related securities held in portfolio with maturities of 15 years or less at issuedate.
(3) Includes net unamortized premiums of $135 million, $536 million, and $559 million at December 31, 2002, 2001, and1998, respectively, and net unamortized discounts of $2,311 million and $586 million at December 31, 2000 and 1999,respectively, related to available-for-sale and held-to-maturity mortgage-related securities.
(4) Guaranty liability for probable losses on loans underlying Fannie Mae guaranteed MBS is included in ""Guarantyliability for MBS.''
42

The average yield on our net mortgage portfolio decreased to 6.73 percent in 2002, from 7.11 percent in2001, and 7.16 percent in 2000. The decrease in yield during 2002 and 2001 resulted largely from the generaldecline in mortgage rates on loans originated in the primary market and sold into the secondary market plus anincrease in the level of liquidations of older, higher-rate loans. The liquidation rate on mortgages in portfolio(excluding sales) increased to 37 percent in 2002 from 25 percent in 2001Ìmore than triple the 2000liquidation rate of 10 percent. Mortgage liquidations in 2002, 2001, and 2000 totaled $277 billion, $164 billion,and $57 billion, respectively. Liquidations increased signiÑcantly in 2002 and 2001 largely because of extensivereÑnancing in response to falling mortgage interest rates.
Table 9 summarizes mortgage portfolio activity on a gross basis and average yields from 2000 through2002.
Table 9: Mortgage Portfolio Activity(1)
Purchases Sales Repayments(2)
2002 2001 2000 2002 2001 2000 2002 2001 2000
(Dollars in millions)
Single-family:
Government insured orguaranteedÏÏÏÏÏÏÏÏÏÏÏÏ $ 9,493 $ 6,001 $ 6,940 $ 139 $ Ì $ 521 $ 13,057 $ 8,125 $ 3,423
Conventional:
Long-term, fixed-rate ÏÏÏ 280,815 226,516 113,444 8,253 7,621 9,219 216,218 120,787 35,208
Intermediate-term,Ñxed-rate ÏÏÏÏÏÏÏÏÏÏÏ 62,102 26,146 11,607 464 442 599 37,544 23,391 13,105
Adjustable-rate ÏÏÏÏÏÏÏÏ 10,739 3,777 17,683 347 228 374 8,806 9,937 4,293
Total conventional single-familyÏÏÏÏÏÏÏÏÏÏÏÏÏÏÏÏ 353,656 256,439 142,734 9,064 8,291 10,192 262,568 154,115 52,606
Total single-family ÏÏÏÏÏÏÏ 363,149 262,440 149,674 9,203 8,291 10,713 275,625 162,240 56,029
Multifamily ÏÏÏÏÏÏÏÏÏÏÏÏÏÏÏ 7,492 8,144 4,557 379 690 269 1,794 2,172 1,204
Total ÏÏÏÏÏÏÏÏÏÏÏÏÏÏÏÏÏÏ $370,641 $270,584 $154,231 $9,582 $8,981 $10,982 $277,419 $164,412 $57,233
Average net yield ÏÏÏÏÏÏÏÏÏÏ 5.92% 6.56% 7.62% 6.83% 7.23% 7.18%
Repayments as a percentageof average mortgageportfolio ÏÏÏÏÏÏÏÏÏÏÏÏÏÏÏÏ 37.4% 24.7% 10.3%
(1) Excludes premiums, discounts, and other deferred price adjustments.
(2) Includes mortgage loan prepayments, scheduled amortization, and foreclosures.
We classify mortgage loans on our balance sheet as either held-for-investment or held-for-sale. Ourmortgage portfolio also includes MBS and other mortgage-related securities that we classify as either held-to-maturity or available-for-sale. On September 13, 2002, concurrent with the implementation of a new risk-based capital rule issued by OFHEO, we reclassiÑed $124 billion of securities in our mortgage portfolio fromheld-to-maturity to available-for-sale in accordance with Financial Accounting Standard No. 115, Accountingfor Certain Investments in Debt and Equity Securities (""FAS 115''). At the time of this noncash transfer,these mortgage-related securities had gross unrealized gains of $5.364 billion and unrealized losses of$53 million. Table 10 shows gross unrealized gains and losses on our MBS and mortgage-related securities atthe end of 2002, 2001, and 2000.
43

Table 10: Mortgage-Related Securities in Mortgage Portfolio
2002
Gross GrossAmortized Unrealized Unrealized Fair
Cost(1) Gains Losses Value
(Dollars in millions)
Held-to-maturity:MBS(2) ÏÏÏÏÏÏÏÏÏÏÏÏÏÏÏÏÏÏÏÏÏÏÏÏÏÏÏÏÏÏÏÏÏÏÏÏÏÏÏÏÏÏÏÏÏÏÏÏÏÏÏÏÏÏÏÏÏÏÏ $286,422 $11,173 $ (1) $297,594REMICs and Stripped MBS ÏÏÏÏÏÏÏÏÏÏÏÏÏÏÏÏÏÏÏÏÏÏÏÏÏÏÏÏÏÏÏÏÏÏÏÏÏÏÏÏÏ 110,423 4,339 (87) 114,675Other mortgage-related securities ÏÏÏÏÏÏÏÏÏÏÏÏÏÏÏÏÏÏÏÏÏÏÏÏÏÏÏÏÏÏÏÏÏÏÏÏÏ 41,087 2,813 (45) 43,855
Total ÏÏÏÏÏÏÏÏÏÏÏÏÏÏÏÏÏÏÏÏÏÏÏÏÏÏÏÏÏÏÏÏÏÏÏÏÏÏÏÏÏÏÏÏÏÏÏÏÏÏÏÏÏÏÏÏÏÏÏ $437,932 $18,325 $(133) $456,124
Available-for-sale:MBS(2) ÏÏÏÏÏÏÏÏÏÏÏÏÏÏÏÏÏÏÏÏÏÏÏÏÏÏÏÏÏÏÏÏÏÏÏÏÏÏÏÏÏÏÏÏÏÏÏÏÏÏÏÏÏÏÏÏÏÏÏ $116,081 $ 5,425 $ (1) $121,505REMICs and Stripped MBS ÏÏÏÏÏÏÏÏÏÏÏÏÏÏÏÏÏÏÏÏÏÏÏÏÏÏÏÏÏÏÏÏÏÏÏÏÏÏÏÏÏ 33,763 678 (369) 34,072Other mortgage-related securities ÏÏÏÏÏÏÏÏÏÏÏÏÏÏÏÏÏÏÏÏÏÏÏÏÏÏÏÏÏÏÏÏÏÏÏÏÏ 17,358 782 (11) 18,129
Total ÏÏÏÏÏÏÏÏÏÏÏÏÏÏÏÏÏÏÏÏÏÏÏÏÏÏÏÏÏÏÏÏÏÏÏÏÏÏÏÏÏÏÏÏÏÏÏÏÏÏÏÏÏÏÏÏÏÏÏ $167,202 $ 6,885 $(381) $173,706
2001
Gross GrossAmortized Unrealized Unrealized Fair
Cost(1) Gains Losses Value
Held-to-maturity:MBS(2) ÏÏÏÏÏÏÏÏÏÏÏÏÏÏÏÏÏÏÏÏÏÏÏÏÏÏÏÏÏÏÏÏÏÏÏÏÏÏÏÏÏÏÏÏÏÏÏÏÏÏÏÏÏÏÏÏÏÏÏ $333,896 $3,536 $ (54) $337,378REMICs and Stripped MBS ÏÏÏÏÏÏÏÏÏÏÏÏÏÏÏÏÏÏÏÏÏÏÏÏÏÏÏÏÏÏÏÏÏÏÏÏÏÏÏÏÏ 127,675 2,432 (579) 129,528Other mortgage-related securities ÏÏÏÏÏÏÏÏÏÏÏÏÏÏÏÏÏÏÏÏÏÏÏÏÏÏÏÏÏÏÏÏÏÏÏÏÏ 47,584 1,411 (87) 48,908
Total ÏÏÏÏÏÏÏÏÏÏÏÏÏÏÏÏÏÏÏÏÏÏÏÏÏÏÏÏÏÏÏÏÏÏÏÏÏÏÏÏÏÏÏÏÏÏÏÏÏÏÏÏÏÏÏÏÏÏÏ $509,155 $7,379 $(720) $515,814
Available-for-sale:MBS(2) ÏÏÏÏÏÏÏÏÏÏÏÏÏÏÏÏÏÏÏÏÏÏÏÏÏÏÏÏÏÏÏÏÏÏÏÏÏÏÏÏÏÏÏÏÏÏÏÏÏÏÏÏÏÏÏÏÏÏÏ $ 9,119 $ 105 $ (27) $ 9,197REMICs and Stripped MBS ÏÏÏÏÏÏÏÏÏÏÏÏÏÏÏÏÏÏÏÏÏÏÏÏÏÏÏÏÏÏÏÏÏÏÏÏÏÏÏÏÏ 1,083 211 (240) 1,054Other mortgage-related securities ÏÏÏÏÏÏÏÏÏÏÏÏÏÏÏÏÏÏÏÏÏÏÏÏÏÏÏÏÏÏÏÏÏÏÏÏÏ 22,236 425 (12) 22,649
Total ÏÏÏÏÏÏÏÏÏÏÏÏÏÏÏÏÏÏÏÏÏÏÏÏÏÏÏÏÏÏÏÏÏÏÏÏÏÏÏÏÏÏÏÏÏÏÏÏÏÏÏÏÏÏÏÏÏÏÏ $ 32,438 $ 741 $(279) $ 32,900
2000
Gross GrossAmortized Unrealized Unrealized Fair
Cost(1) Gains Losses Value
Held-to-maturity:MBS(2) ÏÏÏÏÏÏÏÏÏÏÏÏÏÏÏÏÏÏÏÏÏÏÏÏÏÏÏÏÏÏÏÏÏÏÏÏÏÏÏÏÏÏÏÏÏÏÏÏÏÏÏÏÏÏÏÏÏÏÏ $272,829 $3,414 $(1,414) $274,829REMICs and Stripped MBS ÏÏÏÏÏÏÏÏÏÏÏÏÏÏÏÏÏÏÏÏÏÏÏÏÏÏÏÏÏÏÏÏÏÏÏÏÏÏÏÏÏ 114,022 1,736 (652) 115,106Other mortgage-related securities ÏÏÏÏÏÏÏÏÏÏÏÏÏÏÏÏÏÏÏÏÏÏÏÏÏÏÏÏÏÏÏÏÏÏÏÏÏ 57,021 760 (178) 57,603
Total ÏÏÏÏÏÏÏÏÏÏÏÏÏÏÏÏÏÏÏÏÏÏÏÏÏÏÏÏÏÏÏÏÏÏÏÏÏÏÏÏÏÏÏÏÏÏÏÏÏÏÏÏÏÏÏÏÏÏÏ $443,872 $5,910 $(2,244) $447,538
Available-for-sale:MBS(2) ÏÏÏÏÏÏÏÏÏÏÏÏÏÏÏÏÏÏÏÏÏÏÏÏÏÏÏÏÏÏÏÏÏÏÏÏÏÏÏÏÏÏÏÏÏÏÏÏÏÏÏÏÏÏÏÏÏÏÏ $ 2,814 $ 18 $ (7) $ 2,825REMICs and Stripped MBS ÏÏÏÏÏÏÏÏÏÏÏÏÏÏÏÏÏÏÏÏÏÏÏÏÏÏÏÏÏÏÏÏÏÏÏÏÏÏÏÏÏ 220 57 (64) 213Other mortgage-related securities ÏÏÏÏÏÏÏÏÏÏÏÏÏÏÏÏÏÏÏÏÏÏÏÏÏÏÏÏÏÏÏÏÏÏÏÏÏ 8,403 33 (40) 8,396
Total ÏÏÏÏÏÏÏÏÏÏÏÏÏÏÏÏÏÏÏÏÏÏÏÏÏÏÏÏÏÏÏÏÏÏÏÏÏÏÏÏÏÏÏÏÏÏÏÏÏÏÏÏÏÏÏÏÏÏÏ $ 11,437 $ 108 $ (111) $ 11,434
(1) Amortized cost includes unamortized premiums, discounts, and other deferred price adjustments.(2) Excludes REMICs and Stripped MBS.
Nonmortgage Investments
Nonmortgage investments consist of the LIP and other investments. We classify and account for theseinvestments as either held-to-maturity or available-for-sale according to FAS 115. Concurrent with theSeptember 13, 2002 implementation of our new risk-based capital rule, we reclassiÑed securities in ournonmortgage investment portfolio that had an amortized cost of $11 billion from held-to-maturity to available-for-sale in accordance with FAS 115. These nonmortgage securities had gross unrealized gains of $139 millionand unrealized losses of $6 million at the time of this noncash transfer. Nonmortgage investments decreased20 percent to $60 billion at December 31, 2002, from $75 billion at December 31, 2001. Our nonmortgageinvestments totaled $55 billion at December 31, 2000. Tables 11 and 12 show the composition, weighted-average maturities, and credit ratings of our held-to-maturity and available-for-sale nonmortgage investments.
44

Table 11: Nonmortgage Investments ClassiÑed as Held-to-Maturity
2002
Weighted-Gross Gross Average
Amortized Unrealized Unrealized Fair Maturity % Rated ACost Gains Losses Value in Months or Better
(Dollars in millions)
Held-to-maturity:Repurchase agreementsÏÏÏÏÏÏÏÏÏÏÏÏÏÏÏ $20,732 $Ì $Ì $20,732 .5 100.0Eurodollar time deposits ÏÏÏÏÏÏÏÏÏÏÏÏÏÏ 1,398 Ì Ì 1,398 .8 100.0Auction rate preferred stock ÏÏÏÏÏÏÏÏÏÏÏ 402 Ì Ì 402 1.0 100.0Federal funds ÏÏÏÏÏÏÏÏÏÏÏÏÏÏÏÏÏÏÏÏÏÏÏ 150 Ì Ì 150 1.9 100.0Commercial paper ÏÏÏÏÏÏÏÏÏÏÏÏÏÏÏÏÏÏÏ 100 Ì Ì 100 .7 100.0Other ÏÏÏÏÏÏÏÏÏÏÏÏÏÏÏÏÏÏÏÏÏÏÏÏÏÏÏÏÏÏ 268 1 Ì 269 4.9 100.0
Total ÏÏÏÏÏÏÏÏÏÏÏÏÏÏÏÏÏÏÏÏÏÏÏÏÏÏÏÏ $23,050 $ 1 $Ì $23,051 .6 100.0
2001
Weighted-Gross Gross Average
Amortized Unrealized Unrealized Fair Maturity % Rated ACost Gains Losses Value in Months or Better
Held-to-maturity:Repurchase agreementsÏÏÏÏÏÏÏÏÏÏÏÏÏÏÏ $ 9,380 $ Ì $Ì $ 9,380 .5 100.0Eurodollar time deposits ÏÏÏÏÏÏÏÏÏÏÏÏÏÏ 11,185 Ì Ì 11,185 .3 100.0Auction rate preferred stock ÏÏÏÏÏÏÏÏÏÏÏ 2,127 Ì Ì 2,127 1.7 100.0Federal funds ÏÏÏÏÏÏÏÏÏÏÏÏÏÏÏÏÏÏÏÏÏÏÏ 4,904 Ì Ì 4,904 .4 100.0Commercial paper ÏÏÏÏÏÏÏÏÏÏÏÏÏÏÏÏÏÏÏ 2,844 1 Ì 2,845 .6 100.0Asset-backed securities ÏÏÏÏÏÏÏÏÏÏÏÏÏÏÏ 6,065 89 (1) 6,153 10.6 100.0Other ÏÏÏÏÏÏÏÏÏÏÏÏÏÏÏÏÏÏÏÏÏÏÏÏÏÏÏÏÏÏ 2,166 73 Ì 2,239 16.7 56.4
Total ÏÏÏÏÏÏÏÏÏÏÏÏÏÏÏÏÏÏÏÏÏÏÏÏÏÏÏÏ $38,671 $163 $(1) $38,833 3.0 97.5
2000
Weighted-Gross Gross Average
Amortized Unrealized Unrealized Fair Maturity % Rated ACost Gains Losses Value in Months or Better
Held-to-maturity:Repurchase agreementsÏÏÏÏÏÏÏÏÏÏÏÏÏÏÏ $ 2,722 $Ì $ Ì $ 2,722 .5 100.0Eurodollar time deposits ÏÏÏÏÏÏÏÏÏÏÏÏÏÏ 4,046 Ì Ì 4,046 1.2 100.0Auction rate preferred stock ÏÏÏÏÏÏÏÏÏÏÏ 1,812 Ì Ì 1,812 1.9 98.6Federal funds ÏÏÏÏÏÏÏÏÏÏÏÏÏÏÏÏÏÏÏÏÏÏÏ 3,493 Ì Ì 3,493 2.1 100.0Commercial paper ÏÏÏÏÏÏÏÏÏÏÏÏÏÏÏÏÏÏÏ 8,893 2 Ì 8,895 .7 90.1Asset-backed securities ÏÏÏÏÏÏÏÏÏÏÏÏÏÏÏ 9,043 30 (7) 9,066 22.6 100.0Other ÏÏÏÏÏÏÏÏÏÏÏÏÏÏÏÏÏÏÏÏÏÏÏÏÏÏÏÏÏÏ 3,823 40 (11) 3,852 17.6 100.0
Total ÏÏÏÏÏÏÏÏÏÏÏÏÏÏÏÏÏÏÏÏÏÏÏÏÏÏÏÏ $33,832 $72 $(18) $33,886 8.7 97.3
45
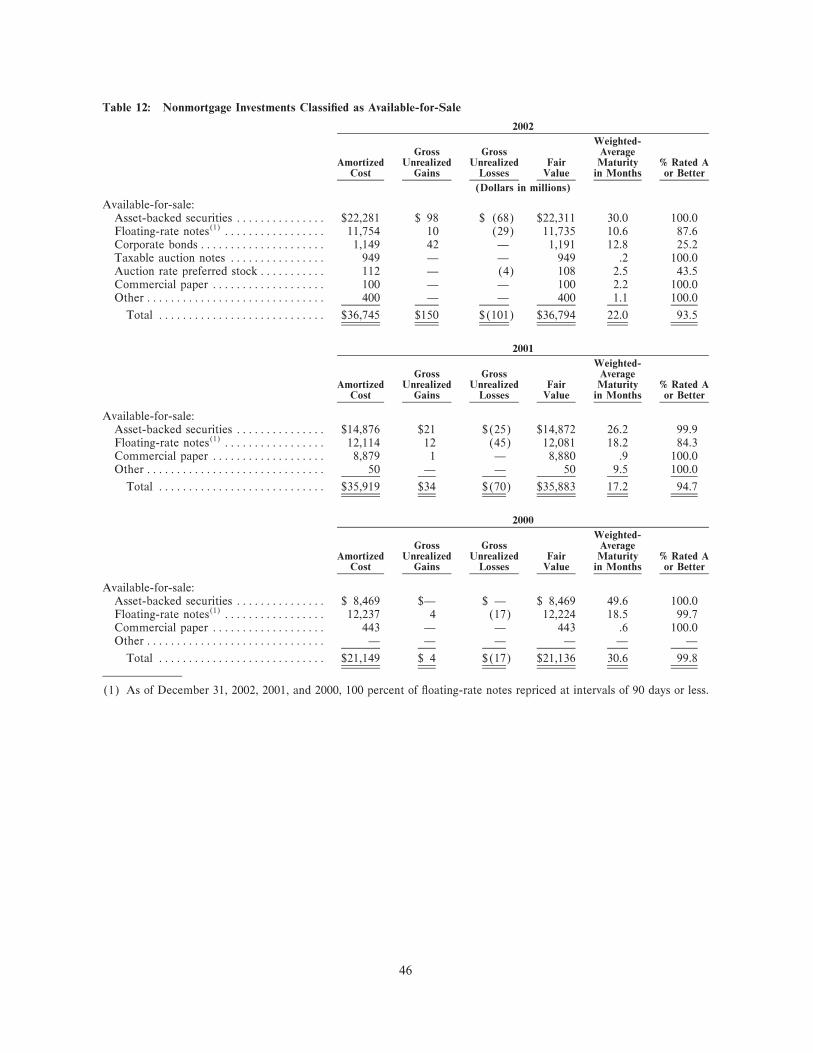
Table 12: Nonmortgage Investments ClassiÑed as Available-for-Sale
2002
Weighted-Gross Gross Average
Amortized Unrealized Unrealized Fair Maturity % Rated ACost Gains Losses Value in Months or Better
(Dollars in millions)
Available-for-sale:Asset-backed securities ÏÏÏÏÏÏÏÏÏÏÏÏÏÏÏ $22,281 $ 98 $ (68) $22,311 30.0 100.0Floating-rate notes(1) ÏÏÏÏÏÏÏÏÏÏÏÏÏÏÏÏÏ 11,754 10 (29) 11,735 10.6 87.6Corporate bonds ÏÏÏÏÏÏÏÏÏÏÏÏÏÏÏÏÏÏÏÏÏ 1,149 42 Ì 1,191 12.8 25.2Taxable auction notes ÏÏÏÏÏÏÏÏÏÏÏÏÏÏÏÏ 949 Ì Ì 949 .2 100.0Auction rate preferred stock ÏÏÏÏÏÏÏÏÏÏÏ 112 Ì (4) 108 2.5 43.5Commercial paper ÏÏÏÏÏÏÏÏÏÏÏÏÏÏÏÏÏÏÏ 100 Ì Ì 100 2.2 100.0Other ÏÏÏÏÏÏÏÏÏÏÏÏÏÏÏÏÏÏÏÏÏÏÏÏÏÏÏÏÏÏ 400 Ì Ì 400 1.1 100.0
Total ÏÏÏÏÏÏÏÏÏÏÏÏÏÏÏÏÏÏÏÏÏÏÏÏÏÏÏÏ $36,745 $150 $(101) $36,794 22.0 93.5
2001
Weighted-Gross Gross Average
Amortized Unrealized Unrealized Fair Maturity % Rated ACost Gains Losses Value in Months or Better
Available-for-sale:Asset-backed securities ÏÏÏÏÏÏÏÏÏÏÏÏÏÏÏ $14,876 $21 $(25) $14,872 26.2 99.9Floating-rate notes(1) ÏÏÏÏÏÏÏÏÏÏÏÏÏÏÏÏÏ 12,114 12 (45) 12,081 18.2 84.3Commercial paper ÏÏÏÏÏÏÏÏÏÏÏÏÏÏÏÏÏÏÏ 8,879 1 Ì 8,880 .9 100.0Other ÏÏÏÏÏÏÏÏÏÏÏÏÏÏÏÏÏÏÏÏÏÏÏÏÏÏÏÏÏÏ 50 Ì Ì 50 9.5 100.0
Total ÏÏÏÏÏÏÏÏÏÏÏÏÏÏÏÏÏÏÏÏÏÏÏÏÏÏÏÏ $35,919 $34 $(70) $35,883 17.2 94.7
2000
Weighted-Gross Gross Average
Amortized Unrealized Unrealized Fair Maturity % Rated ACost Gains Losses Value in Months or Better
Available-for-sale:Asset-backed securities ÏÏÏÏÏÏÏÏÏÏÏÏÏÏÏ $ 8,469 $Ì $ Ì $ 8,469 49.6 100.0Floating-rate notes(1) ÏÏÏÏÏÏÏÏÏÏÏÏÏÏÏÏÏ 12,237 4 (17) 12,224 18.5 99.7Commercial paper ÏÏÏÏÏÏÏÏÏÏÏÏÏÏÏÏÏÏÏ 443 Ì Ì 443 .6 100.0Other ÏÏÏÏÏÏÏÏÏÏÏÏÏÏÏÏÏÏÏÏÏÏÏÏÏÏÏÏÏÏ Ì Ì Ì Ì Ì Ì
Total ÏÏÏÏÏÏÏÏÏÏÏÏÏÏÏÏÏÏÏÏÏÏÏÏÏÏÏÏ $21,149 $ 4 $(17) $21,136 30.6 99.8
(1) As of December 31, 2002, 2001, and 2000, 100 percent of Öoating-rate notes repriced at intervals of 90 days or less.
46

Nonmortgage investments rated below single A totaled $2.4 billion and equaled 8.5 percent of our corecapital at December 31, 2002, $2.9 billion and 11.4 percent of core capital at December 31, 2001, and$1 billion and 4.6 percent of core capital at December 31, 2000.
Our nonmortgage investments serve as Fannie Mae's primary source of liquidity and an investmentvehicle for our surplus capital. Nonmortgage investments include our early funding portfolio, which consistsprimarily of repurchase agreements, and our LIP. Our LIP consists primarily of high-quality securities thatare short-term or readily marketable and includes investments in nonmortgage assets, such as federal fundsand time deposits, commercial paper, asset-backed securities, and corporate Öoating-rate notes. The majorityof LIP investments classiÑed as held-to-maturity consist of federal funds and time deposits and auction ratepreferred stock with maturities of three months or less. We obtain liquidity from our LIP through maturity ofshort-term investments or the sale of assets. Investments in our LIP totaled $39 billion at December 31, 2002,compared with $65 billion at year-end 2001 and $52 billion at year-end 2000. At the end of 2001, our LIPbalance was at the highest level of the past three years because of delayed settlement of 2001 portfoliopurchase commitments, which resulted in additional temporary capital for short-term investment in the LIP.
The LIP combined with our early funding portfolio and cash and cash equivalents represent our totalliquid investments. The average yield on liquid investments during 2002, 2001, and 2000 was 2.34 percent,4.63 percent, and 6.60 percent, respectively. The average yield decreased during 2002 and 2001 because of thesharp drop in short-term interest rates.
Debt Securities
As part of our disciplined interest rate risk management strategy, we issue a variety of noncallable andcallable debt securities in the domestic and global capital markets in a wide range of maturities to meet ourlarge and consistent funding needs. We strive to structure debt products that match the needs of our portfoliowith the interests of debt investors. A description of our principal debt securities follows.
‚ Benchmark Securities» Program
Our Benchmark Securities program encompasses large, regularly scheduled issues of noncallable andcallable debt securities designed to provide enhanced liquidity to investors while reducing the relative costof debt. By issuing Benchmark Securities, we have consolidated much of our debt issuances from a largenumber of smaller, unscheduled issues to a smaller number of larger, more liquid scheduled issues.
During 2002, we issued noncallable and callable Benchmark Securities in every month. Benchmark Bills»served as our weekly source for three-month and six-month discount debt issuances during the year. Weissued one-year Benchmark Bills on a biweekly schedule during 2002 and 2001. Our issuances ofBenchmark Bills totaled $420 billion, $437 billion, and $334 billion in 2002, 2001, and 2000, respectively.Issuances of Benchmark Bonds» and Benchmark Notes totaled $89 billion, $100 billion, and $77 billion,respectively, during the same period. Benchmark Notes have maturities of one to ten years, andBenchmark Bonds have maturities of more than ten years. We reintroduced Fannie Mae's CallableBenchmark Notes in June 2001 and issued $22 billion and $10 billion of these securities during 2002 and2001, respectively.
‚ Discount Notes and Other Debt Securities
We also issue other debt securities outside Fannie Mae's Benchmark Securities program. These debtsecurities have various maturities, interest rates, and call provisions. We issue short-term debt securitiescalled ""Discount Notes'' outside of our Benchmark Bills program. We sell discount notes at a marketdiscount from the principal amount payable at maturity. They have maturities ranging from overnight to360 days from the date of issuance and are available in minimum amounts of $1,000. We issued$1.107 trillion and $1.216 trillion of Discount Notes during 2002 and 2001, respectively. Outstandingdiscount notes increased to $134 billion at year-end 2002 from $93 billion at year-end 2001.
47

‚ Subordinated Debt
As part of our voluntary safety and soundness initiatives announced in October 2000, we began issuingSubordinated Benchmark Notes in the Ñrst quarter of 2001 on a periodic basis, which created a new classof Ñxed-income investments for investors under the Benchmark Securities program. We issued subordi-nated debt securities totaling $3.5 billion and $5.0 billion during 2002 and 2001, respectively. OutstandingSubordinated Benchmark Notes totaled $8.5 billion at December 31, 2002, versus $5.0 billion at the endof 2001.
Total debt outstanding increased 11 percent to $851 billion at December 31, 2002, from $763 billion atDecember 31, 2001. Table 13 summarizes our outstanding debt due within one year at the end of 2002, 2001,and 2000. Table 14 shows a comparison of our debt issuances and repayments for 2002, 2001, and 2000, thetotal outstanding at the end of each year, and the average cost.
48

Table 13: Outstanding Debt Due Within One Year
2002
MaximumOutstanding at Average Outstanding OutstandingDecember 31, During Year at Any
Amount Cost(1) Amount Cost(1) Month-end
(Dollars in millions)
Short-term notes ÏÏÏÏÏÏÏÏÏÏÏÏÏÏÏÏÏÏÏÏÏÏÏÏÏÏÏÏÏÏÏÏ $290,091 1.55% $252,857 1.98% $290,091
Other short-term debtÏÏÏÏÏÏÏÏÏÏÏÏÏÏÏÏÏÏÏÏÏÏÏÏÏÏÏÏ 12,522 1.33 18,512 1.70 28,126
Current portion of borrowings due after one year(2):
Universal Standard Debt ÏÏÏÏÏÏÏÏÏÏÏÏÏÏÏÏÏÏÏÏÏÏÏ 41,681 2.25
Universal Benchmark Debt ÏÏÏÏÏÏÏÏÏÏÏÏÏÏÏÏÏÏÏÏÏ 37,376 4.89
Universal Retail Debt ÏÏÏÏÏÏÏÏÏÏÏÏÏÏÏÏÏÏÏÏÏÏÏÏÏÏ 73 9.52
Other ÏÏÏÏÏÏÏÏÏÏÏÏÏÏÏÏÏÏÏÏÏÏÏÏÏÏÏÏÏÏÏÏÏÏÏÏÏÏÏ 669 3.24
Total due within one year ÏÏÏÏÏÏÏÏÏÏÏÏÏÏÏÏÏÏÏÏÏÏÏÏ $382,412 1.95%
2001
MaximumOutstanding at Average Outstanding OutstandingDecember 31, During Year at Any
Amount Cost(1) Amount Cost(1) Month-end
Short-term notes ÏÏÏÏÏÏÏÏÏÏÏÏÏÏÏÏÏÏÏÏÏÏÏÏÏÏÏÏÏÏÏÏ $256,905 2.58% $247,060 4.31% $265,953
Other short-term debtÏÏÏÏÏÏÏÏÏÏÏÏÏÏÏÏÏÏÏÏÏÏÏÏÏÏÏÏ 29,891 1.96 31,479 4.40 43,811
Current portion of borrowings due after one year(2):
Universal Standard Debt ÏÏÏÏÏÏÏÏÏÏÏÏÏÏÏÏÏÏÏÏÏÏÏ 34,413 3.67
Universal Benchmark Debt ÏÏÏÏÏÏÏÏÏÏÏÏÏÏÏÏÏÏÏÏÏ 21,987 5.31
Universal Retail Debt ÏÏÏÏÏÏÏÏÏÏÏÏÏÏÏÏÏÏÏÏÏÏÏÏÏÏ Ì Ì
Other ÏÏÏÏÏÏÏÏÏÏÏÏÏÏÏÏÏÏÏÏÏÏÏÏÏÏÏÏÏÏÏÏÏÏÏÏÏÏÏ 296 4.96
Total due within one year ÏÏÏÏÏÏÏÏÏÏÏÏÏÏÏÏÏÏÏÏÏÏÏÏ $343,492 2.81%
2000
MaximumOutstanding at Average Outstanding OutstandingDecember 31, During Year at Any
Amount Cost(1) Amount Cost(1) Month-end
Short-term notes ÏÏÏÏÏÏÏÏÏÏÏÏÏÏÏÏÏÏÏÏÏÏÏÏÏÏÏÏÏÏÏÏ $178,292 6.50% $150,242 6.33% $178,292
Other short-term debtÏÏÏÏÏÏÏÏÏÏÏÏÏÏÏÏÏÏÏÏÏÏÏÏÏÏÏÏ 42,157 6.58 37,880 6.36 42,157
Current portion of borrowings due after one year(2):
Universal Standard Debt ÏÏÏÏÏÏÏÏÏÏÏÏÏÏÏÏÏÏÏÏÏÏÏ 51,185 6.02
Universal Benchmark Debt ÏÏÏÏÏÏÏÏÏÏÏÏÏÏÏÏÏÏÏÏÏ 6,984 5.71
Universal Retail Debt ÏÏÏÏÏÏÏÏÏÏÏÏÏÏÏÏÏÏÏÏÏÏÏÏÏÏ 785 6.62
Other ÏÏÏÏÏÏÏÏÏÏÏÏÏÏÏÏÏÏÏÏÏÏÏÏÏÏÏÏÏÏÏÏÏÏÏÏÏÏÏ 919 6.57
Total due within one year ÏÏÏÏÏÏÏÏÏÏÏÏÏÏÏÏÏÏÏÏÏÏÏÏ $280,322 6.38%
(1) Represents weighted-average cost, which includes the amortization of discounts, premiums, issuance costs, hedgingresults, and the eÅects of currency and debt swaps. Averages have been calculated on a monthly average basis.
(2) Information on average amount and cost of debt outstanding during the year and maximum amount outstanding atany month-end is not meaningful. See ""Table 14ÌShort-Term and Long-Term Debt Activity'' for additionalinformation.
49

Table 14: Short-Term and Long-Term Debt Activity
2002 2001 2000
(Dollars in millions)
Issued during the year:
Short-term(1):
Amount ÏÏÏÏÏÏÏÏÏÏÏÏÏÏÏÏÏÏÏÏÏÏÏÏÏÏÏÏÏÏÏÏÏÏÏÏÏÏÏÏÏÏÏÏÏÏÏÏÏÏÏÏÏÏÏÏÏ $1,635,919 $1,756,691 $1,143,131
Average cost ÏÏÏÏÏÏÏÏÏÏÏÏÏÏÏÏÏÏÏÏÏÏÏÏÏÏÏÏÏÏÏÏÏÏÏÏÏÏÏÏÏÏÏÏÏÏÏÏÏÏÏÏÏ 1.67% 3.69% 6.27%
Long-term(1):
Amount ÏÏÏÏÏÏÏÏÏÏÏÏÏÏÏÏÏÏÏÏÏÏÏÏÏÏÏÏÏÏÏÏÏÏÏÏÏÏÏÏÏÏÏÏÏÏÏÏÏÏÏÏÏÏÏÏÏ $ 238,467 $ 249,352 $ 110,215
Average cost ÏÏÏÏÏÏÏÏÏÏÏÏÏÏÏÏÏÏÏÏÏÏÏÏÏÏÏÏÏÏÏÏÏÏÏÏÏÏÏÏÏÏÏÏÏÏÏÏÏÏÏÏÏ 3.78% 4.83% 6.92%
Total issued:
Amount ÏÏÏÏÏÏÏÏÏÏÏÏÏÏÏÏÏÏÏÏÏÏÏÏÏÏÏÏÏÏÏÏÏÏÏÏÏÏÏÏÏÏÏÏÏÏÏÏÏÏÏÏÏÏÏÏÏ $1,874,386 $2,006,043 $1,253,346
Average cost ÏÏÏÏÏÏÏÏÏÏÏÏÏÏÏÏÏÏÏÏÏÏÏÏÏÏÏÏÏÏÏÏÏÏÏÏÏÏÏÏÏÏÏÏÏÏÏÏÏÏÏÏÏ 2.21% 3.97% 6.34%
Repaid during the year:
Short-term(1):
Amount ÏÏÏÏÏÏÏÏÏÏÏÏÏÏÏÏÏÏÏÏÏÏÏÏÏÏÏÏÏÏÏÏÏÏÏÏÏÏÏÏÏÏÏÏÏÏÏÏÏÏÏÏÏÏÏÏÏ $1,620,644 $1,691,240 $1,106,956
Average cost ÏÏÏÏÏÏÏÏÏÏÏÏÏÏÏÏÏÏÏÏÏÏÏÏÏÏÏÏÏÏÏÏÏÏÏÏÏÏÏÏÏÏÏÏÏÏÏÏÏÏÏÏÏ 1.84% 4.22% 6.15%
Long-term(1):
Amount ÏÏÏÏÏÏÏÏÏÏÏÏÏÏÏÏÏÏÏÏÏÏÏÏÏÏÏÏÏÏÏÏÏÏÏÏÏÏÏÏÏÏÏÏÏÏÏÏÏÏÏÏÏÏÏÏÏ $ 175,809 $ 196,610 $ 50,335
Average cost ÏÏÏÏÏÏÏÏÏÏÏÏÏÏÏÏÏÏÏÏÏÏÏÏÏÏÏÏÏÏÏÏÏÏÏÏÏÏÏÏÏÏÏÏÏÏÏÏÏÏÏÏÏ 4.85% 6.03% 6.33%
Total repaid:
Amount ÏÏÏÏÏÏÏÏÏÏÏÏÏÏÏÏÏÏÏÏÏÏÏÏÏÏÏÏÏÏÏÏÏÏÏÏÏÏÏÏÏÏÏÏÏÏÏÏÏÏÏÏÏÏÏÏÏ $1,796,453 $1,887,850 $1,157,291
Average cost ÏÏÏÏÏÏÏÏÏÏÏÏÏÏÏÏÏÏÏÏÏÏÏÏÏÏÏÏÏÏÏÏÏÏÏÏÏÏÏÏÏÏÏÏÏÏÏÏÏÏÏÏÏ 2.34% 4.47% 6.14%
Outstanding at year-end:
Due within one year:
Net amountÏÏÏÏÏÏÏÏÏÏÏÏÏÏÏÏÏÏÏÏÏÏÏÏÏÏÏÏÏÏÏÏÏÏÏÏÏÏÏÏÏÏÏÏÏÏÏÏÏÏÏÏÏÏ $ 382,412 $ 343,492 $ 280,322
Cost(2) ÏÏÏÏÏÏÏÏÏÏÏÏÏÏÏÏÏÏÏÏÏÏÏÏÏÏÏÏÏÏÏÏÏÏÏÏÏÏÏÏÏÏÏÏÏÏÏÏÏÏÏÏÏÏÏÏÏÏ 1.95% 2.81% 6.40%
Average term in months(4) ÏÏÏÏÏÏÏÏÏÏÏÏÏÏÏÏÏÏÏÏÏÏÏÏÏÏÏÏÏÏÏÏÏÏÏÏÏÏÏÏÏ 5 4 5
Due after one year:
Net amountÏÏÏÏÏÏÏÏÏÏÏÏÏÏÏÏÏÏÏÏÏÏÏÏÏÏÏÏÏÏÏÏÏÏÏÏÏÏÏÏÏÏÏÏÏÏÏÏÏÏÏÏÏÏ $ 468,570 $ 419,975 $ 362,360
Cost(2) ÏÏÏÏÏÏÏÏÏÏÏÏÏÏÏÏÏÏÏÏÏÏÏÏÏÏÏÏÏÏÏÏÏÏÏÏÏÏÏÏÏÏÏÏÏÏÏÏÏÏÏÏÏÏÏÏÏÏ 5.14% 5.52% 6.46%
Average term in months(4) ÏÏÏÏÏÏÏÏÏÏÏÏÏÏÏÏÏÏÏÏÏÏÏÏÏÏÏÏÏÏÏÏÏÏÏÏÏÏÏÏÏ 67 70 76
Total debt:
Net amountÏÏÏÏÏÏÏÏÏÏÏÏÏÏÏÏÏÏÏÏÏÏÏÏÏÏÏÏÏÏÏÏÏÏÏÏÏÏÏÏÏÏÏÏÏÏÏÏÏÏÏÏÏÏ $ 850,982 $ 763,467 $ 642,682
Cost(3) ÏÏÏÏÏÏÏÏÏÏÏÏÏÏÏÏÏÏÏÏÏÏÏÏÏÏÏÏÏÏÏÏÏÏÏÏÏÏÏÏÏÏÏÏÏÏÏÏÏÏÏÏÏÏÏÏÏÏ 4.81% 5.49% 6.47%
Average term in months(4) ÏÏÏÏÏÏÏÏÏÏÏÏÏÏÏÏÏÏÏÏÏÏÏÏÏÏÏÏÏÏÏÏÏÏÏÏÏÏÏÏÏ 58 66 69
(1) ""Short-term'' refers to the face amount of debt issued with an original term of one year or less. ""Long-term'' refers tothe face amount of debt issued with an original term greater than one year.
(2) Cost includes the eÅects of currency, debt, and amortization of premiums, discounts, issuance costs, and hedgingresults.
(3) Cost includes the eÅects of currency, debt, and interest rate swaps and amortization of premiums, discounts, issuancecosts, and hedging results.
(4) Average term includes the eÅects of interest rate swaps.
We took advantage of opportunities to repurchase $8 billion of debt in 2002 and $9 billion of debt in 2001that was trading at historically wide spreads to other Ñxed-income securities. In addition, we continued to callsigniÑcant levels of debt in 2002 as a result of the sharp decline in interest rates that began in 2001. We called$174 billion in debt and interest rate swaps in 2002 and $173 billion in 2001. We reissued much of this debtwith short-term maturities in anticipation of the expected increase in mortgage liquidations. Interest rateswaps lengthened the weighted-average Ñnal maturity of our outstanding debt by 20 months at December 31,2002, down from 26 months at December 31, 2001. Table 15 shows our adjusted eÅective short- and long-term debt at the end of 2002, 2001, and 2000.
50

Table 15: EÅective Short-Term and Long-Term Debt
2002 2001 2000
(Dollars in millions)
Outstanding at year-end:
Short-term(1):
Net amount ÏÏÏÏÏÏÏÏÏÏÏÏÏÏÏÏÏÏÏÏÏÏÏÏÏÏÏÏÏÏÏÏÏÏÏÏÏÏÏÏÏÏÏÏÏÏÏÏÏÏÏÏÏÏÏÏÏÏ $192,702 $138,986 $103,852
CostÏÏÏÏÏÏÏÏÏÏÏÏÏÏÏÏÏÏÏÏÏÏÏÏÏÏÏÏÏÏÏÏÏÏÏÏÏÏÏÏÏÏÏÏÏÏÏÏÏÏÏÏÏÏÏÏÏÏÏÏÏÏÏÏÏ 1.52% 2.75% 6.13%
Weighted-average maturity (in months) ÏÏÏÏÏÏÏÏÏÏÏÏÏÏÏÏÏÏÏÏÏÏÏÏÏÏÏÏÏÏÏÏÏÏ 3 5 5
Percent of total debt outstandingÏÏÏÏÏÏÏÏÏÏÏÏÏÏÏÏÏÏÏÏÏÏÏÏÏÏÏÏÏÏÏÏÏÏÏÏÏÏÏÏÏ 23% 18% 16%
Long-term(2):
Net amount ÏÏÏÏÏÏÏÏÏÏÏÏÏÏÏÏÏÏÏÏÏÏÏÏÏÏÏÏÏÏÏÏÏÏÏÏÏÏÏÏÏÏÏÏÏÏÏÏÏÏÏÏÏÏÏÏÏÏ $651,827 $627,196 $543,964
CostÏÏÏÏÏÏÏÏÏÏÏÏÏÏÏÏÏÏÏÏÏÏÏÏÏÏÏÏÏÏÏÏÏÏÏÏÏÏÏÏÏÏÏÏÏÏÏÏÏÏÏÏÏÏÏÏÏÏÏÏÏÏÏÏÏ 5.48% 5.96% 6.48%
Weighted-average maturity (in months) ÏÏÏÏÏÏÏÏÏÏÏÏÏÏÏÏÏÏÏÏÏÏÏÏÏÏÏÏÏÏÏÏÏÏ 75 78 79
Percent of total debt outstandingÏÏÏÏÏÏÏÏÏÏÏÏÏÏÏÏÏÏÏÏÏÏÏÏÏÏÏÏÏÏÏÏÏÏÏÏÏÏÏÏÏ 77% 82% 84%
Total:
Net amount(3) ÏÏÏÏÏÏÏÏÏÏÏÏÏÏÏÏÏÏÏÏÏÏÏÏÏÏÏÏÏÏÏÏÏÏÏÏÏÏÏÏÏÏÏÏÏÏÏÏÏÏÏÏÏÏÏÏ $844,529 $766,182 $647,816
CostÏÏÏÏÏÏÏÏÏÏÏÏÏÏÏÏÏÏÏÏÏÏÏÏÏÏÏÏÏÏÏÏÏÏÏÏÏÏÏÏÏÏÏÏÏÏÏÏÏÏÏÏÏÏÏÏÏÏÏÏÏÏÏÏÏ 4.81% 5.49% 6.47%
Weighted-average maturity (in months) ÏÏÏÏÏÏÏÏÏÏÏÏÏÏÏÏÏÏÏÏÏÏÏÏÏÏÏÏÏÏÏÏÏÏ 58 66 69
(1) Represents the redemption value of short-term debt adjusted to include the eÅect of derivative instruments thatreplicate short-term, variable-rate debt securities and exclude short-term debt securities that have been economicallyconverted into long-term debt funding through interest rate swaps.
(2) Represents the redemption value of long-term debt adjusted to include the eÅect of short-to-long interest rate swapsthat economically convert short-term debt securities into long-term debt securities and exclude long-term debtsecurities that have been economically converted into short-term funding through interest rate swaps.
(3) Represents the redemption value of outstanding debt at year-end. Excludes the eÅect of amortization of premiums,discounts, issuance costs, and hedging results.
Our asset-liability management strategies, combined with favorable market conditions for borrowing, hadthe following eÅect on the debt portfolio:
‚ The average cost of outstanding debt during 2002 decreased to 5.38 percent from 6.00 percent in 2001.At December 31, 2002 and 2001, the cost of debt outstanding was 4.81 percent and 5.49 percent,respectively.
‚ EÅective long-term debt, which takes into consideration the eÅect of derivative instruments on thematurity of long- and short-term debt, decreased to 77 percent of total debt outstanding atDecember 31, 2002 from 82 percent at year-end 2001.
‚ The weighted-average maturity of eÅective long-term, Ñxed-rate debt outstanding decreased to75 months at year-end 2002 from 78 months at year-end 2001.
‚ EÅective long-term debt as a percentage of the net mortgage portfolio decreased to 82 percent at theend of 2002 from 89 percent at the end of 2001.
‚ Option-embedded debt outstanding as a percentage of the net mortgage portfolio temporarily increasedabove historic levels to 75 percent at year-end 2002 versus 54 percent at the end of 2001. Table 16presents option-embedded debt instruments as a percentage of our net mortgage portfolio for the pastthree years. Option-based derivative instruments represented 42 percent and callable debt accountedfor 58 percent of the $601 billion in option-embedded debt outstanding at December 31, 2002. Incomparison, option-based derivative instruments and callable debt represented 38 percent and62 percent, respectively of the $378 billion in option-embedded debt outstanding at December 31,2001.
51

Table 16: Option-Embedded Debt Instruments
2002 2001 2000
(Dollars in billions)
Issued during the year ÏÏÏÏÏÏÏÏÏÏÏÏÏÏÏÏÏÏÏÏÏÏÏÏÏÏÏÏÏÏÏÏÏÏÏÏÏÏÏÏÏÏÏÏÏÏÏÏÏÏÏÏÏÏÏÏÏÏÏÏÏÏ $384 $286 $ 65
Outstanding at year-end ÏÏÏÏÏÏÏÏÏÏÏÏÏÏÏÏÏÏÏÏÏÏÏÏÏÏÏÏÏÏÏÏÏÏÏÏÏÏÏÏÏÏÏÏÏÏÏÏÏÏÏÏÏÏÏÏÏÏÏÏ 601 378 280
Percentage of total net mortgage portfolio ÏÏÏÏÏÏÏÏÏÏÏÏÏÏÏÏÏÏÏÏÏÏÏÏÏÏÏÏÏÏÏÏÏÏÏÏÏÏÏÏÏÏÏÏÏ 75% 54% 46%
Credit Guaranty Business
Core business earnings for our Credit Guaranty business grew 16 percent in 2002 to $2.179 billion and10 percent in 2001 to $1.878 billion. The increase in 2002 core business earnings was driven primarily by a23 percent increase in guaranty fee income. Guaranty fee income for our Credit Guaranty business increasedlargely due to 17 percent growth in our average book of business and a .9 basis point increase in the average feerate to 18.9 basis points. The average fee rate for our Credit Guaranty business includes the eÅect of guarantyfee income allocated to the Credit Guaranty business for managing the credit risk on mortgage-related assetsheld by the Portfolio Investment business. It therefore diÅers from our consolidated eÅective average guarantyfee rate, which excludes guaranty fees on Fannie Mae MBS held in our portfolio because these fees arereported as interest income. Growth in earnings for the Credit Guaranty business lagged growth in guarantyfee income primarily due to increases in credit enhancement expenses, higher administrative expenses, and anincrease in the eÅective tax rate. Administrative expenses increased primarily due to higher compensationcosts and expenses related to re-engineering our core infrastructure systems and relocating our primary datacenter.
Record expansion of residential mortgage debt outstanding during 2002 and 2001, combined with ourability to oÅer reliable, low-cost mortgage funds, fueled growth in our book of business. The demand forhousing was strong throughout 2002 and 2001, and borrowers also took advantage of the low interest rateenvironment to reÑnance their mortgages and extract equity from the appreciation in their homes. Residentialmortgage debt outstanding increased 12.4 percent in 2002 to $7.0 trillion, 10.3 percent in 2001 to $6.2 trillion,and 8.9 percent in 2000 to $5.6 trillion. ReÑnancings represented 62 percent of total market originations in2002 and 57 percent in 2001, compared with 19 percent in 2000. Growth in Fannie Mae's mortgage creditbook of business outpaced growth in residential mortgage debt outstanding during 2002, 2001, and 2000.
Earnings growth in 2001 for the Credit Guaranty business was also driven by an increase in guaranty fees.Guaranty fees rose 7 percent, stemming from 15 percent growth in the average book of business that morethan oÅset a 1.4 basis point drop in the average fee rate to 18.0 basis points. Despite signiÑcant growth in ourmortgage credit book of business and a softer economy, the Credit Guaranty business was successful inreducing credit losses as a percentage of Fannie Mae's average book of business to .5 basis points in 2002, from.6 basis points in 2001 and .7 basis points in 2000.
In the third quarter of 2002, we announced increases in the upfront-price adjustment Fannie Mae chargeson cash-out reÑnance mortgages with loan-to-value (""LTV'') ratios between 70.01 and 85 percent that weplan to implement during 2003. As a result of these increases, which will better compensate us for the higherrisk on these loans, the upfront-price adjustments on cash-out reÑnance mortgages we purchase or guaranteewith LTV ratios greater than 70 percent will range from 50 to 75 basis points.
In conjunction with these increases and to better align our underwriting, pricing policy, and relative riskproÑle of reÑnance transactions, we modiÑed our loan purpose deÑnitions on reÑnance transactions. We nowdeÑne cash-out reÑnance transactions as a reÑnance transaction in which the funds are used for purposes otherthan to pay oÅ an existing Ñrst mortgage lien, to pay oÅ any permissible subordinate mortgage liens, and toprovide limited unrestricted cash proceeds to the borrower. We expect the increased price adjustments, whichwill be allocated to our Credit Guaranty business, to modestly increase our future guaranty fees.
52

OFF-BALANCE SHEET TRANSACTIONS
We enter into certain oÅ-balance sheet Ñnancial arrangements to facilitate our statutory purpose ofproviding mortgage funds to the secondary market and reduce Fannie Mae's exposure to interest rateÖuctuations. These arrangements, which may involve elements of credit and interest rate risk in excess ofamounts recognized on Fannie Mae's balance sheet, primarily include guaranteed MBS and other mortgage-related securities and commitments to purchase mortgage assets or issue and guarantee MBS. Following is anoverview of our oÅ-balance sheet exposure related to these transactions, including a description of how ourMBS are created and our role in the process.
Guaranteed MBS and Other Mortgage-Related Securities
We issue MBS that are backed by mortgage loans from a single lender or from multiple lenders, or thatare transferred from our held-for-sale mortgage portfolio. Single-lender MBS are typically issued throughlender swap transactions whereby a lender exchanges pools of mortgages for MBS. Multiple-lender MBSallow several lenders to pool mortgages and receive, in return, MBS (referred to as ""Fannie Majors'')representing a proportionate share of a larger pool. Lenders may retain the MBS or sell them to otherinvestors. When we issue MBS, we assume trustee responsibilities. The loans underlying MBS are not ourassets. Therefore, we do not record them on our balance sheet except when acquired and held in our mortgageportfolio for investment purposes, nor do we record them as liabilities. In some instances we buy mortgageloans or mortgage-related securities and concurrently enter into a forward sale commitment. We designatethese loans as held-for-sale when acquired, and we sell them from the mortgage portfolio as MBS.
The Credit Guaranty business receives a guaranty fee for assuming the credit risk and guaranteeingtimely payment of scheduled principal and interest to MBS investors and investors in other mortgage-relatedsecurities. The guaranty fee varies, depending on factors such as the risk proÑle of the loans securitized as wellas the level of credit risk we assume. We are ultimately responsible for guaranteeing timely payment ofscheduled principal and interest to investors whether or not we share primary default risk on loans underlyingoutstanding MBS. We accrue a liability on our balance sheet for our guaranty obligation based on theprobability that mortgages underlying the $1.029 trillion of outstanding MBS will not perform according tocontractual terms. At December 31, 2002, we have accrued a liability of $471 million for estimated losses onour guaranty of outstanding MBS, compared with $598 million at December 31, 2001. These amounts are acomponent of the ""Guaranty liability for MBS'' line on our balance sheet.
We issue REMICs backed by single-class MBS, Stripped MBS (""SMBS''), Government NationalMortgage Association (""Ginnie Mae'') mortgage-related securities, other REMIC securities, or whole loansthat are not owned or guaranteed by Fannie Mae. The Portfolio Investment business receives transaction feesfor structuring REMICs backed by MBS, SMBS, Ginnie Mae securities, or existing Fannie Mae REMICclasses. When we issue REMICs, we assume trustee responsibilities. REMICs backed by guaranteed MBS donot subject us to any additional mortgage credit risk. We are only subject to additional credit risk if FannieMae guarantees REMICs backed by whole loans owned by other entities or private label securities. REMICsare not our assets except when acquired and held in our mortgage portfolio for investment purposes, nor do werecord them as liabilities.
Table 17 summarizes issued and outstanding amounts for guaranteed MBS and other mortgage-relatedsecurities, including REMICs, for the years ended December 31, 2002, 2001, and 2000.
53

Table 17: Guaranteed MBS and Other Mortgage-Related Securities(1)
Outstanding Issues
Held by Acquired TotalOther Investors Total(2) by Others Issued(3)
(Dollars in millions)
2002 ÏÏÏÏÏÏÏÏÏÏÏÏÏÏÏÏÏÏÏÏÏÏÏÏÏÏÏÏÏÏÏÏÏÏÏÏÏÏÏÏÏÏÏÏÏÏÏÏÏÏ $1,029,456 $1,538,287 $478,260 $723,299
2001 ÏÏÏÏÏÏÏÏÏÏÏÏÏÏÏÏÏÏÏÏÏÏÏÏÏÏÏÏÏÏÏÏÏÏÏÏÏÏÏÏÏÏÏÏÏÏÏÏÏÏ 858,867 1,290,351 344,739 525,321
2000 ÏÏÏÏÏÏÏÏÏÏÏÏÏÏÏÏÏÏÏÏÏÏÏÏÏÏÏÏÏÏÏÏÏÏÏÏÏÏÏÏÏÏÏÏÏÏÏÏÏÏ 706,684 1,057,750 105,407 210,311
(1) MBS may be resecuritized to back Fannie Megas, SMBS, or REMICs. With respect to those MBS, the amountsshown only include the principal amount of the MBS once. Amounts also include REMICs created from whole loansnot owned or guaranteed by Fannie Mae.
(2) Includes $509 billion, $431 billion, and $351 billion at December 31, 2002, 2001, and 2000, respectively, of MBS andother mortgage-related securities in Fannie Mae's portfolio.
(3) Total issued includes $245 billion, $181 billion, and $105 billion of MBS purchased by Fannie Mae in 2002, 2001, and2000, respectively. Total issued excludes $16 billion, $3 billion, and $2 billion of MBS in 2002, 2001, and 2000,respectively, that Fannie Mae issued from loans in our portfolio.
Guaranteed MBS and other mortgage-related securities held by investors other than Fannie Mae, whichwe refer to as outstanding MBS, grew 20 percent to $1.029 trillion at December 31, 2002, from $859 billion atDecember 31, 2001. REMICs that could subject Fannie Mae to additional credit exposure totaled $35 billionat December 31, 2002 or 3 percent of outstanding MBS held by investors other than Fannie Mae. Total MBS,which includes guaranteed MBS and other mortgage-related securities held in our mortgage portfolio, grew19 percent to $1.538 trillion at year-end 2002 from $1.290 trillion at year-end 2001.
MBS issues acquired by investors other than Fannie Mae increased $134 billion to $478 billion in 2002,while liquidations of outstanding MBS increased $124 billion to $324 billion. The increase in MBS issuancesand liquidations in 2002 was attributable to the decline in mortgage interest rates during the year resulting inhigher levels of mortgage originations, including reÑnancings. Total MBS issues, excluding MBS issued fromFannie Mae's portfolio, increased 38 percent to $723 billion in 2002 from $525 billion in 2001, while totalMBS liquidations grew 69 percent to $499 billion from $296 billion in 2001.
REMIC issuances totaled $144 billion in 2002, compared with $124 billion in 2001. Our REMICissuances rebounded in 2001 with the rest of the REMIC market and steadily increased in 2002. The steeperyield curve made the REMIC market more attractive, resulting in an increased demand for REMICs. Inaddition, lower interest rates contributed to higher MBS issuances and increased collateral available forREMICs. The outstanding balance of REMICs (including REMICs held in Fannie Mae's portfolio) was$347 billion at December 31, 2002, compared with $346 billion at December 31, 2001.
Commitments
Fannie Mae enters into master delivery commitments on either a mandatory or an optional basis. Under amandatory master commitment, a lender must either deliver loans under an MBS contract at a speciÑedguaranty fee rate or enter into a mandatory portfolio commitment with the yield established upon executingthe portfolio commitment. We also accept mandatory or lender-option delivery commitments not issuedpursuant to a master commitment. These commitments may be for our portfolio or for issuances of FannieMae MBS. The guaranty fee rate on MBS lender-option commitments is speciÑed in the contract, while theyield for portfolio lender-optional commitments is set at the date of conversion to a mandatory commitment.We generally hedge the cost of funding future portfolio purchases upon issuance of, or conversion to, amandatory commitment. Therefore, we largely mitigate the interest rate risk relating to loans purchasedpursuant to those commitments. Our outstanding mandatory portfolio commitments, excluding commitmentsunder master agreements, totaled $85 billion and $55 billion at December 31, 2002 and 2001, respectively.
54

APPLICATION OF CRITICAL ACCOUNTING POLICIES
Fannie Mae's Ñnancial statements and reported results are based on GAAP, which requires us in somecases to use estimates and assumptions that may aÅect our reported results and disclosures. We describe oursigniÑcant accounting policies in the Notes to Financial Statements under Note 1, ""Summary of SigniÑcantAccounting Policies.'' Several of our accounting policies involve the use of accounting estimates we considerto be critical because: (1) they are likely to change from period to period because they require signiÑcantmanagement judgment and assumptions about highly complex and uncertain matters; and (2) the use of adiÅerent estimate or a change in estimate could have a material impact on our reported results of operations orÑnancial condition. Our critical accounting estimates include determining the adequacy of the allowance forloan losses and guaranty liability for MBS; projecting mortgage prepayments to calculate the amortization ofdeferred price adjustments on mortgages and mortgage-related securities held in portfolio and guaranteedmortgage-related securities; and estimating the time value of our purchased options. Management hasspeciÑcally discussed the development and selection of each critical accounting estimate with the AuditCommittee of Fannie Mae's Board of Directors. Our Audit Committee has also reviewed our disclosures inthis MD&A regarding Fannie Mae's critical accounting estimates.
Allowance for Loan Losses and Guaranty Liability for MBS
We establish an allowance for loan losses and guaranty liability for MBS on single-family and multifamilyloans in our book of business. We maintain a separate allowance for loan losses and guaranty liability for MBS.However, we use the same methodology to determine the amounts of each because the risks are the same. Theallowance for loan losses is held against loans in our mortgage portfolio. We also have a guaranty liability forour guaranty of MBS held by us or by other investors. Our allowance and guaranty liability for MBS consist ofthe following key elements:
‚ Single-family: We evaluate various risk characteristics such as product type, original loan-to-valueratio, and loan age to determine the allowance and guaranty liability for single-family assets. Weestimate defaults for each risk characteristic based on historical experience and apply a historicalseverity to each risk category in accordance with Financial Accounting Standard No. 5, Accounting forContingencies (""FAS 5''). Severity refers to the amount of loss suÅered on a default relative to theunpaid principal balance of the loan. In addition, we apply Financial Accounting Standard No. 114,Accounting by Creditors for Impairment of a Loan (""FAS 114''), to determine the amount ofimpairment on speciÑc loans that have been restructured. We charge-oÅ single-family loans when weforeclose on the loans.
‚ Multifamily: We determine the multifamily allowance and guaranty liability by separately evaluatingloans that are impaired and all other loans. Impaired loans consist of loans that are not performingaccording to their original contractual terms. For loans that we consider impaired, we apply FAS 114 toestimate the amount of impairment. For all other loans, we apply FAS 5 to establish an allowance andguaranty liability by rating each loan not individually evaluated for impairment and segmenting theloan into one of the main risk categories we use to monitor the multifamily portfolio. We then applyhistorical default rates, adjusted for current conditions, and a corresponding severity to the loans ineach segment to estimate the probable loss amount at each balance sheet date.
We believe the accounting estimate related to our allowance for loan losses and guaranty liability forMBS is a ""critical accounting estimate'' because it requires us to make signiÑcant judgments about probablefuture losses in our book of business as of the balance sheet date based on assumptions that are uncertain. Wemay have to increase or decrease the size of our overall allowance for loan losses and guaranty liability basedon changes in delinquency levels, loss experience, economic conditions in areas of geographic concentration,and proÑle of mortgage characteristics. DiÅerent assumptions about default rates, severity, counterparty risk,and other factors that we could use in estimating our allowance for loan losses and guaranty liability couldhave a material eÅect on our results of operations.
We include the allowance for loan losses in the balance sheet under ""Mortgage portfolio, net.'' Weinclude the guaranty liability for estimated losses on MBS held by us or other investors as a liability under
55

""Guaranty liability for MBS.'' Table 18 shows the amounts of these components and summarizes the changesfor the years 1998 to 2002.
Table 18: Allowance for Loan Losses and Guaranty Liability for MBS2002 2001 2000 1999 1998
(Dollars in millions)
Allowance for loan losses(1):Beginning balance ÏÏÏÏÏÏÏÏÏÏÏÏÏÏÏÏÏÏÏÏÏÏÏÏÏÏÏÏÏÏÏÏÏÏÏÏÏÏÏÏÏÏÏÏÏ $ 48 $ 51 $ 56 $ 79 $ 131Provision ÏÏÏÏÏÏÏÏÏÏÏÏÏÏÏÏÏÏÏÏÏÏÏÏÏÏÏÏÏÏÏÏÏÏÏÏÏÏÏÏÏÏÏÏÏÏÏÏÏÏÏÏÏ 44 7 9 (5) (16)Charge-oÅs(2) ÏÏÏÏÏÏÏÏÏÏÏÏÏÏÏÏÏÏÏÏÏÏÏÏÏÏÏÏÏÏÏÏÏÏÏÏÏÏÏÏÏÏÏÏÏÏÏÏÏ (13) (10) (14) (18) (36)
Ending balance ÏÏÏÏÏÏÏÏÏÏÏÏÏÏÏÏÏÏÏÏÏÏÏÏÏÏÏÏÏÏÏÏÏÏÏÏÏÏÏÏÏÏÏÏÏÏÏÏ $ 79 $ 48 $ 51 $ 56 $ 79
Guaranty liability for MBS(1):Beginning balance ÏÏÏÏÏÏÏÏÏÏÏÏÏÏÏÏÏÏÏÏÏÏÏÏÏÏÏÏÏÏÏÏÏÏÏÏÏÏÏÏÏÏÏÏÏ $ 755 $755 $ 745 $ 720 $ 668Provision ÏÏÏÏÏÏÏÏÏÏÏÏÏÏÏÏÏÏÏÏÏÏÏÏÏÏÏÏÏÏÏÏÏÏÏÏÏÏÏÏÏÏÏÏÏÏÏÏÏÏÏÏÏ 84 87 113 156 261Charge-oÅs ÏÏÏÏÏÏÏÏÏÏÏÏÏÏÏÏÏÏÏÏÏÏÏÏÏÏÏÏÏÏÏÏÏÏÏÏÏÏÏÏÏÏÏÏÏÏÏÏÏÏÏ (110) (87) (103) (131) (209)
Ending balance ÏÏÏÏÏÏÏÏÏÏÏÏÏÏÏÏÏÏÏÏÏÏÏÏÏÏÏÏÏÏÏÏÏÏÏÏÏÏÏÏÏÏÏÏÏÏÏÏ $ 729 $755 $ 755 $ 745 $ 720
Combined allowance for loan losses and guaranty liability for MBS(3):Beginning balance ÏÏÏÏÏÏÏÏÏÏÏÏÏÏÏÏÏÏÏÏÏÏÏÏÏÏÏÏÏÏÏÏÏÏÏÏÏÏÏÏÏÏÏÏÏ $ 803 $806 $ 801 $ 799 $ 799Provision ÏÏÏÏÏÏÏÏÏÏÏÏÏÏÏÏÏÏÏÏÏÏÏÏÏÏÏÏÏÏÏÏÏÏÏÏÏÏÏÏÏÏÏÏÏÏÏÏÏÏÏÏÏ 128 94 122 151 245Charge-oÅs(2) ÏÏÏÏÏÏÏÏÏÏÏÏÏÏÏÏÏÏÏÏÏÏÏÏÏÏÏÏÏÏÏÏÏÏÏÏÏÏÏÏÏÏÏÏÏÏÏÏÏ (123) (97) (117) (149) (245)
Ending balance ÏÏÏÏÏÏÏÏÏÏÏÏÏÏÏÏÏÏÏÏÏÏÏÏÏÏÏÏÏÏÏÏÏÏÏÏÏÏÏÏÏÏÏÏÏÏÏÏ $ 808 $803 $ 806 $ 801 $ 799
Balance at end of each period attributable to(3):Single-familyÏÏÏÏÏÏÏÏÏÏÏÏÏÏÏÏÏÏÏÏÏÏÏÏÏÏÏÏÏÏÏÏÏÏÏÏÏÏÏÏÏÏÏÏÏÏÏÏÏÏ $ 641 $636 $ 639 $ 634 $ 632Multifamily ÏÏÏÏÏÏÏÏÏÏÏÏÏÏÏÏÏÏÏÏÏÏÏÏÏÏÏÏÏÏÏÏÏÏÏÏÏÏÏÏÏÏÏÏÏÏÏÏÏÏÏ 167 167 167 167 167
$ 808 $803 $ 806 $ 801 $ 799
Percent of allowance and guaranty liability in each category to relatedtotal book of business(4):Single-familyÏÏÏÏÏÏÏÏÏÏÏÏÏÏÏÏÏÏÏÏÏÏÏÏÏÏÏÏÏÏÏÏÏÏÏÏÏÏÏÏÏÏÏÏÏÏÏÏÏÏ .037% .042% .051% .055% .063%Multifamily ÏÏÏÏÏÏÏÏÏÏÏÏÏÏÏÏÏÏÏÏÏÏÏÏÏÏÏÏÏÏÏÏÏÏÏÏÏÏÏÏÏÏÏÏÏÏÏÏÏÏÏ .211 .247 .313 .359 .412
.044% .051% .061% .067% .076%
Charge-oÅs(2):Single-familyÏÏÏÏÏÏÏÏÏÏÏÏÏÏÏÏÏÏÏÏÏÏÏÏÏÏÏÏÏÏÏÏÏÏÏÏÏÏÏÏÏÏÏÏÏÏÏÏÏÏ $ 104 $ 96 $ 114 $ 145 $ 237Multifamily ÏÏÏÏÏÏÏÏÏÏÏÏÏÏÏÏÏÏÏÏÏÏÏÏÏÏÏÏÏÏÏÏÏÏÏÏÏÏÏÏÏÏÏÏÏÏÏÏÏÏÏ 19 1 3 4 8
$ 123 $ 97 $ 117 $ 149 $ 245
Charge-oÅs as a percentage of average book of businessÏÏÏÏÏÏÏÏÏÏÏÏÏÏÏ .007% .007% .009% .013% .026%Credit losses as a percentage of average book of businessÏÏÏÏÏÏÏÏÏÏÏÏÏÏ .005 .006 .007 .011 .027
(1) In 2002, we reclassiÑed from our ""Allowance for loan losses'' to a ""Guaranty liability for MBS'' the amountassociated with the guaranty obligation for MBS that we own. Prior period balances, the provision for losses, andcharge-oÅ amounts have been reclassiÑed to reÖect the current year's presentation.
(2) Charge-oÅs exclude $1 million in 2002 and $1 million in 1998 on charge-oÅs related to foreclosed Federal HousingAdministration loans that are reported in the balance sheet under ""Acquired property and foreclosure claims, net.''
(3) The total excludes $2 million at year-end 2002 and $3 million at the end of 2001, 2000, 1999, and 1998 related toforeclosed Federal Housing Administration loans that are reported in the balance sheet under ""Acquired property andforeclosure claims, net.''
(4) Represents ratio of allowance and guaranty liability balance by loan type to book of business by loan type.
Over the past Ñve years, our combined allowance for loan losses and guaranty liability for MBS haveremained relatively stable although our book of business has expanded. This trend reÖects improvements inthe credit performance of our book of business. Fannie Mae's allowance and guaranty liability as a percentageof the book of business has declined to .04 percent in 2002, from .05 percent in 2001 and .06 percent in 2000,based on positive credit trends. Over the last three years, our credit loss ratio has declined in each year to.5 basis points in 2002, from .6 basis points in 2001, and .7 basis points in 2000. We recorded a provision forlosses of $128 million, $94 million, and $122 million, respectively, in 2002, 2001, and 2000. Our provisionrepresented between 1 and 2 percent of our pre-tax reported income and core business earnings in each of thepast three years. Management believes the combined balance of our allowance for loan losses and guarantyliability for MBS are adequate to absorb losses inherent in Fannie Mae's book of business.
56

Deferred Price Adjustments
When Fannie Mae buys MBS, loans, or mortgage-related securities, we may not pay the seller the exactamount of the unpaid principal balance (""UPB''). If we pay more than the UPB and purchase the mortgageassets at a premium, the premium reduces the yield we recognize on the assets below the coupon amount. Ifwe pay less than the UPB and purchase the mortgage assets at a discount, the discount increases the yieldabove the coupon amount. In addition, we may charge an upfront payment in lieu of a higher guaranty fee forcertain loan types that have higher credit risk. To facilitate the pooling of mortgages into a Fannie Mae MBS,we also may adjust the monthly MBS guaranty fee rate that we receive by either negotiating an upfront cashdisbursement to the lender (a ""buy-up'') or an upfront cash receipt from the lender (a ""buy-down'') when theMBS is formed. The upfront payment results in an adjustment to the monthly guaranty fee so that thecoupons on MBS are always in increments of whole or half interest rates, which are more easily traded.
We recognize the impact of premiums, discounts, and other purchase price adjustments over theestimated life of the purchased assets as an adjustment to income in accordance with Financial AccountingStandard No. 91, Accounting for Nonrefundable Fees and Costs Associated with Originating or AcquiringLoans and Initial Direct Costs of Leases (""FAS 91''). We amortize deferred premium and discount intointerest income, which aÅects the results of our Portfolio Investment business. Amortization of deferred priceadjustments relating to our guaranty fees aÅects guaranty fee income, which aÅects the results of our CreditGuaranty business.
We apply the interest method to amortize the premiums, discounts, and other purchase price adjustmentsinto income. We estimate future mortgage prepayments to calculate the constant eÅective yield necessary toapply the interest method. We believe the accounting estimates related to deferred premium/discount anddeferred guaranty fees are ""critical accounting estimates'' because they require us to make signiÑcantjudgments and assumptions about borrower prepayment patterns in various interest rate environments thatinvolve a signiÑcant degree of uncertainty. On a periodic basis, we evaluate whether we should change theestimated prepayment rates used in the amortization calculation. We reassess our estimate of the sensitivity ofprepayments to changes in interest rates and compare actual prepayments versus anticipated prepayments. Ifchanges are necessary, we recalculate the constant eÅective yield and adjust net interest income or guarantyfee income for the amount of premiums, discounts, and other purchase price adjustments that would havebeen recorded if we had applied the new eÅective yield since acquisition of the mortgage assets or inception ofa guaranty. Table 19 presents an analysis of the eÅect of our deferred price adjustments in 2002, 2001, and2000.
57
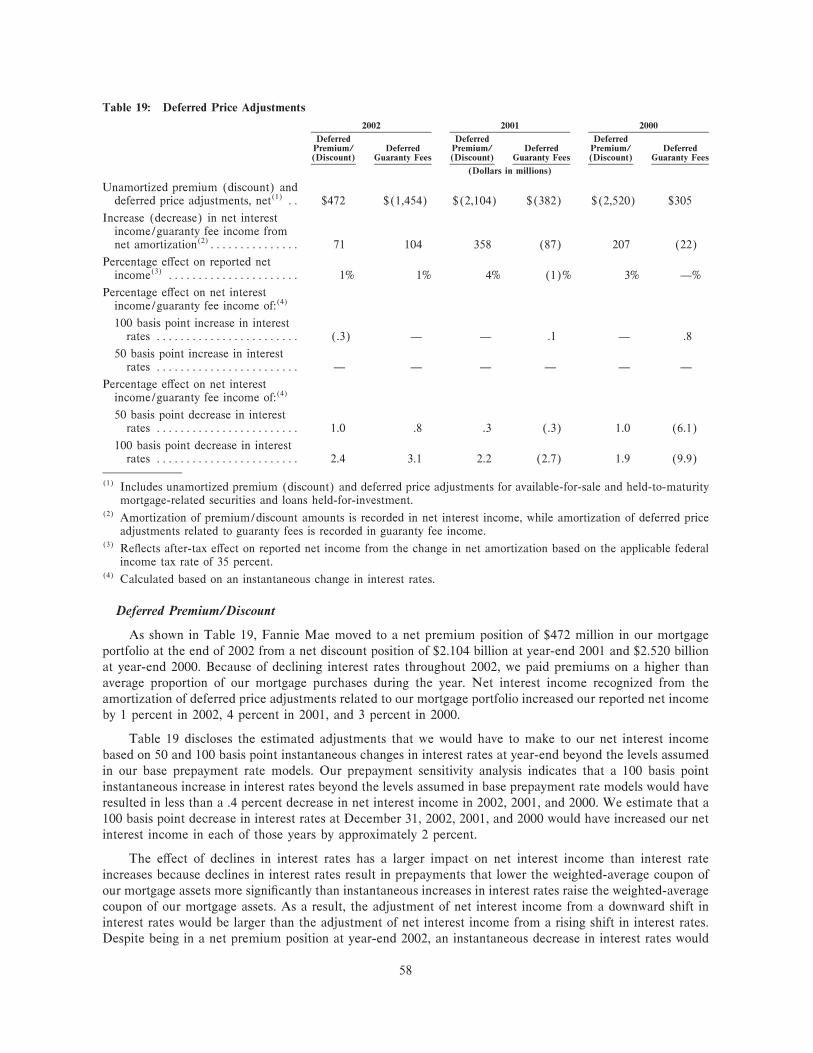
Table 19: Deferred Price Adjustments
2002 2001 2000
Deferred Deferred DeferredPremium/ Deferred Premium/ Deferred Premium/ Deferred(Discount) Guaranty Fees (Discount) Guaranty Fees (Discount) Guaranty Fees
(Dollars in millions)
Unamortized premium (discount) anddeferred price adjustments, net(1) ÏÏ $472 $(1,454) $(2,104) $(382) $(2,520) $305
Increase (decrease) in net interestincome/guaranty fee income fromnet amortization(2)ÏÏÏÏÏÏÏÏÏÏÏÏÏÏÏ 71 104 358 (87) 207 (22)
Percentage eÅect on reported netincome(3) ÏÏÏÏÏÏÏÏÏÏÏÏÏÏÏÏÏÏÏÏÏÏ 1% 1% 4% (1)% 3% Ì%
Percentage eÅect on net interestincome/guaranty fee income of:(4)
100 basis point increase in interestrates ÏÏÏÏÏÏÏÏÏÏÏÏÏÏÏÏÏÏÏÏÏÏÏÏ (.3) Ì Ì .1 Ì .8
50 basis point increase in interestrates ÏÏÏÏÏÏÏÏÏÏÏÏÏÏÏÏÏÏÏÏÏÏÏÏ Ì Ì Ì Ì Ì Ì
Percentage eÅect on net interestincome/guaranty fee income of:(4)
50 basis point decrease in interestrates ÏÏÏÏÏÏÏÏÏÏÏÏÏÏÏÏÏÏÏÏÏÏÏÏ 1.0 .8 .3 (.3) 1.0 (6.1)
100 basis point decrease in interestrates ÏÏÏÏÏÏÏÏÏÏÏÏÏÏÏÏÏÏÏÏÏÏÏÏ 2.4 3.1 2.2 (2.7) 1.9 (9.9)
(1) Includes unamortized premium (discount) and deferred price adjustments for available-for-sale and held-to-maturitymortgage-related securities and loans held-for-investment.
(2) Amortization of premium/discount amounts is recorded in net interest income, while amortization of deferred priceadjustments related to guaranty fees is recorded in guaranty fee income.
(3) ReÖects after-tax eÅect on reported net income from the change in net amortization based on the applicable federalincome tax rate of 35 percent.
(4) Calculated based on an instantaneous change in interest rates.
Deferred Premium/Discount
As shown in Table 19, Fannie Mae moved to a net premium position of $472 million in our mortgageportfolio at the end of 2002 from a net discount position of $2.104 billion at year-end 2001 and $2.520 billionat year-end 2000. Because of declining interest rates throughout 2002, we paid premiums on a higher thanaverage proportion of our mortgage purchases during the year. Net interest income recognized from theamortization of deferred price adjustments related to our mortgage portfolio increased our reported net incomeby 1 percent in 2002, 4 percent in 2001, and 3 percent in 2000.
Table 19 discloses the estimated adjustments that we would have to make to our net interest incomebased on 50 and 100 basis point instantaneous changes in interest rates at year-end beyond the levels assumedin our base prepayment rate models. Our prepayment sensitivity analysis indicates that a 100 basis pointinstantaneous increase in interest rates beyond the levels assumed in base prepayment rate models would haveresulted in less than a .4 percent decrease in net interest income in 2002, 2001, and 2000. We estimate that a100 basis point decrease in interest rates at December 31, 2002, 2001, and 2000 would have increased our netinterest income in each of those years by approximately 2 percent.
The eÅect of declines in interest rates has a larger impact on net interest income than interest rateincreases because declines in interest rates result in prepayments that lower the weighted-average coupon ofour mortgage assets more signiÑcantly than instantaneous increases in interest rates raise the weighted-averagecoupon of our mortgage assets. As a result, the adjustment of net interest income from a downward shift ininterest rates would be larger than the adjustment of net interest income from a rising shift in interest rates.Despite being in a net premium position at year-end 2002, an instantaneous decrease in interest rates would
58

have a positive impact on 2002 net interest income largely because those mortgage assets in a net premiumposition have a lower average coupon than those mortgage assets in a net discount position. Consequently, theestimated downward adjustment of 2002 net interest income for the amortization of the premium after aninstantaneous decline in interest rates would be lower than the estimated upward adjustment of 2002 netinterest income for the amortization of the discount.
This sensitivity analysis is only one component of Fannie Mae's overall net interest income at riskassessment. It does not include the eÅect of new business or the impact of changes in interest rates on our debtcosts or net cash Öows related to our derivatives contracts. A comprehensive analysis of the impact of interestrate changes on projected net interest income is presented in ""MD&AÌRisk ManagementÌInterest RateRisk ManagementÌNet Interest Income at Risk.''
Deferred Guaranty Fees
Our net discount position on deferred guaranty fee price adjustments increased to $1.454 billion at year-end 2002 from a net discount position of $382 million at year-end 2001 and a net premium position of$305 million at year-end 2000. A net discount position reÖects that the combined up-front payments wecollect in lieu of higher guaranty fees on more risky loans and the up-front payments we receive from lendersin exchange for a lower guaranty fee rate over time exceed the up-front payments we make to lenders inexchange for a higher guaranty fee rate over time. A net premium position indicates that our upfront paymentsto lenders exceed the upfront fees collected from lenders. The signiÑcant increase in our net discount positionon deferred guaranty fees in 2002 was largely attributable to an increase in up-front payments collected onloans with higher credit risk.
Amortization of deferred guaranty fee adjustments increased guaranty fee income by $104 million in2002 (1 percent of reported net income) and reduced guaranty fee income by $87 million in 2001 (1 percentof reported net income) and $22 million in 2000 (less than 1 percent of reported net income). The upwardadjustment to guaranty fee income in 2002 was primarily related to accelerating the recognition of discountduring the second half of 2002 as interest rates fell to historically low levels and prepayments accelerated. Inaddition, we made enhancements in 2002 to better reÖect the impact of interest rates on prepayment behaviorand guaranty fee income that accelerated the recognition of discount.
Our prepayment sensitivity analysis at the end of each year for deferred guaranty fees indicates that a 100basis point instantaneous increase in interest rates beyond the levels assumed in base prepayment rate modelsat year-end would have less than a 1 percent upward eÅect on guaranty fee income in 2002, 2001, and 2000. A100 basis point instantaneous decrease in interest rates at year-end would have increased our guaranty feeincome by approximately 3 percent in 2002 and reduced our guaranty fee income by approximately 3 percentand 10 percent in 2001 and 2000, respectively. The growth and age of the net discount position in 2002 is theprimary driver of the positive impact on guaranty fee income from an instantaneous 100 basis point decrease ininterest rates.
Time Value of Purchased Options
Fannie Mae issues various types of debt to Ñnance the acquisition of mortgages. We typically usederivative instruments to supplement our issuance of debt in the capital markets and hedge against the eÅectof Öuctuations in interest rates on our debt costs to preserve our net interest margin. With the adoption ofFAS 133, we began recording all derivatives on our balance sheet at estimated fair value. We record changesin the fair value of derivatives designated as cash Öow hedges in accumulated other comprehensive income(""AOCI''). We recognize in our reported earnings changes in the fair value of the time value associated withpurchased options and changes in the fair value of derivatives designated as fair value hedges.
Fannie Mae's purchased options portfolio currently includes swaptions and caps, which are discussed inmore detail under ""MD&AÌRisk ManagementÌInterest Rate Risk ManagementÌDerivative Instru-ments.'' The total fair value for purchased options consists of the time value plus the intrinsic value. UnderFAS 133, the mark-to-market on the time value component of our purchased options Öows through ourreported earnings. The time value of purchased options will vary from period to period with changes in interest
59

rates, expected interest rate volatility, and derivative activity. However, the total expense included in earningsover the original expected life of an option will generally equal the initial option premium paid. Since adoptingFAS 133, we have reported signiÑcant Öuctuations in our reported net income because of unrealizedÖuctuations in the estimated time value of purchased options. As a result of the declining interest rateenvironment in 2002 and the increase in the notional value of our purchased options, we recorded$4.545 billion in purchased options expense in 2002, compared with $37 million in 2001.
Our methodology for valuing purchased options is based on commonly used market conventions andassumptions. We obtain quoted market prices for a benchmark set of interest rate options, which include capsand swaptions. Based on these quoted market prices, we apply our valuation model, which eÅectively utilizesthese prices to estimate the fair value of our purchased options. We then allocate the fair value of ourpurchased options into the time value and intrinsic value components. Because the benchmark securities areonly a subset of the purchased options that we hold, the estimation of time value is not exact and can varydepending on the market source and methodology used. This variation could have a material eÅect on ourreported net income. Hence, we believe our estimate of the time value component of purchased options is a""critical accounting estimate.''
During the fourth quarter of 2002, we reÑned our methodology for estimating the initial time value ofinterest rate caps at the date of purchase. Under our previous valuation method, we treated the entire premiumpaid on purchased ""at-the-money'' caps as time value with no allocation to intrinsic value. We now allocatethe purchase price to reÖect the value of individual caplets, some of which are above the strike rate of the cap.This approach, which is more consistent with our estimation of time value subsequent to the initial purchasedate, results in a higher intrinsic value and lower time value at the date of purchase. We adopted this preferredvaluation method prospectively on caps purchased after third quarter 2002, which resulted in a $282 millionpre-tax reduction in our 2002 purchased options expense. The change has no eÅect on the total expense thatwill be recorded in our income statement over the life of our caps and no eÅect on our core business earnings.
To gauge the potential sensitivity of changes in the estimated time value of our purchased options, werecalculated our estimates based on plus and minus changes of 5 percent and 10 percent in the time valueportion of our outstanding purchased options at December 31, 2002 and 2001. An increase in the estimatedtime value of our purchased options would reduce our purchased options expense and increase our reported netincome and stockholders' equity, while a decrease in the estimated time value would increase purchasedoptions expense and reduce our reported net income and stockholders' equity. These changes are generallygreater than changes we have observed historically in our valuation process. Table 20 shows the potentialeÅect on our 2002 and 2001 reported results from these changes in time value. There would be no eÅect on our2000 results as we adopted FAS 133 on January 1, 2001.
Table 20: Impact of Changes in the Time Value of Purchased Options
Percentage ofChange in Fair Reported Net Percentage of Total
Value Adjustment Income(1) Stockholders' Equity
2002 2001 2000 2002 2001 2000 2002 2001 2000
(Dollars in millions)
10% change in time value ÏÏÏÏÏÏÏÏÏÏÏÏÏÏÏÏÏÏÏÏ $543 $493 NA 8% 5% NA 2% 2% NA
5% change in time value ÏÏÏÏÏÏÏÏÏÏÏÏÏÏÏÏÏÏÏÏÏ 271 246 NA 4 3 NA 1 1 NA
(1) ReÖects after-tax eÅect of time value adjustment based on applicable federal income tax rate of 35 percent.
Table 20 reveals that a plus or minus change of 10 percent in the time value portion of our purchasedoptions at December 31, 2002 and 2001 would change our reported net income by 8 percent and 5 percent,respectively. A plus or minus change of 5 percent in the time value portion of our purchased options atDecember 31, 2002 and 2001 would change our reported net income by approximately 4 percent and3 percent, respectively. Changing the time value portion of our purchased options by 10 percent or 5 percentwould change our total stockholders' equity by approximately 2 percent or 1 percent, respectively, atDecember 31, 2002 and 2001. Our core business earnings results would not be aÅected by these estimates
60

because we amortize purchased options premiums on a straight-line basis over the original expected life of theoption in measuring core business earnings and do not include mark-to-market changes in the fair value ofpurchased options.
RISK MANAGEMENT
Fannie Mae is subject to three major areas of risk: interest rate risk, credit risk, and operations risk.Active management of these risks is an essential part of our operations and a key determinant of our ability tomaintain steady earnings growth. The following discussion highlights the strategies we use to manage thesethree risks.
Interest Rate Risk Management
Interest rate risk is the risk of loss to future earnings or long-term value that may result from changes ininterest rates. Our interest rate risk is concentrated primarily in our mortgage portfolio where nearly 90 percentof our mortgages are intermediate-term or long-term, Ñxed-rate loans that borrowers have the option to prepayat any time without penalty. We are exposed to interest rate risk because the cash Öows of our mortgage assetsand the liabilities that fund them are not perfectly matched through time and across all possible interest ratescenarios. The cash Öows from our mortgage assets are highly sensitive to changes in interest rates because ofthe borrower's prepayment option. As interest rates decrease, borrowers are more likely to reÑnance Ñxed-ratemortgages, resulting in increased prepayments and mortgage cash Öows that are received earlier thanexpected. Replacing the higher-rate loans that prepay with lower-rate loans has the potential of reducing ourinterest spread unless we are able to also reduce our debt cost. Conversely, an increase in interest rates mayresult in slower than expected prepayments and mortgage cash Öows that are received later than expected. Inthis case, we have the risk that our debt may reprice faster than our mortgage assets and at a higher cost,which could also reduce our interest spread. The objective of our interest rate risk management process is tomaintain long-term value through a low variability of future earnings due to changes in interest rates, whilepreserving stable earnings growth and a competitive return on equity over time.
The Board of Directors oversees interest rate risk management through the adoption of corporate goalsand objectives and the review of regular reports on performance against them. Senior management isresponsible for ensuring that appropriate long-term strategies are in place to achieve the goals and objectives.Management establishes reference points for the key performance measures that we use to signal materialchanges in risk and to assist in determining whether we should adjust portfolio strategy to achieve long-termobjectives. Management regularly reports these measures and reference points to the Board of Directors.
The Portfolio Investment Committee, which includes our senior mortgage portfolio managers, meetsweekly and reviews current Ñnancial market conditions, portfolio risk measures, and performance targets. TheCommittee develops and monitors near-term strategies and the portfolio's standing relative to its long-termobjectives. The results of Portfolio Investment Committee meetings are reported to the weekly Asset andLiability Management Committee, which is comprised of senior management and includes our ChiefExecutive OÇcer.
Fannie Mae's overall objective in managing interest rate risk is to deliver consistent net interest incomegrowth and target returns on capital over a wide range of interest rate environments. Central elements of ourapproach to managing interest rate risk include: (1) funding assets by issuing liabilities that have similar cashÖow patterns through time and in diÅerent interest rate environments, (2) regularly assessing the portfolio'sexposure to changes in interest rates using a diverse set of analyses and measures, and (3) setting parametersfor rebalancing actions to help attain corporate objectives.
1. Funding mortgage assets with liabilities that have similar cash Öow patterns through time and indiÅerent interest rate environments.
When we purchase mortgages we attempt to match the initial estimated life, or duration, of ourliabilities to our assets within a range to achieve a stable and competitive net interest margin. We issue amix of debt securities across a broad spectrum of Ñnal maturities to achieve the desired liability durations.Because the estimated lives of mortgage assets change as interest rates change, we frequently issue
61

callable debt or use derivatives to alter the estimated life of our liabilities to partially match the expectedchange in duration of our mortgage assets. The duration of callable debt, like that of a mortgage, shortenswhen interest rates decrease and lengthens when interest rates increase. If interest rates decrease, we arelikely to call debt that carries an interest rate higher than the current market. We use interest rate swapsand other derivatives with embedded interest rate options to achieve our desired liability structure and tobetter match both the duration and prepayment risk of our mortgage assets. These derivatives, coupledwith appropriate debt securities, are close substitutes for callable and noncallable debt. Through the useof these derivatives, we can synthetically create debt with cash Öows similar to our mortgage assets.
2. Regularly assessing the portfolio's exposure to changes in interest rates using a diverse set of analysesand measures.
Interest Rate Risk Measurement
We utilize a wide range of risk measures and analyses to manage the interest rate risk inherent in themortgage portfolio. We categorize these risk measures and analyses into three types: ongoing business riskmeasures and analyses, run-oÅ measures of the existing portfolio, and stress test scenarios. Thecombination of ongoing business and run-oÅ risk measures and analyses present a comprehensive pictureof Fannie Mae's current risk position that we use for day-to-day risk management decisions. Stress testscenarios provide information on our risk to more extreme but lower probability events.
Our ongoing business risk measures and analyses include net interest income at risk and repricinggap analyses. We base net interest income at risk measures on the mortgage portfolio as of a certain dateplus projections of future business activity. Future business activity includes projected mortgagepurchases and funding actions. Management believes that ongoing business risk measures and analysesprovide a better perspective on the interest rate risk we face as a continuing business and a morecomprehensive depiction of our risk proÑle than run-oÅ measures. However, they contain moreassumption risk due to the inherent uncertainty in projecting future business activity.
Run-oÅ measures of interest rate risk include duration, convexity, and repricing gaps. We base run-oÅ measures on the mortgage portfolio as of a certain date without incorporating future business activity.Run-oÅ measures provide an assessment of the interest rate risk of the existing portfolio without theassumption risk inherent in projecting future business activity. However, we believe it is important tomanage interest rate risk in the context of ongoing business activity because future business is highlyprobable and has a pronounced eÅect on our interest rate risk proÑle.
Stress test scenarios include extreme movements in risk factors on both ongoing business and run-oÅmeasures of risk. We periodically measure and analyze the eÅects that extreme movements in the level ofinterest rates and the slope of the yield curve would have on the company's risk position. In addition, weevaluate stress scenarios that include severe changes in expected prepayment speeds and the level ofinterest rate volatility. While stress testing is an integral part of our risk management process, the ongoingbusiness and run-oÅ measures of risk are the primary inputs in daily risk management decisions.
Many of our projections of mortgage cash Öows in our interest rate risk measures depend on ourproprietary prepayment models. While we are highly conÑdent in the quality of these models, werecognize the historical patterns that serve as input for our models may not continue in the future. Themodels contain many assumptions, including those regarding borrower behavior in certain interest rateenvironments and borrower relocation rates. Other assumptions such as projections of interest rates,shape of the yield curve, and interest rate volatility are also critical components to our interest rate riskmeasures. We maintain a research program to constantly evaluate, update, and enhance these assump-tions, models, and analytical tools as appropriate to reÖect management's best assessment of theenvironment.
62

‚ Net Interest Income at Risk
Net interest income at risk is our primary ongoing business measure of interest rate risk. Net interestincome at risk measures the projected impact of changes in the level of interest rates and the shape of theyield curve on the mortgage portfolio's expected or ""base'' core net interest income over the immediatefuture one- and four-year periods. To determine our base core net interest income, we estimate core netinterest income over a wide range of interest rate environments using stochastic interest rate simulations.Stochastic interest rate simulations are a widely used statistical method to estimate the path and patternof interest rates. Our stochastic simulations produce probability distributions of future interest rates basedon expected interest rate volatility and are based on proprietary interest rate models. We generate severalhundred interest rate paths distributed around the current Fannie Mae yield curve from these simula-tions. The Fannie Mae yield curve represents market assumptions regarding our expected cost of fundsover a variety of maturities and takes into account the risk premium on our debt relative to benchmarkinterest rates. We project core net interest income for four years along each path based on thecharacteristics of the current mortgage portfolio and projected future business activity. The expected or""base'' core net interest income is calculated based on the average core net interest income across allsimulation paths and serves as the basis for determining our interest rate risk proÑle. Our projections offuture business activity used in these simulations are reported to senior management and our Board ofDirectors and provide the basis for Fannie Mae's current earnings forecasts.
We determine the amount of net interest income at risk by assuming a sudden change or shock tothe current yield curve and repeating the simulation. We regularly evaluate a wide range of instantaneousshocks to both the level and shape of the yield curve and create the net interest income at risk proÑle bycomparing the percentage change in core net interest income between each shocked simulation and thebase simulation. Our net interest income at risk disclosures, which we report to the public on a monthlybasis, represent the extent to which our core net interest income over the next one-year and four-yearperiods is at risk due to a plus or minus 50 basis point parallel change in the current Fannie Mae yieldcurve and from a 25 basis point change in the slope of Fannie Mae's yield curve. We selected theseshocks for our monthly disclosure because they capture approximately 95 percent of historical changes ininterest rates over a one-month reporting period.
‚ Duration Gap
The portfolio duration gap is a run-oÅ measure of interest rate risk. The duration gap is thediÅerence between the estimated durations of portfolio assets and liabilities. Duration gap summarizesthe extent to which estimated cash Öows for assets and liabilities are matched, on average, over time andacross interest rate scenarios. A positive duration gap signals a greater exposure to rising interest ratesbecause it indicates that the duration of our assets exceeds the duration of our liabilities. A negativeduration gap signals a greater exposure to declining interest rates because the duration of our assets is lessthan the duration of our liabilities. We apply the same interest rate process, prepayment models, andvolatility assumptions used in our net interest income at risk measure to generate the portfolio durationgap. The duration gap reÖects the current mortgage portfolio, including priced asset and debt commit-ments. We do not incorporate projected future business activity or nonmortgage investments into ourduration gap measure.
We regularly evaluate the sensitivity of the duration gap over a wide range of instantaneous changesto both the level and shape of the yield curve. The duration gap provides a relatively concise and simplemeasure of the interest rate risk inherent in the existing mortgage portfolio, but it is not directly linked toexpected future earnings performance. Future business activity, which is not reÖected in the duration gap,can have a signiÑcant eÅect even over a very short horizon. We disclose on a monthly basis our durationgap at the end of each month along with our net interest income at risk, which together we believeprovide a more informative proÑle of our overall interest rate risk position than either measure alone.
63

3. Setting the parameters for rebalancing actions to help attain corporate objectives.
Management develops rebalancing actions based on a number of factors that include the relativestanding of both net interest income at risk and duration gap, as well as analyses based on additional riskmeasures and current market activities and conditions. We establish internal reference points, orindicators, for our risk measures to signal when we should re-examine the risk proÑle of our assets. Ourreference points are set by Fannie Mae's management, not by any external or regulatory requirement, toprovide a tool for determining when and to what extent we should consider rebalancing actions. Thesereference points do not represent absolute risk limits. They are generally consistent with levels of interestrate risk that we project will not result in signiÑcant variability in future earnings and long-term value.
As these risk measures begin to move beyond our internally established reference points, we consideractions to bring them within our preferred ranges in a manner that is consistent with achieving FannieMae's earnings objectives. As a risk measure moves further outside our preferred range, we placesigniÑcantly greater emphasis on reducing our risk exposure and less emphasis on earnings objectives. Wehave not established a speciÑc time horizon over which rebalancing actions must take place.
Risk Management Results
2002 was a year of signiÑcant interest rate movements coupled with unprecedented levels of interest ratevolatility. Fannie Mae's disciplined risk management process was critical to successfully meeting thecompany's interest rate risk objectives throughout this challenging environment. During the Ñrst half of 2002,our interest rate risk measures were within our reference points, and no signiÑcant rebalancing actions wereconsidered necessary. Between June and September 2002, interest rates declined signiÑcantly and our primaryrisk measures began to move outside of our preferred range. As these risk measures approached our internallyestablished reference points, we developed strategies to moderately rebalance the portfolio. As rates continuedto fall, we increased the pace of rebalancing signiÑcantly. After our interest rate risk measures reached peaklevels in August 2002, we continued to aggressively rebalance to bring our risk measures within our establishedreference points. We utilized a wide range of tools to execute this rebalancing, including increased mortgagepurchases, reduced Ñxed-rate debt issuances, debt repurchases, and derivative transactions.
‚ Net Interest Income at Risk
At December 31, 2002, our one-year and four-year net interest income at risk measures for a 50 basispoint change across the Fannie Mae yield curve were .6 percent and 1.6 percent, respectively, compared with5.1 percent and 4.5 percent, respectively, at December 31, 2001. The one-year and four-year net interestincome at risk measures for a 25 basis point change in the slope of the Fannie Mae yield curve were4.7 percent and 6.6 percent, respectively, compared with 2.4 percent and 4.3 percent, respectively, atDecember 31, 2001.
The following graphs show the monthly net interest income at risk for each of the last three years underboth a 50 basis point change across the Fannie Mae yield curve and a 25 basis point change in the slope of theFannie Mae yield curve. Compared to 2001 and 2000, the net interest income at risk was at somewhat higherlevels and more variable during 2002. The results for 2002 reÖect the extreme low level of interest rates as wellas unprecedented levels of interest rate volatility related to uncertainty about the economic outlook.
64

Dec
-99
Feb
-00
Apr
-00
Jun-
00
Aug
-00
Oct
-00
Dec
-00
Feb
-01
Apr
-01
Jun-
01
Aug
-01
Oct
-01
Dec
-01
Feb
-02
Apr
-02
Jun-
02
Aug
-02
Oct
-02
Dec
-02
Mortgage Portfolio Net Interest Income at Risk - 50 Basis Point Level Shock
One-year NII at risk Four-year NII at risk
NII
at R
isk
10%
9
8
7
6
5
4
3
2
1
0
Dec
-99
Feb
-00
Apr
-00
Jun-
00
Aug
-00
Oct
-00
Dec
-00
Feb
-01
Apr
-01
Jun-
01
Aug
-01
Oct
-01
Dec
-01
Feb
-02
Apr
-02
Jun-
02
Aug
-02
Oct
-02
Dec
-02
NII
at R
isk
One-year NII at risk Four-year NII at risk
Mortgage Portfolio Net Interest Income at Risk - 25 Basis Point Slope Shock
10%
9
8
7
6
5
4
3
2
1
0
65

Table 21 presents our net interest income at risk based on an instantaneous 100 basis point increase and a50 basis point decrease in interest rates. The risk measure is an extension of our voluntary monthly net interestincome at risk disclosure, and we use the same data, assumptions, and methodology. We consider our netinterest income at risk at December 31, 2002 to be low as our exposure to a 100 basis point instantaneousincrease in interest rates was estimated not to exceed 4 percent and 6 percent over a 1-year and 4-year horizon,respectively, and our exposure to a 50 basis point instantaneous decrease in rates was estimated not to exceedmore than 1 percent over a 1-year and 4-year horizon. In comparison, we had what we consider to be amoderate level of risk exposure at December 31, 2001 to increasing rates and a beneÑt from decreasing rates.The changes in the proÑle of net interest income at risk from December 31, 2001 to December 31, 2002 weredriven by changes in the level of interest rates and shape of the yield curve, changes in the composition of theportfolio, and changes in forecast assumptions. Actual portfolio net interest income may diÅer from theseestimates because of speciÑc interest rate movements, changing business conditions, changing prepayments,and management actions.
Table 21: Net Interest Income at Risk
December 31, 2002 December 31, 2001
1-Year Portfolio 4-Year Portfolio 1-Year Portfolio 4-Year PortfolioNet Interest Net Interest Net Interest Net Interest
Income at Risk Income at Risk Income at Risk Income at Risk
Assuming a 100 basis point increase in interestrates ÏÏÏÏÏÏÏÏÏÏÏÏÏÏÏÏÏÏÏÏÏÏÏÏÏÏÏÏÏÏÏÏÏ 4% 6% 10% 10%
Assuming a 50 basis point decrease in interestrates ÏÏÏÏÏÏÏÏÏÏÏÏÏÏÏÏÏÏÏÏÏÏÏÏÏÏÏÏÏÏÏÏÏ 1 Ì (4) (2)
‚ Duration Gap
Fannie Mae's duration gap was minus 5 months at December 31, 2002, versus plus 5 months atDecember 31, 2001. The negative shift in our duration gap during 2002 was primarily the result of historicallylow interest rates that resulted in a surge in expected reÑnancings. The signiÑcant increase in our expectationof mortgage prepayments caused the durations of our mortgages to shorten by more than the durations of ourdebt during 2002. Our monthly duration gap turned sharply negative during the year, falling to minus14 months at the end of August 2002 before narrowing to minus 5 months by the end of the year. Themovement in the duration gap during 2002 was not unusual given our historical experience during previousreÑnance waves or periods of signiÑcant interest rate volatility. Our duration gap also moved signiÑcantlyduring each of the prior major reÑnancing waves in 2001, 1998, and 1993. Over the past decade, Fannie Mae'sduration gap has been wider than plus or minus 6 months approximately one-third of the time. During 2002,our monthly duration gap was wider than plus or minus 6 months three times.
Although periods of heavy reÑnancing are typically associated with somewhat higher risk levels, theseperiods historically have provided positive opportunities for our portfolio. Through our normal businessactivities of buying mortgages and issuing debt, we historically have been able to bring our duration gapmeasure within our target range in a manner and pace that does not put undue demands on the market.Opportunities to add new business during the latter half of 2002 developed at about the pace we anticipated ina low rate environment. The increased business activity fueled our purchase of long-term, Ñxed-ratemortgages, which helped to lengthen the duration of our mortgage assets and oÅset our negative duration gap.In addition, we took a number of speciÑc rebalancing actions in the latter half of 2002 to reduce our negativeduration gap, including funding our longer duration mortgage purchases with shorter-term debt, repurchasinglong-term outstanding debt, terminating certain long-term pay-Ñxed interest rate swaps, and entering intooption-based derivatives transactions. If interest rates increase, some of our rebalancing actions could result inlower portfolio returns than would have occurred without the rebalancing. However, our objective is tomaintain an interest rate risk proÑle that is balanced to protect us against both increases and decreases ininterest rates. Because managing our duration gap through rebalancing actions is a routine part of our interestrate risk management strategy, we do not expect these actions to have a material adverse eÅect on our futureearnings objectives.
66
The graph below shows Fannie Mae's monthly duration gap compared with the yield on Fannie Mae10-year debt for the last three years.
Dec
-99
Feb
-00
Apr
-00
Jun-
00
Aug
-00
Oct
-00
Dec
-00
Feb
-01
Apr
-01
Jun-
01
Aug
-01
Oct
-01
Dec
-01
Feb
-02
Apr
-02
Jun-
02
Aug
-02
Oct
-02
Dec
-02
Duration Gap 10-Year Fannie Mae Debt Cost
Du
rati
on
Gap
(mo
nth
s)
10-Y
ear
Fan
nie
Mae
Deb
t (%
)
15
12
9
6
3
0
-3
-6
-9
-12
-15
8.0%
7.5
7.0
6.5
6.0
5.5
5.0
4.5
4.0
‚ Convexity
Convexity measures are commonly used as a supplement to duration measures to reÖect the degree towhich durations are likely to change in response to movements in interest rates. Convexity provides us withinformation on how quickly and by how much the portfolio's duration gap may change in diÅerent interest rateenvironments. Our primary strategy for managing convexity risk is to either issue callable debt or purchaseinterest-rate derivatives with embedded options. We may also change the mix of assets we purchase to manageconvexity risk. For example, ARMs, shorter-term Ñxed rate mortgages, and some seasoned loans have lessprepayment risk relative to new 30-year Ñxed rate mortgages, and as a result, reduce convexity risk. Generally,our preferred option is to issue callable debt or purchase optionality rather than change the mix of our assetsbecause we Ñnd greater value in investing in longer term, Ñxed-rate loans.
During 2002, we continued to take advantage of the opportunity to reduce our debt costs by redeemingsigniÑcant amounts of callable debt in response to the sharp decline in short-term interest rates that began in2001. At the same time, we continued to reduce the portfolio's convexity by aggressively increasing theamount of option protection through the issuance of callable debt or the purchase of interest-rate derivativeswith embedded options. These instruments give us the option to reduce the duration of our liabilities to oÅsetpotential increases in mortgage prepayments that usually occur when mortgage rates fall.
By the end of 2002, we had increased our option-embedded debt, which includes callable debt andoption-based derivatives, as a percentage of our net mortgage portfolio to 75 percent from 54 percent at theend of 2001. As part of our rebalancing strategy during the last half of 2002, we increased our use of short-term European options, which temporarily increased the percentage of our mortgage portfolio with option-embedded rate protection beyond the average range of the past 3 years. At December 31, 2002, the remainingoutstanding notional amount of these options totaled approximately 9 percent of our net mortgage portfolio.Callable debt and option-based derivative instruments debt represented 58 percent and 42 percent, respec-
67
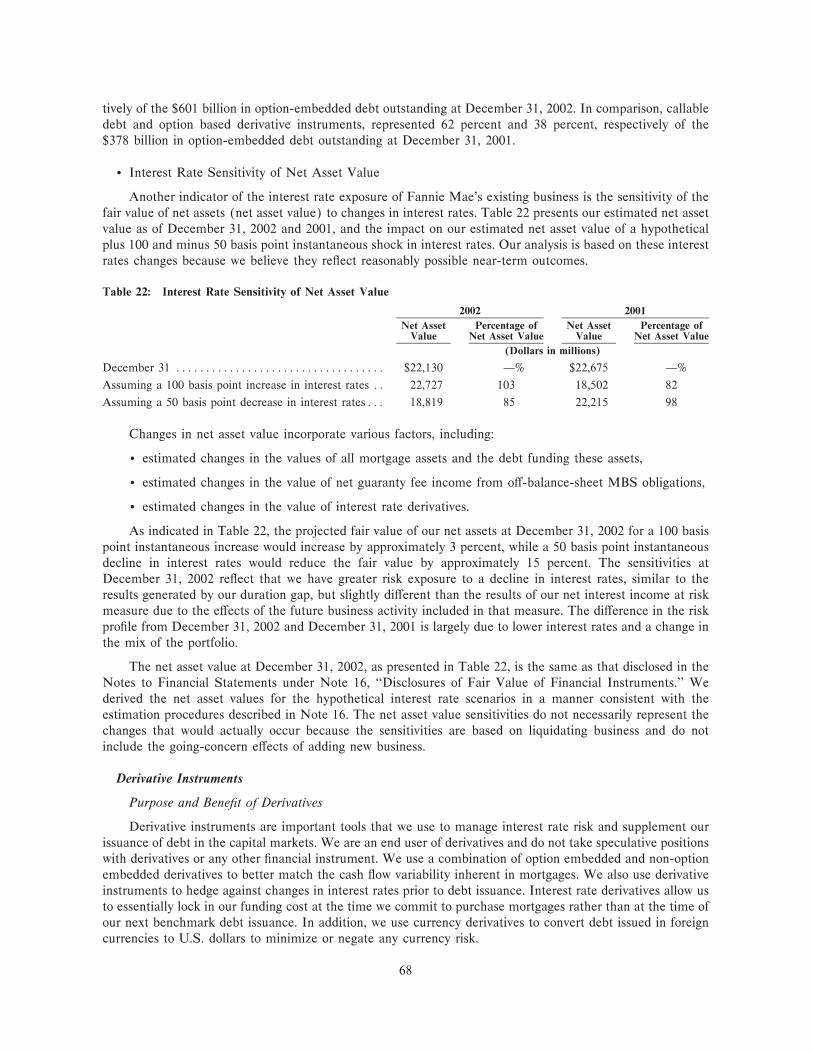
tively of the $601 billion in option-embedded debt outstanding at December 31, 2002. In comparison, callabledebt and option based derivative instruments, represented 62 percent and 38 percent, respectively of the$378 billion in option-embedded debt outstanding at December 31, 2001.
‚ Interest Rate Sensitivity of Net Asset Value
Another indicator of the interest rate exposure of Fannie Mae's existing business is the sensitivity of thefair value of net assets (net asset value) to changes in interest rates. Table 22 presents our estimated net assetvalue as of December 31, 2002 and 2001, and the impact on our estimated net asset value of a hypotheticalplus 100 and minus 50 basis point instantaneous shock in interest rates. Our analysis is based on these interestrates changes because we believe they reÖect reasonably possible near-term outcomes.
Table 22: Interest Rate Sensitivity of Net Asset Value
2002 2001
Net Asset Percentage of Net Asset Percentage ofValue Net Asset Value Value Net Asset Value
(Dollars in millions)
December 31 ÏÏÏÏÏÏÏÏÏÏÏÏÏÏÏÏÏÏÏÏÏÏÏÏÏÏÏÏÏÏÏÏÏÏÏ $22,130 Ì% $22,675 Ì%
Assuming a 100 basis point increase in interest rates ÏÏ 22,727 103 18,502 82
Assuming a 50 basis point decrease in interest ratesÏÏÏ 18,819 85 22,215 98
Changes in net asset value incorporate various factors, including:
‚ estimated changes in the values of all mortgage assets and the debt funding these assets,
‚ estimated changes in the value of net guaranty fee income from oÅ-balance-sheet MBS obligations,
‚ estimated changes in the value of interest rate derivatives.
As indicated in Table 22, the projected fair value of our net assets at December 31, 2002 for a 100 basispoint instantaneous increase would increase by approximately 3 percent, while a 50 basis point instantaneousdecline in interest rates would reduce the fair value by approximately 15 percent. The sensitivities atDecember 31, 2002 reÖect that we have greater risk exposure to a decline in interest rates, similar to theresults generated by our duration gap, but slightly diÅerent than the results of our net interest income at riskmeasure due to the eÅects of the future business activity included in that measure. The diÅerence in the riskproÑle from December 31, 2002 and December 31, 2001 is largely due to lower interest rates and a change inthe mix of the portfolio.
The net asset value at December 31, 2002, as presented in Table 22, is the same as that disclosed in theNotes to Financial Statements under Note 16, ""Disclosures of Fair Value of Financial Instruments.'' Wederived the net asset values for the hypothetical interest rate scenarios in a manner consistent with theestimation procedures described in Note 16. The net asset value sensitivities do not necessarily represent thechanges that would actually occur because the sensitivities are based on liquidating business and do notinclude the going-concern eÅects of adding new business.
Derivative Instruments
Purpose and BeneÑt of Derivatives
Derivative instruments are important tools that we use to manage interest rate risk and supplement ourissuance of debt in the capital markets. We are an end user of derivatives and do not take speculative positionswith derivatives or any other Ñnancial instrument. We use a combination of option embedded and non-optionembedded derivatives to better match the cash Öow variability inherent in mortgages. We also use derivativeinstruments to hedge against changes in interest rates prior to debt issuance. Interest rate derivatives allow usto essentially lock in our funding cost at the time we commit to purchase mortgages rather than at the time ofour next benchmark debt issuance. In addition, we use currency derivatives to convert debt issued in foreigncurrencies to U.S. dollars to minimize or negate any currency risk.
68

Fannie Mae primarily uses derivatives as a substitute for notes and bonds we issue in the debt markets.When we purchase mortgage assets, we fund the purchases with a combination of equity and debt. The debtwe issue is a mix that typically consists of short- and long-term, noncallable debt and callable debt. The variedmaturities and Öexibility of these debt combinations help us in reducing the cash Öow mismatch between theperformance of our assets and liabilities.
We can use a mix of debt issuances and derivatives to achieve the same duration matching that would beachieved by issuing only debt securities. The following is an example of funding alternatives that we could useto achieve similar economic results:
‚ Rather than issuing a 10-year noncallable Ñxed-rate note, we could issue short-term debt and enter intoa 10-year interest rate swap with a highly rated counterparty. The derivative counterparty would pay aÖoating rate of interest to us on the swap that we would use to pay the interest expense on the short-term debt, which we would continue to reissue periodically. We would pay the counterparty a Ñxed rateof interest on the swap, thus achieving the economics of a 10-year Ñxed-rate note issue.
‚ Similarly, instead of issuing a 10-year Ñxed-rate note callable after three years, we could issue a 3-yearnote and enter into a pay-Ñxed swaption that would have the same economics as a 10-year callablenote. If we want to extend the debt beyond three years, the swaption would give us the option to enterinto a swap agreement where we would pay a Ñxed rate of interest to the derivative counterparty overthe remaining 7-year period.
The ability to either issue debt securities or modify debt through the use of derivatives increases ourfunding Öexibility and potentially reduces our overall funding costs. We may be able to obtain a speciÑcfunding structure using derivatives that we cannot obtain through the issuance of callable debt. In addition, itcan be less expensive to use the mix of debt securities and derivatives to achieve a given funding objective. Wegenerally use the method that provides the lowest funding costs and desired Öexibility.
Table 23 gives an example of equivalent funding alternatives for a mortgage purchase with fundingderived solely from debt securities versus funding with a blend of debt securities and derivatives. As illustratedby Table 23, we can achieve similar economic results by funding our mortgage purchases with either debtsecurities or a combination of debt securities and derivatives.
Table 23: Equivalent Debt and Derivative Funding
Fund With:(1)
Debt Securities Debt Securities and Derivatives
Percentage Type of Debt Percentage Type of Debt
10% Short-term debt 10% Short-term debt
15 3-year noncallable debt 15 3-year noncallable debt
25 10-year noncallable debt 25 Short-term debt plus 10-year swap
50 10-year callable in 3 years 50 3-year noncallable debt plus pay-Ñxed swaption
100% 100%
(1) This example indicates the possible funding mix and does not represent how an actual purchase would necessarily befunded.
Fannie Mae also uses derivatives to hedge against Öuctuations in interest rates on planned debt issuances.The hedging of anticipated debt issuances enables us to maintain an orderly and cost-eÅective debt issuanceschedule so we can fund daily loan purchase commitments without signiÑcantly increasing our interest raterisk or changing the spread of our funding costs versus other market interest rates. Most of the mortgages thatFannie Mae commits to purchase are for a future settlement date, typically two weeks to three months into thefuture. Fannie Mae would be exposed to additional interest rate risk from changes in market rates prior tosettlement if we did not issue debt at the time of the commitment or did not lock in an interest rate by hedgingthe anticipated debt issuance. By hedging anticipated debt issuance versus issuing debt at the time of
69

commitment, we are able to issue debt in larger size and on a regular schedule so that liquidity is enhancedwhile our relative cost of funds is reduced.
Fannie Mae uses derivatives to hedge foreign currency exposure. We occasionally issue debt in a foreigncurrency. Because all of our assets are denominated in U.S. dollars, we enter into currency swaps to eÅectivelyconvert the foreign-denominated debt into U.S. dollar-denominated debt. By swapping out of foreigncurrencies completely at the time of the debt issue, we minimize our exposure to any currency risk. Ourforeign denominated debt represents less than one percent of total debt outstanding.
Primary Types of Derivatives Used
Table 24 summarizes the primary derivative instruments Fannie Mae uses along with the key hedgingstrategies we employ to manage our various interest rate risk exposures.
Table 24: Primary Types of Derivatives Used
Derivative Hedging Instrument Hedged Item Purpose of the Hedge Transaction
Pay-Ñxed, receive-variable interest- Variable-rate debt To protect against an increase inrate swap Anticipated issuance of debt interest rates by converting the debt's
variable rate to a Ñxed rate.
Receive-Ñxed, pay-variable interest- Noncallable Ñxed-rate debt To protect against a decline in interestrate swap rates. Converts the debt's Ñxed rate to
a variable rate.
Basis swap or spread-lock Variable-rate assets and liabilities To ""lock in'' or preserve the spreadbetween variable-rate, interest-earningassets and variable-rate, interest-bearing liabilities.
Pay-Ñxed swaption Variable-rate debt To protect against an increase ininterest rates by having an option toconvert Öoating-rate debt to a Ñxedrate.
Caps Variable-rate debt To protect against an increase ininterest rates by providing a limit onthe interest costs on our debt in arising rate environment.
Receive-Ñxed swaption Noncallable Ñxed-rate debt To protect against a decline in interestrates by having an option to convertÑxed-rate debt to Öoating-rate debt.
Foreign currency swaps Foreign currency-denominated debt To protect against Öuctuations inexchange rates on non-U.S. dollar-denominated debt by converting theinterest expense and principal paymenton foreign-denominated debt to U.S.dollar-denominated debt.
As Table 24 indicates, we use what the marketplace generally regards as relatively straightforward typesof interest rate derivative instruments, primarily interest-rate swaps, basis swaps, swaptions, and caps. Swapsprovide for the exchange of Ñxed and variable interest payments based on contractual notional principalamounts. These may include callable swaps (a combination of a swap and swaptions), which givescounterparties or Fannie Mae the right to terminate interest rate swaps before their stated maturities. Theymay also include foreign currency swaps in which Fannie Mae and counterparties exchange payments indiÅerent types of currencies. Basis swaps provide for the exchange of variable payments that have maturitiessimilar to hedged debt, but have payments based on diÅerent interest rate indices. Swaptions give Fannie Maethe right to enter into a swap at a future date. Interest rate caps provide ceilings on the interest rates of
70

variable-rate debt. Purchased options are another important risk management tool we use to reduce the cashÖow mismatches driven by the prepayment option in mortgages. American homeowners have ""options'' to payoÅ their mortgages at any time. We use options of our own to manage this prepayment option risk on the loanswe hold in portfolio. We obtain these options by either issuing callable debt or purchasing stand-alone optionsand linking them to the debt they are hedging.
Summary of Derivative Activity
Table 25 summarizes the notional balances and fair values of our derivatives by type for the years endedDecember 31, 2002 and 2001.
Table 25: Derivative Notional Amounts and Net Fair Values
December 31, 2002 December 31, 2001
Notional Net Fair Notional Net FairAmounts Values(1) Amounts Values(1)
(Dollars in millions)
Pay-Ñxed swaps ÏÏÏÏÏÏÏÏÏÏÏÏÏÏÏÏÏÏÏÏÏÏÏÏÏÏÏÏÏÏÏÏÏÏÏÏÏÏÏÏÏÏÏÏÏÏ $168,512 $(17,892) $213,680 $(9,792)
Receive-Ñxed swaps ÏÏÏÏÏÏÏÏÏÏÏÏÏÏÏÏÏÏÏÏÏÏÏÏÏÏÏÏÏÏÏÏÏÏÏÏÏÏÏÏÏÏ 52,370 4,010 39,069 899
Basis swaps ÏÏÏÏÏÏÏÏÏÏÏÏÏÏÏÏÏÏÏÏÏÏÏÏÏÏÏÏÏÏÏÏÏÏÏÏÏÏÏÏÏÏÏÏÏÏÏÏÏ 25,525 4 47,054 1
Caps and swaptionsÏÏÏÏÏÏÏÏÏÏÏÏÏÏÏÏÏÏÏÏÏÏÏÏÏÏÏÏÏÏÏÏÏÏÏÏÏÏÏÏÏÏÏ 397,868 12,834 219,943 6,267
Other ÏÏÏÏÏÏÏÏÏÏÏÏÏÏÏÏÏÏÏÏÏÏÏÏÏÏÏÏÏÏÏÏÏÏÏÏÏÏÏÏÏÏÏÏÏÏÏÏÏÏÏÏÏÏ 12,320 (987) 13,393 (1,490)
Total ÏÏÏÏÏÏÏÏÏÏÏÏÏÏÏÏÏÏÏÏÏÏÏÏÏÏÏÏÏÏÏÏÏÏÏÏÏÏÏÏÏÏÏÏÏÏÏÏÏÏÏ $656,595 $ (2,031) $533,139 $(4,115)
(1) Based on year-end fair values, estimated by calculating the cost, on a net present value basis, to settle at currentmarket rates all outstanding derivative contracts.
Table 26 shows the additions and maturities of derivatives by type during 2001 and 2002, along with theexpected maturities of derivatives outstanding at December 31, 2002.
71

Table 26: Derivative Activity and Maturity Data
Pay-Fixed/Receive-Variable Swaps(2)
Receive-FixedPay Receive Pay-Variable/ Basis Caps and
Amount Rate(3) Rate(3) Swaps Swaps Swaptions Other(4) Total
(Dollars in millions)
Notional Amounts:(1)
Balance at January 1, 2001 ÏÏÏÏ $153,737 6.74% 6.79% $59,174 $14,559 $ 82,528 $14,742 $324,740
Additions ÏÏÏÏÏÏÏÏÏÏÏÏÏÏÏÏÏ 90,787 5.39 3.95 33,230 46,150 168,350 100 338,617
Maturities(5)ÏÏÏÏÏÏÏÏÏÏÏÏÏÏÏ 30,844 6.41 4.20 53,335 13,655 30,935 1,449 130,218
Balance at December 31, 2001 213,680 6.21 2.47 39,069 47,054 219,943 13,393 533,139
Additions ÏÏÏÏÏÏÏÏÏÏÏÏÏÏÏÏÏ 35,117 5.17 1.90 57,949 13,275 239,925 7,889 354,155
Maturities(5)ÏÏÏÏÏÏÏÏÏÏÏÏÏÏÏ 80,285 5.00 1.70 44,648 34,804 62,000 8,962 230,699
Balance at December 31, 2002 $168,512 6.07% 1.67% $52,370 $25,525 $397,868 $12,320 $656,595
Future Maturities of NotionalAmounts:(6)
2003 ÏÏÏÏÏÏÏÏÏÏÏÏÏÏÏÏÏÏÏÏÏ $ 26,230 5.03% 1.68% $15,422 $18,090 $122,718 $ Ì $182,460
2004 ÏÏÏÏÏÏÏÏÏÏÏÏÏÏÏÏÏÏÏÏÏ 15,330 5.60 1.68 4,875 6,795 39,100 4,147 70,247
2005 ÏÏÏÏÏÏÏÏÏÏÏÏÏÏÏÏÏÏÏÏÏ 10,600 6.28 1.67 6,355 170 28,200 1,200 46,525
2006 ÏÏÏÏÏÏÏÏÏÏÏÏÏÏÏÏÏÏÏÏÏ 11,450 6.19 1.60 3,650 100 12,350 616 28,166
2007 ÏÏÏÏÏÏÏÏÏÏÏÏÏÏÏÏÏÏÏÏÏ 15,350 5.45 1.69 6,050 100 23,275 Ì 44,775
Thereafter ÏÏÏÏÏÏÏÏÏÏÏÏÏÏÏÏ 89,552 6.51 1.66 16,018 270 172,225 6,357 284,422
Total ÏÏÏÏÏÏÏÏÏÏÏÏÏÏÏÏÏÏÏ $168,512 6.07% 1.67% $52,370 $25,525 $397,868 $12,320 $656,595
(1) Dollars represent notional amounts that indicate only the amount on which payments are being calculated and do notrepresent the amount at risk of loss.
(2) Notional amounts include callable swaps of $35 billion and $32 billion with weighted-average pay rates of6.75 percent and 6.72 percent and weighted-average receive rates of 1.68 percent and 2.54 percent at December 31,2002 and December 31, 2001, respectively.
(3) The weighted-average interest rate payable and receivable is as of the date indicated. The interest rates of the swapsmay be variable-rate, so these rates may change as prevailing interest rates change.
(4) Includes foreign currency swaps, futures contracts, and derivative instruments that provide a hedge against interestrate Öuctuations.
(5) Includes matured, called, exercised, and terminated amounts.
(6) Based on stated maturities. Assumes that variable interest rates remain constant at December 31, 2002 levels.
Derivative Counterparty Risk
At December 31, 2002, over 99 percent of the $657 billion notional amount of our outstanding derivativetransactions were with counterparties rated A or better both by Standard & Poor's (""S&P'') and Moody's.Our derivative instruments were diversiÑed among 21 and 23 counterparties at year-end 2002 and 2001,respectively, to reduce our credit risk concentrations. At December 31, 2002, eight counterparties with creditratings of A or better represented approximately 76 percent of the total notional amount of outstandingderivatives transactions. The outstanding notional amount for each of these eight counterparties rangedbetween 5 percent and 15 percent of our total outstanding notional amount at December 31, 2002. Each of theremaining counterparties accounted for less than 5 percent of the total outstanding notional amount atDecember 31, 2002. In comparison, eight counterparties with credit ratings of A or better accounted forapproximately 78 percent of the total notional outstanding amount at December 31, 2001.
The primary credit exposure that we have on a derivative transaction is that a counterparty might defaulton payments due, which could result in having to replace the derivative with a diÅerent counterparty at ahigher cost. The exposure to counterparty default after oÅsetting arrangements, such as master netting
72

agreements and the value of related collateral, is the appropriate measure of the actual credit risk of derivativecontracts.
We believe the risk of loss on Fannie Mae's derivatives book is low for three primary reasons: (1) ourstringent counterparty eligibility standards, (2) our conservative collateral policy, which has provisionsrequiring collateral on our derivative contracts in gain positions, and (3) our intensive exposure monitoringand management.
Fannie Mae has never experienced a loss on a derivative transaction due to credit default by acounterparty. The credit risk on our derivative transactions is low because our counterparties are of very highcredit quality. Our counterparties consist of large banks, broker-dealers, and other Ñnancial institutions thathave a signiÑcant presence in the derivatives market, most of whom are based in the United States. Wemanage derivative counterparty credit risk by contracting only with experienced counterparties that have highcredit ratings. We initiate derivative contracts only with counterparties rated A or better. As an additionalprecaution, we have a conservative collateral management policy with provisions for requiring collateral on ourderivative contracts in gain positions.
We also monitor credit exposure on our derivatives daily by valuing them using internal pricing modelsand dealer quotes. We make collateral calls daily based on the results of our internal models and dealer quotes.We enter into master agreements that provide for netting of amounts due to us and amounts due tocounterparties under those agreements. New York law governs all of our master derivatives agreements.
The estimated total notional balance of the global derivatives market was $152 trillion at June 30, 2002based on combined data from the Bank for International Settlements for over-the-counter derivatives andpublished Ñgures for exchange-traded derivatives. Fannie Mae's outstanding notional principal balance of$657 billion at December 31, 2002 represented less than .5 percent of the total estimated derivatives market.Although notional principal is a commonly used measure of volume in the derivatives market, it is not ameaningful measure of market or credit risk since the notional amount does not change hands other than inthe case of foreign currency swaps. Counterparties use the notional amounts of derivative instruments tocalculate contractual cash Öows to be exchanged. However, the notional amount is signiÑcantly greater thanthe potential market or credit loss that could result from such transactions. The fair value of derivatives in again position is a more meaningful measure of our current market exposure on derivatives. Table 27 shows ourexposure on derivatives by maturity at December 31, 2002 and 2001 and counterparty credit ratings based onthese maturities.
Table 27: Derivative Credit Loss Exposure(1)
December 31, 2002 December 31, 2001
Credit Rating Credit Rating
AAA AA A BBB Total AAA AA A BBB Total
(Dollars in millions)
Less than 1 year ÏÏÏÏÏÏÏÏÏÏÏÏÏ $ Ì $ 69 $ 6 $ Ì $ 75 $ Ì $ Ì $ Ì $ Ì $ Ì1 to 5 years ÏÏÏÏÏÏÏÏÏÏÏÏÏÏÏÏÏ Ì 486 116 Ì 602 Ì 43 43 Ì 86Over 5 yearsÏÏÏÏÏÏÏÏÏÏÏÏÏÏÏÏÏ 21 1,334 2,328 Ì 3,683 136 671 826 Ì 1,633
Subtotal ÏÏÏÏÏÏÏÏÏÏÏÏÏÏÏÏÏÏ 21 1,889 2,450 Ì 4,360 136 714 869 Ì 1,719
Maturity distributionnetting(2)ÏÏÏÏÏÏÏÏÏÏÏÏÏÏÏÏ (21) (368) (670) Ì (1,059) (136) (528) (289) Ì (953)
ExposureÏÏÏÏÏÏÏÏÏÏÏÏÏÏÏÏÏÏÏÏ Ì 1,521 1,780 Ì 3,301 Ì 186 580 Ì 766Collateral held ÏÏÏÏÏÏÏÏÏÏÏÏÏÏÏ Ì 1,382 1,722 Ì 3,104 Ì 95 561 Ì 656
Exposure net of collateralÏÏÏÏÏÏ $ Ì $ 139 $ 58 $ Ì $ 197 $ Ì $ 91 $ 19 $ Ì $ 110
Notional amount ÏÏÏÏÏÏÏÏÏÏÏÏÏ $21,045 $316,813 $318,487 $250 $656,595 $71,173 $316,588 $145,128 $250 $533,139Number of counterparties ÏÏÏÏÏ 2 11 7 1 21 3 16 3 1 23
(1) Represents the exposure to credit loss on derivative instruments, which is estimated by calculating the cost, on a present value basis,to replace all outstanding derivative contracts in a gain position. Reported on a net-by-counterparty basis where a legal right of oÅsetexists under an enforceable master settlement agreement. Derivative gains and losses with the same counterparty in the samematurity category are presented net within the maturity category.
(2) Represents impact of netting of derivatives in a gain position and derivatives in a loss position for the same counterparty acrossmaturity categories.
73

We estimate exposure to credit loss on derivative instruments by calculating the replacement cost, on apresent value basis, to settle at current market prices all outstanding derivative contracts in a gain position.Fannie Mae's exposure on derivative contracts (taking into account master settlement agreements that allowfor netting of payments and excluding collateral received) was $3.301 billion at December 31, 2002, comparedwith $766 million at December 31, 2001. We expect the credit exposure on derivative contracts to Öuctuatewith both changes in interest rates and implied volatility. We held $3.104 billion of collateral throughcustodians for derivative instruments at December 31, 2002 and $656 million of collateral at December 31,2001. Assuming the highly unlikely event that all of our derivative counterparties to which Fannie Mae wasexposed at December 31, 2002 were to default simultaneously, it would have cost an estimated $197 million toreplace the economic value of those contracts. This replacement cost represents approximately 2 percent ofour 2002 pre-tax core business earnings. The replacement cost, or exposure after consideration of collateralheld was $110 million at December 31, 2001. Changes in both interest rates and the type of derivativetransactions with speciÑc counterparties increased our exposure at the end of 2002.
At December 31, 2002 and December 31, 2001, 100 percent of our exposure on derivatives, beforeconsideration of collateral held, was with counterparties rated A or better by S&P and Moody's. Fivecounterparties with credit ratings of A or better accounted for approximately 92 percent and 98 percent of ourexposure on derivatives before consideration of collateral held at December 31, 2002 and 2001, respectively.Seventy-one percent of our net exposure of $197 million at December 31, 2002 was with six counterpartiesrated AA or better by S&P and Aa or better by Moody's. The percentage of our exposure with these sixcounterparties ranged from 2 to 23 percent. In comparison, Ñve counterparties rated AA or better by S&P andAa or better by Moody's accounted for 83 percent of our net exposure of $110 million at December 31, 2001.The percentage of our net exposure with counterparties rated AA or better by S&P and Aa or better byMoody's fell during 2002 because of a change in the relative mix of our derivative products in response tochanges in market conditions that shifted the relative level of activity and exposure between individualcounterparties. We mitigate our net exposure on derivative transactions through a collateral managementpolicy, which consists of four primary components: (1) minimum collateral thresholds; (2) collateralvaluation percentages; (3) overcollateralization based on rating downgrades; and (4) daily monitoringprocedures.
‚ Minimum Collateral Thresholds
Derivative counterparties are obligated to post collateral to Fannie Mae when we are exposed to creditlosses exceeding agreed-upon thresholds that are based on counterparty credit ratings. We determine thecollateral amount that counterparties are required to post based on their credit rating and our level of creditexposure. The amount of collateral generally must equal the excess of Fannie Mae's exposure over thethreshold amount. Table 28 presents Fannie Mae's general ratings-based collateral thresholds.
Table 28: Fannie Mae Ratings-Based Collateral Thresholds
Credit Rating
S&P Moody's Exposure Threshold
(Dollars in millions)
AAA Aaa ÏÏÏÏÏÏÏÏÏÏÏÏÏÏÏÏÏÏÏÏÏÏÏÏÏÏÏÏÏÏÏÏ Mutually agreed on
AA° Aa1 ÏÏÏÏÏÏÏÏÏÏÏÏÏÏÏÏÏÏÏÏÏÏÏÏÏÏÏÏÏÏÏÏ $100
AA Aa2 ÏÏÏÏÏÏÏÏÏÏÏÏÏÏÏÏÏÏÏÏÏÏÏÏÏÏÏÏÏÏÏÏ 50
AA¿ Aa3 ÏÏÏÏÏÏÏÏÏÏÏÏÏÏÏÏÏÏÏÏÏÏÏÏÏÏÏÏÏÏÏÏ 50
A° A1 ÏÏÏÏÏÏÏÏÏÏÏÏÏÏÏÏÏÏÏÏÏÏÏÏÏÏÏÏÏÏÏÏÏ 25
A A2 ÏÏÏÏÏÏÏÏÏÏÏÏÏÏÏÏÏÏÏÏÏÏÏÏÏÏÏÏÏÏÏÏÏ 10
A¿ or below A3 or below ÏÏÏÏÏÏÏÏÏÏÏÏÏÏÏÏÏÏÏÏÏÏÏÏÏ 0 (see Table 29)
‚ Collateral Valuation Percentages
We require counterparties to post speciÑc types of collateral to meet their collateral requirements. Thecollateral posted by our counterparties at December 31, 2002 was principally in the form of cash or
74

U.S. Treasury securities with a small amount of agency MBS. All of the collateral posted by ourcounterparties was in the form of cash or U.S. Treasury securities at December 31, 2001. We assign each typeof collateral a speciÑc valuation percentage based on its relative risk. For example, cash receives a 100 percentvaluation, while certain U.S. Treasury instruments may receive only a 98 percent valuation percentage. Incases where the valuation percentage for a certain type of collateral is less than 100 percent, we requirecounterparties to post an additional amount of collateral to meet their requirements.
‚ Overcollateralization Based on Low Credit Ratings
We further reduce our net exposure on derivatives by generally requiring overcollateralization fromcounterparties whose credit ratings have dropped below predetermined levels. Counterparties falling belowthese levels must post collateral beyond the amounts previously noted to meet their overall requirements.Table 29 presents Fannie Mae's standard valuation percentages for overcollateralization based on counterpartycredit ratings. The percentage of additional collateral is applied to the initial amount of collateral required tobe posted.
Table 29: Fannie Mae Standard Collateral Valuation Percentages
AdditionalPercentage
of CollateralCredit Rating to be Posted
A/A2 or above ÏÏÏÏÏÏÏÏÏÏÏÏÏÏÏÏÏÏÏÏÏÏÏÏÏÏÏÏÏÏÏÏÏÏÏÏÏÏÏÏÏÏÏÏÏÏÏÏÏÏÏÏÏÏÏ 0%
A¿/A3 to BBB°/Baa1ÏÏÏÏÏÏÏÏÏÏÏÏÏÏÏÏÏÏÏÏÏÏÏÏÏÏÏÏÏÏÏÏÏÏÏÏÏÏÏÏÏÏÏÏÏÏÏÏ 10
BBB/Baa2 or belowÏÏÏÏÏÏÏÏÏÏÏÏÏÏÏÏÏÏÏÏÏÏÏÏÏÏÏÏÏÏÏÏÏÏÏÏÏÏÏÏÏÏÏÏÏÏÏÏÏÏÏ 25
‚ Frequent Monitoring Procedures
We mark our collateral position daily against exposure using both internal and external pricing modelsand compare these calculations to our counterparties' valuations. Both Fannie Mae and our derivativecounterparties transfer collateral within two business days based on the agreed-upon valuation. Pursuant toFannie Mae's collateral agreements we reserve the right to value exposure and collateral adequacy at any time.A New York-based third-party custodian holds all of the collateral posted to Fannie Mae and monitors thevalue on a daily basis.
Credit Risk Management
Credit risk is the risk of loss to future earnings or future cash Öows that may result from the failure of aborrower or institution to fulÑll its contractual obligation to make payments to Fannie Mae or an institution'sfailure to perform a service for us. We assume and manage mortgage credit risk and institutional credit riskthat arise through a variety of transactions. We actively manage credit risk to maintain credit losses withinlevels that generate attractive proÑtability and returns on capital and meet our expectations for consistentÑnancial performance.
The Chief Credit OÇcer has primary responsibility for setting strategies to achieve the credit risk goalsand objectives set by our Board of Directors. The Chief Credit OÇcer, who reports to our Chief FinancialOÇcer, chairs Fannie Mae's Credit Risk Policy Committee. The Credit Risk Policy Committee works inconcert with the Portfolios and Capital Committee and the Operations, Transactions and Investments(""OTI'') Committee to provide corporate governance over Fannie Mae's credit risk. Fannie Mae's businessunits have primary responsibility for managing our business activities in conformity with the credit strategiesand requirements set by our committees. Within each business unit, we have a credit oÇcer who hasresponsibility for certain credit risk decisions outlined in a written delegation of credit authority approved bythe Credit Risk Policy Committee. Our business unit credit oÇcers report directly to the business unit leadersand indirectly to the Chief Credit OÇcer.
75

In addition, we have corporate credit risk management teams that report to the Chief Credit OÇcer andwork with the business units to identify, measure, and manage credit risks. Our Policy and Standards teamestablishes and monitors credit policies, standards, and delegations of credit authority throughout theorganization. Our Credit Research and Portfolio Management team is responsible for understanding andmanaging the aggregate risk exposure, risk sensitivity, and usage of risk capital. Our Counterparty RiskManagement team is responsible for setting company-wide policies governing Fannie Mae's contractualexposures to institutional counterparties and identifying and measuring these exposures. Our Credit Manage-ment Information Systems team prepares analysis that monitors and identiÑes key credit risk trends in thecredit book of business.
Our business units monitor and enforce compliance with credit risk standards and identify changes inmarket conditions that may warrant changes to credit policies and standards. For example, business unitsprovide quality control oversight by requiring lenders to maintain a rigorous quality control process and bymaintaining our own quality assurance process. Our regional oÇces, which are responsible for managingcustomer relationships, also play an important risk management role. Working with the business unit leaders,regional customer management teams ensure that pricing and transaction terms are structured appropriately tomeet the unique needs and risks of Fannie Mae's various lender partners. Regional oÇcers have creditauthority to make credit decisions or develop customized mortgage solutions up to certain thresholds asoutlined in the Credit Risk Policy Committee's written delegation of authority. Delegating certain creditauthority and responsibility to our regional oÇces has allowed us to work closely with our lender partners,which has been integral to achieving a track record of eÅective credit risk management.
Mortgage Credit Risk
Our mortgage credit risk stems from our mortgage credit book of business, where we bear the risk thatborrowers fail to make payments required on their mortgages. Our mortgage credit book of business consists ofmortgages we own, mortgages and MBS we guarantee, and other contractual arrangements or guarantees. TheCredit Guaranty business manages our mortgage credit risk. We are exposed to credit risk on our mortgagecredit book of business because we either own the assets or have guaranteed the timely payment of scheduledprincipal and interest to third parties. For example, in the event of the default of a borrower on a mortgageunderlying an MBS, we absorb any losses, net of the proceeds of any credit enhancements, that result and payto the MBS investor all accrued interest and the full outstanding principal balance of the defaulted loan.
A certain level of credit losses is an inherent consequence of engaging in the Credit Guaranty business.Our risk management focus is on controlling the level and volatility of credit losses that result from changes ineconomic conditions. Table 30 presents the composition of our mortgage credit book of business for 2002,2001, and 2000.
76

Table 30: Composition of Mortgage Credit Book of Business
December 31, 2002
Single-family Multifamily Total
Conventional Government Conventional Government Conventional Government
(Dollars in millions)
Mortgage portfolio:(1)
Mortgage loans ÏÏÏÏÏÏÏÏÏÏÏÏÏÏÏÏÏÏÏÏÏ $ 166,772 $ 5,458 $12,217 $1,354 $ 178,989 $ 6,812Fannie Mae MBS ÏÏÏÏÏÏÏÏÏÏÏÏÏÏÏÏÏÏ 497,818 2,447 6,765 1,801 504,583 4,248Agency mortgage securities(2)ÏÏÏÏÏÏÏÏÏ 31,959 16,453 Ì Ì 31,959 16,453Other mortgage-related securities(3)ÏÏÏÏ 27,833 Ì 284 Ì 28,117 ÌMortgage revenue bonds ÏÏÏÏÏÏÏÏÏÏÏÏÏ Ì 14,086 Ì 5,552 Ì 19,638
724,382 38,444 19,266 8,707 743,648 47,151Outstanding MBS(4) ÏÏÏÏÏÏÏÏÏÏÏÏÏÏÏÏÏÏ 953,729 24,616 50,671 440 1,004,400 25,056Other(5) ÏÏÏÏÏÏÏÏÏÏÏÏÏÏÏÏÏÏÏÏÏÏÏÏÏÏÏÏÏ 360 Ì 11,479 Ì 11,839 Ì
Mortgage credit book of businessÏÏÏÏÏÏÏÏ $1,678,471 $63,060 $81,416 $9,147 $1,759,887 $72,207
December 31, 2001
Single-family Multifamily Total
Conventional Government Conventional Government Conventional Government
Mortgage portfolio:(1)
Mortgage loans ÏÏÏÏÏÏÏÏÏÏÏÏÏÏÏÏÏÏÏÏÏ $ 150,350 $ 5,069 $ 8,987 $1,551 $ 159,337 $ 6,620Fannie Mae MBS ÏÏÏÏÏÏÏÏÏÏÏÏÏÏÏÏÏÏ 420,631 3,438 5,315 2,002 425,946 5,440Agency mortgage securities(2)ÏÏÏÏÏÏÏÏÏ 42,105 19,607 Ì Ì 42,105 19,607Other mortgage-related securities(3)ÏÏÏÏ 29,259 Ì 321 Ì 29,580 ÌMortgage revenue bonds ÏÏÏÏÏÏÏÏÏÏÏÏÏ Ì 13,903 Ì 4,476 Ì 18,379
642,345 42,017 14,623 8,029 656,968 50,046Outstanding MBS(4) ÏÏÏÏÏÏÏÏÏÏÏÏÏÏÏÏÏÏ 800,411 13,546 44,428 482 844,839 14,028Other(5) ÏÏÏÏÏÏÏÏÏÏÏÏÏÏÏÏÏÏÏÏÏÏÏÏÏÏÏÏÏ 930 Ì 15,491 Ì 16,421 Ì
Mortgage credit book of businessÏÏÏÏÏÏÏÏ $1,443,686 $55,563 $74,542 $8,511 $1,518,228 $64,074
December 31, 2000
Single-family Multifamily Total
Conventional Government Conventional Government Conventional Government
Mortgage portfolio:(1)
Mortgage loans ÏÏÏÏÏÏÏÏÏÏÏÏÏÏÏÏÏÏÏÏÏ $ 139,382 $ 4,763 $ 6,547 $1,814 $ 145,929 $ 6,577Fannie Mae MBS ÏÏÏÏÏÏÏÏÏÏÏÏÏÏÏÏÏÏ 342,299 3,364 3,308 2,057 345,607 5,421Agency mortgage securities(2)ÏÏÏÏÏÏÏÏÏ 32,987 24,137 Ì Ì 32,987 24,137Other mortgage-related securities(3)ÏÏÏÏ 33,931 Ì 333 Ì 34,264 ÌMortgage revenue bonds ÏÏÏÏÏÏÏÏÏÏÏÏÏ 3 11,890 1 3,309 4 15,199
548,602 44,154 10,189 7,180 558,791 51,334Outstanding MBS(4) ÏÏÏÏÏÏÏÏÏÏÏÏÏÏÏÏÏÏ 662,621 8,076 35,460 527 698,081 8,603Other(5) ÏÏÏÏÏÏÏÏÏÏÏÏÏÏÏÏÏÏÏÏÏÏÏÏÏÏÏÏÏ 993 Ì 12,323 Ì 13,316 Ì
Mortgage credit book of businessÏÏÏÏÏÏÏÏ $1,212,216 $52,230 $57,972 $7,707 $1,270,188 $59,937
(1) Excludes mark-to-market gains at December 31, 2002 and 2001 of $6.501 billion and $462 million, respectively. Excludes mark-to-market losses at December 31, 2000 of $3 million.
(2) Includes mortgage-related securities issued by Freddie Mac and Ginnie Mae.
(3) Includes mortgage-related securities issued by entities other than Fannie Mae, Freddie Mac, or Ginnie Mae.
(4) MBS and other mortgage-related securities guaranteed by Fannie Mae and held by investors other than Fannie Mae. The principalbalance on resecuritized MBS is included only once.
(5) Includes additional single-family and multifamily credit enhancements not otherwise reÖected in the table.
Fannie Mae's overall objective in managing mortgage credit risk is to deliver consistent earnings growthand target returns on capital in a wide range of economic environments. Central elements of our approachinclude: (1) managing the proÑle and quality of mortgages in the mortgage credit book, (2) using creditenhancements to reduce credit losses, (3) assessing the sensitivity of the proÑtability of the mortgage creditbook of business to changes in composition and the economic environment, and (4) managing problem assetsto mitigate credit losses.
Given the important diÅerences in the nature and management of credit risk between single-family andmultifamily loans, we manage and discuss these two types of loans separately.
77

Single-family
The single-family mortgage credit book primarily consists of loans, MBS in our mortgage portfolio, MBSand other mortgage-related securities guaranteed by Fannie Mae and held by other investors (""outstandingMBS''), and other mortgage-related securities we own backed by loans on properties that have four or fewerresidential units. This section details our single-family risk management practices, risk characteristics, andperformance. While we manage the credit risk on the entire single-family mortgage credit book, in some caseswe may not have certain loan-level information to report risk characteristics and performance disclosures.Therefore, unless otherwise noted, the credit statistics on Fannie Mae's conventional single-family mortgagecredit book presented in this section will generally include only mortgage loans in portfolio, MBS in portfolio,and outstanding MBS where we have more comprehensive, detailed loan-level transaction information. Theseloans represent 96 percent of our single-family mortgage credit book at the end of 2002. Most of the remaining4 percent of our conventional single-family mortgage credit book consists of mortgage-related securities ratedAAA at acquisition, including mortgage-related securities guaranteed by Freddie Mac and Ginnie Mae.
1. Managing the proÑle and quality of mortgages in the single-family mortgage credit book.
Mortgage credit risk on a particular single-family loan is aÅected by numerous characteristics, includingthe type of loan, the down-payment amount, and the strength of the borrower's credit history. These and otherfactors, such as home price appreciation, aÅect both the level of expected credit loss on a given loan and thesensitivity of that loss to changes in the economic environment. We attempt to understand the overall creditrisk in our loans, earn an attractive risk-adjusted return from appropriate guaranty fee pricing, and mitigate ourrisks through the use of credit enhancements and eÅective asset management. Our risk mitigating activitiesreduce the incidence and severity of loss and minimize the volatility of credit losses, which helps Fannie Maein achieving stable earnings growth and a competitive return on equity over time.
We establish detailed policies and employ various processes to validate that the characteristics of theloans purchased or guaranteed comply with key underwriting and eligibility criteria. We also assess thecharacteristics and quality of a lender's loans and processes through an audit program and our customerrelationship management teams. Mortgage loans that we buy or guarantee must comply with certainunderwriting and eligibility characteristics to ensure that the overall risk of the particular loan is withinacceptable limits.
Lenders represent and warrant compliance with our asset acquisition requirements when they sellmortgage loans or securities to us or seek a guarantee from us. We may require the lender to repurchase a loanor enforce some other remedy if we identify any deÑciencies. Since 1995, we have developed and reÑned DUto assist lenders in underwriting and complying with our other loan eligibility criteria. DU consistently andobjectively applies risk analytics, underwriting, and eligibility standards to prospective mortgage loans.Approximately 60 percent of the single-family conventional loans we purchased or guaranteed in 2002 wereprocessed through DU, up from 59 percent in 2001 and 56 percent in 2000. We also buy or guarantee loansunderwritten manually or through other automated underwriting systems, subject to appropriate lenderrepresentations and warranties. In certain circumstances involving use of automated underwriting, we mayrelieve lenders of a limited number of the standard representations and warranties.
2. Using credit enhancements to reduce credit losses.
Credit enhancements are contracts in which a third party agrees to pay Fannie Mae if there is a creditevent, such as a loan default. Credit enhancements enable us to transform the risk and return proÑle of themortgage credit book of business to be consistent with our objectives. Single-family credit enhancementsinclude primary loan-level mortgage insurance, pool mortgage insurance, recourse arrangements with lenders,and other customized risk-sharing contracts.
The majority of our single-family credit enhancement is primary loan-level mortgage insurance. When werequire primary loan-level mortgage insurance on loans with loan-to-value ratios above 80 percent, wetypically require greater coverage than the minimum level of credit enhancement required by our Charter Actif primary mortgage insurance is the only source used to meet our credit enhancement requirement. Subject toour policies and to the Homeowners Protection Act of 1998, primary loan-level mortgage insurance can be
78

cancelled either automatically or at the borrower's option in certain circumstances where the loan-to-valueratio has decreased below 80 percent. We also may require or acquire supplemental credit enhancement onloans based on risk and pricing. While credit enhancements reduce our mortgage-related credit losses, theyalso generate institutional counterparty risk that we discuss in the ""Institutional Counterparty Credit Risk''section. We focus credit enhancement coverage on loans in our mortgage credit book of business with a higherrisk proÑle. The percentage of our conventional single-family credit book of business with credit enhancementswas 27 percent at December 31, 2002, down from 32 percent at December 31, 2001. The decrease in creditenhancement coverage during 2002 was primarily due to the high level of reÑnance loans acquisitions withlower loan-to-value ratios that did not require credit enhancement. Because of the lower risk proÑle of theseloans, we elected not to purchase credit enhancement on these loans.
3. Assessing the sensitivity of the proÑtability of the single-family mortgage credit book of business tochanges in composition and the economic environment.
We use analytical tools to measure credit risk exposures, assess performance of our single-familymortgage credit book of business, and evaluate risk management alternatives. We continually reÑne ourmethods of measuring credit risk, setting risk and return targets, and transferring risk to third parties. We useour analytical models to establish forecasts and expectations for the credit performance of loans in themortgage credit book of business and compare actual performance to those expectations. Comparison of actualversus projected performance and changes in other key trends may signal a change in risk or return proÑlesand provide the basis for changing policies, standards, guidelines, credit enhancements, or guaranty fees.
For example, we use models to project guaranty fee income and credit losses, including forgone intereston nonperforming assets, for the single-family mortgage credit book across a wide range of potential interestrate and home price environments. We use current data on home values, borrower payment patterns, non-mortgage consumer credit history, and management's economic outlook to assess our sensitivity to creditlosses. We closely examine a range of potential economic scenarios to monitor the sensitivity of credit losses.As part of our voluntary safety and soundness initiatives, we elected to disclose on a quarterly lagged basis thesensitivity of the present value of future single-family credit losses to an immediate 5 percent decline in homeprices. Table 31 shows the results at the end of 2002, 2001, and 2000. Our models indicate that home pricemovements are an important predictor of credit performance. We selected a 5 percent immediate decline inhome prices because it is a stressful scenario. Based on housing data from OFHEO, the national average rateof home price appreciation over the last twenty years has been about 4.7 percent, while the lowest nationalaverage growth rate in any single year has been .2 percent. Historical statistics from OFHEO's housing indexreport indicate that there has never been a nationwide decline of 5 percent in home prices within a one-yearperiod since the federal government began tracking this data in 1975.
79
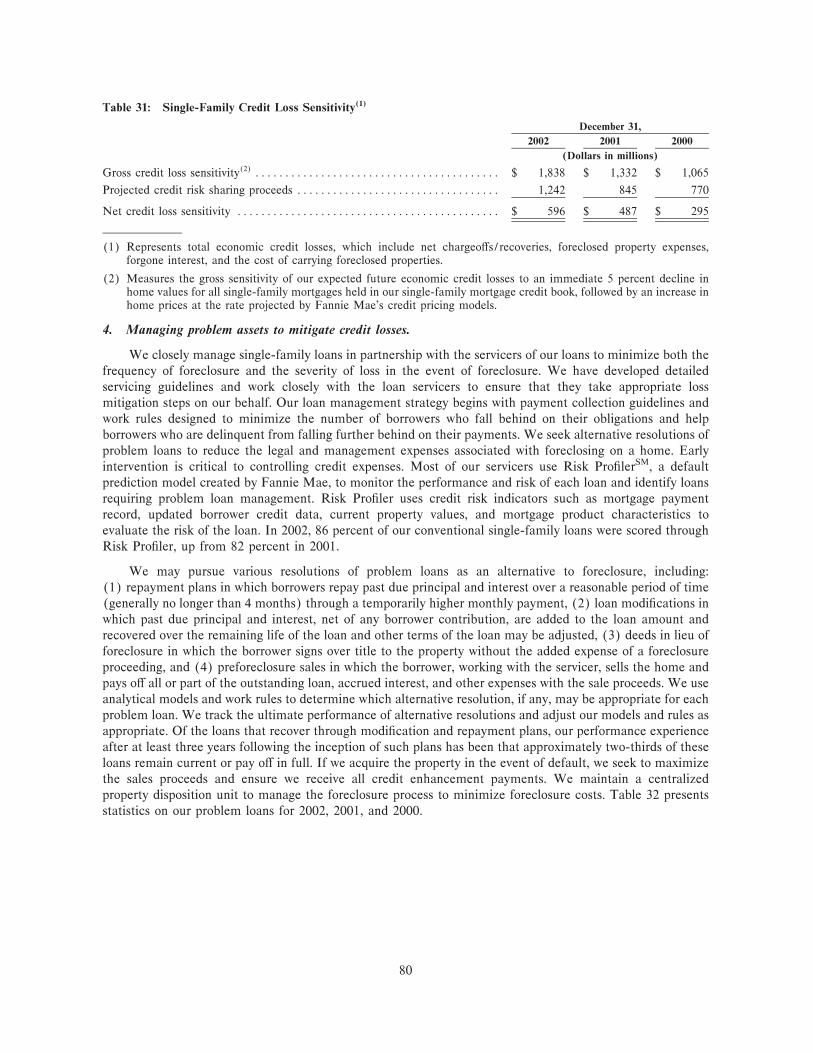
Table 31: Single-Family Credit Loss Sensitivity(1)
December 31,
2002 2001 2000
(Dollars in millions)
Gross credit loss sensitivity(2) ÏÏÏÏÏÏÏÏÏÏÏÏÏÏÏÏÏÏÏÏÏÏÏÏÏÏÏÏÏÏÏÏÏÏÏÏÏÏÏÏÏ $ 1,838 $ 1,332 $ 1,065
Projected credit risk sharing proceeds ÏÏÏÏÏÏÏÏÏÏÏÏÏÏÏÏÏÏÏÏÏÏÏÏÏÏÏÏÏÏÏÏÏÏ 1,242 845 770
Net credit loss sensitivity ÏÏÏÏÏÏÏÏÏÏÏÏÏÏÏÏÏÏÏÏÏÏÏÏÏÏÏÏÏÏÏÏÏÏÏÏÏÏÏÏÏÏÏÏ $ 596 $ 487 $ 295
(1) Represents total economic credit losses, which include net chargeoÅs/recoveries, foreclosed property expenses,forgone interest, and the cost of carrying foreclosed properties.
(2) Measures the gross sensitivity of our expected future economic credit losses to an immediate 5 percent decline inhome values for all single-family mortgages held in our single-family mortgage credit book, followed by an increase inhome prices at the rate projected by Fannie Mae's credit pricing models.
4. Managing problem assets to mitigate credit losses.
We closely manage single-family loans in partnership with the servicers of our loans to minimize both thefrequency of foreclosure and the severity of loss in the event of foreclosure. We have developed detailedservicing guidelines and work closely with the loan servicers to ensure that they take appropriate lossmitigation steps on our behalf. Our loan management strategy begins with payment collection guidelines andwork rules designed to minimize the number of borrowers who fall behind on their obligations and helpborrowers who are delinquent from falling further behind on their payments. We seek alternative resolutions ofproblem loans to reduce the legal and management expenses associated with foreclosing on a home. Earlyintervention is critical to controlling credit expenses. Most of our servicers use Risk ProÑlerSM, a defaultprediction model created by Fannie Mae, to monitor the performance and risk of each loan and identify loansrequiring problem loan management. Risk ProÑler uses credit risk indicators such as mortgage paymentrecord, updated borrower credit data, current property values, and mortgage product characteristics toevaluate the risk of the loan. In 2002, 86 percent of our conventional single-family loans were scored throughRisk ProÑler, up from 82 percent in 2001.
We may pursue various resolutions of problem loans as an alternative to foreclosure, including:(1) repayment plans in which borrowers repay past due principal and interest over a reasonable period of time(generally no longer than 4 months) through a temporarily higher monthly payment, (2) loan modiÑcations inwhich past due principal and interest, net of any borrower contribution, are added to the loan amount andrecovered over the remaining life of the loan and other terms of the loan may be adjusted, (3) deeds in lieu offoreclosure in which the borrower signs over title to the property without the added expense of a foreclosureproceeding, and (4) preforeclosure sales in which the borrower, working with the servicer, sells the home andpays oÅ all or part of the outstanding loan, accrued interest, and other expenses with the sale proceeds. We useanalytical models and work rules to determine which alternative resolution, if any, may be appropriate for eachproblem loan. We track the ultimate performance of alternative resolutions and adjust our models and rules asappropriate. Of the loans that recover through modiÑcation and repayment plans, our performance experienceafter at least three years following the inception of such plans has been that approximately two-thirds of theseloans remain current or pay oÅ in full. If we acquire the property in the event of default, we seek to maximizethe sales proceeds and ensure we receive all credit enhancement payments. We maintain a centralizedproperty disposition unit to manage the foreclosure process to minimize foreclosure costs. Table 32 presentsstatistics on our problem loans for 2002, 2001, and 2000.
80

Table 32: Statistics on Conventional Single-Family Problem Loans
Number of Loans
2002 2001 2000
Repayment plans ÏÏÏÏÏÏÏÏÏÏÏÏÏÏÏÏÏÏÏÏÏÏÏÏÏÏÏÏÏÏÏÏÏÏÏÏÏÏÏÏÏÏÏÏÏÏÏÏÏÏÏ 5,470 4,237 5,320
ModiÑcations ÏÏÏÏÏÏÏÏÏÏÏÏÏÏÏÏÏÏÏÏÏÏÏÏÏÏÏÏÏÏÏÏÏÏÏÏÏÏÏÏÏÏÏÏÏÏÏÏÏÏÏÏÏÏ 14,552 10,506 9,503
Pre-foreclosure salesÏÏÏÏÏÏÏÏÏÏÏÏÏÏÏÏÏÏÏÏÏÏÏÏÏÏÏÏÏÏÏÏÏÏÏÏÏÏÏÏÏÏÏÏÏÏÏÏÏ 1,410 1,182 1,572
Properties acquired through foreclosure(1)ÏÏÏÏÏÏÏÏÏÏÏÏÏÏÏÏÏÏÏÏÏÏÏÏÏÏÏÏÏÏÏ 19,500 14,486 14,351
Total conventional single-family problem loans ÏÏÏÏÏÏÏÏÏÏÏÏÏÏÏÏÏÏÏÏÏÏÏÏÏÏ 40,932 30,411 30,746
Conventional single-family loans at December 31(2) ÏÏÏÏÏÏÏÏÏÏÏÏÏÏÏÏÏÏÏÏÏÏ 14,492,034 13,414,100 12,092,295
(1) Includes properties acquired via deeds-in-lieu of foreclosure, which totaled 192 in 2002, 163 in 2001, and 235 in 2000.
(2) Represents approximately 96 percent of our conventional single-family mortgage credit book where we have morecomprehensive, detailed loan-level transaction information.
Single-Family Mortgage Credit Book Characteristics and Performance
Economic conditions and home values strongly aÅect the credit risk proÑle of our single-family mortgagecredit book and our credit losses and impact the likelihood of default and the severity of any losses.
‚ Economic Trends
Beginning in 2001 and extending through early 2002, the U.S. economy experienced a mild recession.Economic growth, as measured by the change in GDP, began to slowly recover in 2002. GDP growth was veryrobust at 5.0 percent in the Ñrst quarter of 2002, but fell to 1.4 percent during the fourth quarter.Unemployment, a lagging economic indicator, peaked at 6.0 percent in April 2002, gradually declined to5.6 percent in September 2002, before rising again to 6.0 percent by year-end. In spite of these trends, homeprices continued to grow at a rate above long-term historical averages in 2002 although home price growth hasslowed from the record levels attained in the past few years. Based on OFHEO's fourth quarter 2002 HousePrice Index report, average home prices at the national level increased 6.89 percent in 2002. No census regionor state experienced negative home price growth in 2002. Over the last Ñve years, U.S. home appreciation hasaveraged 7.66 percent annually.
‚ Single-Family Loan Risk Characteristics
We monitor an array of risk characteristics to assess the sensitivity of our credit losses to economicchanges. Some of these risk characteristics are described below and quantiÑed in Tables 33 and 34. Wetypically obtain the data for these statistics from the sellers or servicers of the mortgage loans. We receiverepresentations and warranties as to the accuracy of the information from those providing it. Except for qualityassurance eÅorts, we do not independently verify the reported information. We generally collect loan levelstatistics only on conventional single-family mortgage loans held in our portfolio and loans backing FannieMae guaranteed MBS. These loans, collectively, represent the vast majority of our single-family mortgagecredit book of business.
‚ Loan-to-value (""LTV'') ratio: LTV ratio is the ratio of UPB to the value of the property that servesas collateral. Original LTV is based on the value reported to Fannie Mae at acquisition of the loan.Current LTV is based on current UPB and original value updated for subsequent changes in homevalues using Fannie Mae's internal home valuation models. LTV ratio is a strong predictor of creditperformance. The likelihood of default and the gross severity of a loss in the event of default are loweras the LTV ratio decreases, all other factors held equal. The estimated average current LTV ratio onthe mortgage credit book of business (which is a weighted average based on current UPB) increasedmarginally to 62 percent at December 31, 2002 from 60 percent at the end of 2001, largely due to thesubstantial volume of new business purchased or guaranteed in 2002 that has not yet had theopportunity to experience home price appreciation.
81

‚ Product type: Product type is deÑned by the nature of the interest rate applicable to the mortgage(Ñxed for the duration of the loan or adjustable subject to contractual terms) and by the maturity ofthe loan. We divide our business into three categories: long-term, Ñxed-rate mortgages with originalterms of greater than 20 years; intermediate-term, Ñxed-rate mortgages with original terms of 20 yearsor less; and adjustable-rate mortgages (ARMs) of any term. ARMs tend to have higher default riskthan Ñxed-rate loans, all other factors held equal. Our single-family mortgage credit book of businesscontinues to be heavily concentrated in long- and intermediate-term, Ñxed-rate products that aregenerally regarded as lower risk investments. At December 31, 2002, 93 percent of our single-familybook of business consisted of long-term, Ñxed-rate or intermediate-term, Ñxed-rate mortgages.
‚ Property type: We classify mortgages secured by housing with up to four living units as single-family.Mortgages on one-unit properties tend to have lower credit risk than mortgages on multiple-unitproperties, such as duplexes, all other factors held equal. The majority of Fannie Mae's book ofbusiness consists of loans secured by one-unit properties. The proportion of loans secured by multiple-unit properties has remained relatively stable over the past two years.
‚ Occupancy type: Borrowers may purchase a home as a primary residence, second or vacation home,or investment rental property. Mortgages on properties occupied by the borrower as a principal orsecond residence tend to have lower credit risk than mortgages on investment properties, all otherfactors held equal. The vast majority of Fannie Mae's book of business consists of mortgages onproperties occupied by the borrower as the principal residence. The proportion of loans secured byinvestment properties has remained relatively stable over the past three years.
‚ Credit score: Borrower credit history is a record of the use and repayment of varying forms of creditby the borrower. Since this information is typically complex and voluminous, statistical models areemployed to summarize the informationÌtypically into a single numeric indicator of borrower creditquality. We use several internal proprietary models to assess borrower credit quality at acquisition.Credit score is one measure often used by the Ñnancial services industry, and by Fannie Mae in somecases, to assess borrower credit quality. Credit scores are generated by credit repositories andcalculated based on proprietary statistical models that evaluate many types of information on aborrower's credit report and compare this information to the patterns in other credit reports. Onestatistical model used widely in the Ñnancial services industry was developed by Fair, Isaac &Company, Inc. (""Fair Isaac''). This model is used to create a credit score called the FICO» score.FICO» scores can vary depending on which credit repository is using the Fair Isaac model to supplythe score. FICO» scores, as reported by the credit repositories, may range from a low of 150 to a highof 950. According to Fair Isaac, a high FICO» score indicates a lesser degree of risk. A higher creditscore is an indicator of lower default risk, while a lower credit score indicates higher risk, all otherfactors held equal. On approximately two-thirds of the mortgages on which we acquire credit riskthrough purchase or guaranty, lenders provide credit scores that typically reÖect the borrower's credithistory just prior to our acquisition of the loan. For most of the remaining loans, we obtain credit scoressoon after acquisition. For a small proportion of loans, credit scores are not available. The credit scoreof an individual borrower can vary depending upon several factors, including the timing of when thescore is calculated and the credit repository from which the score is obtained. Management believes,however, that the average credit score across our book of business is a strong indicator of default riskwithin the single-family mortgage credit book of business. The credit quality of borrowers in our bookremained high at December 31, 2002, as evidenced by an average credit score of 714 at the time of loanpurchase or guarantee.
‚ Loan purpose: Loan purpose indicates how the borrower intends to use the funds. We designate theloan purpose as either purchase, cash-out reÑnance, or other reÑnance. The funds in a purchasetransaction are used to acquire a property. The funds in a cash-out reÑnance transaction are used forpurposes other than to pay oÅ an existing Ñrst mortgage lien, to pay oÅ any permissible subordinatemortgage liens, and to provide limited unrestricted cash proceeds to the borrower. All other reÑnancetransactions are deÑned as other reÑnancings. Cash-out reÑnance transactions generally have a higherrisk proÑle than purchase or other reÑnance transactions, all other factors held equal. The signiÑcant
82

reÑnance activity of the past two years resulted in a substantial shift in the proportion of reÑnance loansin our conventional single-family mortgage credit book to 62 percent at December 31, 2002 from54 percent at the end of 2001.
‚ Geographic concentration: Local economic conditions aÅect borrowers' ability to repay loans and thevalue of the collateral underlying a loan, all other factors held equal. We analyze geographic exposureat a variety of levels of geographic aggregation, including at the regional level. Geographic diversiÑca-tion reduces mortgage credit risk, and our geographic distributions have been consistently welldiversiÑed. We have signiÑcant business volumes in the West, with 26 percent at the end of 2002, 2001,and 2000. However, this exposure is low relative to the distribution of the overall mortgage marketbecause of our conforming loan limit, which restricts us in serving the Ñnancing needs of borrowers inhigher cost areas such as California.
‚ Loan age: We closely track year of origination and loan age, deÑned as the number of years sinceorigination. The peak ages for default are from three to seven years after origination. The average ageof our portfolio has decreased in the past year largely due to the high level of reÑnancings. As ofDecember 31, 2002, approximately 69 percent of our portfolio was three years old or less and only26 percent of the loans were in the peak default years, down from 42 percent at the end of 2001. AtDecember 31, 2001, 57 percent of the loans were three years old or less. At the end of 2000, 61 percentwere three years old or less and 48 percent were within their peak default years.
Table 33 shows our conventional single-family mortgage credit book of business at December 31, 2002,2001, and 2000, based on these risk characteristics. Table 34 shows conventional single-family purchase andguaranty acquisition volumes for the mortgage credit book of business based on these risk characteristics,while Table 35 presents a comparison of conventional single-family loans with some level of creditenhancement and loans without any credit enhancement based on selected risk characteristics. As we work toexpand Fannie Mae's presence, activities, and customer base in underserved markets through products such asExpanded Approval/Timely Payment Rewards‚, the overall credit risk proÑle of our conventional single-family mortgage credit book of business may change.
Table 33: Characteristics of Conventional Single-Family Mortgage Credit BookPercent of Book of Business(1)
2002 2001 2000
Original loan-to-value ratio(2):
G• 60.00% ÏÏÏÏÏÏÏÏÏÏÏÏÏÏÏÏÏÏÏÏÏÏÏÏÏÏÏÏÏÏÏÏÏÏÏÏÏÏÏÏÏÏÏÏÏÏÏÏÏÏÏÏÏÏÏÏÏÏÏÏÏÏÏÏÏÏÏÏ 20% 17% 16%
60.01% to 70.00% ÏÏÏÏÏÏÏÏÏÏÏÏÏÏÏÏÏÏÏÏÏÏÏÏÏÏÏÏÏÏÏÏÏÏÏÏÏÏÏÏÏÏÏÏÏÏÏÏÏÏÏÏÏÏÏÏÏÏÏÏÏÏÏ 15 14 14
70.01% to 80.00% ÏÏÏÏÏÏÏÏÏÏÏÏÏÏÏÏÏÏÏÏÏÏÏÏÏÏÏÏÏÏÏÏÏÏÏÏÏÏÏÏÏÏÏÏÏÏÏÏÏÏÏÏÏÏÏÏÏÏÏÏÏÏÏ 42 43 42
80.01% to 90.00% ÏÏÏÏÏÏÏÏÏÏÏÏÏÏÏÏÏÏÏÏÏÏÏÏÏÏÏÏÏÏÏÏÏÏÏÏÏÏÏÏÏÏÏÏÏÏÏÏÏÏÏÏÏÏÏÏÏÏÏÏÏÏÏ 13 14 15
Greater than 90.00%ÏÏÏÏÏÏÏÏÏÏÏÏÏÏÏÏÏÏÏÏÏÏÏÏÏÏÏÏÏÏÏÏÏÏÏÏÏÏÏÏÏÏÏÏÏÏÏÏÏÏÏÏÏÏÏÏÏÏÏÏÏ 10 12 13
Total ÏÏÏÏÏÏÏÏÏÏÏÏÏÏÏÏÏÏÏÏÏÏÏÏÏÏÏÏÏÏÏÏÏÏÏÏÏÏÏÏÏÏÏÏÏÏÏÏÏÏÏÏÏÏÏÏÏÏÏÏÏÏÏÏÏÏÏÏÏÏÏÏ 100% 100% 100%
Weighted average ÏÏÏÏÏÏÏÏÏÏÏÏÏÏÏÏÏÏÏÏÏÏÏÏÏÏÏÏÏÏÏÏÏÏÏÏÏÏÏÏÏÏÏÏÏÏÏÏÏÏÏÏÏÏÏÏÏÏÏÏÏÏÏ 73% 74% 75%
Current loan-to-value ratio(2):
G• 60.00% ÏÏÏÏÏÏÏÏÏÏÏÏÏÏÏÏÏÏÏÏÏÏÏÏÏÏÏÏÏÏÏÏÏÏÏÏÏÏÏÏÏÏÏÏÏÏÏÏÏÏÏÏÏÏÏÏÏÏÏÏÏÏÏÏÏÏÏÏ 41% 47% 45%
60.01% to 70.00% ÏÏÏÏÏÏÏÏÏÏÏÏÏÏÏÏÏÏÏÏÏÏÏÏÏÏÏÏÏÏÏÏÏÏÏÏÏÏÏÏÏÏÏÏÏÏÏÏÏÏÏÏÏÏÏÏÏÏÏÏÏÏÏ 18 19 24
70.01% to 80.00% ÏÏÏÏÏÏÏÏÏÏÏÏÏÏÏÏÏÏÏÏÏÏÏÏÏÏÏÏÏÏÏÏÏÏÏÏÏÏÏÏÏÏÏÏÏÏÏÏÏÏÏÏÏÏÏÏÏÏÏÏÏÏÏ 28 23 20
80.01% to 90.00% ÏÏÏÏÏÏÏÏÏÏÏÏÏÏÏÏÏÏÏÏÏÏÏÏÏÏÏÏÏÏÏÏÏÏÏÏÏÏÏÏÏÏÏÏÏÏÏÏÏÏÏÏÏÏÏÏÏÏÏÏÏÏÏ 9 7 8
Greater than 90.00%ÏÏÏÏÏÏÏÏÏÏÏÏÏÏÏÏÏÏÏÏÏÏÏÏÏÏÏÏÏÏÏÏÏÏÏÏÏÏÏÏÏÏÏÏÏÏÏÏÏÏÏÏÏÏÏÏÏÏÏÏÏ 4 4 3
Total ÏÏÏÏÏÏÏÏÏÏÏÏÏÏÏÏÏÏÏÏÏÏÏÏÏÏÏÏÏÏÏÏÏÏÏÏÏÏÏÏÏÏÏÏÏÏÏÏÏÏÏÏÏÏÏÏÏÏÏÏÏÏÏÏÏÏÏÏÏÏÏÏ 100% 100% 100%
Weighted average ÏÏÏÏÏÏÏÏÏÏÏÏÏÏÏÏÏÏÏÏÏÏÏÏÏÏÏÏÏÏÏÏÏÏÏÏÏÏÏÏÏÏÏÏÏÏÏÏÏÏÏÏÏÏÏÏÏÏÏÏÏÏÏ 62% 60% 60%
Average loan amount ÏÏÏÏÏÏÏÏÏÏÏÏÏÏÏÏÏÏÏÏÏÏÏÏÏÏÏÏÏÏÏÏÏÏÏÏÏÏÏÏÏÏÏÏÏÏÏÏÏÏÏÏÏÏÏÏÏÏÏÏ $ 111,169 $ 102,095 $ 94,360
Product type(3):
Long-term, Ñxed-rate ÏÏÏÏÏÏÏÏÏÏÏÏÏÏÏÏÏÏÏÏÏÏÏÏÏÏÏÏÏÏÏÏÏÏÏÏÏÏÏÏÏÏÏÏÏÏÏÏÏÏÏÏÏÏÏÏÏÏÏÏ 70% 74% 73%
Intermediate-term, Ñxed-rateÏÏÏÏÏÏÏÏÏÏÏÏÏÏÏÏÏÏÏÏÏÏÏÏÏÏÏÏÏÏÏÏÏÏÏÏÏÏÏÏÏÏÏÏÏÏÏÏÏÏÏÏÏÏ 23 20 20
Adjustable-rate ÏÏÏÏÏÏÏÏÏÏÏÏÏÏÏÏÏÏÏÏÏÏÏÏÏÏÏÏÏÏÏÏÏÏÏÏÏÏÏÏÏÏÏÏÏÏÏÏÏÏÏÏÏÏÏÏÏÏÏÏÏÏÏÏÏ 7 6 7
Total ÏÏÏÏÏÏÏÏÏÏÏÏÏÏÏÏÏÏÏÏÏÏÏÏÏÏÏÏÏÏÏÏÏÏÏÏÏÏÏÏÏÏÏÏÏÏÏÏÏÏÏÏÏÏÏÏÏÏÏÏÏÏÏÏÏÏÏÏÏÏÏÏ 100% 100% 100%
83

Percent of Book of Business(1)
2002 2001 2000
Property type:
1 unit ÏÏÏÏÏÏÏÏÏÏÏÏÏÏÏÏÏÏÏÏÏÏÏÏÏÏÏÏÏÏÏÏÏÏÏÏÏÏÏÏÏÏÏÏÏÏÏÏÏÏÏÏÏÏÏÏÏÏÏÏÏÏÏÏÏÏÏÏÏÏÏÏÏ 96% 96% 97%
2-4 units ÏÏÏÏÏÏÏÏÏÏÏÏÏÏÏÏÏÏÏÏÏÏÏÏÏÏÏÏÏÏÏÏÏÏÏÏÏÏÏÏÏÏÏÏÏÏÏÏÏÏÏÏÏÏÏÏÏÏÏÏÏÏÏÏÏÏÏÏÏÏÏ 4 4 3
Total ÏÏÏÏÏÏÏÏÏÏÏÏÏÏÏÏÏÏÏÏÏÏÏÏÏÏÏÏÏÏÏÏÏÏÏÏÏÏÏÏÏÏÏÏÏÏÏÏÏÏÏÏÏÏÏÏÏÏÏÏÏÏÏÏÏÏÏÏÏÏÏÏ 100% 100% 100%
Occupancy type:
Principal residence ÏÏÏÏÏÏÏÏÏÏÏÏÏÏÏÏÏÏÏÏÏÏÏÏÏÏÏÏÏÏÏÏÏÏÏÏÏÏÏÏÏÏÏÏÏÏÏÏÏÏÏÏÏÏÏÏÏÏÏÏÏÏ 93% 94% 94%
Second/vacation home ÏÏÏÏÏÏÏÏÏÏÏÏÏÏÏÏÏÏÏÏÏÏÏÏÏÏÏÏÏÏÏÏÏÏÏÏÏÏÏÏÏÏÏÏÏÏÏÏÏÏÏÏÏÏÏÏÏÏÏ 3 2 2
InvestorÏÏÏÏÏÏÏÏÏÏÏÏÏÏÏÏÏÏÏÏÏÏÏÏÏÏÏÏÏÏÏÏÏÏÏÏÏÏÏÏÏÏÏÏÏÏÏÏÏÏÏÏÏÏÏÏÏÏÏÏÏÏÏÏÏÏÏÏÏÏÏÏ 4 4 4
Total ÏÏÏÏÏÏÏÏÏÏÏÏÏÏÏÏÏÏÏÏÏÏÏÏÏÏÏÏÏÏÏÏÏÏÏÏÏÏÏÏÏÏÏÏÏÏÏÏÏÏÏÏÏÏÏÏÏÏÏÏÏÏÏÏÏÏÏÏÏÏÏÏ 100% 100% 100%
Credit score:
G 620ÏÏÏÏÏÏÏÏÏÏÏÏÏÏÏÏÏÏÏÏÏÏÏÏÏÏÏÏÏÏÏÏÏÏÏÏÏÏÏÏÏÏÏÏÏÏÏÏÏÏÏÏÏÏÏÏÏÏÏÏÏÏÏÏÏÏÏÏÏÏÏÏÏ 6% 5% 4%
620 to G 660ÏÏÏÏÏÏÏÏÏÏÏÏÏÏÏÏÏÏÏÏÏÏÏÏÏÏÏÏÏÏÏÏÏÏÏÏÏÏÏÏÏÏÏÏÏÏÏÏÏÏÏÏÏÏÏÏÏÏÏÏÏÏÏÏÏÏÏ 11 11 10
660 to G 700ÏÏÏÏÏÏÏÏÏÏÏÏÏÏÏÏÏÏÏÏÏÏÏÏÏÏÏÏÏÏÏÏÏÏÏÏÏÏÏÏÏÏÏÏÏÏÏÏÏÏÏÏÏÏÏÏÏÏÏÏÏÏÏÏÏÏÏ 18 17 16
700 to G 740ÏÏÏÏÏÏÏÏÏÏÏÏÏÏÏÏÏÏÏÏÏÏÏÏÏÏÏÏÏÏÏÏÏÏÏÏÏÏÏÏÏÏÏÏÏÏÏÏÏÏÏÏÏÏÏÏÏÏÏÏÏÏÏÏÏÏÏ 22 22 21
H• 740 ÏÏÏÏÏÏÏÏÏÏÏÏÏÏÏÏÏÏÏÏÏÏÏÏÏÏÏÏÏÏÏÏÏÏÏÏÏÏÏÏÏÏÏÏÏÏÏÏÏÏÏÏÏÏÏÏÏÏÏÏÏÏÏÏÏÏÏÏÏÏÏ 36 33 30
Not available ÏÏÏÏÏÏÏÏÏÏÏÏÏÏÏÏÏÏÏÏÏÏÏÏÏÏÏÏÏÏÏÏÏÏÏÏÏÏÏÏÏÏÏÏÏÏÏÏÏÏÏÏÏÏÏÏÏÏÏÏÏÏÏÏÏÏÏ 7 12 19
Total ÏÏÏÏÏÏÏÏÏÏÏÏÏÏÏÏÏÏÏÏÏÏÏÏÏÏÏÏÏÏÏÏÏÏÏÏÏÏÏÏÏÏÏÏÏÏÏÏÏÏÏÏÏÏÏÏÏÏÏÏÏÏÏÏÏÏÏÏÏÏÏÏ 100% 100% 100%
Weighted average ÏÏÏÏÏÏÏÏÏÏÏÏÏÏÏÏÏÏÏÏÏÏÏÏÏÏÏÏÏÏÏÏÏÏÏÏÏÏÏÏÏÏÏÏÏÏÏÏÏÏÏÏÏÏÏÏÏÏÏÏÏÏÏ 714 713 713
Loan purpose:
PurchaseÏÏÏÏÏÏÏÏÏÏÏÏÏÏÏÏÏÏÏÏÏÏÏÏÏÏÏÏÏÏÏÏÏÏÏÏÏÏÏÏÏÏÏÏÏÏÏÏÏÏÏÏÏÏÏÏÏÏÏÏÏÏÏÏÏÏÏÏÏÏÏ 38% 46% 53%
Cash-out reÑnance ÏÏÏÏÏÏÏÏÏÏÏÏÏÏÏÏÏÏÏÏÏÏÏÏÏÏÏÏÏÏÏÏÏÏÏÏÏÏÏÏÏÏÏÏÏÏÏÏÏÏÏÏÏÏÏÏÏÏÏÏÏÏ 27 22 17
Other reÑnance ÏÏÏÏÏÏÏÏÏÏÏÏÏÏÏÏÏÏÏÏÏÏÏÏÏÏÏÏÏÏÏÏÏÏÏÏÏÏÏÏÏÏÏÏÏÏÏÏÏÏÏÏÏÏÏÏÏÏÏÏÏÏÏÏÏ 35 32 30
Total ÏÏÏÏÏÏÏÏÏÏÏÏÏÏÏÏÏÏÏÏÏÏÏÏÏÏÏÏÏÏÏÏÏÏÏÏÏÏÏÏÏÏÏÏÏÏÏÏÏÏÏÏÏÏÏÏÏÏÏÏÏÏÏÏÏÏÏÏÏÏÏÏ 100% 100% 100%
Geographic concentration(4):
Midwest ÏÏÏÏÏÏÏÏÏÏÏÏÏÏÏÏÏÏÏÏÏÏÏÏÏÏÏÏÏÏÏÏÏÏÏÏÏÏÏÏÏÏÏÏÏÏÏÏÏÏÏÏÏÏÏÏÏÏÏÏÏÏÏÏÏÏÏÏÏÏÏ 18% 19% 19%
Northeast ÏÏÏÏÏÏÏÏÏÏÏÏÏÏÏÏÏÏÏÏÏÏÏÏÏÏÏÏÏÏÏÏÏÏÏÏÏÏÏÏÏÏÏÏÏÏÏÏÏÏÏÏÏÏÏÏÏÏÏÏÏÏÏÏÏÏÏÏÏÏ 19 18 18
Southeast ÏÏÏÏÏÏÏÏÏÏÏÏÏÏÏÏÏÏÏÏÏÏÏÏÏÏÏÏÏÏÏÏÏÏÏÏÏÏÏÏÏÏÏÏÏÏÏÏÏÏÏÏÏÏÏÏÏÏÏÏÏÏÏÏÏÏÏÏÏÏ 21 21 21
SouthwestÏÏÏÏÏÏÏÏÏÏÏÏÏÏÏÏÏÏÏÏÏÏÏÏÏÏÏÏÏÏÏÏÏÏÏÏÏÏÏÏÏÏÏÏÏÏÏÏÏÏÏÏÏÏÏÏÏÏÏÏÏÏÏÏÏÏÏÏÏÏ 16 16 16
West ÏÏÏÏÏÏÏÏÏÏÏÏÏÏÏÏÏÏÏÏÏÏÏÏÏÏÏÏÏÏÏÏÏÏÏÏÏÏÏÏÏÏÏÏÏÏÏÏÏÏÏÏÏÏÏÏÏÏÏÏÏÏÏÏÏÏÏÏÏÏÏÏÏÏ 26 26 26
Total ÏÏÏÏÏÏÏÏÏÏÏÏÏÏÏÏÏÏÏÏÏÏÏÏÏÏÏÏÏÏÏÏÏÏÏÏÏÏÏÏÏÏÏÏÏÏÏÏÏÏÏÏÏÏÏÏÏÏÏÏÏÏÏÏÏÏÏÏÏÏÏÏ 100% 100% 100%
Origination year:
G• 1993 ÏÏÏÏÏÏÏÏÏÏÏÏÏÏÏÏÏÏÏÏÏÏÏÏÏÏÏÏÏÏÏÏÏÏÏÏÏÏÏÏÏÏÏÏÏÏÏÏÏÏÏÏÏÏÏÏÏÏÏÏÏÏÏÏÏÏÏÏÏÏ 6% 11% 18%
1994 ÏÏÏÏÏÏÏÏÏÏÏÏÏÏÏÏÏÏÏÏÏÏÏÏÏÏÏÏÏÏÏÏÏÏÏÏÏÏÏÏÏÏÏÏÏÏÏÏÏÏÏÏÏÏÏÏÏÏÏÏÏÏÏÏÏÏÏÏÏÏÏÏÏÏ 2 3 4
1995 ÏÏÏÏÏÏÏÏÏÏÏÏÏÏÏÏÏÏÏÏÏÏÏÏÏÏÏÏÏÏÏÏÏÏÏÏÏÏÏÏÏÏÏÏÏÏÏÏÏÏÏÏÏÏÏÏÏÏÏÏÏÏÏÏÏÏÏÏÏÏÏÏÏÏ 1 3 4
1996 ÏÏÏÏÏÏÏÏÏÏÏÏÏÏÏÏÏÏÏÏÏÏÏÏÏÏÏÏÏÏÏÏÏÏÏÏÏÏÏÏÏÏÏÏÏÏÏÏÏÏÏÏÏÏÏÏÏÏÏÏÏÏÏÏÏÏÏÏÏÏÏÏÏÏ 2 3 6
1997 ÏÏÏÏÏÏÏÏÏÏÏÏÏÏÏÏÏÏÏÏÏÏÏÏÏÏÏÏÏÏÏÏÏÏÏÏÏÏÏÏÏÏÏÏÏÏÏÏÏÏÏÏÏÏÏÏÏÏÏÏÏÏÏÏÏÏÏÏÏÏÏÏÏÏ 2 5 7
1998 ÏÏÏÏÏÏÏÏÏÏÏÏÏÏÏÏÏÏÏÏÏÏÏÏÏÏÏÏÏÏÏÏÏÏÏÏÏÏÏÏÏÏÏÏÏÏÏÏÏÏÏÏÏÏÏÏÏÏÏÏÏÏÏÏÏÏÏÏÏÏÏÏÏÏ 11 18 27
1999 ÏÏÏÏÏÏÏÏÏÏÏÏÏÏÏÏÏÏÏÏÏÏÏÏÏÏÏÏÏÏÏÏÏÏÏÏÏÏÏÏÏÏÏÏÏÏÏÏÏÏÏÏÏÏÏÏÏÏÏÏÏÏÏÏÏÏÏÏÏÏÏÏÏÏ 7 13 20
2000 ÏÏÏÏÏÏÏÏÏÏÏÏÏÏÏÏÏÏÏÏÏÏÏÏÏÏÏÏÏÏÏÏÏÏÏÏÏÏÏÏÏÏÏÏÏÏÏÏÏÏÏÏÏÏÏÏÏÏÏÏÏÏÏÏÏÏÏÏÏÏÏÏÏÏ 4 9 14
2001 ÏÏÏÏÏÏÏÏÏÏÏÏÏÏÏÏÏÏÏÏÏÏÏÏÏÏÏÏÏÏÏÏÏÏÏÏÏÏÏÏÏÏÏÏÏÏÏÏÏÏÏÏÏÏÏÏÏÏÏÏÏÏÏÏÏÏÏÏÏÏÏÏÏÏ 27 35 Ì
2002 ÏÏÏÏÏÏÏÏÏÏÏÏÏÏÏÏÏÏÏÏÏÏÏÏÏÏÏÏÏÏÏÏÏÏÏÏÏÏÏÏÏÏÏÏÏÏÏÏÏÏÏÏÏÏÏÏÏÏÏÏÏÏÏÏÏÏÏÏÏÏÏÏÏÏ 38 Ì Ì
Total ÏÏÏÏÏÏÏÏÏÏÏÏÏÏÏÏÏÏÏÏÏÏÏÏÏÏÏÏÏÏÏÏÏÏÏÏÏÏÏÏÏÏÏÏÏÏÏÏÏÏÏÏÏÏÏÏÏÏÏÏÏÏÏÏÏÏÏÏÏÏÏÏ 100% 100% 100%
(1) Percentages calculated based on unpaid principal balance at the end of each period.
(2) Excludes loans for which this information is not readily available.
(3) Intermediate-term, Ñxed-rate includes second mortgage loans.
(4) Midwest includes IL, IN, IA, MI, MN, NE, ND, OH, SD, and WI. Northeast includes CT, DE, ME, MA, NH, NJ, NY, PA, PR,
RI, VT, and VI. Southeast includes AL, DC, FL, GA, KY, MD, MS, NC, SC, TN, VA, and WV. Southwest includes AZ, AR, CO,
KS, LA, MO, NM, OK, TX, and UT. West includes AK, CA, GU, HI, ID, MT, NV, OR, WA, and WY.
84

Table 34: Characteristics of Conventional Single-Family Mortgage Acquisitions
Percent of Acquisition Volume(1)
2002 2001 2000
Original loan-to-value ratio(2):
G• 60.00% ÏÏÏÏÏÏÏÏÏÏÏÏÏÏÏÏÏÏÏÏÏÏÏÏÏÏÏÏÏÏÏÏÏÏÏÏÏÏÏÏÏÏÏÏÏÏÏÏÏÏÏÏÏÏÏÏÏÏÏÏÏÏÏÏÏÏÏ 23% 17% 13%
60.01% to 70.00% ÏÏÏÏÏÏÏÏÏÏÏÏÏÏÏÏÏÏÏÏÏÏÏÏÏÏÏÏÏÏÏÏÏÏÏÏÏÏÏÏÏÏÏÏÏÏÏÏÏÏÏÏÏÏÏÏÏÏÏÏÏÏ 16 14 11
70.01% to 80.00% ÏÏÏÏÏÏÏÏÏÏÏÏÏÏÏÏÏÏÏÏÏÏÏÏÏÏÏÏÏÏÏÏÏÏÏÏÏÏÏÏÏÏÏÏÏÏÏÏÏÏÏÏÏÏÏÏÏÏÏÏÏÏ 42 45 45
80.01% to 90.00% ÏÏÏÏÏÏÏÏÏÏÏÏÏÏÏÏÏÏÏÏÏÏÏÏÏÏÏÏÏÏÏÏÏÏÏÏÏÏÏÏÏÏÏÏÏÏÏÏÏÏÏÏÏÏÏÏÏÏÏÏÏÏ 11 13 15
Greater than 90.00%ÏÏÏÏÏÏÏÏÏÏÏÏÏÏÏÏÏÏÏÏÏÏÏÏÏÏÏÏÏÏÏÏÏÏÏÏÏÏÏÏÏÏÏÏÏÏÏÏÏÏÏÏÏÏÏÏÏÏÏÏ 8 11 16
Total ÏÏÏÏÏÏÏÏÏÏÏÏÏÏÏÏÏÏÏÏÏÏÏÏÏÏÏÏÏÏÏÏÏÏÏÏÏÏÏÏÏÏÏÏÏÏÏÏÏÏÏÏÏÏÏÏÏÏÏÏÏÏÏÏÏÏÏÏÏÏÏ 100% 100% 100%
Weighted average ÏÏÏÏÏÏÏÏÏÏÏÏÏÏÏÏÏÏÏÏÏÏÏÏÏÏÏÏÏÏÏÏÏÏÏÏÏÏÏÏÏÏÏÏÏÏÏÏÏÏÏÏÏÏÏÏÏÏÏÏÏÏ 71% 74% 77%
Average loan amount ÏÏÏÏÏÏÏÏÏÏÏÏÏÏÏÏÏÏÏÏÏÏÏÏÏÏÏÏÏÏÏÏÏÏÏÏÏÏÏÏÏÏÏÏÏÏÏÏÏÏÏÏÏÏÏÏÏÏÏ $ 145,553 $ 136,376 $ 118,776
Product type(3):
Long-term, Ñxed-rate ÏÏÏÏÏÏÏÏÏÏÏÏÏÏÏÏÏÏÏÏÏÏÏÏÏÏÏÏÏÏÏÏÏÏÏÏÏÏÏÏÏÏÏÏÏÏÏÏÏÏÏÏÏÏÏÏÏÏÏ 63% 73% 73%
Intermediate-term, Ñxed-rateÏÏÏÏÏÏÏÏÏÏÏÏÏÏÏÏÏÏÏÏÏÏÏÏÏÏÏÏÏÏÏÏÏÏÏÏÏÏÏÏÏÏÏÏÏÏÏÏÏÏÏÏÏ 27 21 12
Adjustable-rate ÏÏÏÏÏÏÏÏÏÏÏÏÏÏÏÏÏÏÏÏÏÏÏÏÏÏÏÏÏÏÏÏÏÏÏÏÏÏÏÏÏÏÏÏÏÏÏÏÏÏÏÏÏÏÏÏÏÏÏÏÏÏÏÏ 10 6 15
Total ÏÏÏÏÏÏÏÏÏÏÏÏÏÏÏÏÏÏÏÏÏÏÏÏÏÏÏÏÏÏÏÏÏÏÏÏÏÏÏÏÏÏÏÏÏÏÏÏÏÏÏÏÏÏÏÏÏÏÏÏÏÏÏÏÏÏÏÏÏÏÏ 100% 100% 100%
Property type:
1 unit ÏÏÏÏÏÏÏÏÏÏÏÏÏÏÏÏÏÏÏÏÏÏÏÏÏÏÏÏÏÏÏÏÏÏÏÏÏÏÏÏÏÏÏÏÏÏÏÏÏÏÏÏÏÏÏÏÏÏÏÏÏÏÏÏÏÏÏÏÏÏÏÏ 96% 96% 96%
2-4 unitsÏÏÏÏÏÏÏÏÏÏÏÏÏÏÏÏÏÏÏÏÏÏÏÏÏÏÏÏÏÏÏÏÏÏÏÏÏÏÏÏÏÏÏÏÏÏÏÏÏÏÏÏÏÏÏÏÏÏÏÏÏÏÏÏÏÏÏÏÏÏ 4 4 4
Total ÏÏÏÏÏÏÏÏÏÏÏÏÏÏÏÏÏÏÏÏÏÏÏÏÏÏÏÏÏÏÏÏÏÏÏÏÏÏÏÏÏÏÏÏÏÏÏÏÏÏÏÏÏÏÏÏÏÏÏÏÏÏÏÏÏÏÏÏÏÏÏ 100% 100% 100%
Occupancy type:
Principal residence ÏÏÏÏÏÏÏÏÏÏÏÏÏÏÏÏÏÏÏÏÏÏÏÏÏÏÏÏÏÏÏÏÏÏÏÏÏÏÏÏÏÏÏÏÏÏÏÏÏÏÏÏÏÏÏÏÏÏÏÏÏ 92% 93% 91%
Second/vacation homeÏÏÏÏÏÏÏÏÏÏÏÏÏÏÏÏÏÏÏÏÏÏÏÏÏÏÏÏÏÏÏÏÏÏÏÏÏÏÏÏÏÏÏÏÏÏÏÏÏÏÏÏÏÏÏÏÏÏ 3 3 3
Investor ÏÏÏÏÏÏÏÏÏÏÏÏÏÏÏÏÏÏÏÏÏÏÏÏÏÏÏÏÏÏÏÏÏÏÏÏÏÏÏÏÏÏÏÏÏÏÏÏÏÏÏÏÏÏÏÏÏÏÏÏÏÏÏÏÏÏÏÏÏÏ 5 4 6
Total ÏÏÏÏÏÏÏÏÏÏÏÏÏÏÏÏÏÏÏÏÏÏÏÏÏÏÏÏÏÏÏÏÏÏÏÏÏÏÏÏÏÏÏÏÏÏÏÏÏÏÏÏÏÏÏÏÏÏÏÏÏÏÏÏÏÏÏÏÏÏÏ 100% 100% 100%
Credit score:
G 620 ÏÏÏÏÏÏÏÏÏÏÏÏÏÏÏÏÏÏÏÏÏÏÏÏÏÏÏÏÏÏÏÏÏÏÏÏÏÏÏÏÏÏÏÏÏÏÏÏÏÏÏÏÏÏÏÏÏÏÏÏÏÏÏÏÏÏÏÏÏÏÏ 6% 6% 6%
620 to G 660 ÏÏÏÏÏÏÏÏÏÏÏÏÏÏÏÏÏÏÏÏÏÏÏÏÏÏÏÏÏÏÏÏÏÏÏÏÏÏÏÏÏÏÏÏÏÏÏÏÏÏÏÏÏÏÏÏÏÏÏÏÏÏÏÏÏ 11 12 12
660 to G 700 ÏÏÏÏÏÏÏÏÏÏÏÏÏÏÏÏÏÏÏÏÏÏÏÏÏÏÏÏÏÏÏÏÏÏÏÏÏÏÏÏÏÏÏÏÏÏÏÏÏÏÏÏÏÏÏÏÏÏÏÏÏÏÏÏÏ 18 20 20
700 to G 740 ÏÏÏÏÏÏÏÏÏÏÏÏÏÏÏÏÏÏÏÏÏÏÏÏÏÏÏÏÏÏÏÏÏÏÏÏÏÏÏÏÏÏÏÏÏÏÏÏÏÏÏÏÏÏÏÏÏÏÏÏÏÏÏÏÏ 23 24 24
H• 740 ÏÏÏÏÏÏÏÏÏÏÏÏÏÏÏÏÏÏÏÏÏÏÏÏÏÏÏÏÏÏÏÏÏÏÏÏÏÏÏÏÏÏÏÏÏÏÏÏÏÏÏÏÏÏÏÏÏÏÏÏÏÏÏÏÏÏÏÏÏÏ 41 37 36
Not available ÏÏÏÏÏÏÏÏÏÏÏÏÏÏÏÏÏÏÏÏÏÏÏÏÏÏÏÏÏÏÏÏÏÏÏÏÏÏÏÏÏÏÏÏÏÏÏÏÏÏÏÏÏÏÏÏÏÏÏÏÏÏÏÏÏÏ 1 1 2
Total ÏÏÏÏÏÏÏÏÏÏÏÏÏÏÏÏÏÏÏÏÏÏÏÏÏÏÏÏÏÏÏÏÏÏÏÏÏÏÏÏÏÏÏÏÏÏÏÏÏÏÏÏÏÏÏÏÏÏÏÏÏÏÏÏÏÏÏÏÏÏÏ 100% 100% 100%
Weighted average ÏÏÏÏÏÏÏÏÏÏÏÏÏÏÏÏÏÏÏÏÏÏÏÏÏÏÏÏÏÏÏÏÏÏÏÏÏÏÏÏÏÏÏÏÏÏÏÏÏÏÏÏÏÏÏÏÏÏÏÏÏÏ 717 712 712
Loan purpose:
PurchaseÏÏÏÏÏÏÏÏÏÏÏÏÏÏÏÏÏÏÏÏÏÏÏÏÏÏÏÏÏÏÏÏÏÏÏÏÏÏÏÏÏÏÏÏÏÏÏÏÏÏÏÏÏÏÏÏÏÏÏÏÏÏÏÏÏÏÏÏÏÏ 30% 37% 72%
Cash-out reÑnance ÏÏÏÏÏÏÏÏÏÏÏÏÏÏÏÏÏÏÏÏÏÏÏÏÏÏÏÏÏÏÏÏÏÏÏÏÏÏÏÏÏÏÏÏÏÏÏÏÏÏÏÏÏÏÏÏÏÏÏÏÏ 32 30 15
Other reÑnance ÏÏÏÏÏÏÏÏÏÏÏÏÏÏÏÏÏÏÏÏÏÏÏÏÏÏÏÏÏÏÏÏÏÏÏÏÏÏÏÏÏÏÏÏÏÏÏÏÏÏÏÏÏÏÏÏÏÏÏÏÏÏÏÏ 38 33 13
Total ÏÏÏÏÏÏÏÏÏÏÏÏÏÏÏÏÏÏÏÏÏÏÏÏÏÏÏÏÏÏÏÏÏÏÏÏÏÏÏÏÏÏÏÏÏÏÏÏÏÏÏÏÏÏÏÏÏÏÏÏÏÏÏÏÏÏÏÏÏÏÏ 100% 100% 100%
Geographic concentration(4):
Midwest ÏÏÏÏÏÏÏÏÏÏÏÏÏÏÏÏÏÏÏÏÏÏÏÏÏÏÏÏÏÏÏÏÏÏÏÏÏÏÏÏÏÏÏÏÏÏÏÏÏÏÏÏÏÏÏÏÏÏÏÏÏÏÏÏÏÏÏÏÏÏ 20% 21% 19%
Northeast ÏÏÏÏÏÏÏÏÏÏÏÏÏÏÏÏÏÏÏÏÏÏÏÏÏÏÏÏÏÏÏÏÏÏÏÏÏÏÏÏÏÏÏÏÏÏÏÏÏÏÏÏÏÏÏÏÏÏÏÏÏÏÏÏÏÏÏÏÏ 18 17 17
Southeast ÏÏÏÏÏÏÏÏÏÏÏÏÏÏÏÏÏÏÏÏÏÏÏÏÏÏÏÏÏÏÏÏÏÏÏÏÏÏÏÏÏÏÏÏÏÏÏÏÏÏÏÏÏÏÏÏÏÏÏÏÏÏÏÏÏÏÏÏÏ 20 20 21
SouthwestÏÏÏÏÏÏÏÏÏÏÏÏÏÏÏÏÏÏÏÏÏÏÏÏÏÏÏÏÏÏÏÏÏÏÏÏÏÏÏÏÏÏÏÏÏÏÏÏÏÏÏÏÏÏÏÏÏÏÏÏÏÏÏÏÏÏÏÏÏ 15 16 17
West ÏÏÏÏÏÏÏÏÏÏÏÏÏÏÏÏÏÏÏÏÏÏÏÏÏÏÏÏÏÏÏÏÏÏÏÏÏÏÏÏÏÏÏÏÏÏÏÏÏÏÏÏÏÏÏÏÏÏÏÏÏÏÏÏÏÏÏÏÏÏÏÏÏ 27 26 26
Total ÏÏÏÏÏÏÏÏÏÏÏÏÏÏÏÏÏÏÏÏÏÏÏÏÏÏÏÏÏÏÏÏÏÏÏÏÏÏÏÏÏÏÏÏÏÏÏÏÏÏÏÏÏÏÏÏÏÏÏÏÏÏÏÏÏÏÏÏÏÏÏ 100% 100% 100%
(1) Percentages calculated based on unpaid principal balance.
(2) Excludes loans for which this information is not readily available.
(3) Intermediate-term, Ñxed-rate includes second mortgage loans.
(4) See Table 33 for states included in each geographic region.
85

Table 35: Conventional Single-Family Mortgage Credit Book Characteristics
Weighted Average Credit Characteristics Based on UPB(1)
2002 2001 2000
Credit Non-Credit Credit Non-Credit Credit Non-CreditEnhanced Enhanced Total Enhanced Enhanced Total Enhanced Enhanced Total
Weighted average originalLTV ÏÏÏÏÏÏÏÏÏÏÏÏÏÏÏÏ 87% 67% 73% 87% 68% 74% 86% 68% 75%
Weighted average currentLTV ÏÏÏÏÏÏÏÏÏÏÏÏÏÏÏÏ 75 58 62 71 55 60 72 53 60
Weighted average creditscore ÏÏÏÏÏÏÏÏÏÏÏÏÏÏÏÏ 694 721 714 699 719 713 702 720 713
(1) Indicates the principal amount of loans that have credit enhancement but does not reÖect the level of creditenhancement. Excludes assets for which loan level data is not available.
‚ Serious Delinquency
A key measure of credit performance and future defaults for the single-family mortgage credit book is theserious delinquency rate, although not all loans that become seriously delinquent result in a default. A seriousdelinquency occurs when a borrower has missed three or more consecutive monthly payments, and the loanhas not yet been brought current or been extinguished through foreclosure, payoÅ, or other resolution. A loanreferred to foreclosure but not yet foreclosed is also considered seriously delinquent. The serious delinquencyrate is the number of mortgages that are seriously delinquent divided by the total number of loans outstanding.The rate at which new loans become seriously delinquent and the rate at which existing seriously delinquentloans are resolved signiÑcantly aÅects the level of future credit losses.
EÅective December 31, 2002, we changed how we report our single-family serious delinquency rate to bemore consistent with our current business and credit risk management practices. Traditionally, we reportedour single-family serious delinquency rate for those loans where we have the primary risk of default. Forexample, we did not include loans that had substantial recourse to lenders or were covered by signiÑcantsupplemental pool insurance from mortgage insurance companies in our serious delinquency statistics. AsigniÑcant portion of our business represents loans where we bear some risk, but share a portion of that riskwith others. As a result, we believe it is more meaningful to report our single-family delinquency rate on all ofour conventional loans and distinguish between loans on which we beneÑt from credit enhancement and loanson which we do not beneÑt from credit enhancement. We have reclassiÑed prior period statistics to conform tothe current year's presentation. Table 36 compares the serious delinquency rates for conventional single-familyloans with credit enhancements and without credit enhancements.
Table 36: Conventional Single-Family Serious Delinquency Rates
2002 2001 2000
Serious Serious SeriousBook Delinquency Book Delinquency Book Delinquency
Outstanding(1) Rate(2) Outstanding(1) Rate(2) Outstanding(1) Rate(2)
Credit enhanced ÏÏÏÏÏÏÏÏÏÏÏ 27% 1.29% 32% 1.05% 38% .77%Non-credit enhanced ÏÏÏÏÏÏÏ 73 .31 68 .33 62 .29
Total conventional loans ÏÏ 100% .57% 100% .55% 100% .45%
(1) Reported based on unpaid principal balance.
(2) Reported based on number of loans.
For conventional loans in our single-family mortgage credit book, our total serious delinquency rateincreased modestly to .57 percent at December 31, 2002, from .55 percent at December 31, 2001. Thisincrease was primarily due to an increase in the serious delinquency rate of our credit-enhanced book. Theserious delinquency rate for conventional loans in our single-family mortgage credit book without creditenhancement declined to .31 percent at December 31, 2002, from .33 percent at December 31, 2001, a level
86

more consistent with our delinquency rates prior to the September 11, 2001 terrorist attacks and reÖective ofthe low risk proÑle of these loans. The serious delinquency rate for conventional loans in our single-familymortgage credit book with credit enhancement increased to 1.29 percent from 1.05 percent in 2001. Theseloans have a higher risk proÑle and tend to be more sensitive to changes in the economy than loans withoutcredit enhancement.
‚ Nonperforming Single-Family Loans
We stop accruing interest on single-family loans that we own, including delinquent loans purchased froman MBS trust pursuant to the terms of the trust indenture, when: a) principal and interest on these loans is atleast 90 days past due and b) collection of principal and interest is doubtful. These loans are classiÑed asnonperforming. Table 37 provides a summary for each of the past Ñve years of the following information onour single-family nonperforming loans: the amount of nonaccrual loans that we owned within our single-familymortgage portfolio at the end of each year, the amount of forgone interest income that we would have recordedeach year if these loans had performed according to contractual terms during the year, and the amount ofinterest income recognized during the year on the loans when they were performing.
Table 37: Nonperforming Single-Family Loans
2002 2001 2000 1999 1998
(Dollars in millions)
Nonaccrual loans at December 31 ÏÏÏÏÏÏÏÏÏÏÏÏÏÏÏÏÏÏÏÏÏÏÏÏÏÏÏÏÏÏ $5,463 $3,691 $1,931 $2,635 $3,135
Interest income forgone(1) ÏÏÏÏÏÏÏÏÏÏÏÏÏÏÏÏÏÏÏÏÏÏÏÏÏÏÏÏÏÏÏÏÏÏÏÏÏ 155 101 91 119 110
Interest income recognized during year(2) ÏÏÏÏÏÏÏÏÏÏÏÏÏÏÏÏÏÏÏÏÏÏÏÏ 245 173 56 87 141
Accruing loans past due 90 days and greater at December 31(3) ÏÏÏÏÏ 663 560 297 335 395
(1) Forgone interest income represents the amount of interest income that would have been recorded during the year onnonperforming loans at December 31 had the loans performed according to contractual terms.
(2) Represents estimated interest income recognized during the year on loans classiÑed as nonperforming atDecember 31.
(3) Principal balance of loans at December 31 that are 90 days or greater past due and continuing to accrue interestbecause we believe collection of principal and interest is reasonably assured.
Forgone interest income on non-accrual loans increased signiÑcantly in 2002 because we purchased ahigher level of seriously delinquent loans out of MBS pools and added them to our portfolio. We take thisaction pursuant to the terms of the relevant securities when the cost of advancing interest to MBS investors atthe security coupon rate exceeds the cost of holding the nonperforming loan in our mortgage portfolio. Any netinterest remitted to MBS investors but not received from the servicer is included as part of the charge-oÅsshould the loan be foreclosed. Subsequent to a decision to purchase the seriously delinquent loan out of theMBS, the cost of holding the loan in our portfolio is reÖected as a reduction to net interest income. We mayrecover a portion of forgone interest income when we liquidate foreclosed properties and collect creditenhancement proceeds.
‚ Single-Family Credit Losses
The application of various credit risk management strategies throughout a loan's life helped minimizesingle-family credit losses in 2002 despite weak economic conditions.
Single-family credit losses include charge-oÅs plus foreclosed property expense (income). Interestforgone on nonperforming loans and other assets in our mortgage portfolio, which is presented in Table 37,reduces our net interest income but is not reÖected in our credit loss total.
As shown in Table 38, single-family credit-related losses decreased $7 million in 2002 to $69 million. Thecredit loss ratio (ratio of credit losses to the average mortgage portfolio and outstanding MBS) on our single-family credit book of business decreased by .2 basis points in 2002 to .4 basis points despite weaker economicconditions.
87

Table 38: Single-Family Credit Loss Performance
2002 2001 2000
(Dollars in millions)
Charge-oÅs(1,2)ÏÏÏÏÏÏÏÏÏÏÏÏÏÏÏÏÏÏÏÏÏÏÏÏÏÏÏÏÏÏÏÏÏÏÏÏÏÏÏÏÏÏÏÏÏÏÏÏÏÏÏÏÏÏÏÏÏÏÏÏÏÏÏÏÏ $ 105 $ 96 $ 114
Foreclosed property income ÏÏÏÏÏÏÏÏÏÏÏÏÏÏÏÏÏÏÏÏÏÏÏÏÏÏÏÏÏÏÏÏÏÏÏÏÏÏÏÏÏÏÏÏÏÏÏÏÏÏÏÏÏÏ (36) (20) (29)
Credit-related losses ÏÏÏÏÏÏÏÏÏÏÏÏÏÏÏÏÏÏÏÏÏÏÏÏÏÏÏÏÏÏÏÏÏÏÏÏÏÏÏÏÏÏÏÏÏÏÏÏÏÏÏÏÏÏÏÏÏÏÏÏ $ 69 $ 76 $ 85
Credit loss ratio(3) ÏÏÏÏÏÏÏÏÏÏÏÏÏÏÏÏÏÏÏÏÏÏÏÏÏÏÏÏÏÏÏÏÏÏÏÏÏÏÏÏÏÏÏÏÏÏÏÏÏÏÏÏÏÏÏÏÏÏÏÏÏÏ .004% .006% .007%
Charge-oÅ ratio(4) ÏÏÏÏÏÏÏÏÏÏÏÏÏÏÏÏÏÏÏÏÏÏÏÏÏÏÏÏÏÏÏÏÏÏÏÏÏÏÏÏÏÏÏÏÏÏÏÏÏÏÏÏÏÏÏÏÏÏÏÏÏÏ .007 .007 .010
(1) Prior period amounts have been reclassiÑed to conform with the current year's presentation.
(2) Charge-oÅs for 2002 include $1 million in charge-oÅs related to foreclosed Federal Housing Administration loansthat are reported in the balance sheet under ""Acquired property and foreclosure claims, net.''
(3) Represents credit losses divided by average conventional single-family book of business.
(4) Represents charge-oÅs divided by average conventional single-family book of business.
Strong housing prices helped boost recoveries on foreclosed properties, which oÅset the increase inforeclosed property expense associated with a larger number of foreclosed properties. The number ofproperties acquired through foreclosure increased to 19,500 in 2002 from 14,486 in 2001, contributing to a$9 million increase in charge-oÅs. While the number of acquired properties increased 35 percent credit-relatedlosses fell by $7 million as average severities continued to drop, especially in the Northeast and West regionswhere foreclosure costs had been higher in the recent past. This trend is primarily due to the eÅect of stronghome prices and proceeds from credit enhancements. Finally, low interest rates led us to repurchase a higherlevel of seriously delinquent loans out of MBS, resulting in an increased amount of forgone interest income.
Table 39 shows foreclosed property or REO activity in Fannie Mae's single-family mortgage credit bookfor the last three years.
Table 39: Single-Family Foreclosed Property Activity
2002 2001 2000
Inventory of foreclosed properties (REO)(1) ÏÏÏÏÏÏÏÏÏÏÏÏÏÏÏÏÏÏÏÏÏÏÏÏÏÏÏÏÏÏÏÏÏÏÏÏÏÏÏ 9,975 7,073 6,414
Dispositions of REOÏÏÏÏÏÏÏÏÏÏÏÏÏÏÏÏÏÏÏÏÏÏÏÏÏÏÏÏÏÏÏÏÏÏÏÏÏÏÏÏÏÏÏÏÏÏÏÏÏÏÏÏÏÏÏÏÏÏÏ 16,598 13,827 15,041
Geographic analysis of acquisitions(2):
Midwest ÏÏÏÏÏÏÏÏÏÏÏÏÏÏÏÏÏÏÏÏÏÏÏÏÏÏÏÏÏÏÏÏÏÏÏÏÏÏÏÏÏÏÏÏÏÏÏÏÏÏÏÏÏÏÏÏÏÏÏÏÏÏÏÏÏÏÏ 4,742 2,836 2,138
Northeast ÏÏÏÏÏÏÏÏÏÏÏÏÏÏÏÏÏÏÏÏÏÏÏÏÏÏÏÏÏÏÏÏÏÏÏÏÏÏÏÏÏÏÏÏÏÏÏÏÏÏÏÏÏÏÏÏÏÏÏÏÏÏÏÏÏÏ 2,053 2,165 2,788
Southeast ÏÏÏÏÏÏÏÏÏÏÏÏÏÏÏÏÏÏÏÏÏÏÏÏÏÏÏÏÏÏÏÏÏÏÏÏÏÏÏÏÏÏÏÏÏÏÏÏÏÏÏÏÏÏÏÏÏÏÏÏÏÏÏÏÏÏ 5,614 4,061 3,575
SouthwestÏÏÏÏÏÏÏÏÏÏÏÏÏÏÏÏÏÏÏÏÏÏÏÏÏÏÏÏÏÏÏÏÏÏÏÏÏÏÏÏÏÏÏÏÏÏÏÏÏÏÏÏÏÏÏÏÏÏÏÏÏÏÏÏÏÏ 4,461 2,691 2,333
West ÏÏÏÏÏÏÏÏÏÏÏÏÏÏÏÏÏÏÏÏÏÏÏÏÏÏÏÏÏÏÏÏÏÏÏÏÏÏÏÏÏÏÏÏÏÏÏÏÏÏÏÏÏÏÏÏÏÏÏÏÏÏÏÏÏÏÏÏÏÏ 2,630 2,733 3,517
Total properties acquired through foreclosure ÏÏÏÏÏÏÏÏÏÏÏÏÏÏÏÏÏÏÏÏÏÏÏÏÏÏÏÏÏÏÏÏÏÏÏÏÏÏ 19,500 14,486 14,351
(1) Includes deeds-in-lieu of foreclosure.
(2) See Table 33 for states included in each geographic region.
Multifamily
We also purchase or guarantee loans on multifamily properties Ì properties with more than fourresidential units. We provide Ñnancing either in the form of a single asset loan, principally through theDelegated Underwriting and Servicing (DUS) product line, or through a negotiated transaction involving apool of multifamily properties. The principal credit risks of multifamily property Ñnancings involve thefollowing:
‚ Physical condition and Ñnancial performance of the property
‚ Market conditions in the geographic location of the property
88

‚ Ability and intent of the borrower to repay the loan
‚ Structure of the Ñnancing
1. Managing the proÑle and quality of mortgages in the multifamily mortgage credit book.
Numerous characteristics impact the mortgage credit risk on a particular multifamily loan. Thesecharacteristics include the type of mortgage loan, the type and location of the property, the condition andvalue of the property, counterparty strength, and the current and anticipated cash Öows on the property. Theseand other factors aÅect both the amount of expected credit loss on a given loan and the sensitivity of that lossto changes in the economic environment. We attempt to understand and control the overall risk in each loanwe purchase or guarantee. Under the DUS product line, we purchase or securitize mortgages from approvedrisk sharing lenders without prior review of the mortgages if the mortgages are less than $20 million. Lendersrepresent and warrant that DUS loans they originate are consistent with our underwriting requirements.Approximately 67 percent of our multifamily mortgage credit book consisted of DUS products or business atDecember 31, 2002, compared with 62 percent at the end of 2001.
We manage multifamily mortgage credit risk throughout the investment life cycle. The cycle begins withthe formulation of sound underwriting and servicing policies and procedures. When application of thesepolicies and procedures is delegated to our lending partners, we actively monitor results through post-purchaseunderwriting reviews of loans delivered to us. We conduct on-site assessments of DUS lenders' servicing andtheir Ñnancial condition. We closely track property condition and Ñnancial performance throughout the life ofthe assets we Ñnance. We also evaluate borrower, geographic, and other types of risk concentrations at the loanand portfolio level.
2. Using credit enhancements to reduce credit losses.
We use credit enhancements to transform the risk and return proÑle of multifamily loans that wepurchase or guarantee consistent with our corporate credit risk management objectives. In most of ourbusiness arrangements, lenders in the DUS product line bear losses on the Ñrst Ñve percent of UPB and sharein remaining losses up to a prescribed limit. On structured transactions, we generally have full or partialrecourse to lenders or third parties for loan losses. The recourse provider may back up its obligation withletters of credit, investment agreements, or pledged collateral. Third-party recourse providers for structuredand other transactions include government and private mortgage insurers. While credit enhancements reduceour mortgage-related credit losses, they also generate institutional counterparty risk, which we discuss furtherin the Institutional Counterparty Credit Risk section. We seek to concentrate credit enhancement coverage onthe riskier loans. Table 40 presents our multifamily credit risk sharing proÑle at December 31, 2002, 2001, and2000.
Table 40: Multifamily Credit Risk Sharing ProÑle(1)
December 31,
2002 2001 2000
Fannie Mae risk ÏÏÏÏÏÏÏÏÏÏÏÏÏÏÏÏÏÏÏÏÏÏÏÏÏÏÏÏÏÏÏÏÏÏÏÏÏÏÏÏÏÏÏÏÏÏÏÏÏÏÏÏÏÏÏÏÏÏÏÏÏÏÏÏÏÏÏÏ 15% 18% 16%
Shared risk(2)ÏÏÏÏÏÏÏÏÏÏÏÏÏÏÏÏÏÏÏÏÏÏÏÏÏÏÏÏÏÏÏÏÏÏÏÏÏÏÏÏÏÏÏÏÏÏÏÏÏÏÏÏÏÏÏÏÏÏÏÏÏÏÏÏÏÏÏÏÏÏÏ 66 65 60
Recourse(3) ÏÏÏÏÏÏÏÏÏÏÏÏÏÏÏÏÏÏÏÏÏÏÏÏÏÏÏÏÏÏÏÏÏÏÏÏÏÏÏÏÏÏÏÏÏÏÏÏÏÏÏÏÏÏÏÏÏÏÏÏÏÏÏÏÏÏÏÏÏÏÏÏ 19 17 24
Total ÏÏÏÏÏÏÏÏÏÏÏÏÏÏÏÏÏÏÏÏÏÏÏÏÏÏÏÏÏÏÏÏÏÏÏÏÏÏÏÏÏÏÏÏÏÏÏÏÏÏÏÏÏÏÏÏÏÏÏÏÏÏÏÏÏÏÏÏÏÏÏÏÏÏÏÏÏÏ 100% 100% 100%
(1) Prior year numbers have been restated to include Fannie Mae's credit enhancement of housing bonds issued by stateand local government entities.
(2) Includes loans in which the lender initially bears losses of up to 5 percent of UPB and shares any remaining losseswith Fannie Mae up to a prescribed limit.
(3) Includes loans not included in ""shared risk'' that have government mortgage insurance or full or partial recourse tolenders or third parties.
89

3. Assessing the sensitivity of the proÑtability of the multifamily mortgage credit book of business to changesin composition and the economic environment.
We use analytical tools to measure credit risk exposures, assess performance of our book, and evaluaterisk management alternatives. We combine these analyses with assessments of any problem loan situations todevelop forecasts of future guaranty fee revenue and credit losses. We carefully monitor the relevant localmarket economic indicators that may signal changing risk or return proÑles in the book and cause a change inrisk management policies, credit enhancements, or guaranty fees. For example, we closely monitor rentalpayment trends and vacancy levels in local markets to identify loans meriting closer attention or lossmitigation actions.
4. Managing problem assets to mitigate credit losses.
As part of our risk management activities, we perform detailed loss reviews, address borrower andgeographic concentrations, assess lender qualiÑcations, evaluate counterparty risk, and track property perform-ance and contract compliance. The loss mitigation team manages troubled assets from default throughforeclosure and property disposition, if necessary. Given the size of multifamily loans, we generally requireservicers to submit periodic operating information and property condition reviews to monitor the performanceof individual loans. We use this information to evaluate the credit quality of our book, identify potentialproblem loans, and initiate appropriate loss mitigation activities.
Multifamily Mortgage Credit Book Performance
The economic downturn in the U.S. economy had a modest impact on multifamily credit losses in 2002because property values have remained strong. If the economy weakens further and property values decline,we would anticipate a higher level of credit losses in 2003 than we have experienced in the recent past.Multifamily credit-related losses totaled $19 million in 2002, up $14 million from 2001. The higher level ofcredit losses in 2002 was due primarily to two large properties in the Midwest. Although the level ofmultifamily losses increased in 2002, we have had historically low credit loss ratios of less than 3 basis pointsover the past three years as shown in Table 41.
Table 41: Multifamily Credit Loss Performance
Year Ended December 31,
2002 2001 2000
(Dollars in millions)
Charge-oÅsÏÏÏÏÏÏÏÏÏÏÏÏÏÏÏÏÏÏÏÏÏÏÏÏÏÏÏÏÏÏÏÏÏÏÏÏÏÏÏÏÏÏÏÏÏÏÏÏÏÏÏÏÏÏÏÏÏÏÏÏÏÏÏÏÏÏÏÏ $ 19 $ 1 $ 3
Foreclosed property expenseÏÏÏÏÏÏÏÏÏÏÏÏÏÏÏÏÏÏÏÏÏÏÏÏÏÏÏÏÏÏÏÏÏÏÏÏÏÏÏÏÏÏÏÏÏÏÏÏÏÏÏÏÏÏ Ì 4 1
Credit-related losses ÏÏÏÏÏÏÏÏÏÏÏÏÏÏÏÏÏÏÏÏÏÏÏÏÏÏÏÏÏÏÏÏÏÏÏÏÏÏÏÏÏÏÏÏÏÏÏÏÏÏÏÏÏÏÏÏÏÏÏÏ $ 19 $ 5 $ 4
Credit loss ratio(1) ÏÏÏÏÏÏÏÏÏÏÏÏÏÏÏÏÏÏÏÏÏÏÏÏÏÏÏÏÏÏÏÏÏÏÏÏÏÏÏÏÏÏÏÏÏÏÏÏÏÏÏÏÏÏÏÏÏÏÏÏÏÏ .025% .008% .007%
Serious delinquency rate(1)ÏÏÏÏÏÏÏÏÏÏÏÏÏÏÏÏÏÏÏÏÏÏÏÏÏÏÏÏÏÏÏÏÏÏÏÏÏÏÏÏÏÏÏÏÏÏÏÏÏÏÏÏÏÏÏ .05 .27 .07
Properties acquired through foreclosure ÏÏÏÏÏÏÏÏÏÏÏÏÏÏÏÏÏÏÏÏÏÏÏÏÏÏÏÏÏÏÏÏÏÏÏÏÏÏÏÏÏÏÏÏ 2 1 3
(1) Prior year numbers have been restated to reÖect our new method of reporting delinquencies and include Fannie Mae'scredit enhancement of housing bonds issued by state and local government entities.
Multifamily serious delinquencies include loans that are 60 days or more past due. We base themultifamily serious delinquency rate on the UPB of delinquent loans divided by the UPB of multifamily loanswe own or guarantee. Our multifamily serious delinquency rate declined to .05 percent at year-end 2002 from.27 percent at the end of 2001. At the end of 2000, our multifamily serious delinquency rate was .07 percent.The increase in 2001 was due to two seriously delinquent loans totaling $118 million on properties in NewYork City aÅected by the World Trade Center disaster. These obligations were restructured or became currentin 2002.
90

Over the last three years, multifamily credit losses and serious delinquencies have been at historically lowlevels. Management anticipates that multifamily credit losses, over time, will return to a level more reÖectiveof the current economic environment.
We generally stop accruing interest on multifamily loans that we own when principal and interest on theseloans is 90 days past due and collection of principal and interest is doubtful. Table 42 summarizes the amountof nonaccrual multifamily loans at December 31, 1998 through December 31, 2002. In addition, it identiÑesthe amount of interest income that we would have recorded during those periods if nonperforming loans hadperformed according to contractual terms during the year, the amount of interest income accrued on thoseloans during the portion of the year when they were performing, and the amount of any interest incomeaccrued on loans past 90 days due.
Table 42: Nonperforming Multifamily Loans
2002 2001 2000 1999 1998
(Dollars in millions)
Nonaccrual loans at December 31 ÏÏÏÏÏÏÏÏÏÏÏÏÏÏÏÏÏÏÏÏÏÏÏÏÏÏÏÏÏÏÏÏÏÏÏÏÏÏÏÏ $14 $22 $Ì $4 $29
Interest income forgone(1) ÏÏÏÏÏÏÏÏÏÏÏÏÏÏÏÏÏÏÏÏÏÏÏÏÏÏÏÏÏÏÏÏÏÏÏÏÏÏÏÏÏÏÏÏÏÏÏ 1 Ì Ì Ì 2
Interest income recognized during year(2) ÏÏÏÏÏÏÏÏÏÏÏÏÏÏÏÏÏÏÏÏÏÏÏÏÏÏÏÏÏÏÏÏÏÏ Ì 1 Ì Ì Ì
Accruing loans past due 90 days and greater at December 31(3) ÏÏÏÏÏÏÏÏÏÏÏÏÏÏÏ 10 5 3 9 11
(1) Forgone interest income represents the amount of interest income that would have been recorded during the year onnonperforming loans at December 31 had the loans performed according to contractual terms.
(2) Represents estimated interest income recognized during the year on loans classiÑed as nonperforming atDecember 31.
(3) Principal balance of loans at December 31 that are 90 days or greater past due and continuing to accrue interestbecause we believe collection of principal and interest is reasonably assured.
Equity Financing for Multifamily Properties
We also provide equity Ñnancing for multifamily properties. Equity Ñnancing typically takes the form oflimited partnership investments in aÅordable housing projects that produce low-income housing tax credits.The tax beneÑts we receive from these properties represents our primary economic return on our equityinvestments.
Because our equity Ñnancings have the same property-related credit risks as other multifamily Ñnancings,we track property condition and Ñnancial performance throughout the life of these investments. We alsoevaluate the strength of our investment sponsors and third party asset managers through periodic Ñnancial andoperational assessments. Approximately 33 percent of our equity investments in low-income housing tax creditproperties have an economic return guaranteed by an investment grade counterparty.
Internal Revenue Service requirements govern the recognition of tax credits. These requirements includemaintaining the properties with a speciÑed level of aÅordable housing units over a 15-year period. Failure tomeet IRS requirements can trigger a recapture of tax credits from the IRS. For the years ended December 31,2002, 2001, and 2000 the amounts of tax credit recapture were not signiÑcant.
Institutional Counterparty Credit Risk
A secondary credit risk is the possibility that institutional counterparties may be unable to fulÑll theircontractual obligations to us. For example, our credit losses would increase if a credit enhancementcounterparty were unable to reimburse us in the event of loss on a covered mortgage loan. Accepting a certainlevel of counterparty risk is integral to our interest rate and credit risk management and liquidity objectives.
We have a dedicated Counterparty Risk Management team that quantiÑes aggregate counterparty riskexposures across business activities, maintains a corporate credit policy framework for managing counterpartyrisk, and manages the counterparty risk associated with mortgage insurance companies.
91

Our overall objective in managing institutional counterparty credit risk is to maintain individualcounterparty exposures within a range that allows us to achieve our overall Ñnancial performance objective ofstable and predictable earnings. Central elements of our approach to managing institutional counterpartycredit risk include: (1) stringent counterparty eligibility standards appropriate to each exposure type and level,(2)collateralization of exposures where appropriate, (3) policies to ensure our counterparty exposures arediversiÑed to avoid excessive concentration of risk, and (4) intensive exposure monitoring and management.
1. Maintaining stringent counterparty eligibility standards appropriate to each exposure type.
We generally require that our counterparties have an investment grade credit rating. A rating ofBBB¿/Baa3/BBB or higher by Standard & Poor's, Moody's Investor Service, and Fitch, respectively, isconsidered an investment grade rating. For mortgage insurance counterparties, we have generally required aminimum rating of AA¿/Aa3. For our risk sharing, recourse, and mortgage servicing counterparties, we donot always require an investment grade credit rating because we believe the risk of loss is lower. We haveongoing, extensive mortgage purchase and mortgage servicing relationships with these counterparties. In someinstances, we also have collateral, letters of credit, or investment agreements to secure the obligation.
Individual business units maintain policies and procedures governing the eligibility of counterparties andapproval requirements for accepting exposure to them. For example, we maintain requirements governingeligibility of insurers to provide primary loan-level mortgage insurance on single-family loans we buy orguarantee. We conduct a comprehensive counterparty analysis before approving a mortgage insurancecompany. We review a mortgage insurer's business plan, Ñnancial statements, insurance portfolio characteris-tics, master insurance policies, reinsurance treaties, and ratings on ability to pay claims. We monitor approvedinsurers through a quarterly reporting and analysis process combined with onsite business reviews.
2. Requiring collateralization of exposures, where appropriate.
We may require collateral, letters of credit, or investment agreements as a condition to acceptingexposure to a particular counterparty. We may also require that a counterparty post collateral in the event ofan adverse event such as a ratings downgrade.
We also have contractual rights that can oÅset exposure in the event of a counterparty default. Forexample, if an insurer cannot provide mortgage insurance in accordance with our requirements, most of ourmortgages have provisions that allow us to use borrower paid mortgage insurance premiums to obtainsubstantially equivalent protection. If this insurance is unavailable at an acceptable cost, we can retain thepremium and use it to obtain other credit enhancement or as a loss reserve. Similarly, we have the contractualright to terminate a single-family or multifamily lender's status as a servicer in the event the lender fails tofulÑll its servicing obligations or fails to reimburse Fannie Mae for losses that the lender assumed. In thatevent, we would either sell the servicing rights or use the servicing fees to oÅset any losses related to thelender's failure.
3. Establishing policies to ensure diversiÑcation of our exposure.
We monitor counterparty exposure in total by industry and by individual counterparty. In addition, wehave established exposure tolerance levels by counterparty based on our assessment of each counterparty'scredit strength. These tolerance thresholds allow us to prioritize our monitoring activities and avoid excessiveconcentrations of credit risk.
4. Monitoring and managing exposures intensively within business lines and across Fannie Mae.
Individual business units are responsible for managing the counterparty exposures routinely associatedwith their activities. The Counterparty Risk Management team reviews business unit policies, procedures, andapproval authorities, and the Credit Risk Policy Committee approves these internal controls.
Non-derivative institutional counterparty risk primarily includes exposure created by mortgage insurancepolicies, other credit enhancement arrangements with lenders and others, mortgage servicing contracts withlenders, and liquidity investments in corporate obligations or nonmortgage asset-backed securities.
92

Lenders with Risk Sharing
The primary risk associated with lenders where we have risk sharing agreements is that they will fail toreimburse us for losses as required under these agreements. We had recourse to lenders for losses on single-family loans totaling an estimated $44 billion at December 31, 2002 and $42 billion at December 31, 2001.The quality of these counterparties is high, with investment grade counterparties accounting for 53 percentand 59 percent of lender recourse obligations at the end of 2002 and 2001, respectively. We also require somelenders to pledge collateral to secure their recourse obligations. At December 31, 2002 and 2001, we held$204 million and $247 million in collateral, respectively, to secure single-family lender recourse transactions.In addition, single-family lenders with recourse obligations received servicing fees on $1.452 trillion and$1.288 trillion of mortgages at year-end 2002 and 2001, respectively. A portion of these servicing feeseÅectively serves as collateral.
We had recourse to lenders on multifamily loans totaling $77 billion and $63 billion at December 31,2002 and 2001, respectively. Our multifamily recourse obligations were secured by reserves held in custodialaccounts, insurance policies, letters of credit from investment grade counterparties rated A or better, andinvestment agreements. In addition, all multifamily lenders with recourse obligations received servicing fees, aportion of which eÅectively serves as collateral.
Mortgage Servicers
The primary risk associated with mortgage servicers is that they will fail to fulÑll their servicingobligations. Mortgage servicers collect mortgage and escrow payments from borrowers, pay taxes andinsurance costs from escrow accounts, monitor and report delinquencies, and perform other required activitieson our behalf. A servicing contract breach could result in credit losses for us, or we could incur the cost ofÑnding a replacement servicer, which could be substantial for loans that require a specialized servicer. Wemitigate this risk by requiring mortgage servicers to maintain a minimum reserve servicing fee rate tocompensate a replacement servicer in the event of a servicing contract breach. We also manage this risk byrequiring servicers to follow speciÑc servicing guidelines and by monitoring each servicer's performance usingloan-level data. We conduct on-site reviews of compliance with servicing guidelines and mortgage servicingperformance. We also work on-site with nearly all of our major servicers to facilitate loan loss mitigationeÅorts and improve the default management process. In addition, we review quarterly Ñnancial information onservicers. Our ten largest single-family mortgage servicers serviced 63 percent of our single-family book ofbusiness at the end of 2002 and 2001. Fannie Mae's 15 largest multifamily mortgage servicers serviced70 percent of our multifamily book of business at year-end 2002, compared with 67 percent at year-end 2001.
We have purchased mortgage-related securities secured by manufacturing housing that were issued byentities other than Fannie Mae both for our portfolio and, to a limited extent, for securitization into REMICsecurities we have issued and guaranteed. We currently own or guarantee approximately $10 billion of thesesecurities. Due to weakness in the manufactured housing sector and the Ñnancial condition of ConsecoFinance Corp., which services approximately 70 percent of these securities, the major securities ratingagencies downgraded several of the securities. As of December 31, 2002, the vast majority of these securitieswere rated AA¿ or better, and the entire $10 billion of securities either had investment grade ratings or wereinsured by counterparties which had investment grade ratings. Management believes that any potentialimpairment that might be recorded in the future will not be material to Fannie Mae's operating results.
On March 14, 2003, the U.S. Bankruptcy Court for the Northern District of Illinois issued a Ñnal orderapproving the servicing arrangements for the securities serviced by Conseco Finance Corp. The order, basedupon an agreement reached between Conseco Finance, CFN Investment Holdings (the new owner andservicer), Fannie Mae and other certiÑcate holders, provided for revised servicing fees and an enhancedservicing protocol. CFN is expected to complete the acquisition in the second quarter of 2003.
Mortgage Insurers
The primary risk associated with mortgage insurers is that they will fail to fulÑll their obligations toreimburse us for claims under insurance policies. We were the beneÑciary of primary mortgage insurancecoverage on $316 billion of single-family loans in portfolio or underlying MBS at December 31, 2002 and
93

$314 billion at December 31, 2001. Seven mortgage insurance companies, all rated AA or higher byStandard & Poor's, provided approximately 99 percent of the total coverage at the end of 2002 and 2001.
Liquid Investments
The primary credit risk associated with our liquid investments, which includes the LIP, our early fundingportfolio, and cash and cash equivalents, is that issuers will not repay us in accordance with contractual terms.The level of credit risk in our liquid investments is low because these investments are primarily high-quality,short and medium-term investments. These investments include our early funding portfolio, which consistsprimarily of repurchase agreements, and other high-quality short-term investments in nonmortgage assets,such as federal funds and time deposits, commercial paper, asset-backed securities, and corporate Öoating ratenotes. The majority of our nonmortgage asset-backed securities are rated AAA by Standard & Poor's.Unsecured investments in the portfolio are generally rated A or higher by Standard & Poor's. Our LIP, whichaccounts for the majority of our liquid investments, totaled $39 billion and $65 billion at the end of 2002 and2001, respectively. Approximately 94 percent of our LIP had a credit rating of A or higher at December 31,2002, compared with 96 percent at December 31, 2001.
Operations Risk Management
Operations risk is the risk of potential loss resulting from a breakdown in, or failure to establish, controlsand procedures. Examples of control breakdowns include circumvention of internal controls, human error,systems failure and fraud. Management has implemented extensive policies and procedures to both establishand monitor internal controls to decrease the likelihood of any control breakdowns. Fannie Mae's OÇce ofAuditing also independently tests the adequacy of, and adherence to, internal controls and related policies andprocedures. We actively manage Fannie Mae's operations risk through numerous oversight functions, such as:
‚ Exception reporting and management oversight of Ñnancial and forecasting information throughveriÑcation, reconciliation and independent testing
‚ Management questionnaires that identify key risks, controls in place to mitigate those risks, and controlweaknesses
‚ Key performance indicators (KPIs) that track operational metrics and potential risk exposure
‚ Quarterly senior and executive management internal control certiÑcations
‚ Internal audit work that substantiates the adequacy of the internal control environment as well as directreporting of this work to the Audit Committee of the Board of Directors
‚ Comprehensive disaster recovery planning and testing
Management regularly reconciles Ñnancial and accounting information and model results to sourcedocuments to ensure completeness and accuracy of Ñnancial reporting. Financial forecast model results areregularly reconciled to actual results and the models are recalibrated as necessary to mitigate modeling risk.The OÇce of Auditing also periodically benchmarks the critical models, evaluates the reasonableness of theunderlying assumptions, and validates the key algorithms embedded within them. Control weaknesses areidentiÑed as well as the steps being taken to address them. The OÇce of Auditing reviews and validates theseassessments for reasonableness and accuracy.
KPIs have been established to monitor primary operational metrics and to facilitate quick and eÅectivesenior management attention should any adverse trends develop. KPIs focus on the following operational risks:
‚ Modeling: Losses due to improperly modeled interest rate risk and credit risk
‚ Underwriting EÅectiveness: Losses due to the failure of management or our lender counterparties toapply appropriate underwriting techniques
‚ Counterparty: Losses due to inadequate monitoring and risk mitigation resulting in exposure tocounterparties who fail to meet their obligations to Fannie Mae. These counterparties include
94

lender/servicers, providers of credit enhancement, document custodians, derivatives counterparties,and other service providers
‚ Transaction Processing: Losses due to inadequate transaction processing controls, such as ineÅectivemanagement oversight and reconciliation processes. Examples include erroneous wire transfers or loandeliveries, fraud, trade failures, or release of inaccurate securities information
‚ Systems Availability: Inability to achieve corporate goals due to a lack of systems availability,consistent performance, or capacity to recover from a disaster
‚ Information Security: Financial loss and incurrence of additional liability due to unauthorized systemsaccess, corruption or destruction of critical, proprietary or conÑdential data
‚ Mission Alignment: IneÅective leadership or inappropriate business models resulting in litigation,regulatory sanctions, and reputation damage due to noncompliance with applicable laws, regulations,and Charter Act requirements
‚ Financial Reporting: Economic and reputational loss or disruption due to erroneous or delayed releaseof Ñnancial reports
Each KPI is based upon clearly deÑned and quantiÑable performance thresholds that are monitored byour OÇce of Auditing. Senior managers are responsible for evaluating and monitoring KPI activity as well asimplementing prompt corrective action. The OÇce of Auditing also tests the integrity of this process on aperiodic basis. The Operations, Transactions and Investments Committee headed by our Chief OperatingOÇcer reviews the KPIs and ensures prompt and eÅective resolutions.
On a quarterly basis, senior and executive management certify that internal controls are adequate,questionnaires and KPIs are accurate, and that all signiÑcant issues or control weaknesses that could have amaterial impact on the Ñnancial statements have been disclosed. The OÇce of Auditing reviews thesecertiÑcations for reasonableness. The quarterly certiÑcations are one of the key inputs for our Chief ExecutiveOÇcer and Chief Financial OÇcer's written certiÑcations that our Ñnancial statements fairly present FannieMae's Ñnancial condition and results of operations in all material respects.
In addition to the oversight functions indicated above, the OÇce of Auditing assesses risk and theunderlying control environment annually throughout the company and then implements a comprehensiveaudit plan to assess risk and validate key controls.
The OÇce of Auditing also performs third-party audits as an important part of assessing counterpartyexposure as well as to further substantiate adequacy of related internal controls. A primary example isperforming audits of entities that sell loans to Fannie Mae or who service loans for us. In these audits, weevaluate the Ñnancial and operational controls of these entities by:
‚ reviewing the Ñnancial statements and assessing compliance with our net worth and insurance coveragerequirements to assess eligibility and capability of doing business with us;
‚ testing cash and custodial accounting controls to ensure both Fannie Mae and borrower funds are heldin qualiÑed institutions and that the funds are properly accounted for, safeguarded and remitted.
‚ determining that key controls associated with loan underwriting, accounting, reporting and servicingare in place and operating eÅectively, that activity is reported to us accurately and that our mortgageassets are protected.
Fannie Mae has also developed comprehensive disaster recovery plans covering both systems andbusiness operations that are designed to restore critical operations with minimal interruption. Major elementsof this plan are tested annually at established contingency sites.
Controls and Procedures
Within 90 days prior to the date of this report, we carried out an evaluation, under the supervision andwith the participation of our Chief Executive OÇcer and Chief Financial OÇcer, of the eÅectiveness of our
95
disclosure controls and procedures. Based on this evaluation, our Chief Executive OÇcer and Chief FinancialOÇcer concluded that our disclosure controls and procedures were eÅective. Disclosure controls andprocedures are controls and procedures that are designed to ensure that information we disclose in our periodicreports is recorded, processed, summarized, and reported within the designated time periods.
In addition, based on this most recent evaluation, we have concluded that there were no signiÑcantchanges in our internal controls or in other factors that could signiÑcantly aÅect these controls subsequent tothe date of their last evaluation, including any corrective actions with regard to signiÑcant deÑciencies andmaterial weaknesses.
LIQUIDITY AND CAPITAL RESOURCES
Fannie Mae's statutory mission requires that we provide ongoing assistance to the secondary market formortgages. Our ability to continually raise low-cost capital is critical to fulÑlling our housing mission ofproviding liquidity to the secondary mortgage market and promoting homeownership to low- and moderate-income families. We primarily rely on debt to purchase mortgage assets and to supply liquidity to thesecondary market. In 2002, our mortgage asset purchases totaled $371 billion based on unpaid principalbalance. We issued $1.874 trillion in debt to fund those purchases and to replace maturing, called orrepurchased debt. We take a long-term approach to our funding and capital management strategy because ofour continuous requirements for large amounts of funding. Fannie Mae's liquidity and capital position isactively managed to preserve stable, reliable, and cost-eÅective sources of cash to meet all current and futurenormal operating Ñnancial commitments, meet our regulatory capital requirements, and handle any unforeseenliquidity crisis.
Liquidity
Fannie Mae's primary sources of liquidity include proceeds from the issuance of debt, principal andinterest received on our mortgage portfolio, guaranty fees earned on our MBS, and principal and interestreceived on our liquid investment portfolio. Primary uses of liquidity include the purchase of mortgage assets,repayment of debt, interest payments, administrative expenses, taxes, and fulÑllment of Fannie Mae's MBSguaranty obligations. Our liquid assets totaled $62 billion at December 31, 2002, compared with $76 billion atDecember 31, 2001. In 2001, we adopted the 14 principles for sound liquidity management established by theBasel Committee on Banking Supervision as part of our voluntary safety and soundness initiatives. Theseprinciples outline the appropriate structure for managing liquidity and market access, a process for measuringand monitoring net funding requirements, the need for contingency plans, the necessary controls for liquidityrisk management, and the role of public disclosure and regulatory oversight. We monitor our liquidity positionthrough a combination of daily, weekly and monthly reports to help set strategies and make funding decisions.Our analyses include:
‚ projected cash Öows and funding needs,
‚ targeted funding terms and various funding alternatives for achieving those terms,
‚ cost of debt and the most eÇcient ways to achieve desired funding, and
‚ market conditions and upcoming economic indicators and other factors that could impact the capitalmarkets and our funding capabilities.
We have historically had ready access to funding for the following reasons:
‚ Our Credit Quality: In February 2001, Standard & Poor's assigned Fannie Mae a AA¿ ""risk to thegovernment'' rating. In February 2002, Moody's Investors Service assigned us an A¿ Bank FinancialStrength Rating. The highest possible levels for these ratings are AAA from Standard & Poor's and Afrom Moody's. These ratings are continuously monitored by each rating agency. Additionally, oursenior unsecured debt has been rated AAA, Aaa, and AAA by Fitch, Inc., Moody's Investors Service,and Standard & Poor's, respectively. Fitch, Moody's, and Standard & Poor's rated our short-term debtF1, Prime-1 or P-1, and A-1, respectively.
96

‚ Our Standing in the Capital Market: We are an active participant in the global Ñnancial markets andone of the world's largest private issuers of debt securities. Our debt obligations are traded in the""agency securities market.'' The agency securities market includes securities issued by government-sponsored enterprises (GSEs). While the U.S. government does not guarantee our debt, directly orindirectly, securities issued by GSEs are typically perceived to be of high credit quality.
‚ Our EÇciency: We have demonstrated a long-term commitment to investors in the organized way webring debt issues to market and monitor performance in the secondary market. We have successfullydeveloped new funding products and markets with a variety of terms and features to appeal to a widespectrum of investors. In addition, we may transform the debt into terms and other features that bettermatch our funding needs through our eÇcient use of derivatives.
Given the importance of debt to our funding strategy, we have a contingency plan to protect us in theevent of a major market disruption that would prevent us from issuing debt. As part of our voluntary safety andsoundness initiatives, we maintain contingency plans for handling a liquidity crisis under an assumption thatwe cannot access the new-issue debt markets for a period of at least three months.
Each day we update and analyze cash commitments and anticipated cash Öows for the next 90 days. Ouranalysis indicates how we expect to obtain funds during that period in the event we cannot access the capitalmarkets. In the event of a market disruption in which we could not issue debt, we could liquidate our liquidinvestment portfolio or borrow against our mortgage portfolio to meet our operational needs:
‚ Fannie Mae's Liquid Investment Portfolio primarily consists of high-quality securities that are readilymarketable or have short-term maturities and serves as the primary means for ensuring that wemaintain suÇcient liquidity. If our access to the debt capital markets is ever impeded, we Ñrst willutilize assets in our LIP to generate the cash necessary to meet our liquidity needs. Our initial source offunds would come from the ongoing maturity of short-term investments in the portfolio. If additionalfunds were needed, we would sell assets from the LIP to generate these funds. As part of our voluntarycommitments, we have publicly pledged to maintain a portfolio of high-quality, liquid, nonmortgage-related securities equal to at least 5 percent of total on-balance-sheet assets. Our LIP and other liquidassets together totaled $62 billion and $76 billion at December 31, 2002 and 2001, respectively. Theratio of our liquid assets to total assets was 6.9 percent and 9.5 percent at December 31, 2002 and 2001,respectively.
‚ Fannie Mae's Mortgage Portfolio consists of assets that could be pledged as collateral for Ñnancing inthe repurchase agreement market. We are able to borrow against Fannie Mae's mortgage assets in themarket for mortgage repurchase agreements. We test this capability through periodic issuance. AtDecember 31, 2002 and 2001, we had approximately $410 billion and $359 billion, respectively, ineligible mortgage securities.
At December 31, 2002, we had $85 billion in outstanding mandatory commitments and $3 billion inoutstanding optional commitments for the purchase and delivery of mortgages in 2003. At December 31, 2001,Fannie Mae had $55 billion in outstanding mandatory commitments and $2 billion in outstanding optionalcommitments for the purchase and delivery of mortgages in 2002.
Capital Resources
Core capital (deÑned by OFHEO as the stated value of outstanding common stock, the stated value ofoutstanding noncumulative perpetual preferred stock, paid-in capital, and retained earnings, less treasurystock) grew to $28.1 billion at December 31, 2002 from $25.2 billion at December 31, 2001. Core capitalexcludes accumulated other comprehensive income because AOCI incorporates unrealized gains (losses) onderivatives and certain securities, but not the unrealized losses (gains) on the remaining mortgages andsecurities or liabilities used to fund the purchase of these items. Total capital (deÑned by OFHEO as corecapital plus the general allowance for losses) grew to $28.9 billion at year-end 2002 from $26.0 billion at year-end 2001.
97

At December 31, 2002, AOCI totaled negative $11.8 billion, compared with a negative balance of$7.1 billion at December 31, 2001. Upon adoption of FAS 133 on January 1, 2001, we recorded a $3.9 billionreduction in AOCI, which was primarily attributable to recording derivatives (mostly pay-Ñxed interest rateswaps) that qualify as cash Öow hedges on the balance sheet at fair value. The decline in interest rates during2002 and 2001 caused a decline in the fair value of these derivatives and has reduced AOCI since the adoptionof FAS 133. In conjunction with the adoption of FAS 133, we also, in a non-cash transfer, reclassiÑedinvestment securities and MBS with an amortized cost of approximately $20 billion and unrealized gains andunrealized losses of $164 million and $32 million, respectively, from held-to-maturity to available-for-sale. OnSeptember 13, 2002, concurrent with the implementation of a new risk-based capital rule issued by OFHEO,we reclassiÑed $135 billion of securities in our mortgage and nonmortgage investment portfolios from held-to-maturity to available-for-sale in accordance with FAS 115. At the time of this noncash transfer, the securitieshad gross unrealized gains of $5.503 billion and losses of $59 million. Prior to OFHEO's risk-based capitalrule, Fannie Mae was not subject to a risk-based capital standard. OFHEO's new risk-based capital ruleestablishes a risk weight for Fannie Mae's assets. FAS 115 speciÑcally identiÑes ""a signiÑcant increase in therisk weights of debt securities used for regulatory risk-based capital purposes'' as a change in circumstanceunder which a company may reclassify securities from held-to-maturity to available-for-sale without callinginto question the intent to hold other securities to maturity in the future. See ""Government Regulation andCharter Act Ì Capital Requirements'' for additional information on our risk-based capital rule.
Common shares outstanding, net of shares held in treasury, totaled approximately 989 million and997 million at December 31, 2002 and 2001, respectively. During 2002, Fannie Mae issued 7.0 millioncommon shares from treasury to fund our 2001 commitment of $300 million to the Fannie Mae Foundationand for employee and other stock compensation plans. We issued 4.5 million common shares from treasuryduring 2001 for employee and other stock compensation plans. As part of the continuation of our capitalrestructuring program, we repurchased 15.4 million common shares at a weighted average cost per share of$76.01 in 2002 and 6.0 million common shares at a weighted average cost per share of $76.95 in 2001. Werepurchased the stock pursuant to our Board of Directors' approval to repurchase up to 6 percent ofoutstanding common shares as of December 27, 1995 (adjusted for a stock split) and to oÅset the dilutiveeÅect of common shares issued in conjunction with various stock compensation programs.
We raised additional equity of $1 billion in 2002 and $400 million in 2001 by issuing Non-CumulativePreferred Stock. On February 28, 2002, we redeemed all outstanding shares of our 6.5 percent Non-Cumulative Preferred Stock, Series B at $50.51458 per share, which represents the stated redemption price of$50.00 per share plus an amount equal to the dividend for the quarterly dividend period ending March 31,2002, accrued to, but excluding the redemption date of February 28, 2002. On July 31, 2002, we redeemed alloutstanding shares of our 6.45 percent Non-Cumulative Preferred Stock, Series C at $50.27771 per share,which represents the stated redemption price of $50.00 per share plus an amount equal to the dividend for thequarterly dividend period ending September 30, 2002, accrued to, but excluding the redemption date ofJuly 31, 2002. Preferred stock accounted for 9.5 percent of our core capital at December 31, 2002, versus9.1 percent at December 31, 2001. On March 18, 2003, we issued 8 million shares or $400 million of variablerate Non-Cumulative Preferred Stock, Series K.
In January 2003, our Board of Directors approved a quarterly common stock dividend for 2003 of $.39 percommon share. The quarterly dividend rate per common share was $.33 and $.30 in 2002 and 2001,respectively. Our Board of Directors also approved preferred stock dividends for the period commencingDecember 31, 2002, up to but excluding March 31, 2003, as identiÑed in Table 43.
98

Table 43: Preferred Stock Dividends
Shares Issued Statedand Value Annual Redeemable on or
Issue Date Outstanding per Share Dividend Rate After
Series D ÏÏÏÏÏÏÏÏÏÏÏÏÏÏÏÏÏ September 30, 1998 3,000,000 $50 5.250% September 30, 1999
Series E ÏÏÏÏÏÏÏÏÏÏÏÏÏÏÏÏÏ April 15, 1999 3,000,000 50 5.100 April 15, 2004
Series F ÏÏÏÏÏÏÏÏÏÏÏÏÏÏÏÏÏ March 20, 2000 13,800,000 50 3.540(1) March 31, 2002(3)
Series G ÏÏÏÏÏÏÏÏÏÏÏÏÏÏÏÏÏ August 8, 2000 5,750,000 50 1.830(2) September 30, 2002(3)
Series H ÏÏÏÏÏÏÏÏÏÏÏÏÏÏÏÏÏ April 6, 2001 8,000,000 50 5.810 April 6, 2006
Series IÏÏÏÏÏÏÏÏÏÏÏÏÏÏÏÏÏÏ October 28, 2002 6,000,000 50 5.375 October 28, 2007
Series JÏÏÏÏÏÏÏÏÏÏÏÏÏÏÏÏÏÏ November 26, 2002 14,000,000 50 3.780(4) November 26, 2004
Total ÏÏÏÏÏÏÏÏÏÏÏÏÏÏÏÏÏÏÏÏÏÏÏÏÏÏÏÏÏÏÏÏÏÏÏÏÏÏÏ 53,550,000
(1) Rate eÅective March 31, 2002. Variable dividend rate that resets every two years thereafter at the Constant MaturityU.S. Treasury Rate minus .16 percent with a cap of 11 percent per year.
(2) Rate eÅective September 30, 2002. Variable dividend rate that resets every two years thereafter at the ConstantMaturity U.S. Treasury Rate minus .18 percent with a cap of 11 percent per year.
(3) Represents initial call date. Redeemable every two years thereafter.
(4) Initial rate. Variable dividend rate that resets every two years thereafter at the two-year U.S. Dollar Swap Rate plus1.38 percent with a cap of 8 percent per year.
During 2002, we issued $3.5 billion of subordinated debt securities that received ratings of AA¿ fromStandard & Poor's, Aa2 from Moody's Investors Service, and AA by Fitch Ratings. We issued $5 billion ofsubordinated debt securities that received a rating of AA¿ from Standard & Poor's and Aa2 from Moody'sInvestors Service in 2001. Subordinated debt serves as a supplement to our equity capital, although it is not acomponent of core capital. It provides a risk-absorbing layer to supplement core capital for the beneÑt ofsenior debt holders and is intended to serve as a consistent and early market signal of credit risk for investors.By the end of 2003, we intend to issue suÇcient subordinated debt to bring the sum of total capital andoutstanding subordinated debt to at least 4 percent of on-balance-sheet assets, after providing adequate capitalto support oÅ-balance sheet MBS. Total capital and outstanding subordinated debt represented 3.7 percent ofon-balance-sheet assets at December 31, 2002, compared with 3.4 percent at December 31, 2001.
Regulatory Environment
Fannie Mae is subject to capital adequacy standards established by the Federal Housing EnterprisesFinancial Safety and Soundness Act of 1992 (1992 Act) and continuous examination by OFHEO, which wasestablished by the 1992 Act. The capital adequacy standards require that our core capital equal or exceed aminimum capital standard and a critical capital standard. The Portfolios and Capital Committee, chaired bythe Chief Financial OÇcer, ensures compliance with economic and regulatory risk-based capital requirements.Table 44 shows our core capital and total capital at year-end 2002 and 2001 compared with the requirements.
99

Table 44: Capital Requirements
December 31,
2002 2001
(Dollars inmillions)
Core capital(1)ÏÏÏÏÏÏÏÏÏÏÏÏÏÏÏÏÏÏÏÏÏÏÏÏÏÏÏÏÏÏÏÏÏÏÏÏÏÏÏÏÏÏÏÏÏÏÏÏÏÏÏÏÏÏÏÏÏÏÏÏÏÏÏÏÏÏÏÏÏÏÏ $28,079 $25,182
Required minimum capital(2)(5) ÏÏÏÏÏÏÏÏÏÏÏÏÏÏÏÏÏÏÏÏÏÏÏÏÏÏÏÏÏÏÏÏÏÏÏÏÏÏÏÏÏÏÏÏÏÏÏÏÏÏÏÏÏÏÏÏ 27,203 24,182
Excess of core capital over minimum capital(5) ÏÏÏÏÏÏÏÏÏÏÏÏÏÏÏÏÏÏÏÏÏÏÏÏÏÏÏÏÏÏÏÏÏÏÏÏÏÏÏÏÏÏÏ $ 877 $ 1,000
Total capital(3) ÏÏÏÏÏÏÏÏÏÏÏÏÏÏÏÏÏÏÏÏÏÏÏÏÏÏÏÏÏÏÏÏÏÏÏÏÏÏÏÏÏÏÏÏÏÏÏÏÏÏÏÏÏÏÏÏÏÏÏÏÏÏÏÏÏÏÏÏÏÏ $28,871 $25,976
Required risk-based capital ÏÏÏÏÏÏÏÏÏÏÏÏÏÏÏÏÏÏÏÏÏÏÏÏÏÏÏÏÏÏÏÏÏÏÏÏÏÏÏÏÏÏÏÏÏÏÏÏÏÏÏÏÏÏÏÏÏÏÏÏ 17,434 NA
Excess of total capital over required risk-based capital ÏÏÏÏÏÏÏÏÏÏÏÏÏÏÏÏÏÏÏÏÏÏÏÏÏÏÏÏÏÏÏÏÏÏÏÏÏ $11,437 NA
Required critical capital(4)(5)ÏÏÏÏÏÏÏÏÏÏÏÏÏÏÏÏÏÏÏÏÏÏÏÏÏÏÏÏÏÏÏÏÏÏÏÏÏÏÏÏÏÏÏÏÏÏÏÏÏÏÏÏÏÏÏÏÏÏÏ $13,880 $12,324
Excess of core capital over required critical capital(5) ÏÏÏÏÏÏÏÏÏÏÏÏÏÏÏÏÏÏÏÏÏÏÏÏÏÏÏÏÏÏÏÏÏÏÏÏÏÏ 14,199 12,859
(1) The sum of (a) the stated value of common stock; (b) the stated value of outstanding noncumulative perpetualpreferred stock; (c) paid-in capital; and (d) retained earnings less, treasury stock. Core capital excludes accumulatedother comprehensive income (AOCI).
(2) The sum of (a) 2.50 percent of on-balance sheet assets; (b) .45 percent of outstanding MBS; and (c) .45 percent ofother oÅ-balance sheet obligations, which may be adjusted by the Director of OFHEO under certain circumstances(See 12 CFR 1750.4 for existing adjustments made by the Director of OFHEO).
(3) The sum of (a) core capital and (b) the total allowance for loan losses and guaranty liability, less (c) the speciÑc lossallowance. SpeciÑc loss allowances totaled $19 million and $13 million at December 31, 2002 and 2001, respectively.
(4) The sum of (a) 1.25 percent of on-balance sheet assets; (b) .25 percent of outstanding MBS; and (c) .25 percent ofother oÅ-balance sheet obligations, which may be adjusted by the Director of OFHEO under certain circumstances.
(5) These amounts do not reÖect the reclassiÑcation from our ""Allowance for loan losses'' to a ""Guaranty liability forMBS'' the amount associated with the guaranty obligation for MBS that we own that occurred in 2002. See Note 1 tothe notes to the Ñnancial statements, Summary of SigniÑcant Accounting Policies Ì Allowance for Loan Losses andGuaranty Liability for MBS. The reclassiÑcation will not have a material eÅect on these amounts.
The 1992 Act also established our risk-based capital requirements, and it required OFHEO to adoptregulations establishing a risk-based capital test. OFHEO published regulations under the 1992 Act inSeptember 2001, as amended on March 15, 2002, establishing a risk-based capital test to determine theamount of total capital we must hold under the risk-based capital standard on a quarterly basis. OFHEOimplemented the risk-based capital standard on September 13, 2002. At December 31, 2002, our risk-basedcapital requirement was $17.4 billion. Our total capital was $28.9 billion at year-end 2002, $11.4 billion higherthan the risk-based capital requirement.
PERFORMANCE OUTLOOK
We expect Fannie Mae's core business earnings to continue to increase in 2003, although at a growth ratebelow the above-average trend rates of 2002 and 2001. We project that our net interest margin will move lowerin 2003 as the beneÑts from the actions we took during 2002 and 2001 to lower our debt costs begin todiminish. We anticipate some increase in our eÅective average guaranty fee rates because of recent pricingtrends. We also believe that while credit expenses may move higher in 2003, they will remain at historicallylow levels. Should economic conditions deteriorate, we believe our book of business is well-positioned toperform better than in prior slowdowns because of improved loan underwriting through Desktop Underwriter,lower loan-to-value ratios, more third-party credit enhancements, and superior credit loss mitigation eÅorts.Our administrative expense growth rate should decline in 2003 but remain above historical levels as wecomplete our core infrastructure project and begin to expense stock-based compensation. See ""MD&AÌForward Looking Information.''
100

NEW ACCOUNTING STANDARDS
Accounting for Stock Compensation
We elected to adopt the expense recognition provisions of Financial Accounting Standard No. 123(""FAS 123''), Accounting for Stock-Based Compensation, eÅective January 1, 2003. In accordance withFAS 123, we will recognize the fair value of stock-based compensation at grant date over the service period ofthe employee as an administrative expense in our income statement. We have elected to apply this change inaccounting prospectively to all awards granted on January 1, 2003 and thereafter. We will continue to accountfor stock-based compensation awarded prior to January 1, 2003 under Accounting Principles Board OpinionNo. 25, Accounting for Stock Issued to Employees (""APB 25''). We estimate that the impact of adopting theexpense recognition provisions of FAS 123 will result in additional expense of approximately $28 million in2003.
Guarantor's Accounting and Disclosure Requirements for Guarantees
In November 2002, FASB issued Interpretation No. 45, Guarantor's Accounting and DisclosureRequirements for Guarantees, Including Indirect Guarantees of Indebtedness of Other (""FIN 45''). FIN 45will primarily apply to guaranteed MBS issued to investors other than Fannie Mae on or after January 1, 2003by Fannie Mae as trustee, and it will require that we recognize the fair value of our guarantee on MBS as anasset and the fair value of our guaranty obligations as a liability. Under FIN 45, we will amortize our guarantyasset and liability amounts equally over the estimated life of the loans underlying the MBS as an adjustment toguaranty fee income. There will be no eÅect on Fannie Mae's guaranty fee income or stockholders' equityfrom adopting this accounting rule because the guaranty asset and liability will be equal under FIN 45.
Special Purpose Entities (""SPEs'')
In January 2003, the FASB issued FASB Interpretation No. 46, Consolidation of Variable InterestEntities (""FIN 46''). FIN 46 provides guidance on when a company should include in its Ñnancial statementsthe assets, liabilities and activities of a variable interest entity (""VIE''). Under FIN 46, a variable interestentity must be consolidated by a company if that company is subject to a majority of the risk of loss from thevariable interest entity's activities or entitled to receive a majority of the entity's residual returns or both. Wehave not identiÑed any current Fannie Mae arrangements that meet the VIE consolidation criteria of FIN 46.Therefore, we do not believe that FIN 46 will have a material impact on Fannie Mae. Our oÅ-balance sheetMBS activities are outside the scope of FIN 46 because we conduct those activities through trusts that arequalifying SPEs. Our investments in low-income housing tax credit partnerships are also outside the scope ofFIN 46 because they do not meet the deÑnition of variable interest entities.
101

Item 7A. Quantitative and Qualitative Disclosures About Market Risk
Quantitative and qualitative disclosure about market risk is set forth on pages 61 to 72 of this Form 10-Kunder the caption ""Management's Discussion and Analysis of Financial Condition and Results of Operations''.
102

Item 8. Financial Statements and Supplementary Data
Page
Financial Statements:
Statements of Income for the years ended December 31, 2002, 2001 and 2000 ÏÏÏÏÏÏÏÏÏÏÏÏÏÏÏÏÏÏÏ 104
Balance Sheets as of December 31, 2002 and 2001 ÏÏÏÏÏÏÏÏÏÏÏÏÏÏÏÏÏÏÏÏÏÏÏÏÏÏÏÏÏÏÏÏÏÏÏÏÏÏÏÏÏÏ 105
Statements of Changes in Stockholders' Equity for the years ended December 31, 2002, 2001 and2000 ÏÏÏÏÏÏÏÏÏÏÏÏÏÏÏÏÏÏÏÏÏÏÏÏÏÏÏÏÏÏÏÏÏÏÏÏÏÏÏÏÏÏÏÏÏÏÏÏÏÏÏÏÏÏÏÏÏÏÏÏÏÏÏÏÏÏÏÏÏÏÏÏÏÏÏÏÏÏÏ 106
Statements of Cash Flows for the years ended December 31, 2002, 2001 and 2000 ÏÏÏÏÏÏÏÏÏÏÏÏÏÏÏ 107
Notes to Financial StatementsÏÏÏÏÏÏÏÏÏÏÏÏÏÏÏÏÏÏÏÏÏÏÏÏÏÏÏÏÏÏÏÏÏÏÏÏÏÏÏÏÏÏÏÏÏÏÏÏÏÏÏÏÏÏÏÏÏÏÏÏ 108
Independent Auditors' Report ÏÏÏÏÏÏÏÏÏÏÏÏÏÏÏÏÏÏÏÏÏÏÏÏÏÏÏÏÏÏÏÏÏÏÏÏÏÏÏÏÏÏÏÏÏÏÏÏÏÏÏÏÏÏÏÏÏÏÏÏ 146
Report of ManagementÏÏÏÏÏÏÏÏÏÏÏÏÏÏÏÏÏÏÏÏÏÏÏÏÏÏÏÏÏÏÏÏÏÏÏÏÏÏÏÏÏÏÏÏÏÏÏÏÏÏÏÏÏÏÏÏÏÏÏÏÏÏÏÏÏÏ 147
Supplemental Schedules:
Quarterly Results of Operations (unaudited) ÏÏÏÏÏÏÏÏÏÏÏÏÏÏÏÏÏÏÏÏÏÏÏÏÏÏÏÏÏÏÏÏÏÏÏÏÏÏÏÏÏÏÏÏÏÏÏ 148
Financial and Statistical Summary (unaudited) ÏÏÏÏÏÏÏÏÏÏÏÏÏÏÏÏÏÏÏÏÏÏÏÏÏÏÏÏÏÏÏÏÏÏÏÏÏÏÏÏÏÏÏÏÏ 149
103

FANNIE MAE
STATEMENTS OF INCOME
Year Ended December 31,
2002 2001 2000
(Dollars and shares in millions,except per common share
amounts)
Interest income:Mortgage portfolioÏÏÏÏÏÏÏÏÏÏÏÏÏÏÏÏÏÏÏÏÏÏÏÏÏÏÏÏÏÏÏÏÏÏÏÏÏÏÏÏÏÏÏÏÏÏÏÏÏÏÏÏÏÏÏÏ $49,265 $46,478 $39,403Nonmortgage investments and cash equivalents ÏÏÏÏÏÏÏÏÏÏÏÏÏÏÏÏÏÏÏÏÏÏÏÏÏÏÏÏÏÏÏ 1,588 2,692 3,378
Total interest income ÏÏÏÏÏÏÏÏÏÏÏÏÏÏÏÏÏÏÏÏÏÏÏÏÏÏÏÏÏÏÏÏÏÏÏÏÏÏÏÏÏÏÏÏÏÏÏÏÏÏÏ 50,853 49,170 42,781
Interest expense:Short-term debtÏÏÏÏÏÏÏÏÏÏÏÏÏÏÏÏÏÏÏÏÏÏÏÏÏÏÏÏÏÏÏÏÏÏÏÏÏÏÏÏÏÏÏÏÏÏÏÏÏÏÏÏÏÏÏÏÏÏ 2,978 5,897 4,204Long-term debt ÏÏÏÏÏÏÏÏÏÏÏÏÏÏÏÏÏÏÏÏÏÏÏÏÏÏÏÏÏÏÏÏÏÏÏÏÏÏÏÏÏÏÏÏÏÏÏÏÏÏÏÏÏÏÏÏÏÏ 37,309 35,183 32,903
Total interest expense ÏÏÏÏÏÏÏÏÏÏÏÏÏÏÏÏÏÏÏÏÏÏÏÏÏÏÏÏÏÏÏÏÏÏÏÏÏÏÏÏÏÏÏÏÏÏÏÏÏÏÏ 40,287 41,080 37,107
Net interest income ÏÏÏÏÏÏÏÏÏÏÏÏÏÏÏÏÏÏÏÏÏÏÏÏÏÏÏÏÏÏÏÏÏÏÏÏÏÏÏÏÏÏÏÏÏÏÏÏÏÏÏÏ 10,566 8,090 5,674
Other income:Guaranty fee incomeÏÏÏÏÏÏÏÏÏÏÏÏÏÏÏÏÏÏÏÏÏÏÏÏÏÏÏÏÏÏÏÏÏÏÏÏÏÏÏÏÏÏÏÏÏÏÏÏÏÏÏÏÏÏ 1,816 1,482 1,351Fee and other income (expense), netÏÏÏÏÏÏÏÏÏÏÏÏÏÏÏÏÏÏÏÏÏÏÏÏÏÏÏÏÏÏÏÏÏÏÏÏÏÏÏÏ 232 151 (44)
Total other income ÏÏÏÏÏÏÏÏÏÏÏÏÏÏÏÏÏÏÏÏÏÏÏÏÏÏÏÏÏÏÏÏÏÏÏÏÏÏÏÏÏÏÏÏÏÏÏÏÏÏÏÏÏ 2,048 1,633 1,307
Other expenses (income):Provision for losses ÏÏÏÏÏÏÏÏÏÏÏÏÏÏÏÏÏÏÏÏÏÏÏÏÏÏÏÏÏÏÏÏÏÏÏÏÏÏÏÏÏÏÏÏÏÏÏÏÏÏÏÏÏÏÏ 128 94 122Foreclosed property income ÏÏÏÏÏÏÏÏÏÏÏÏÏÏÏÏÏÏÏÏÏÏÏÏÏÏÏÏÏÏÏÏÏÏÏÏÏÏÏÏÏÏÏÏÏÏÏÏ (36) (16) (28)Administrative expenses ÏÏÏÏÏÏÏÏÏÏÏÏÏÏÏÏÏÏÏÏÏÏÏÏÏÏÏÏÏÏÏÏÏÏÏÏÏÏÏÏÏÏÏÏÏÏÏÏÏÏÏ 1,219 1,017 905Special contribution ÏÏÏÏÏÏÏÏÏÏÏÏÏÏÏÏÏÏÏÏÏÏÏÏÏÏÏÏÏÏÏÏÏÏÏÏÏÏÏÏÏÏÏÏÏÏÏÏÏÏÏÏÏÏ Ì 300 ÌPurchased options expense ÏÏÏÏÏÏÏÏÏÏÏÏÏÏÏÏÏÏÏÏÏÏÏÏÏÏÏÏÏÏÏÏÏÏÏÏÏÏÏÏÏÏÏÏÏÏÏÏÏ 4,545 37 ÌDebt extinguishments, net ÏÏÏÏÏÏÏÏÏÏÏÏÏÏÏÏÏÏÏÏÏÏÏÏÏÏÏÏÏÏÏÏÏÏÏÏÏÏÏÏÏÏÏÏÏÏÏÏÏ 710 524 (49)
Total other expenses (income) ÏÏÏÏÏÏÏÏÏÏÏÏÏÏÏÏÏÏÏÏÏÏÏÏÏÏÏÏÏÏÏÏÏÏÏÏÏÏÏÏÏÏÏ 6,566 1,956 950
Income before federal income taxes and cumulative eÅect of change in accountingprinciple ÏÏÏÏÏÏÏÏÏÏÏÏÏÏÏÏÏÏÏÏÏÏÏÏÏÏÏÏÏÏÏÏÏÏÏÏÏÏÏÏÏÏÏÏÏÏÏÏÏÏÏÏÏÏÏÏÏÏÏÏÏÏÏÏ 6,048 7,767 6,031
Provision for federal income taxesÏÏÏÏÏÏÏÏÏÏÏÏÏÏÏÏÏÏÏÏÏÏÏÏÏÏÏÏÏÏÏÏÏÏÏÏÏÏÏÏÏÏÏÏÏ 1,429 2,041 1,583
Income before cumulative eÅect of change in accounting principle ÏÏÏÏÏÏÏÏÏÏÏÏÏÏÏÏÏ 4,619 5,726 4,448Cumulative eÅect of change in accounting principle, net of tax eÅectÏÏÏÏÏÏÏÏÏÏÏÏÏÏÏ Ì 168 Ì
Net income ÏÏÏÏÏÏÏÏÏÏÏÏÏÏÏÏÏÏÏÏÏÏÏÏÏÏÏÏÏÏÏÏÏÏÏÏÏÏÏÏÏÏÏÏÏÏÏÏÏÏÏÏÏÏÏÏÏÏÏÏÏÏÏ $ 4,619 $ 5,894 $ 4,448
Preferred stock dividends ÏÏÏÏÏÏÏÏÏÏÏÏÏÏÏÏÏÏÏÏÏÏÏÏÏÏÏÏÏÏÏÏÏÏÏÏÏÏÏÏÏÏÏÏÏÏÏÏÏÏÏÏ 99 138 121
Net income available to common stockholders ÏÏÏÏÏÏÏÏÏÏÏÏÏÏÏÏÏÏÏÏÏÏÏÏÏÏÏÏÏÏÏÏÏÏ $ 4,520 $ 5,756 $ 4,327
Basic earnings per common share:Earnings before cumulative eÅect of change in accounting principle ÏÏÏÏÏÏÏÏÏÏÏÏÏÏ $ 4.56 $ 5.58 $ 4.31Cumulative eÅect of change in accounting principle ÏÏÏÏÏÏÏÏÏÏÏÏÏÏÏÏÏÏÏÏÏÏÏÏÏÏÏ Ì .17 Ì
Net earningsÏÏÏÏÏÏÏÏÏÏÏÏÏÏÏÏÏÏÏÏÏÏÏÏÏÏÏÏÏÏÏÏÏÏÏÏÏÏÏÏÏÏÏÏÏÏÏÏÏÏÏÏÏÏÏÏÏÏÏÏÏ $ 4.56 $ 5.75 $ 4.31
Diluted earnings per common share:Earnings before cumulative eÅect of change in accounting principle ÏÏÏÏÏÏÏÏÏÏÏÏÏÏ $ 4.53 $ 5.55 $ 4.29Cumulative eÅect of change in accounting principle ÏÏÏÏÏÏÏÏÏÏÏÏÏÏÏÏÏÏÏÏÏÏÏÏÏÏÏ Ì .17 Ì
Net earningsÏÏÏÏÏÏÏÏÏÏÏÏÏÏÏÏÏÏÏÏÏÏÏÏÏÏÏÏÏÏÏÏÏÏÏÏÏÏÏÏÏÏÏÏÏÏÏÏÏÏÏÏÏÏÏÏÏÏÏÏÏ $ 4.53 $ 5.72 $ 4.29
Cash dividends per common share ÏÏÏÏÏÏÏÏÏÏÏÏÏÏÏÏÏÏÏÏÏÏÏÏÏÏÏÏÏÏÏÏÏÏÏÏÏÏÏÏÏÏÏÏ $ 1.32 $ 1.20 $ 1.12Weighted-average common shares outstanding:
Basic ÏÏÏÏÏÏÏÏÏÏÏÏÏÏÏÏÏÏÏÏÏÏÏÏÏÏÏÏÏÏÏÏÏÏÏÏÏÏÏÏÏÏÏÏÏÏÏÏÏÏÏÏÏÏÏÏÏÏÏÏÏÏÏÏÏÏÏ 992 1,000 1,003Diluted ÏÏÏÏÏÏÏÏÏÏÏÏÏÏÏÏÏÏÏÏÏÏÏÏÏÏÏÏÏÏÏÏÏÏÏÏÏÏÏÏÏÏÏÏÏÏÏÏÏÏÏÏÏÏÏÏÏÏÏÏÏÏÏÏÏ 997 1,006 1,009
See Notes to Financial Statements.
104

FANNIE MAE
BALANCE SHEETS
December 31,
2002 2001
(Dollars in millions,except share stated
values)
AssetsMortgage portfolio:
Mortgage-related securities:Held-to-maturity ÏÏÏÏÏÏÏÏÏÏÏÏÏÏÏÏÏÏÏÏÏÏÏÏÏÏÏÏÏÏÏÏÏÏÏÏÏÏÏÏÏÏÏÏÏÏÏÏÏÏÏÏÏÏÏ $437,932 $509,155Available-for-saleÏÏÏÏÏÏÏÏÏÏÏÏÏÏÏÏÏÏÏÏÏÏÏÏÏÏÏÏÏÏÏÏÏÏÏÏÏÏÏÏÏÏÏÏÏÏÏÏÏÏÏÏÏÏÏ 173,706 32,900
Total ÏÏÏÏÏÏÏÏÏÏÏÏÏÏÏÏÏÏÏÏÏÏÏÏÏÏÏÏÏÏÏÏÏÏÏÏÏÏÏÏÏÏÏÏÏÏÏÏÏÏÏÏÏÏÏÏÏÏÏÏÏÏÏ 611,638 542,055Loans held-for-investment ÏÏÏÏÏÏÏÏÏÏÏÏÏÏÏÏÏÏÏÏÏÏÏÏÏÏÏÏÏÏÏÏÏÏÏÏÏÏÏÏÏÏÏÏÏÏÏÏÏ 185,652 165,917
Allowance for loan losses ÏÏÏÏÏÏÏÏÏÏÏÏÏÏÏÏÏÏÏÏÏÏÏÏÏÏÏÏÏÏÏÏÏÏÏÏÏÏÏÏÏÏÏÏ (79) (48)Unamortized premiums (discounts) and deferred price adjustments, net ÏÏÏÏ 337 (2,640)
Loans held-for-sale ÏÏÏÏÏÏÏÏÏÏÏÏÏÏÏÏÏÏÏÏÏÏÏÏÏÏÏÏÏÏÏÏÏÏÏÏÏÏÏÏÏÏÏÏÏÏÏÏÏÏÏÏÏÏÏ 145 40
Mortgage portfolio, net ÏÏÏÏÏÏÏÏÏÏÏÏÏÏÏÏÏÏÏÏÏÏÏÏÏÏÏÏÏÏÏÏÏÏÏÏÏÏÏÏÏÏÏÏÏÏÏÏÏÏÏÏÏÏ 797,693 705,324Nonmortgage investments:
Held-to-maturity ÏÏÏÏÏÏÏÏÏÏÏÏÏÏÏÏÏÏÏÏÏÏÏÏÏÏÏÏÏÏÏÏÏÏÏÏÏÏÏÏÏÏÏÏÏÏÏÏÏÏÏÏÏÏÏ 23,050 38,671Available-for-saleÏÏÏÏÏÏÏÏÏÏÏÏÏÏÏÏÏÏÏÏÏÏÏÏÏÏÏÏÏÏÏÏÏÏÏÏÏÏÏÏÏÏÏÏÏÏÏÏÏÏÏÏÏÏÏ 36,794 35,883
Cash and cash equivalents ÏÏÏÏÏÏÏÏÏÏÏÏÏÏÏÏÏÏÏÏÏÏÏÏÏÏÏÏÏÏÏÏÏÏÏÏÏÏÏÏÏÏÏÏÏÏÏÏÏÏÏ 1,710 1,518Accrued interest receivableÏÏÏÏÏÏÏÏÏÏÏÏÏÏÏÏÏÏÏÏÏÏÏÏÏÏÏÏÏÏÏÏÏÏÏÏÏÏÏÏÏÏÏÏÏÏÏÏÏÏÏ 4,915 4,705Acquired property and foreclosure claims, net ÏÏÏÏÏÏÏÏÏÏÏÏÏÏÏÏÏÏÏÏÏÏÏÏÏÏÏÏÏÏÏÏÏÏÏ 1,033 684Derivatives in gain positionsÏÏÏÏÏÏÏÏÏÏÏÏÏÏÏÏÏÏÏÏÏÏÏÏÏÏÏÏÏÏÏÏÏÏÏÏÏÏÏÏÏÏÏÏÏÏÏÏÏÏ 3,666 954OtherÏÏÏÏÏÏÏÏÏÏÏÏÏÏÏÏÏÏÏÏÏÏÏÏÏÏÏÏÏÏÏÏÏÏÏÏÏÏÏÏÏÏÏÏÏÏÏÏÏÏÏÏÏÏÏÏÏÏÏÏÏÏÏÏÏÏÏÏÏ 18,654 12,209
Total assetsÏÏÏÏÏÏÏÏÏÏÏÏÏÏÏÏÏÏÏÏÏÏÏÏÏÏÏÏÏÏÏÏÏÏÏÏÏÏÏÏÏÏÏÏÏÏÏÏÏÏÏÏÏÏÏÏÏÏÏÏÏÏÏÏÏÏ $887,515 $799,948
Liabilities and Stockholders' EquityLiabilities:
Debentures, notes and bonds, net:Senior debt:
Due within one year ÏÏÏÏÏÏÏÏÏÏÏÏÏÏÏÏÏÏÏÏÏÏÏÏÏÏÏÏÏÏÏÏÏÏÏÏÏÏÏÏÏÏÏÏÏÏÏÏÏÏÏÏ $382,412 $343,492Due after one yearÏÏÏÏÏÏÏÏÏÏÏÏÏÏÏÏÏÏÏÏÏÏÏÏÏÏÏÏÏÏÏÏÏÏÏÏÏÏÏÏÏÏÏÏÏÏÏÏÏÏÏÏÏÏ 458,600 413,582
Subordinated debt:Due after one yearÏÏÏÏÏÏÏÏÏÏÏÏÏÏÏÏÏÏÏÏÏÏÏÏÏÏÏÏÏÏÏÏÏÏÏÏÏÏÏÏÏÏÏÏÏÏÏÏÏÏÏÏÏÏ 9,970 6,393
Total ÏÏÏÏÏÏÏÏÏÏÏÏÏÏÏÏÏÏÏÏÏÏÏÏÏÏÏÏÏÏÏÏÏÏÏÏÏÏÏÏÏÏÏÏÏÏÏÏÏÏÏÏÏÏÏÏÏÏÏÏÏÏÏ 850,982 763,467Accrued interest payableÏÏÏÏÏÏÏÏÏÏÏÏÏÏÏÏÏÏÏÏÏÏÏÏÏÏÏÏÏÏÏÏÏÏÏÏÏÏÏÏÏÏÏÏÏÏÏÏÏÏÏÏÏ 8,379 8,529Derivatives in loss positions ÏÏÏÏÏÏÏÏÏÏÏÏÏÏÏÏÏÏÏÏÏÏÏÏÏÏÏÏÏÏÏÏÏÏÏÏÏÏÏÏÏÏÏÏÏÏÏÏÏÏ 5,697 5,069Guaranty liability for MBSÏÏÏÏÏÏÏÏÏÏÏÏÏÏÏÏÏÏÏÏÏÏÏÏÏÏÏÏÏÏÏÏÏÏÏÏÏÏÏÏÏÏÏÏÏÏÏÏÏÏÏ 729 755OtherÏÏÏÏÏÏÏÏÏÏÏÏÏÏÏÏÏÏÏÏÏÏÏÏÏÏÏÏÏÏÏÏÏÏÏÏÏÏÏÏÏÏÏÏÏÏÏÏÏÏÏÏÏÏÏÏÏÏÏÏÏÏÏÏÏÏÏÏÏ 5,440 4,010
Total liabilities ÏÏÏÏÏÏÏÏÏÏÏÏÏÏÏÏÏÏÏÏÏÏÏÏÏÏÏÏÏÏÏÏÏÏÏÏÏÏÏÏÏÏÏÏÏÏÏÏÏÏÏÏÏÏÏÏÏÏÏ 871,227 781,830
Stockholders' Equity:Preferred stock, $50 stated value, 100 million shares authorized Ì 53.6 million shares
issued and outstanding in 2002 and 46 million shares issued and outstanding in 2001 2,678 2,303Common stock, $.525 stated value, $1.32 of dividends per share paid in 2002 and
$1.20 of dividends per share paid in 2001, no maximum authorization Ì1,129 million shares issued ÏÏÏÏÏÏÏÏÏÏÏÏÏÏÏÏÏÏÏÏÏÏÏÏÏÏÏÏÏÏÏÏÏÏÏÏÏÏÏÏÏÏÏÏÏÏÏÏÏ 593 593
Additional paid-in capital ÏÏÏÏÏÏÏÏÏÏÏÏÏÏÏÏÏÏÏÏÏÏÏÏÏÏÏÏÏÏÏÏÏÏÏÏÏÏÏÏÏÏÏÏÏÏÏÏÏÏÏÏ 1,839 1,651Retained earnings ÏÏÏÏÏÏÏÏÏÏÏÏÏÏÏÏÏÏÏÏÏÏÏÏÏÏÏÏÏÏÏÏÏÏÏÏÏÏÏÏÏÏÏÏÏÏÏÏÏÏÏÏÏÏÏÏÏÏ 29,385 26,175Accumulated other comprehensive loss ÏÏÏÏÏÏÏÏÏÏÏÏÏÏÏÏÏÏÏÏÏÏÏÏÏÏÏÏÏÏÏÏÏÏÏÏÏÏÏÏ (11,792) (7,065)
22,703 23,657Less: Treasury stock, at cost, 140 million shares in 2002 and 132 million shares in
2001ÏÏÏÏÏÏÏÏÏÏÏÏÏÏÏÏÏÏÏÏÏÏÏÏÏÏÏÏÏÏÏÏÏÏÏÏÏÏÏÏÏÏÏÏÏÏÏÏÏÏÏÏÏÏÏÏÏÏÏÏÏÏÏÏÏÏÏÏ 6,415 5,539
Total stockholders' equityÏÏÏÏÏÏÏÏÏÏÏÏÏÏÏÏÏÏÏÏÏÏÏÏÏÏÏÏÏÏÏÏÏÏÏÏÏÏÏÏÏÏÏÏÏÏÏÏÏÏÏÏ 16,288 18,118
Total liabilities and stockholders' equity ÏÏÏÏÏÏÏÏÏÏÏÏÏÏÏÏÏÏÏÏÏÏÏÏÏÏÏÏÏÏÏÏÏÏÏÏÏÏÏÏÏÏ $887,515 $799,948
See Notes to Financial Statements.
105

FANNIE MAE
STATEMENTS OF CHANGES IN STOCKHOLDERS' EQUITY
AccumulatedNet Common Additional Other Total
Shares Preferred Common Paid-In Retained Comprehensive Treasury Stockholders'Outstanding Stock Stock Capital Earnings (Loss) Income Stock Equity
(Dollars and shares in millions)
Balance, January 1, 2000ÏÏÏÏÏÏÏÏÏÏÏÏÏÏÏÏÏÏ 1,019 $1,300 $593 $1,585 $18,417 $ (246) $(4,020) $17,629
Comprehensive income:
Net income ÏÏÏÏÏÏÏÏÏÏÏÏÏÏÏÏÏÏÏÏÏÏÏÏÏ Ì Ì Ì Ì 4,448 Ì Ì 4,448
Other comprehensive income, net of taxeÅect:
Unrealized gains on available-for-salesecuritiesÏÏÏÏÏÏÏÏÏÏÏÏÏÏÏÏÏÏÏÏÏÏÏÏ Ì Ì Ì Ì Ì 256 Ì 256
Total comprehensive income ÏÏÏÏÏÏÏÏÏÏÏ 4,704
Dividends ÏÏÏÏÏÏÏÏÏÏÏÏÏÏÏÏÏÏÏÏÏÏÏÏÏÏÏÏÏ Ì Ì Ì Ì (1,246) Ì Ì (1,246)
Shares repurchased ÏÏÏÏÏÏÏÏÏÏÏÏÏÏÏÏÏÏÏÏÏ (25) Ì Ì Ì Ì Ì (1,406) (1,406)
Preferred stock issuedÏÏÏÏÏÏÏÏÏÏÏÏÏÏÏÏÏÏÏ Ì 978 Ì (10) Ì Ì Ì 968
Treasury stock issued for stock options andbeneÑt plansÏÏÏÏÏÏÏÏÏÏÏÏÏÏÏÏÏÏÏÏÏÏÏÏÏ 5 Ì Ì 13 Ì Ì 176 189
Balance, December 31, 2000 ÏÏÏÏÏÏÏÏÏÏÏÏÏÏÏ 999 2,278 593 1,588 21,619 10 (5,250) 20,838
Comprehensive income:
Net income ÏÏÏÏÏÏÏÏÏÏÏÏÏÏÏÏÏÏÏÏÏÏÏÏÏ Ì Ì Ì Ì 5,894 Ì Ì 5,894
Other comprehensive income, net of taxeÅect:
Transition adjustment from theadoption of FAS 133. ÏÏÏÏÏÏÏÏÏÏÏÏÏ Ì Ì Ì Ì Ì (3,972) Ì (3,972)
Unrealized gain on securitiestransferred to available-for-sale ÏÏÏÏÏ Ì Ì Ì Ì Ì 86 Ì 86
Net cash Öow hedging losses ÏÏÏÏÏÏÏÏÏ Ì Ì Ì Ì Ì (3,387) Ì (3,387)
Unrealized gains on available-for-salesecuritiesÏÏÏÏÏÏÏÏÏÏÏÏÏÏÏÏÏÏÏÏÏÏÏÏ Ì Ì Ì Ì Ì 198 Ì 198
Total comprehensive loss ÏÏÏÏÏÏÏÏÏÏÏÏÏÏ (1,181)
Dividends ÏÏÏÏÏÏÏÏÏÏÏÏÏÏÏÏÏÏÏÏÏÏÏÏÏÏÏÏÏ Ì Ì Ì Ì (1,338) Ì Ì (1,338)
Shares repurchased ÏÏÏÏÏÏÏÏÏÏÏÏÏÏÏÏÏÏÏÏÏ (6) Ì Ì Ì Ì Ì (464) (464)
Preferred stock issuedÏÏÏÏÏÏÏÏÏÏÏÏÏÏÏÏÏÏÏ Ì 400 Ì (4) Ì Ì Ì 396
Preferred stock redeemedÏÏÏÏÏÏÏÏÏÏÏÏÏÏÏÏ Ì (375) Ì Ì Ì Ì Ì (375)
Treasury stock issued for stock options andbeneÑt plansÏÏÏÏÏÏÏÏÏÏÏÏÏÏÏÏÏÏÏÏÏÏÏÏÏ 4 Ì Ì 67 Ì Ì 175 242
Balance, December 31, 2001 ÏÏÏÏÏÏÏÏÏÏÏÏÏÏÏ 997 2,303 593 1,651 26,175 (7,065) (5,539) 18,118
Comprehensive income:
Net income ÏÏÏÏÏÏÏÏÏÏÏÏÏÏÏÏÏÏÏÏÏÏÏÏÏ Ì Ì Ì Ì 4,619 Ì Ì 4,619
Other comprehensive income, net of taxeÅect:
Net cash Öow hedging losses ÏÏÏÏÏÏÏÏÏ Ì Ì Ì Ì Ì (8,892) Ì (8,892)
ReclassiÑcation of securities from held-to-maturity to available-for-saleunder FAS 115.ÏÏÏÏÏÏÏÏÏÏÏÏÏÏÏÏÏÏ Ì Ì Ì Ì Ì 3,539 Ì 3,539
Unrealized gains on available-for-salesecuritiesÏÏÏÏÏÏÏÏÏÏÏÏÏÏÏÏÏÏÏÏÏÏÏÏ Ì Ì Ì Ì Ì 626 Ì 626
Total comprehensive loss ÏÏÏÏÏÏÏÏÏÏÏÏÏÏ (108)
Dividends ÏÏÏÏÏÏÏÏÏÏÏÏÏÏÏÏÏÏÏÏÏÏÏÏÏÏÏÏÏ Ì Ì Ì Ì (1,409) Ì Ì (1,409)
Shares repurchased ÏÏÏÏÏÏÏÏÏÏÏÏÏÏÏÏÏÏÏÏÏ (15) Ì Ì Ì Ì Ì (1,167) (1,167)
Preferred stock issuedÏÏÏÏÏÏÏÏÏÏÏÏÏÏÏÏÏÏÏ Ì 1,000 Ì (9) Ì Ì Ì 991
Preferred stock redeemedÏÏÏÏÏÏÏÏÏÏÏÏÏÏÏÏ Ì (625) Ì Ì Ì Ì Ì (625)
Treasury stock issued for stock options andbeneÑt plansÏÏÏÏÏÏÏÏÏÏÏÏÏÏÏÏÏÏÏÏÏÏÏÏÏ 3 Ì Ì 61 Ì Ì 127 188
Treasury stock issued for specialcontribution ÏÏÏÏÏÏÏÏÏÏÏÏÏÏÏÏÏÏÏÏÏÏÏÏÏ 4 Ì Ì 136 Ì Ì 164 300
Balance, December 31, 2002 ÏÏÏÏÏÏÏÏÏÏÏÏÏÏÏ 989 $2,678 $593 $1,839 $29,385 $(11,792) $(6,415) $16,288
See Notes to Financial Statements.
106

FANNIE MAE
STATEMENTS OF CASH FLOWS
Year Ended December 31,
2002 2001 2000
(Dollars in millions)
Cash Öows from operating activities:
Net income ÏÏÏÏÏÏÏÏÏÏÏÏÏÏÏÏÏÏÏÏÏÏÏÏÏÏÏÏÏÏÏÏÏÏÏÏÏÏÏÏÏÏÏÏÏÏÏÏÏÏÏÏÏ $ 4,619 $ 5,894 $ 4,448
Adjustments to reconcile net income to net cash provided by (used in)operating activities:
Amortization of discount/premium and deferred price adjustments ÏÏÏÏ 5,801 11,045 10,278
Provision for lossesÏÏÏÏÏÏÏÏÏÏÏÏÏÏÏÏÏÏÏÏÏÏÏÏÏÏÏÏÏÏÏÏÏÏÏÏÏÏÏÏÏÏÏÏÏ 128 94 122
Loss (gain) on debt extinguishmentsÏÏÏÏÏÏÏÏÏÏÏÏÏÏÏÏÏÏÏÏÏÏÏÏÏÏÏÏÏÏ 710 524 (49)
Cumulative eÅect of change in accounting principle, net of taxÏÏÏÏÏÏÏÏ Ì (168) Ì
Purchased options expense ÏÏÏÏÏÏÏÏÏÏÏÏÏÏÏÏÏÏÏÏÏÏÏÏÏÏÏÏÏÏÏÏÏÏÏÏÏÏ 4,545 37 Ì
Deferred income taxesÏÏÏÏÏÏÏÏÏÏÏÏÏÏÏÏÏÏÏÏÏÏÏÏÏÏÏÏÏÏÏÏÏÏÏÏÏÏÏÏÏÏ (1,626) (190) 161
Other decreases, netÏÏÏÏÏÏÏÏÏÏÏÏÏÏÏÏÏÏÏÏÏÏÏÏÏÏÏÏÏÏÏÏÏÏÏÏÏÏÏÏÏÏÏÏ (2,039) (2,904) (659)
Net cash provided by operating activities ÏÏÏÏÏÏÏÏÏÏÏÏÏÏÏÏÏÏÏÏÏÏÏÏÏÏÏÏ 12,138 14,332 14,301
Cash Öows from investing activities:
Mortgage portfolio purchases ÏÏÏÏÏÏÏÏÏÏÏÏÏÏÏÏÏÏÏÏÏÏÏÏÏÏÏÏÏÏÏÏÏÏÏÏ (373,169) (270,609) (153,837)
Proceeds from sales from mortgage portfolio ÏÏÏÏÏÏÏÏÏÏÏÏÏÏÏÏÏÏÏÏÏÏÏ 9,691 8,967 10,599
Mortgage portfolio principal repayments ÏÏÏÏÏÏÏÏÏÏÏÏÏÏÏÏÏÏÏÏÏÏÏÏÏÏÏ 274,941 164,408 56,568
Net proceeds from disposition of foreclosed properties ÏÏÏÏÏÏÏÏÏÏÏÏÏÏÏ 2,281 1,827 1,962
Purchases of held-to-maturity nonmortgage investmentsÏÏÏÏÏÏÏÏÏÏÏÏÏÏ (1,819,326) (1,359,614) (1,184,924)
Maturities of held-to-maturity nonmortgage investments ÏÏÏÏÏÏÏÏÏÏÏÏÏ 1,823,915 1,343,328 1,173,546
Purchases of available-for-sale nonmortgage investments ÏÏÏÏÏÏÏÏÏÏÏÏÏ (54,534) (78,632) (13,610)
Maturities of available-for-sale nonmortgage investments ÏÏÏÏÏÏÏÏÏÏÏÏÏ 58,617 68,269 1,190
Proceeds from sales of available-for-sale nonmortgage investmentsÏÏÏÏÏ 6,158 7,193 8,995
Net cash used in investing activities ÏÏÏÏÏÏÏÏÏÏÏÏÏÏÏÏÏÏÏÏÏÏÏÏÏÏÏÏÏÏÏÏ (71,426) (114,863) (99,511)
Cash Öows from Ñnancing activities:
Proceeds from issuance of long-term debtÏÏÏÏÏÏÏÏÏÏÏÏÏÏÏÏÏÏÏÏÏÏÏÏÏÏ 238,252 249,454 110,298
Payments to redeem long-term debt ÏÏÏÏÏÏÏÏÏÏÏÏÏÏÏÏÏÏÏÏÏÏÏÏÏÏÏÏÏÏ (175,809) (196,610) (49,769)
Proceeds from issuance of short-term debt ÏÏÏÏÏÏÏÏÏÏÏÏÏÏÏÏÏÏÏÏÏÏÏÏÏ 1,631,404 1,746,381 1,130,698
Payments to redeem short-term debtÏÏÏÏÏÏÏÏÏÏÏÏÏÏÏÏÏÏÏÏÏÏÏÏÏÏÏÏÏÏ (1,620,644) (1,690,806) (1,104,694)
Proceeds from zero-coupon swap callsÏÏÏÏÏÏÏÏÏÏÏÏÏÏÏÏÏÏÏÏÏÏÏÏÏÏÏÏÏ 478 203 Ì
Net payments to purchase or settle hedge instruments ÏÏÏÏÏÏÏÏÏÏÏÏÏÏÏ (12,119) (5,569) (1,245)
Net payments from stock activities ÏÏÏÏÏÏÏÏÏÏÏÏÏÏÏÏÏÏÏÏÏÏÏÏÏÏÏÏÏÏÏ (2,082) (1,621) (1,560)
Net cash provided by Ñnancing activities ÏÏÏÏÏÏÏÏÏÏÏÏÏÏÏÏÏÏÏÏÏÏÏÏÏÏÏÏ 59,480 101,432 83,728
Net increase (decrease) in cash and cash equivalentsÏÏÏÏÏÏÏÏÏÏÏÏÏÏÏÏÏÏ 192 901 (1,482)
Cash and cash equivalents at beginning of year ÏÏÏÏÏÏÏÏÏÏÏÏÏÏÏÏÏÏÏÏÏÏÏ 1,518 617 2,099
Cash and cash equivalents at end of year ÏÏÏÏÏÏÏÏÏÏÏÏÏÏÏÏÏÏÏÏÏÏÏÏÏÏÏÏ $ 1,710 $ 1,518 $ 617
Supplemental disclosures of cash Öow information:
Cash paid during the year for:
Interest ÏÏÏÏÏÏÏÏÏÏÏÏÏÏÏÏÏÏÏÏÏÏÏÏÏÏÏÏÏÏÏÏÏÏÏÏÏÏÏÏÏÏÏÏÏÏÏÏÏÏÏÏÏÏ $ 40,401 $ 40,361 $ 34,863
Income taxesÏÏÏÏÏÏÏÏÏÏÏÏÏÏÏÏÏÏÏÏÏÏÏÏÏÏÏÏÏÏÏÏÏÏÏÏÏÏÏÏÏÏÏÏÏÏÏÏÏÏ 3,032 2,088 1,595
See Notes to Financial Statements.
107

FANNIE MAE
NOTES TO FINANCIAL STATEMENTS
1. Summary of SigniÑcant Accounting Policies
Fannie Mae is a federally chartered and stockholder-owned corporation operating in the residentialmortgage Ñnance industry.
We prepare our Ñnancial statements in conformity with accounting principles generally accepted in theUnited States of America. These principles require us to make estimates and assumptions that aÅect thereported amounts of assets and liabilities, disclosure of contingent assets and liabilities at the date of theÑnancial statements, and the reported amounts of revenues and expenses during the reporting period. Actualresults could diÅer from those estimates. We have reclassiÑed certain amounts in prior years' Ñnancialstatements to conform to the current presentation.
Principles of Consolidation
We regularly invest in qualiÑed low-income housing tax credit partnerships as a limited partner. Inaccordance with American Institute of CertiÑed Public Accountants (AICPA) Statement of Position 78-9,Accounting for Investments in Real Estate Ventures, we typically do not consolidate these partnershipsbecause we are a limited partner and do not have voting rights or control the activities of these partnerships.We account for these non-consolidated investments using the equity method of accounting. Under the equitymethod of accounting, we record the amount of our investment as an asset on our balance sheet. We recognizeour share of partnership income or losses in the income statement line item ""Fee and other income, net'' withan oÅset to the investment account on our balance sheet. Partnership losses reduce the size of our asset andpartnership income increases our asset. We account for any cash received from these partnerships as a returnof investment and reduce the asset balance. These limited partnership investments are qualiÑed aÅordablehousing projects that are eligible for tax credits. We record these tax credits as a reduction in our provision forfederal income taxes in the income statement when received. We regularly evaluate these investments forimpairment. If there is other-than-temporary impairment in the value of these investments, we recognize thedecline in value as an expense in ""Fee and other income, net.'' If an investment grade third party guaranteesthe return on these investments, we account for the investments using the eÅective yield method according toEmerging Issues Task Force Issue No. 94-1, Accounting for Tax BeneÑts Resulting from Investments inAÅordable Housing Projects. Under this method, we recognize tax credits as they are allocated to us andamortize the initial cost of the investment to provide a level yield over the period we are allocated tax credits.We recognize both the tax credits and the amortization of the investment, net of taxes, in the provision forfederal income taxes.
We also sponsor trusts that facilitate the issuance of Fannie Mae mortgage-backed securities (MBS).MBS include real estate mortgage investment conduits (REMICs). In this capacity, we serve as trustee forthe creation and issuance of these MBS. To create MBS, lenders transfer loans to us and we immediatelytransfer these loans into a trust and deliver certiÑcates to the lender or other purchaser. These certiÑcatesrepresent beneÑcial interests in the loans underlying the MBS that are held in trust. The trust pays us toguarantee the timely payment of scheduled principal and interest on MBS to investors. To create REMICs,investors transfer loans, MBS, or mortgage-related securities to us and we immediately transfer them into atrust and deliver certiÑcates to the investor. These REMIC certiÑcates represent beneÑcial interests in theunderlying collateral held in trust by us.
The loans underlying MBS and the collateral underlying REMICs are not our assets, and we do notreÖect them on our balance sheet unless our portfolio investment business buys them. In accordance withFinancial Accounting Standard No. 140, Accounting for Transfers and Servicing of Financial Assets andExtinguishments of Debt (FAS 140), we do not consolidate the trusts used to issue MBS because these trustsmeet the deÑnition of a qualifying special purpose entity. We recognize a guaranty liability for estimated losseson our guaranty obligation in accordance with Financial Accounting Standard No. 5, Accounting for
108

FANNIE MAE
NOTES TO FINANCIAL STATEMENTS Ì (Continued)
Contingencies (FAS 5). For more information on the accounting for our guaranty, refer to the sections in thisfootnote entitled ""Guaranteed Mortgage-Related Securities,'' ""Mortgage-Related Securities,'' and ""Allow-ance for Loan Losses and Guaranty Liability for MBS.''
Mortgage Portfolio
Loans
Loans are mortgage loans. We classify mortgages that we have the original intent at the time of purchaseto hold for investment purposes as ""held-for-investment.'' We measure these assets at their unpaid principalbalance (UPB) adjusted for unamortized purchase discount or premium and other deferred price adjustments.We classify mortgages that we intend to sell as ""held-for-sale.'' We measure mortgages held-for-sale at thelower of cost or market, determined on a portfolio basis, with any unrealized losses included in current periodearnings.
In accordance with Financial Accounting Standard No. 91, Accounting for Nonrefundable Fees andCosts Associated with Originating or Acquiring Loans and Initial Direct Costs of Leases (FAS 91), we useactual principal prepayment experience and estimate future principal prepayments to calculate the constanteÅective yield necessary to apply the interest method in the amortization of purchase discount or premium andother deferred price adjustments. We aggregate loans by similar characteristics such as loan type, acquisitiondate, interest rate, and maturity to evaluate prepayments. We use historical prepayment data and expectedprepayment performance under varying interest rate scenarios to estimate future prepayments.
We do not accrue interest income on nonperforming loans. We classify conventional single-family andmultifamily loans as nonperforming and reverse previously accrued interest against current period incomewhen the loan is 90 days or more delinquent and we estimate the interest to be uncollectible. We return loansto accrual status when the borrower is less than 90 days delinquent because the probability of default is lowand management believes collections of future payments are reasonably assured.
Pursuant to our guaranty obligation, we are required to purchase at par a loan underlying MBS poolswhen the borrower has not made a payment for 24 consecutive months. We have the option under the terms ofthe trust indenture to purchase the loan out of the pool after the borrower has missed their fourth consecutivepayment. We usually purchase the loan out of the pool after the fourth consecutive missed payment. When theloan is purchased out of the pool, we record the loan at its approximate fair value. When estimating fair value,we take into account the underlying real-estate collateral, estimated costs to sell, and estimated receipts fromthird-party credit enhancements.
Mortgage-Related Securities
We classify mortgage-related securities that we have the ability and positive intent to hold to maturity as""held-to-maturity.'' We measure these assets at their unpaid principal balance adjusted for unamortizedpurchase discount or premium and other deferred price adjustments. We classify mortgage-related securitiesthat we intend to hold for an undetermined period, but not necessarily to maturity, as ""available-for-sale.'' Wemeasure available-for-sale mortgage-related securities at fair value with any valuation adjustments reported asa component of accumulated other comprehensive income (AOCI), net of deferred taxes, in stockholders'equity. We use the speciÑc identiÑcation method for determining cost in computing realized gains or losses onthese assets. Realized gains or losses from the sale of these investments are recognized through the ""Fee andother income, net'' line item on the income statement. We classify and account for these investments as eitherheld-to-maturity or available-for-sale, according to Financial Accounting Standard No. 115, Accounting forCertain Investments in Debt and Equity Securities (FAS 115).
We record impairment for mortgage-related securities held in our mortgage portfolio by determiningwhether an other-than-temporary decline in fair value below a security's amortized cost basis has occurred. If
109

FANNIE MAE
NOTES TO FINANCIAL STATEMENTS Ì (Continued)
such a decline has occurred, the cost basis of the security is written down to fair value and is accounted for as arealized loss through the ""Fee and other income, net'' line item on the income statement. The new cost basis isnot changed for subsequent recoveries in fair value.
We also provide a guaranty liability on mortgage-related securities held in the mortgage portfolio that areguaranteed by Fannie Mae because we have the risk of loss of individual loans underlying these securities. See""Summary of SigniÑcant Accounting Policies Ì Allowance for Loan Losses and Guaranty Liability forMBS'' for further discussion.
In accordance with FAS 91, we use actual principal prepayment experience and estimate future principalprepayments to calculate the constant eÅective yield necessary to apply the interest method in theamortization of purchase discount or premium and other deferred price adjustments. We aggregate mortgage-related securities by similar characteristics such as loan type, acquisition date, interest rate, and maturity toevaluate prepayments. We use historical prepayment data and expected prepayment performance undervarying interest rate scenarios to estimate future prepayments.
Nonmortgage Investments
Nonmortgage investments consist of our liquid investment portfolio (LIP) and other investments. Weclassify and account for these investments as either held-to-maturity or available-for-sale, according toFAS 115. We measure held-to-maturity securities at historical cost, adjusted for unamortized discount orpremium. We measure available-for-sale securities at fair value as of the balance sheet date, with anyvaluation adjustments reported as a component of AOCI, net of deferred taxes, in stockholders' equity. Weuse the speciÑc identiÑcation method for determining a security's cost basis in computing realized gain or loss.We accrue interest income unless the collection of interest income is considered doubtful. If collection ofinterest is doubtful, we recognize interest income on a cash basis. We regularly evaluate these investments forimpairment. If there is other-than-temporary impairment in the value of these investments, we recognize thedecline in value as an expense in ""Fee and other income, net.''
Guaranteed Mortgage-Related Securities
We charge a guaranty fee in return for guaranteeing the timely payment of scheduled principal andinterest on MBS and other mortgage-related securities to investors. We accrue and collect guaranty feesmonthly based on a Ñxed rate multiplied by the outstanding balance of the guaranteed MBS and othermortgage-related securities. We apply the eÅective yield method of accounting and amortize any upfrontguaranty fee price adjustments over the estimated life of the loans underlying the MBS and other mortgage-related securities. For MBS and other mortgage-related securities not held in our mortgage portfolio, werecord the guaranty fee in ""Guaranty fee income.'' For MBS and other mortgage-related securities held in ourmortgage portfolio, we record the guaranty fee in ""Interest income.''
In November 2002, the Financial Accounting Standards Board (FASB) issued Interpretation No. 45:Guarantor's Accounting and Disclosure Requirements for Guarantees, Including Indirect Guarantees ofIndebtedness of Others. We are required to provide disclosures about guarantees beginning with ourDecember 31, 2002 Ñnancial statements. The disclosures are located in Footnote 14, ""Financial Instrumentswith OÅ-Balance-Sheet Risk.'' The new interpretation also will require us to recognize the fair value of ourMBS guaranty fee and other guaranty fees as assets and the fair value of our MBS guaranty obligation andother guaranty obligations as liabilities for MBS and other guarantees issued by us to investors other thanFannie Mae on or after January 1, 2003. Under this interpretation, we will record an asset representing the fairvalue of the guaranty along with a liability of equal value. We will amortize the asset and the liability over theestimated life of the loans underlying the MBS or other guarantees as an adjustment to guaranty fee income.However, because the asset and liability will be equal and the amortization rates will be the same, there will beno net eÅect on guaranty fee income or stockholders' equity.
110

FANNIE MAE
NOTES TO FINANCIAL STATEMENTS Ì (Continued)
Allowance for Loan Losses and Guaranty Liability for MBS
We have an allowance for loan losses for loans in the mortgage portfolio (excluding loans held-for-sale).The allowance for loan losses is included in the balance sheet under ""Mortgage portfolio, net.'' We also have aguaranty liability for loans underlying MBS held by us or other investors, which is included in the balancesheet under ""Guaranty liability for MBS.''
The allowance for loan losses and the guaranty liability for MBS represent our estimate of probable creditlosses arising from loans and loans underlying Fannie Mae MBS we own as well as MBS we guarantee forothers as of the balance sheet date. We perform regular, ongoing reviews to identify probable losses. Wemonitor delinquency, default, loss rates, and other portfolio risk characteristics. These risk characteristicsinclude geographic concentration, loan-to-value ratio, mortgage product type, and loan age.
We increase the allowance for loan losses and the guaranty liability for MBS by recording a provision forlosses in the income statement. Charge-oÅs reduce the allowance or guaranty liability and loan recoveriesincrease the allowance or guaranty liability. We consider current delinquency levels, historical loss experience,current economic conditions, and mortgage characteristics when evaluating the adequacy of our allowance andguaranty liability.
We determine the adequacy of the allowance and guaranty liability for single-family assets by evaluatingrisk characteristics such as product type, original loan-to-value ratio, and loan age. We estimate defaults foreach risk characteristic based on historical experience and apply a historical severity to each risk category, inaccordance with FAS 5. In addition, we apply Financial Accounting Standard No. 114, Accounting byCreditors for Impairment of a Loan (FAS 114), to determine the amount of impairment on speciÑc loans thathave been restructured. We charge-oÅ single-family loans when we foreclose on the loans.
We divide multifamily's allowance and guaranty liability into two parts: loans that are impaired and loansthat are not impaired. A loan is impaired when, based on current information and events, it is probable we willbe unable to collect all amounts due according to the contractual terms of the loan agreement. We applyFAS 114 to determine the amount of impairment on speciÑc loans that are not performing according tocontractual terms. We apply FAS 5 to loans that are not individually assessed for impairment and set up anallowance for loan losses or guaranty liability for probable losses as of the balance sheet date. We individuallyrate loans and segment them into the main risk categories that we use to monitor the multifamily portfolio.We then apply historical default rates and a corresponding severity to the loans in each segment.
In 2002, we reclassiÑed from our ""Allowance for loan losses'' to ""Guaranty liability for MBS'' theamount associated with the guaranty obligation for MBS that we own. The guaranty liability for MBSassociated with MBS guaranteed for others has historically been included in the caption ""Other liabilities'' onthe balance sheet. The balance sheet line item ""Guaranty liability for MBS'' now includes the liabilityassociated with MBS on the balance sheet and MBS guaranteed for others. Prior period balances have beenrestated to reÖect this reclassiÑcation.
We previously recorded gains from the sale of foreclosed properties and related mortgage insuranceclaims against our allowance for loan losses and guaranty liability as a recovery of charge-oÅs. During 2002,we reclassiÑed these gains to ""Foreclosed property income''. Additionally, the AICPA rescinded Statement ofPosition 92-3, Accounting for Foreclosed Assets (SOP 92-3), during the fourth quarter of 2002. UnderSOP 92-3, we recorded selling costs related to the disposition of foreclosed properties in our income statementunder ""Foreclosed property income''. We now include selling costs in our initial charge-oÅ estimate. All priorperiods have been reclassiÑed to conform to the current year presentation. The reclassiÑed amounts result inequal and oÅsetting changes to our ""Provision for losses'' and ""Foreclosed property income'' line items within
111

FANNIE MAE
NOTES TO FINANCIAL STATEMENTS Ì (Continued)
our previously reported income statements. These reclassiÑcations have no impact on previously reported netincome, total credit-related expenses, or the balance of the allowance for losses.
Acquired Property
We measure foreclosed assets at fair value, less estimated cost to sell, at the time of foreclosure. Fairvalue is determined based on the estimated net proceeds the company will receive from the disposition of theforeclosed asset. We charge subsequent changes in the collateral's fair value as well as foreclosure, holding,and disposition costs, directly to earnings through foreclosed property income.
We account for and classify deeds in lieu of foreclosure similar to foreclosures. Our accounting forpreforeclosure sales of properties by the borrower is slightly diÅerent because we do not have title to theunderlying properties. In a preforeclosure situation, the loan remains in the mortgage-related security or ourmortgage portfolio until the borrower sells the property. At that point, we reduce the carrying amount of themortgage loan and create a receivable for the sale proceeds in the amount of the sales price. We classify thereceivable for the sale proceeds as part of ""Acquired property and foreclosure claims, net'' on the balancesheet. If there is any remaining investment in the mortgage loan, we charge oÅ the mortgage loan against theallowance for loan losses or guaranty liability for MBS. If the sale proceeds exceed the mortgage loan balance,we record it in ""Foreclosed property income'' on the income statement.
Derivative Instruments and Hedging Activities
On January 1, 2001, we adopted Financial Accounting Standard No. 133, Accounting for DerivativeInstruments and Hedging Activities (FAS 133), as amended by Financial Accounting Standard No. 138,Accounting for Certain Derivative Instruments and Certain Hedging Activities. Under FAS 133, we recognizeall derivatives as either assets or liabilities on the balance sheet at their fair value. Subject to certain qualifyingconditions, we may designate a derivative as either a hedge of the cash Öows of a variable-rate instrument oranticipated transaction (cash Öow hedge) or a hedge of the fair value of a Ñxed-rate instrument (fair valuehedge). For a derivative qualifying as a cash Öow hedge, we report fair value gains or losses in a separatecomponent of AOCI, net of deferred taxes, in stockholders' equity to the extent the hedge is eÅective. Werecognize these fair value gains or losses in earnings during the period(s) in which the hedged item aÅectsearnings. For a derivative qualifying as a fair value hedge, we report fair value gains or losses on the derivativein earnings along with fair value gains or losses on the hedged item attributable to the risk being hedged. For aderivative not qualifying as a hedge, or components of a derivative that are excluded from any hedgeeÅectiveness assessment, we report fair value gains and losses in earnings.
If a derivative no longer qualiÑes as a cash Öow or fair value hedge, we discontinue hedge accountingprospectively. We continue to carry the derivative on the balance sheet at fair value and record fair value gainsand losses in earnings until the derivative is settled. For discontinued cash Öow hedges, we recognize the gainsor losses previously deferred in AOCI in earnings in the same period(s) that the hedged item aÅects earnings.For discontinued fair value hedges, we no longer adjust the carrying amount of the hedged asset or liability forchanges in its fair value. We then amortize previous fair value adjustments to the carrying amount of thehedged item to earnings over the remaining life of the hedged item using the eÅective yield method.
Our adoption of FAS 133 on January 1, 2001, resulted in a cumulative after-tax increase in income of$168 million and an after-tax reduction in AOCI of $3.9 billion. In addition, we reclassiÑed investmentsecurities and MBS with an amortized cost of approximately $20 billion from held-to-maturity to available-for-sale upon the adoption of FAS 133. At the time of this noncash transfer, we had gross unrealized gains andlosses of $164 million and $32 million, respectively, on these securities.
112

FANNIE MAE
NOTES TO FINANCIAL STATEMENTS Ì (Continued)
We reÖect payments to purchase and terminate derivatives used as hedges of our debt as ""net paymentsto purchase or settle hedge instruments'' in our cash Öow statement. We classify these payments as Ñnancingactivities because we use these derivatives as hedges of our funding costs.
During the fourth quarter of 2002, we reÑned our methodology for estimating the initial time value ofinterest rate caps at the date of purchase and prospectively adopted a preferred method that resulted in a$282 million pre-tax reduction in purchased options expense and increased our diluted earnings per share for2002 by $.18. Under our previous valuation method, we treated the entire premium paid on purchased ""at-the-money'' caps as time value with no allocation to intrinsic value. Our new methodology allocates the initialpurchase price to reÖect the value of individual caplets, some of which are above the strike rate of the cap,which results in a higher intrinsic value and corresponding lower time value at the date of purchase. Thisapproach is more consistent with our estimation of time value subsequent to the initial purchase date. Thischange does not aÅect the total expense that will be recorded in our income statement over the life of our caps.
Cash and Cash Equivalents
We consider highly liquid investment instruments with an original maturity of three months or less to becash equivalents. We record cash equivalents at cost. Cost is representative of fair value for these instrumentsbecause changes in short-term interest rates should have a minimal impact on the fair value of securities thathave an original term of three months or less.
Administrative Expenses
Administrative expenses include those costs we incur to run our daily operations. A signiÑcant componentof administrative expenses is compensation expense, which totaled $683 million in 2002, $602 million in 2001,and $541 million in 2000.
Debt Extinguishments
During the second quarter of 2002, we adopted Financial Accounting Standard No. 145, Rescission ofFASB Statements No. 4, 44, and 64, Amendment of FASB Statement No. 13, and Technical Corrections(FAS 145). This standard eliminates the extraordinary treatment of gains and losses on debt and relatedinterest rate swaps for us because the early extinguishment of debt is an ordinary and frequent part of ourbusiness. We reclassiÑed all prior periods to conform to the new classiÑcation.
Income Taxes
We establish deferred federal income tax assets and liabilities for temporary diÅerences between Ñnancialand taxable income. We measure these deferred amounts using the current marginal statutory tax rate. Wegenerally recognize investment and other tax credits when we record these items on the tax return.
Comprehensive Income
Comprehensive income is the change in equity, on a net of tax basis, resulting from transactions and otherevents and circumstances from nonowner sources during a period. It includes all changes in equity during aperiod, except those resulting from investments by owners and distributions to owners.
Special Contribution
We made a commitment during the fourth quarter of 2001 to contribute $300 million of Fannie Maecommon stock to the Fannie Mae Foundation. The Fannie Mae Foundation creates aÅordable homeowner-ship and housing opportunities through innovative partnerships and initiatives that build healthy, vibrantcommunities across the United States. It is a separate, private nonproÑt organization that is not consolidated
113

FANNIE MAE
NOTES TO FINANCIAL STATEMENTS Ì (Continued)
by Fannie Mae, but is supported solely by Fannie Mae. Fannie Mae acquired the shares through open marketpurchases and contributed the shares to the Foundation in the Ñrst quarter of 2002.
Stock-Based Compensation
At December 31, 2002, we had Ñve stock-based compensation or beneÑts programs that we describe inFootnote 8, Stock-Based Compensation Plans. Financial Accounting Standard No. 123, Accounting for Stock-Based Compensation (FAS 123), gives companies the option of either recording an expense for all stockcompensation awards based on the fair value at grant date or continuing to follow Accounting Principles BoardOpinion No. 25 (APB 25). Companies that follow APB 25 must disclose, in a footnote, pro forma net incomeand earnings per share as if they had adopted the expense recognition provisions of FAS 123. Prior to January2003, we elected to apply APB 25 and related interpretations in accounting for our plans. As a result ofapplying APB 25, we did not recognize compensation expense for nonqualiÑed stock options and theEmployee Stock Purchase Plan. We have elected to change our accounting for stock-based compensation andwill record expense for all future stock compensation awards at fair value at grant date under FAS 123beginning on January 1, 2003. We estimate that the impact of adopting the expense recognition provisions ofFAS 123 will result in additional expense of approximately $28 million in 2003.
In accordance with the disclosure requirements of Financial Accounting Standard No. 148, Accountingfor Stock-Based Compensation Ì Transition and Disclosure (FAS 148), the following table summarizes ournet income available to common stockholders and reported basic and diluted earnings per common share forthe years 2000-2002 under APB 25, as well as proforma net income available to common stockholders andbasic and diluted earnings per common share if we had recognized compensation expense according toFAS 123.
2002 2001 2000
(Dollars in millions,except per share amounts)
Net income available to common stockholders, as reportedÏÏÏÏÏÏÏÏÏÏÏÏÏÏÏÏÏÏÏÏÏÏÏÏÏÏÏ $4,520 $5,756 $4,327
Plus: Stock-based employee compensation expense recorded under APB 25, net of relatedtax eÅectsÏÏÏÏÏÏÏÏÏÏÏÏÏÏÏÏÏÏÏÏÏÏÏÏÏÏÏÏÏÏÏÏÏÏÏÏÏÏÏÏÏÏÏÏÏÏÏÏÏÏÏÏÏÏÏÏÏÏÏÏÏÏÏÏÏÏ 25 27 31
Less: Stock-based employee compensation expense determined under fair value basedmethod, net of related tax eÅects ÏÏÏÏÏÏÏÏÏÏÏÏÏÏÏÏÏÏÏÏÏÏÏÏÏÏÏÏÏÏÏÏÏÏÏÏÏÏÏÏÏÏÏÏÏÏ (105) (96) (80)
Pro forma net income available to common stockholders ÏÏÏÏÏÏÏÏÏÏÏÏÏÏÏÏÏÏÏÏÏÏÏÏÏÏÏÏ $4,440 $5,687 $4,278
Earnings per share:
Basic Ì as reportedÏÏÏÏÏÏÏÏÏÏÏÏÏÏÏÏÏÏÏÏÏÏÏÏÏÏÏÏÏÏÏÏÏÏÏÏÏÏÏÏÏÏÏÏÏÏÏÏÏÏÏÏÏÏÏÏÏÏ $ 4.56 $ 5.75 $ 4.31
Basic Ì pro formaÏÏÏÏÏÏÏÏÏÏÏÏÏÏÏÏÏÏÏÏÏÏÏÏÏÏÏÏÏÏÏÏÏÏÏÏÏÏÏÏÏÏÏÏÏÏÏÏÏÏÏÏÏÏÏÏÏÏÏ 4.47 5.69 4.26
Diluted Ì as reportedÏÏÏÏÏÏÏÏÏÏÏÏÏÏÏÏÏÏÏÏÏÏÏÏÏÏÏÏÏÏÏÏÏÏÏÏÏÏÏÏÏÏÏÏÏÏÏÏÏÏÏÏÏÏÏÏ 4.53 5.72 4.29
Diluted Ì pro formaÏÏÏÏÏÏÏÏÏÏÏÏÏÏÏÏÏÏÏÏÏÏÏÏÏÏÏÏÏÏÏÏÏÏÏÏÏÏÏÏÏÏÏÏÏÏÏÏÏÏÏÏÏÏÏÏÏ 4.45 5.65 4.24
We determined the fair value of our stock-based compensation using a Black-Scholes pricing model. Thefollowing table summarizes the major assumptions used in the model.
2002 2001 2000
Risk-free rate(1)ÏÏÏÏÏÏÏÏÏÏÏÏÏÏÏÏÏÏÏÏÏÏÏÏÏÏÏÏÏÏÏÏÏÏÏÏÏÏÏÏÏÏÏÏÏÏ 3.235-4.995% 3.885-5.155% 5.085-6.815%
Volatility ÏÏÏÏÏÏÏÏÏÏÏÏÏÏÏÏÏÏÏÏÏÏÏÏÏÏÏÏÏÏÏÏÏÏÏÏÏÏÏÏÏÏÏÏÏÏÏÏÏÏÏ 31-33% 33-34% 29-34%
Dividend(2)ÏÏÏÏÏÏÏÏÏÏÏÏÏÏÏÏÏÏÏÏÏÏÏÏÏÏÏÏÏÏÏÏÏÏÏÏÏÏÏÏÏÏÏÏÏÏÏÏÏÏ $1.32 $1.20 $1.12
Average expected life ÏÏÏÏÏÏÏÏÏÏÏÏÏÏÏÏÏÏÏÏÏÏÏÏÏÏÏÏÏÏÏÏÏÏÏÏÏÏÏÏÏ 6 yrs. 5 yrs. 5 yrs.
(1) The synthetic 6-year zero-coupon U.S. Treasury strip yield formed by interpolating between the 5-year and 7-yearzero-coupon U.S. Treasury strip yields in 2002.
(2) Dividend rate on common stock at date of grant. Dividend rate assumed to remain constant over the option life.
114

FANNIE MAE
NOTES TO FINANCIAL STATEMENTS Ì (Continued)
2. Mortgage Portfolio, Net(1)
The mortgage portfolio, net is composed of whole loans and securities backed by loans. The followingpresents the composition of these two components at December 31,
2002 2001
(Dollars inmillions)
MortgagesSingle-family:
Government insured or guaranteed ÏÏÏÏÏÏÏÏÏÏÏÏÏÏÏÏÏÏÏÏÏÏÏÏÏÏÏÏÏÏÏÏÏÏÏÏÏÏÏÏÏÏÏÏÏÏÏÏÏÏÏÏÏÏÏÏÏÏÏÏÏÏ $ 5,458 $ 5,070
Conventional:Long-term, Ñxed-rate ÏÏÏÏÏÏÏÏÏÏÏÏÏÏÏÏÏÏÏÏÏÏÏÏÏÏÏÏÏÏÏÏÏÏÏÏÏÏÏÏÏÏÏÏÏÏÏÏÏÏÏÏÏÏÏÏÏÏÏÏÏÏÏÏÏÏÏÏÏÏÏ 103,220 96,417Intermediate-term, Ñxed-rate(2) ÏÏÏÏÏÏÏÏÏÏÏÏÏÏÏÏÏÏÏÏÏÏÏÏÏÏÏÏÏÏÏÏÏÏÏÏÏÏÏÏÏÏÏÏÏÏÏÏÏÏÏÏÏÏÏÏÏÏÏÏÏÏÏ 54,503 43,522Adjustable-rateÏÏÏÏÏÏÏÏÏÏÏÏÏÏÏÏÏÏÏÏÏÏÏÏÏÏÏÏÏÏÏÏÏÏÏÏÏÏÏÏÏÏÏÏÏÏÏÏÏÏÏÏÏÏÏÏÏÏÏÏÏÏÏÏÏÏÏÏÏÏÏÏÏÏÏÏÏ 9,045 10,410
Total conventional single-family ÏÏÏÏÏÏÏÏÏÏÏÏÏÏÏÏÏÏÏÏÏÏÏÏÏÏÏÏÏÏÏÏÏÏÏÏÏÏÏÏÏÏÏÏÏÏÏÏÏÏÏÏÏÏÏÏÏÏ 166,768 150,349
Total single-familyÏÏÏÏÏÏÏÏÏÏÏÏÏÏÏÏÏÏÏÏÏÏÏÏÏÏÏÏÏÏÏÏÏÏÏÏÏÏÏÏÏÏÏÏÏÏÏÏÏÏÏÏÏÏÏÏÏÏÏÏÏÏÏÏÏÏÏÏÏÏÏÏÏÏÏÏÏÏ 172,226 155,419
Multifamily:Government insured or guaranteed ÏÏÏÏÏÏÏÏÏÏÏÏÏÏÏÏÏÏÏÏÏÏÏÏÏÏÏÏÏÏÏÏÏÏÏÏÏÏÏÏÏÏÏÏÏÏÏÏÏÏÏÏÏÏÏÏÏÏÏÏÏÏ 1,353 1,551Conventional ÏÏÏÏÏÏÏÏÏÏÏÏÏÏÏÏÏÏÏÏÏÏÏÏÏÏÏÏÏÏÏÏÏÏÏÏÏÏÏÏÏÏÏÏÏÏÏÏÏÏÏÏÏÏÏÏÏÏÏÏÏÏÏÏÏÏÏÏÏÏÏÏÏÏÏÏÏÏÏÏ 12,218 8,987
Total multifamilyÏÏÏÏÏÏÏÏÏÏÏÏÏÏÏÏÏÏÏÏÏÏÏÏÏÏÏÏÏÏÏÏÏÏÏÏÏÏÏÏÏÏÏÏÏÏÏÏÏÏÏÏÏÏÏÏÏÏÏÏÏÏÏÏÏÏÏÏÏÏÏÏÏÏÏÏÏÏÏ 13,571 10,538
Unamortized premium (discount) and deferred price adjustments ÏÏÏÏÏÏÏÏÏÏÏÏÏÏÏÏÏÏÏÏÏÏÏÏÏÏÏÏÏÏÏÏÏÏÏÏÏÏ 337 (2,640)Allowance for loan losses(3) ÏÏÏÏÏÏÏÏÏÏÏÏÏÏÏÏÏÏÏÏÏÏÏÏÏÏÏÏÏÏÏÏÏÏÏÏÏÏÏÏÏÏÏÏÏÏÏÏÏÏÏÏÏÏÏÏÏÏÏÏÏÏÏÏÏÏÏÏÏÏ (79) (48)
Total mortgages ÏÏÏÏÏÏÏÏÏÏÏÏÏÏÏÏÏÏÏÏÏÏÏÏÏÏÏÏÏÏÏÏÏÏÏÏÏÏÏÏÏÏÏÏÏÏÏÏÏÏÏÏÏÏÏÏÏÏÏÏÏÏÏÏÏÏÏÏÏÏÏÏÏÏÏÏÏÏÏÏ $186,055 $163,269
Mortgage-related securitiesSingle-family:
Government insured or guaranteed ÏÏÏÏÏÏÏÏÏÏÏÏÏÏÏÏÏÏÏÏÏÏÏÏÏÏÏÏÏÏÏÏÏÏÏÏÏÏÏÏÏÏÏÏÏÏÏÏÏÏÏÏÏÏÏÏÏÏÏÏÏÏ $ 33,293 $ 37,111
Conventional:Long-term, Ñxed-rate ÏÏÏÏÏÏÏÏÏÏÏÏÏÏÏÏÏÏÏÏÏÏÏÏÏÏÏÏÏÏÏÏÏÏÏÏÏÏÏÏÏÏÏÏÏÏÏÏÏÏÏÏÏÏÏÏÏÏÏÏÏÏÏÏÏÏÏÏÏÏÏ 510,435 456,046Intermediate-term, Ñxed-rate(2) ÏÏÏÏÏÏÏÏÏÏÏÏÏÏÏÏÏÏÏÏÏÏÏÏÏÏÏÏÏÏÏÏÏÏÏÏÏÏÏÏÏÏÏÏÏÏÏÏÏÏÏÏÏÏÏÏÏÏÏÏÏÏÏ 39,409 25,890Adjustable-rateÏÏÏÏÏÏÏÏÏÏÏÏÏÏÏÏÏÏÏÏÏÏÏÏÏÏÏÏÏÏÏÏÏÏÏÏÏÏÏÏÏÏÏÏÏÏÏÏÏÏÏÏÏÏÏÏÏÏÏÏÏÏÏÏÏÏÏÏÏÏÏÏÏÏÏÏÏ 13,946 10,355
Total conventional single-family ÏÏÏÏÏÏÏÏÏÏÏÏÏÏÏÏÏÏÏÏÏÏÏÏÏÏÏÏÏÏÏÏÏÏÏÏÏÏÏÏÏÏÏÏÏÏÏÏÏÏÏÏÏÏÏÏÏÏ 563,790 492,291
Total single-familyÏÏÏÏÏÏÏÏÏÏÏÏÏÏÏÏÏÏÏÏÏÏÏÏÏÏÏÏÏÏÏÏÏÏÏÏÏÏÏÏÏÏÏÏÏÏÏÏÏÏÏÏÏÏÏÏÏÏÏÏÏÏÏÏÏÏÏÏÏÏÏÏÏÏÏÏÏÏ 597,083 529,402
Multifamily:Government insured or guaranteed ÏÏÏÏÏÏÏÏÏÏÏÏÏÏÏÏÏÏÏÏÏÏÏÏÏÏÏÏÏÏÏÏÏÏÏÏÏÏÏÏÏÏÏÏÏÏÏÏÏÏÏÏÏÏÏÏÏÏÏÏÏÏ 7,370 6,481Conventional ÏÏÏÏÏÏÏÏÏÏÏÏÏÏÏÏÏÏÏÏÏÏÏÏÏÏÏÏÏÏÏÏÏÏÏÏÏÏÏÏÏÏÏÏÏÏÏÏÏÏÏÏÏÏÏÏÏÏÏÏÏÏÏÏÏÏÏÏÏÏÏÏÏÏÏÏÏÏÏÏ 7,050 5,636
Total multifamilyÏÏÏÏÏÏÏÏÏÏÏÏÏÏÏÏÏÏÏÏÏÏÏÏÏÏÏÏÏÏÏÏÏÏÏÏÏÏÏÏÏÏÏÏÏÏÏÏÏÏÏÏÏÏÏÏÏÏÏÏÏÏÏÏÏÏÏÏÏÏÏÏÏÏÏÏÏÏÏ 14,420 12,117
Unamortized premium ÏÏÏÏÏÏÏÏÏÏÏÏÏÏÏÏÏÏÏÏÏÏÏÏÏÏÏÏÏÏÏÏÏÏÏÏÏÏÏÏÏÏÏÏÏÏÏÏÏÏÏÏÏÏÏÏÏÏÏÏÏÏÏÏÏÏÏÏÏÏÏÏÏÏ 135 536
Total mortgage-related securitiesÏÏÏÏÏÏÏÏÏÏÏÏÏÏÏÏÏÏÏÏÏÏÏÏÏÏÏÏÏÏÏÏÏÏÏÏÏÏÏÏÏÏÏÏÏÏÏÏÏÏÏÏÏÏÏÏÏÏÏÏÏÏÏÏÏÏ $611,638 $542,055
Mortgage portfolio, netSingle-family:
Government insured or guaranteed ÏÏÏÏÏÏÏÏÏÏÏÏÏÏÏÏÏÏÏÏÏÏÏÏÏÏÏÏÏÏÏÏÏÏÏÏÏÏÏÏÏÏÏÏÏÏÏÏÏÏÏÏÏÏÏÏÏÏÏÏÏÏ $ 38,751 $ 42,181
Conventional:Long-term, Ñxed-rate ÏÏÏÏÏÏÏÏÏÏÏÏÏÏÏÏÏÏÏÏÏÏÏÏÏÏÏÏÏÏÏÏÏÏÏÏÏÏÏÏÏÏÏÏÏÏÏÏÏÏÏÏÏÏÏÏÏÏÏÏÏÏÏÏÏÏÏÏÏÏÏ 613,655 552,463Intermediate-term, Ñxed-rate(2) ÏÏÏÏÏÏÏÏÏÏÏÏÏÏÏÏÏÏÏÏÏÏÏÏÏÏÏÏÏÏÏÏÏÏÏÏÏÏÏÏÏÏÏÏÏÏÏÏÏÏÏÏÏÏÏÏÏÏÏÏÏÏÏ 93,912 69,412Adjustable-rateÏÏÏÏÏÏÏÏÏÏÏÏÏÏÏÏÏÏÏÏÏÏÏÏÏÏÏÏÏÏÏÏÏÏÏÏÏÏÏÏÏÏÏÏÏÏÏÏÏÏÏÏÏÏÏÏÏÏÏÏÏÏÏÏÏÏÏÏÏÏÏÏÏÏÏÏÏ 22,991 20,765
Total conventional single-family ÏÏÏÏÏÏÏÏÏÏÏÏÏÏÏÏÏÏÏÏÏÏÏÏÏÏÏÏÏÏÏÏÏÏÏÏÏÏÏÏÏÏÏÏÏÏÏÏÏÏÏÏÏÏÏÏÏÏ 730,558 642,640
Total single-familyÏÏÏÏÏÏÏÏÏÏÏÏÏÏÏÏÏÏÏÏÏÏÏÏÏÏÏÏÏÏÏÏÏÏÏÏÏÏÏÏÏÏÏÏÏÏÏÏÏÏÏÏÏÏÏÏÏÏÏÏÏÏÏÏÏÏÏÏÏÏÏÏÏÏÏÏÏÏ 769,309 684,821
Multifamily:Government insured or guaranteed ÏÏÏÏÏÏÏÏÏÏÏÏÏÏÏÏÏÏÏÏÏÏÏÏÏÏÏÏÏÏÏÏÏÏÏÏÏÏÏÏÏÏÏÏÏÏÏÏÏÏÏÏÏÏÏÏÏÏÏÏÏÏ 8,723 8,032Conventional ÏÏÏÏÏÏÏÏÏÏÏÏÏÏÏÏÏÏÏÏÏÏÏÏÏÏÏÏÏÏÏÏÏÏÏÏÏÏÏÏÏÏÏÏÏÏÏÏÏÏÏÏÏÏÏÏÏÏÏÏÏÏÏÏÏÏÏÏÏÏÏÏÏÏÏÏÏÏÏÏ 19,268 14,623
Total multifamilyÏÏÏÏÏÏÏÏÏÏÏÏÏÏÏÏÏÏÏÏÏÏÏÏÏÏÏÏÏÏÏÏÏÏÏÏÏÏÏÏÏÏÏÏÏÏÏÏÏÏÏÏÏÏÏÏÏÏÏÏÏÏÏÏÏÏÏÏÏÏÏÏÏÏÏÏÏÏÏ 27,991 22,655
Total mortgage portfolio ÏÏÏÏÏÏÏÏÏÏÏÏÏÏÏÏÏÏÏÏÏÏÏÏÏÏÏÏÏÏÏÏÏÏÏÏÏÏÏÏÏÏÏÏÏÏÏÏÏÏÏÏÏÏÏÏÏÏÏÏÏÏÏÏÏÏÏÏÏÏÏÏÏ 797,300 707,476Unamortized premium (discount) and deferred price adjustments, net ÏÏÏÏÏÏÏÏÏÏÏÏÏÏÏÏÏÏÏÏÏÏÏÏÏÏÏÏÏÏÏÏ 472 (2,104)Allowance for loan losses(3) ÏÏÏÏÏÏÏÏÏÏÏÏÏÏÏÏÏÏÏÏÏÏÏÏÏÏÏÏÏÏÏÏÏÏÏÏÏÏÏÏÏÏÏÏÏÏÏÏÏÏÏÏÏÏÏÏÏÏÏÏÏÏÏÏÏÏÏÏ (79) (48)
Mortgage portfolio, net ÏÏÏÏÏÏÏÏÏÏÏÏÏÏÏÏÏÏÏÏÏÏÏÏÏÏÏÏÏÏÏÏÏÏÏÏÏÏÏÏÏÏÏÏÏÏÏÏÏÏÏÏÏÏÏÏÏÏÏÏÏÏÏÏÏÏÏÏÏÏÏÏÏÏ $797,693 $705,324
(1) Data represents unpaid principal balance adjusted to include mark-to-market gains and losses on available-for-sale securities.(2) Intermediate-term, Ñxed-rate consists of portfolio loans with contractual maturities at purchase equal to or less than 20 years and
MBS and mortgage-related securities held in portfolio with maturities of 15 years or less at issue date.
(3) Allowance for loan losses does not apply to loans held-for-sale of $145 million and $40 million at December 31, 2002 and 2001,respectively.
115

FANNIE MAE
NOTES TO FINANCIAL STATEMENTS Ì (Continued)
Nonaccrual loans totaled $5.5 billion and $3.7 billion at December 31, 2002 and 2001, respectively.Accruing loans past 90 days due totaled $673 million and $565 million at December 31, 2002 and 2001,respectively.
At December 31, 2002 and 2001, the balance of whole loans held for sale was $145 million and$40 million, respectively. There were no gross realized gains or losses on sales of whole loans held for sale in2002, 2001, or 2000.
Within the mortgage portfolio are MBS and other mortgage-related securities that we classify as eitherheld-to-maturity or available-for-sale. Below is a table of the securities held in each of these categories alongwith their gross unrealized gains and losses and total fair value for the years ending 2002 and 2001.
December 31, 2002
Gross GrossAmortized Unrealized Unrealized Fair
Cost(1) Gains Losses Value
(Dollars in millions)
Held-to-maturity:
MBS(2)ÏÏÏÏÏÏÏÏÏÏÏÏÏÏÏÏÏÏÏÏÏÏÏÏÏÏÏÏÏÏÏÏÏÏÏÏÏÏÏÏÏÏÏÏÏÏÏÏÏÏ $286,422 $11,173 $ (1) $297,594REMICs and Stripped MBS ÏÏÏÏÏÏÏÏÏÏÏÏÏÏÏÏÏÏÏÏÏÏÏÏÏÏÏÏÏÏÏ 110,423 4,339 (87) 114,675Other mortgage-related securitiesÏÏÏÏÏÏÏÏÏÏÏÏÏÏÏÏÏÏÏÏÏÏÏÏÏÏÏÏ 41,087 2,813 (45) 43,855
TotalÏÏÏÏÏÏÏÏÏÏÏÏÏÏÏÏÏÏÏÏÏÏÏÏÏÏÏÏÏÏÏÏÏÏÏÏÏÏÏÏÏÏÏÏÏÏÏÏÏÏ $437,932 $18,325 $(133) $456,124
Available-for-sale:
MBS(2)ÏÏÏÏÏÏÏÏÏÏÏÏÏÏÏÏÏÏÏÏÏÏÏÏÏÏÏÏÏÏÏÏÏÏÏÏÏÏÏÏÏÏÏÏÏÏÏÏÏÏ $116,081 $ 5,425 $ (1) $121,505REMICs and Stripped MBS ÏÏÏÏÏÏÏÏÏÏÏÏÏÏÏÏÏÏÏÏÏÏÏÏÏÏÏÏÏÏÏ 33,763 678 (369) 34,072Other mortgage-related securitiesÏÏÏÏÏÏÏÏÏÏÏÏÏÏÏÏÏÏÏÏÏÏÏÏÏÏÏÏ 17,358 782 (11) 18,129
TotalÏÏÏÏÏÏÏÏÏÏÏÏÏÏÏÏÏÏÏÏÏÏÏÏÏÏÏÏÏÏÏÏÏÏÏÏÏÏÏÏÏÏÏÏÏÏÏÏÏÏ $167,202 $ 6,885 $(381) $173,706
December 31, 2001
Gross GrossAmortized Unrealized Unrealized Fair
Cost(1) Gains Losses Value
(Dollars in millions)
Held-to-maturity:
MBS(2)ÏÏÏÏÏÏÏÏÏÏÏÏÏÏÏÏÏÏÏÏÏÏÏÏÏÏÏÏÏÏÏÏÏÏÏÏÏÏÏÏÏÏÏÏÏÏÏÏÏÏ $333,896 $ 3,536 $ (54) $337,378REMICs and Stripped MBS ÏÏÏÏÏÏÏÏÏÏÏÏÏÏÏÏÏÏÏÏÏÏÏÏÏÏÏÏÏÏÏ 127,675 2,432 (579) 129,528Other mortgage-related securitiesÏÏÏÏÏÏÏÏÏÏÏÏÏÏÏÏÏÏÏÏÏÏÏÏÏÏÏÏ 47,584 1,411 (87) 48,908
TotalÏÏÏÏÏÏÏÏÏÏÏÏÏÏÏÏÏÏÏÏÏÏÏÏÏÏÏÏÏÏÏÏÏÏÏÏÏÏÏÏÏÏÏÏÏÏÏÏÏÏ $509,155 $ 7,379 $(720) $515,814
Available-for-sale:
MBS(2)ÏÏÏÏÏÏÏÏÏÏÏÏÏÏÏÏÏÏÏÏÏÏÏÏÏÏÏÏÏÏÏÏÏÏÏÏÏÏÏÏÏÏÏÏÏÏÏÏÏÏ $ 9,119 $ 105 $ (27) $ 9,197REMICs and Stripped MBS ÏÏÏÏÏÏÏÏÏÏÏÏÏÏÏÏÏÏÏÏÏÏÏÏÏÏÏÏÏÏÏ 1,083 211 (240) 1,054Other mortgage-related securitiesÏÏÏÏÏÏÏÏÏÏÏÏÏÏÏÏÏÏÏÏÏÏÏÏÏÏÏÏ 22,236 425 (12) 22,649
TotalÏÏÏÏÏÏÏÏÏÏÏÏÏÏÏÏÏÏÏÏÏÏÏÏÏÏÏÏÏÏÏÏÏÏÏÏÏÏÏÏÏÏÏÏÏÏÏÏÏÏ $ 32,438 $ 741 $(279) $ 32,900
(1) Amortized cost includes unamortized premiums, discounts, and deferred price adjustments.
(2) Excludes REMICs and Stripped MBS.
116

FANNIE MAE
NOTES TO FINANCIAL STATEMENTS Ì (Continued)
On September 13, 2002, concurrent with the new risk-based capital rule issued by our regulator, OÇce ofFederal Housing Enterprise Oversight (OFHEO), we reclassiÑed $124 billion of securities in our mortgageportfolio from held-to-maturity to available-for-sale. Prior to September 13, 2002, Fannie Mae was not subjectto a risk-based capital standard. OFHEO implemented the risk-based standard on that date and this standardapplied to all assets held by Fannie Mae. FAS 115 speciÑcally identiÑes ""a signiÑcant increase in the riskweights of debt securities used for regulatory risk-based capital purposes'' as a change in circumstance underwhich a company may reclassify securities from held-to-maturity to available-for-sale without calling intoquestion the intent to hold other securities to maturity in the future. At the time of this noncash transfer, thesesecurities had gross unrealized gains and losses of $5.364 billion and $53 million, respectively.
Total gross realized gains and losses on sales of MBS and other mortgage-related securities in 2002 were$78 million and $21 million, respectively. Total net realized losses on sales of MBS and other mortgage-related securities were $13 million in 2001 and $21 million in 2000.
REMICs and Stripped MBS
Included in the table above are REMICs backed by MBS and whole loans and Stripped MBS (SMBS)backed by MBS. REMICs represent a beneÑcial interest in a trust having multiple classes of securities. Thesecurities of each class entitle investors to cash Öows structured diÅerently from the payments on theunderlying assets. SMBS are created by ""stripping'' or separating the principal and interest payments from theunderlying pool of mortgages into two classes of securities, with each receiving a diÅerent proportion of theprincipal and interest payments. REMICs and SMBS do not subject us to additional credit risk if we alreadyguarantee the underlying MBS. REMICs and SMBS generally have diÅerent interest rate risk than MBS. Toestimate fair values for these securities, we use a stochastic simulation to model future interest rates anddiscount factors over a large number of scenarios. The simulation calibrates the distribution of interest rates tothe current market yield curve and reÖects current option adjusted spreads in its discount factors. To modelprepayments, we use our proprietary prepayment models to develop an estimated prepayment level for eachpoint in time along each scenario.
Retained Interests
In some cases, we create REMICs using assets from our mortgage portfolio and retain an interest in theREMICs. In these instances, we measure our retained interests by allocating the carrying amount of the assetswe retained based on their fair value at the transfer date relative to the assets we sold. We are a passiveinvestor with regard to the transferred assets, as our continuing involvement is limited to guaranteeing some ofthe assets underlying these REMICs.
The entire principal balance of REMICs outstanding at December 31, 2002 and December 31, 2001 was$55.6 billion and $21.0 billion, respectively. For the years ended December 31, 2002 and December 31, 2001,we recognized a $25.4 million net gain and a $24.4 million net loss, respectively, on the portion of assets wesold at the time of securitization, which totaled $3.7 billion and $2.2 billion, respectively. Cash proceedsreceived from the sale of these assets totaled $3.7 billion and $2.2 billion for the years ended December 31,2002 and December 31, 2001, respectively. Because these REMIC securities are backed by guaranteed MBS,the cash Öows from purchases of delinquent loans or foreclosed loans is immaterial. We did not sell any of ourretained interests in either 2002 or 2001. Therefore, we did not incur any gains or losses on sales of retainedinterests for the years then ended. At December 31, 2002 and 2001, the book value of our retained interestswas $41.9 billion and $18.9 billion, respectively. These securities are backed by MBS guaranteed by FannieMae. As a result, the delinquency and credit loss information associated with these REMIC securities isimmaterial because all principal and interest is passed through to the REMIC regardless of how theunderlying MBS perform.
117

FANNIE MAE
NOTES TO FINANCIAL STATEMENTS Ì (Continued)
Our retained interests are essentially investments of principal in mortgages because there is only a smallamount of original premium or discount associated with our investment. As a result, we classify our retainedinterests as held-to-maturity because they cannot be prepaid or settled in such a way that we would notrecover substantially all of our investment. Our retained interests give us the right to receive repayment of theprincipal we have invested, and the borrowers' obligations are secured by the Ñnanced properties.
We use an option-adjusted spread (OAS) approach to measure the fair value of our retained interests,which is the same approach used to measure the fair value for MBS held in our portfolio. The OAS is theincremental spread over our debt rates after taking into account the variability of mortgage cash Öows due tothe embedded prepayment option. Our proprietary interest rate and prepayment models are key assumptionsused in this valuation approach. The OAS approach starts with quoted market prices for a set of benchmarksecurities that are a representative sample of our portfolio holdings. We use our interest rate model in astochastic simulation to generate a large number of scenarios. Our prepayment model provides estimatedprepayment speeds to determine the cash Öows for each time period in each scenario. After the interest rates(including discount factors) and cash Öows are generated, the model solves for the OAS associated with themarket price of each benchmark security. These option-adjusted spreads are mapped to similar securities,including our retained interests, and the stochastic simulation process is repeated, this time including theappropriate OAS as part of the discount rate to calculate the fair value of each security.
At December 31, 2002 and 2001, the fair value of our retained interests was $42.7 billion and$18.6 billion, respectively, with a weighted-average life of 3.7 years and 7.3 years, respectively. The keyassumptions used in measuring the fair value of retained interests at the time of securitization are as follows:
2002 2001
Weighted-average life ÏÏÏÏÏÏÏÏÏÏÏÏÏÏÏÏÏÏÏÏÏÏÏÏÏÏÏÏÏÏÏÏÏÏÏÏÏÏÏÏÏÏÏÏÏÏÏÏÏÏÏÏÏÏ 6.0 years 6.0 years
Average lifetime CPR prepayment speed assumptionÏÏÏÏÏÏÏÏÏÏÏÏÏÏÏÏÏÏÏÏÏÏÏÏÏÏÏÏ 16.1% 15.8%
Average discount rate assumption ÏÏÏÏÏÏÏÏÏÏÏÏÏÏÏÏÏÏÏÏÏÏÏÏÏÏÏÏÏÏÏÏÏÏÏÏÏÏÏÏÏÏÏÏ 5.2 5.2
To quantify the sensitivity of the fair values of these retained interests to changes in valuationassumptions, we adjust the parameters of the prepayment model in order to change prepayment speeds anddirectly change the discount factors. Changes in prepayment speeds are speciÑed as the eÅect on the constantprepayment rate (CPR) over the Ñrst 12 months. This is typically the time period where immediate changesin prepayments will have the most signiÑcant eÅect on fair value. Changes in discount rate would incorporateboth the debt rate and the OAS.
These sensitivities are hypothetical and should be used with caution. The eÅect of a variation in one ofthese assumptions on the fair value of our retained interests is calculated without changing any otherassumptions. Changing one assumption could result in variation in another assumption, which may increase ordecrease the corresponding sensitivities. These sensitivities only measure changes in the fair value of ourretained interests and do not incorporate oÅsetting changes in the values of associated debt funding theretained interests. At December 31, 2002 and 2001, we modiÑed the following assumptions to quantify the
118

FANNIE MAE
NOTES TO FINANCIAL STATEMENTS Ì (Continued)
impact of immediate 5 percent, 10 percent, and 15 percent adverse changes in these assumptions on the fairvalue of our retained interests.
2002 2001
(Dollars in millions)
Prepayment speed assumptions:
Impact on year-end fair value from 5 percent adverse change in 12 month CPR prepaymentspeed ÏÏÏÏÏÏÏÏÏÏÏÏÏÏÏÏÏÏÏÏÏÏÏÏÏÏÏÏÏÏÏÏÏÏÏÏÏÏÏÏÏÏÏÏÏÏÏÏÏÏÏÏÏÏÏÏÏÏÏÏÏÏÏÏÏÏÏÏÏÏÏÏ $ (68) $ (24)
Impact on year-end fair value from 10 percent adverse change in 12 month CPRprepayment speedÏÏÏÏÏÏÏÏÏÏÏÏÏÏÏÏÏÏÏÏÏÏÏÏÏÏÏÏÏÏÏÏÏÏÏÏÏÏÏÏÏÏÏÏÏÏÏÏÏÏÏÏÏÏÏÏÏÏÏÏÏÏ (131) (48)
Impact on year-end fair value from 15 percent adverse change in 12 month CPRprepayment speedÏÏÏÏÏÏÏÏÏÏÏÏÏÏÏÏÏÏÏÏÏÏÏÏÏÏÏÏÏÏÏÏÏÏÏÏÏÏÏÏÏÏÏÏÏÏÏÏÏÏÏÏÏÏÏÏÏÏÏÏÏÏ (203) (73)
Average 12 month CPR prepayment speed assumption ÏÏÏÏÏÏÏÏÏÏÏÏÏÏÏÏÏÏÏÏÏÏÏÏÏÏÏÏÏÏÏÏÏÏ 49.2% 9.5%
Discount rate assumptions:
Impact on year-end fair value from 5 percent adverse changeÏÏÏÏÏÏÏÏÏÏÏÏÏÏÏÏÏÏÏÏÏÏÏÏÏÏÏ $ (358) $(307)
Impact on year-end fair value from 10 percent adverse changeÏÏÏÏÏÏÏÏÏÏÏÏÏÏÏÏÏÏÏÏÏÏÏÏÏÏ (711) (609)
Impact on year-end fair value from 15 percent adverse changeÏÏÏÏÏÏÏÏÏÏÏÏÏÏÏÏÏÏÏÏÏÏÏÏÏÏ (1,049) (898)
Average discount rate assumption ÏÏÏÏÏÏÏÏÏÏÏÏÏÏÏÏÏÏÏÏÏÏÏÏÏÏÏÏÏÏÏÏÏÏÏÏÏÏÏÏÏÏÏÏÏÏÏÏÏÏÏÏ 3.3% 6.4%
3. Allowance for Loan Losses and Guaranty Liability for MBS
We maintain a separate allowance for loan losses for our mortgage portfolio as well as a guaranty liabilityfor our guaranty of MBS. Changes for the years 2000 through 2002 are summarized below.
2002 2001 2000
(Dollars in millions)
Allowance for loan losses:(1)
Beginning balance ÏÏÏÏÏÏÏÏÏÏÏÏÏÏÏÏÏÏÏÏÏÏÏÏÏÏÏÏÏÏÏÏÏÏÏÏÏÏÏÏÏÏÏÏÏÏÏÏÏÏÏÏÏÏÏÏÏÏÏÏÏ $ 48 $ 51 $ 56Provision ÏÏÏÏÏÏÏÏÏÏÏÏÏÏÏÏÏÏÏÏÏÏÏÏÏÏÏÏÏÏÏÏÏÏÏÏÏÏÏÏÏÏÏÏÏÏÏÏÏÏÏÏÏÏÏÏÏÏÏÏÏÏÏÏÏÏÏÏÏ 44 7 9Charge-oÅs(2) ÏÏÏÏÏÏÏÏÏÏÏÏÏÏÏÏÏÏÏÏÏÏÏÏÏÏÏÏÏÏÏÏÏÏÏÏÏÏÏÏÏÏÏÏÏÏÏÏÏÏÏÏÏÏÏÏÏÏÏÏÏÏÏÏÏ (13) (10) (14)
Ending balance ÏÏÏÏÏÏÏÏÏÏÏÏÏÏÏÏÏÏÏÏÏÏÏÏÏÏÏÏÏÏÏÏÏÏÏÏÏÏÏÏÏÏÏÏÏÏÏÏÏÏÏÏÏÏÏÏÏÏÏÏÏÏÏÏ $ 79 $ 48 $ 51
Guaranty liability for MBS(1):Beginning balance ÏÏÏÏÏÏÏÏÏÏÏÏÏÏÏÏÏÏÏÏÏÏÏÏÏÏÏÏÏÏÏÏÏÏÏÏÏÏÏÏÏÏÏÏÏÏÏÏÏÏÏÏÏÏÏÏÏÏÏÏÏ $ 755 $755 $ 745Provision ÏÏÏÏÏÏÏÏÏÏÏÏÏÏÏÏÏÏÏÏÏÏÏÏÏÏÏÏÏÏÏÏÏÏÏÏÏÏÏÏÏÏÏÏÏÏÏÏÏÏÏÏÏÏÏÏÏÏÏÏÏÏÏÏÏÏÏÏÏ 84 87 113Charge-oÅs ÏÏÏÏÏÏÏÏÏÏÏÏÏÏÏÏÏÏÏÏÏÏÏÏÏÏÏÏÏÏÏÏÏÏÏÏÏÏÏÏÏÏÏÏÏÏÏÏÏÏÏÏÏÏÏÏÏÏÏÏÏÏÏÏÏÏÏ (110) (87) (103)
Ending balance ÏÏÏÏÏÏÏÏÏÏÏÏÏÏÏÏÏÏÏÏÏÏÏÏÏÏÏÏÏÏÏÏÏÏÏÏÏÏÏÏÏÏÏÏÏÏÏÏÏÏÏÏÏÏÏÏÏÏÏÏÏÏÏÏ $ 729 $755 $ 755
Combined allowance for loan losses and guaranty liability for MBS(3):Beginning balance ÏÏÏÏÏÏÏÏÏÏÏÏÏÏÏÏÏÏÏÏÏÏÏÏÏÏÏÏÏÏÏÏÏÏÏÏÏÏÏÏÏÏÏÏÏÏÏÏÏÏÏÏÏÏÏÏÏÏÏÏÏ $ 803 $806 $ 801Provision ÏÏÏÏÏÏÏÏÏÏÏÏÏÏÏÏÏÏÏÏÏÏÏÏÏÏÏÏÏÏÏÏÏÏÏÏÏÏÏÏÏÏÏÏÏÏÏÏÏÏÏÏÏÏÏÏÏÏÏÏÏÏÏÏÏÏÏÏÏ 128 94 122Charge-oÅs(2) ÏÏÏÏÏÏÏÏÏÏÏÏÏÏÏÏÏÏÏÏÏÏÏÏÏÏÏÏÏÏÏÏÏÏÏÏÏÏÏÏÏÏÏÏÏÏÏÏÏÏÏÏÏÏÏÏÏÏÏÏÏÏÏÏÏ (123) (97) (117)
Ending balance ÏÏÏÏÏÏÏÏÏÏÏÏÏÏÏÏÏÏÏÏÏÏÏÏÏÏÏÏÏÏÏÏÏÏÏÏÏÏÏÏÏÏÏÏÏÏÏÏÏÏÏÏÏÏÏÏÏÏÏÏÏÏÏÏ $ 808 $803 $ 806
(1) In 2002, we reclassiÑed from our ""Allowance for loan losses'' to a ""Guaranty liability for MBS'' the amountassociated with the guaranty obligation for MBS that we own. Prior period balances, the provision for losses, andcharge-oÅ amounts have been restated to reÖect this reclassiÑcation.
(2) Charge-oÅs exclude $1 million in 2002 on charge-oÅs related to foreclosed Federal Housing Administration loansthat are reported in the balance sheet under ""Acquired property and foreclosure claims, net.''
(3) The total excludes $2 million at year-end 2002 and $3 million at the end of 2001 and 2000, related to foreclosedFederal Housing Administration loans that are reported in the balance sheet under ""Acquired property andforeclosure claims, net.''
119

FANNIE MAE
NOTES TO FINANCIAL STATEMENTS Ì (Continued)
The following table summarizes the UPB of impaired loans and corresponding speciÑc loss allowances forthe years 2000 through 2002. The majority of our impaired and restructured loans are multifamily loans.Single-family loans that have not been restructured are exempt from FAS 114 because they are considered tobe a group of homogeneous loans that are collectively evaluated for impairment. A loan is impaired when it isprobable that all contractual principal and interest payments will not be collected as scheduled in the loanagreement based on current information and events. In the event of impairment, we compare the UPB ofimpaired and restructured loans with the fair value of the underlying collateral to measure any impairment andprovide a speciÑc allowance for estimated losses.
2002 2001 2000
(Dollars in millions)
UPB of impaired loans ÏÏÏÏÏÏÏÏÏÏÏÏÏÏÏÏÏÏÏÏÏÏÏÏÏÏÏÏÏÏÏÏÏÏÏÏÏÏÏÏÏÏÏÏÏÏÏÏÏÏÏÏÏÏÏÏÏÏÏÏÏ $314 $320 $186UPB of impaired loans with speciÑc loss allowanceÏÏÏÏÏÏÏÏÏÏÏÏÏÏÏÏÏÏÏÏÏÏÏÏÏÏÏÏÏÏÏÏÏÏÏÏÏÏ 137 213 67SpeciÑc loss allowance on impaired and restructured loans ÏÏÏÏÏÏÏÏÏÏÏÏÏÏÏÏÏÏÏÏÏÏÏÏÏÏÏÏÏÏÏ 17 13 2UPB of impaired loans without speciÑc loss allowance ÏÏÏÏÏÏÏÏÏÏÏÏÏÏÏÏÏÏÏÏÏÏÏÏÏÏÏÏÏÏÏÏÏÏÏ 177 107 119Average UPB of impaired loans(1) ÏÏÏÏÏÏÏÏÏÏÏÏÏÏÏÏÏÏÏÏÏÏÏÏÏÏÏÏÏÏÏÏÏÏÏÏÏÏÏÏÏÏÏÏÏÏÏÏÏÏÏÏ 285 204 210Estimated interest income recognized while loans were impaired ÏÏÏÏÏÏÏÏÏÏÏÏÏÏÏÏÏÏÏÏÏÏÏÏÏÏ 7 8 3
(1) Averages have been calculated on a monthly average basis.
4. Nonmortgage Investments
We classify securities in the LIP and other investments as either available-for-sale or held-to-maturity.We have presented below a schedule of available-for-sale nonmortgage investments at December 31, 2002 and2001.
2002
Gross GrossAmortized Unrealized Unrealized Fair
Cost Gains Losses Value
(Dollars in millions)
Available-for-sale:Asset-backed securities ÏÏÏÏÏÏÏÏÏÏÏÏÏÏÏÏÏÏÏÏÏÏÏÏÏÏÏÏÏÏÏÏÏÏÏÏÏ $22,281 $ 98 $ (68) $22,311Floating-rate notes(1) ÏÏÏÏÏÏÏÏÏÏÏÏÏÏÏÏÏÏÏÏÏÏÏÏÏÏÏÏÏÏÏÏÏÏÏÏÏÏÏ 11,754 10 (29) 11,735Corporate bonds ÏÏÏÏÏÏÏÏÏÏÏÏÏÏÏÏÏÏÏÏÏÏÏÏÏÏÏÏÏÏÏÏÏÏÏÏÏÏÏÏÏÏÏ 1,149 42 Ì 1,191Taxable auction notes ÏÏÏÏÏÏÏÏÏÏÏÏÏÏÏÏÏÏÏÏÏÏÏÏÏÏÏÏÏÏÏÏÏÏÏÏÏÏ 949 Ì Ì 949Auction rate preferred stock ÏÏÏÏÏÏÏÏÏÏÏÏÏÏÏÏÏÏÏÏÏÏÏÏÏÏÏÏÏÏÏÏÏ 112 Ì (4) 108Commercial paper ÏÏÏÏÏÏÏÏÏÏÏÏÏÏÏÏÏÏÏÏÏÏÏÏÏÏÏÏÏÏÏÏÏÏÏÏÏÏÏÏÏ 100 Ì Ì 100Other ÏÏÏÏÏÏÏÏÏÏÏÏÏÏÏÏÏÏÏÏÏÏÏÏÏÏÏÏÏÏÏÏÏÏÏÏÏÏÏÏÏÏÏÏÏÏÏÏÏÏÏÏ 400 Ì Ì 400
TotalÏÏÏÏÏÏÏÏÏÏÏÏÏÏÏÏÏÏÏÏÏÏÏÏÏÏÏÏÏÏÏÏÏÏÏÏÏÏÏÏÏÏÏÏÏÏÏÏÏÏÏ $36,745 $150 $(101) $36,794
2001
Gross GrossAmortized Unrealized Unrealized Fair
Cost Gains Losses Value
(Dollars in millions)
Available-for-sale:Asset-backed securities ÏÏÏÏÏÏÏÏÏÏÏÏÏÏÏÏÏÏÏÏÏÏÏÏÏÏÏÏÏÏÏÏÏÏÏÏÏ $14,876 $21 $(25) $14,872Floating-rate notes(1) ÏÏÏÏÏÏÏÏÏÏÏÏÏÏÏÏÏÏÏÏÏÏÏÏÏÏÏÏÏÏÏÏÏÏÏÏÏÏÏ 12,114 12 (45) 12,081Commercial paper ÏÏÏÏÏÏÏÏÏÏÏÏÏÏÏÏÏÏÏÏÏÏÏÏÏÏÏÏÏÏÏÏÏÏÏÏÏÏÏÏÏ 8,879 1 Ì 8,880Other ÏÏÏÏÏÏÏÏÏÏÏÏÏÏÏÏÏÏÏÏÏÏÏÏÏÏÏÏÏÏÏÏÏÏÏÏÏÏÏÏÏÏÏÏÏÏÏÏÏÏÏÏ 50 Ì Ì 50
TotalÏÏÏÏÏÏÏÏÏÏÏÏÏÏÏÏÏÏÏÏÏÏÏÏÏÏÏÏÏÏÏÏÏÏÏÏÏÏÏÏÏÏÏÏÏÏÏÏÏÏÏ $35,919 $34 $(70) $35,883
(1) As of December 31, 2002 and 2001, 100 percent of Öoating-rate notes repriced at intervals of 90 days or less.
120

FANNIE MAE
NOTES TO FINANCIAL STATEMENTS Ì (Continued)
Total gross realized gains on nonmortgage investments that were classiÑed as available-for-sale was$4.5 million in 2002, $9.9 million in 2001, and $6.6 million in 2000. Total gross realized losses on nonmortgageinvestments that were classiÑed as available-for-sale was $1.7 million in 2002, $6.1 million in 2001, and$4.3 million in 2000.
On September 13, 2002, concurrent with the new risk-based capital rule issued by our regulator,OFHEO, we reclassiÑed securities in our LIP that had an amortized cost of $11.0 billion and a fair value of$11.2 billion from held-to-maturity to available-for-sale. Prior to September 13, 2002, Fannie Mae was notsubject to a risk-based capital standard. OFHEO implemented the risk-based standard on that date and thisstandard applied to all assets held by Fannie Mae. FAS 115 speciÑcally identiÑes ""a signiÑcant increase in therisk weights of debt securities used for regulatory risk-based capital purposes'' as a change in circumstanceunder which a company may reclassify securities from held-to-maturity to available-for-sale without callinginto question the intent to hold other securities to maturity in the future. At the time of this noncash transfer,these securities had gross unrealized gains and losses of $139 million and $6 million, respectively. We havepresented below a schedule of held-to-maturity nonmortgage investments at December 31, 2002 and 2001.
2002
Gross GrossAmortized Unrealized Unrealized Fair
Cost Gains Losses Value
(Dollars in millions)
Held-to-maturity:
Repurchase agreements ÏÏÏÏÏÏÏÏÏÏÏÏÏÏÏÏÏÏÏÏÏÏÏÏÏÏÏÏÏÏÏÏÏÏÏÏÏ $20,732 $Ì $Ì $20,732
Eurodollar time deposits ÏÏÏÏÏÏÏÏÏÏÏÏÏÏÏÏÏÏÏÏÏÏÏÏÏÏÏÏÏÏÏÏÏÏÏÏ 1,398 Ì Ì 1,398
Auction rate preferred stock ÏÏÏÏÏÏÏÏÏÏÏÏÏÏÏÏÏÏÏÏÏÏÏÏÏÏÏÏÏÏÏÏÏ 402 Ì Ì 402
Federal funds ÏÏÏÏÏÏÏÏÏÏÏÏÏÏÏÏÏÏÏÏÏÏÏÏÏÏÏÏÏÏÏÏÏÏÏÏÏÏÏÏÏÏÏÏÏ 150 Ì Ì 150
Commercial paper ÏÏÏÏÏÏÏÏÏÏÏÏÏÏÏÏÏÏÏÏÏÏÏÏÏÏÏÏÏÏÏÏÏÏÏÏÏÏÏÏÏ 100 Ì Ì 100
Other ÏÏÏÏÏÏÏÏÏÏÏÏÏÏÏÏÏÏÏÏÏÏÏÏÏÏÏÏÏÏÏÏÏÏÏÏÏÏÏÏÏÏÏÏÏÏÏÏÏÏÏÏ 268 1 Ì 269
TotalÏÏÏÏÏÏÏÏÏÏÏÏÏÏÏÏÏÏÏÏÏÏÏÏÏÏÏÏÏÏÏÏÏÏÏÏÏÏÏÏÏÏÏÏÏÏÏÏÏÏÏ $23,050 $ 1 $Ì $23,051
2001
Gross GrossAmortized Unrealized Unrealized Fair
Cost Gains Losses Value
(Dollars in millions)
Held-to-maturity:
Repurchase agreements ÏÏÏÏÏÏÏÏÏÏÏÏÏÏÏÏÏÏÏÏÏÏÏÏÏÏÏÏÏÏÏÏÏÏÏÏÏ $ 9,380 $ Ì $Ì $ 9,380
Eurodollar time deposits ÏÏÏÏÏÏÏÏÏÏÏÏÏÏÏÏÏÏÏÏÏÏÏÏÏÏÏÏÏÏÏÏÏÏÏÏ 11,185 Ì Ì 11,185
Auction rate preferred stock ÏÏÏÏÏÏÏÏÏÏÏÏÏÏÏÏÏÏÏÏÏÏÏÏÏÏÏÏÏÏÏÏÏ 2,127 Ì Ì 2,127
Federal funds ÏÏÏÏÏÏÏÏÏÏÏÏÏÏÏÏÏÏÏÏÏÏÏÏÏÏÏÏÏÏÏÏÏÏÏÏÏÏÏÏÏÏÏÏÏ 4,904 Ì Ì 4,904
Commercial paper ÏÏÏÏÏÏÏÏÏÏÏÏÏÏÏÏÏÏÏÏÏÏÏÏÏÏÏÏÏÏÏÏÏÏÏÏÏÏÏÏÏ 2,844 1 Ì 2,845
Asset-backed securities ÏÏÏÏÏÏÏÏÏÏÏÏÏÏÏÏÏÏÏÏÏÏÏÏÏÏÏÏÏÏÏÏÏÏÏÏÏ 6,065 89 (1) 6,153
Other ÏÏÏÏÏÏÏÏÏÏÏÏÏÏÏÏÏÏÏÏÏÏÏÏÏÏÏÏÏÏÏÏÏÏÏÏÏÏÏÏÏÏÏÏÏÏÏÏÏÏÏÏ 2,166 73 Ì 2,239
TotalÏÏÏÏÏÏÏÏÏÏÏÏÏÏÏÏÏÏÏÏÏÏÏÏÏÏÏÏÏÏÏÏÏÏÏÏÏÏÏÏÏÏÏÏÏÏÏÏÏÏÏ $38,671 $163 $(1) $38,833
121
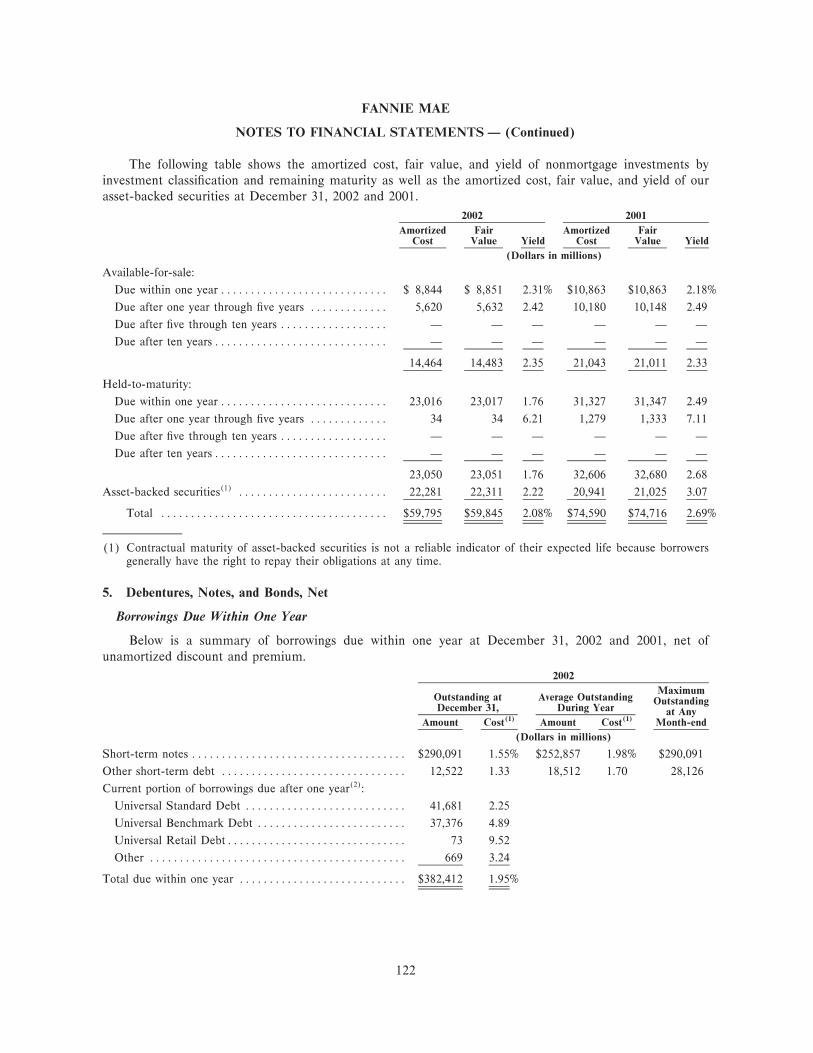
FANNIE MAE
NOTES TO FINANCIAL STATEMENTS Ì (Continued)
The following table shows the amortized cost, fair value, and yield of nonmortgage investments byinvestment classiÑcation and remaining maturity as well as the amortized cost, fair value, and yield of ourasset-backed securities at December 31, 2002 and 2001.
2002 2001
Amortized Fair Amortized FairCost Value Yield Cost Value Yield
(Dollars in millions)
Available-for-sale:
Due within one year ÏÏÏÏÏÏÏÏÏÏÏÏÏÏÏÏÏÏÏÏÏÏÏÏÏÏÏÏ $ 8,844 $ 8,851 2.31% $10,863 $10,863 2.18%
Due after one year through Ñve years ÏÏÏÏÏÏÏÏÏÏÏÏÏ 5,620 5,632 2.42 10,180 10,148 2.49
Due after Ñve through ten years ÏÏÏÏÏÏÏÏÏÏÏÏÏÏÏÏÏÏ Ì Ì Ì Ì Ì Ì
Due after ten yearsÏÏÏÏÏÏÏÏÏÏÏÏÏÏÏÏÏÏÏÏÏÏÏÏÏÏÏÏÏ Ì Ì Ì Ì Ì Ì
14,464 14,483 2.35 21,043 21,011 2.33
Held-to-maturity:
Due within one year ÏÏÏÏÏÏÏÏÏÏÏÏÏÏÏÏÏÏÏÏÏÏÏÏÏÏÏÏ 23,016 23,017 1.76 31,327 31,347 2.49
Due after one year through Ñve years ÏÏÏÏÏÏÏÏÏÏÏÏÏ 34 34 6.21 1,279 1,333 7.11
Due after Ñve through ten years ÏÏÏÏÏÏÏÏÏÏÏÏÏÏÏÏÏÏ Ì Ì Ì Ì Ì Ì
Due after ten yearsÏÏÏÏÏÏÏÏÏÏÏÏÏÏÏÏÏÏÏÏÏÏÏÏÏÏÏÏÏ Ì Ì Ì Ì Ì Ì
23,050 23,051 1.76 32,606 32,680 2.68
Asset-backed securities(1) ÏÏÏÏÏÏÏÏÏÏÏÏÏÏÏÏÏÏÏÏÏÏÏÏÏ 22,281 22,311 2.22 20,941 21,025 3.07
Total ÏÏÏÏÏÏÏÏÏÏÏÏÏÏÏÏÏÏÏÏÏÏÏÏÏÏÏÏÏÏÏÏÏÏÏÏÏÏ $59,795 $59,845 2.08% $74,590 $74,716 2.69%
(1) Contractual maturity of asset-backed securities is not a reliable indicator of their expected life because borrowersgenerally have the right to repay their obligations at any time.
5. Debentures, Notes, and Bonds, Net
Borrowings Due Within One Year
Below is a summary of borrowings due within one year at December 31, 2002 and 2001, net ofunamortized discount and premium.
2002
MaximumOutstanding at Average Outstanding OutstandingDecember 31, During Year at Any
Amount Cost(1) Amount Cost(1) Month-end
(Dollars in millions)
Short-term notes ÏÏÏÏÏÏÏÏÏÏÏÏÏÏÏÏÏÏÏÏÏÏÏÏÏÏÏÏÏÏÏÏÏÏÏÏ $290,091 1.55% $252,857 1.98% $290,091
Other short-term debt ÏÏÏÏÏÏÏÏÏÏÏÏÏÏÏÏÏÏÏÏÏÏÏÏÏÏÏÏÏÏÏ 12,522 1.33 18,512 1.70 28,126
Current portion of borrowings due after one year(2):
Universal Standard Debt ÏÏÏÏÏÏÏÏÏÏÏÏÏÏÏÏÏÏÏÏÏÏÏÏÏÏÏ 41,681 2.25
Universal Benchmark Debt ÏÏÏÏÏÏÏÏÏÏÏÏÏÏÏÏÏÏÏÏÏÏÏÏÏ 37,376 4.89
Universal Retail DebtÏÏÏÏÏÏÏÏÏÏÏÏÏÏÏÏÏÏÏÏÏÏÏÏÏÏÏÏÏÏ 73 9.52
Other ÏÏÏÏÏÏÏÏÏÏÏÏÏÏÏÏÏÏÏÏÏÏÏÏÏÏÏÏÏÏÏÏÏÏÏÏÏÏÏÏÏÏÏ 669 3.24
Total due within one year ÏÏÏÏÏÏÏÏÏÏÏÏÏÏÏÏÏÏÏÏÏÏÏÏÏÏÏÏ $382,412 1.95%
122

FANNIE MAE
NOTES TO FINANCIAL STATEMENTS Ì (Continued)
2001
MaximumOutstanding at Average Outstanding OutstandingDecember 31, During Year at Any
Amount Cost(1) Amount Cost(1) Month-end
(Dollars in millions)
Short-term notes ÏÏÏÏÏÏÏÏÏÏÏÏÏÏÏÏÏÏÏÏÏÏÏÏÏÏÏÏÏÏÏÏÏÏÏÏ $256,905 2.58% $247,060 4.31% $265,953
Other short-term debt ÏÏÏÏÏÏÏÏÏÏÏÏÏÏÏÏÏÏÏÏÏÏÏÏÏÏÏÏÏÏÏ 29,891 1.96 31,479 4.40 43,811
Current portion of borrowings due after one year(2):
Universal Standard Debt ÏÏÏÏÏÏÏÏÏÏÏÏÏÏÏÏÏÏÏÏÏÏÏÏÏÏÏ 34,413 3.67
Universal Benchmark Debt ÏÏÏÏÏÏÏÏÏÏÏÏÏÏÏÏÏÏÏÏÏÏÏÏÏ 21,987 5.31
Universal Retail DebtÏÏÏÏÏÏÏÏÏÏÏÏÏÏÏÏÏÏÏÏÏÏÏÏÏÏÏÏÏÏ Ì Ì
Other ÏÏÏÏÏÏÏÏÏÏÏÏÏÏÏÏÏÏÏÏÏÏÏÏÏÏÏÏÏÏÏÏÏÏÏÏÏÏÏÏÏÏÏ 296 4.96
Total due within one year ÏÏÏÏÏÏÏÏÏÏÏÏÏÏÏÏÏÏÏÏÏÏÏÏÏÏÏÏ $343,492 2.81%
(1) Represents weighted-average cost, which includes the amortization of discounts, premiums, issuance costs, hedgingresults, and the eÅects of currency and debt swaps. Averages have been calculated on a monthly average basis.
(2) Information on average amount and cost of debt outstanding during the year and maximum amount outstanding atany month-end is not meaningful. See ""Borrowings Due After One Year'' for additional information.
Amounts payable for federal funds purchased and securities sold under agreements to repurchase were$9.1 billion and $6.0 billion at December 31, 2002 and 2001, respectively, and are included in the above tableunder the heading ""Other short-term debt.'' These amounts include both secured and unsecured debt.
123

FANNIE MAE
NOTES TO FINANCIAL STATEMENTS Ì (Continued)
Borrowings Due After One Year
Below is a summary of borrowings due after one year at December 31, 2002 and 2001, net of unamortizeddiscount and premium.
2002 2001
Maturity Amount Average Amount AverageDate Outstanding Cost(1) Outstanding Cost(1)
(Dollars in millions)
Senior debt:Universal Benchmark Debt, net of $796 of deferred
costs for 2002 ($886 for 2001) ÏÏÏÏÏÏÏÏÏÏÏÏÏÏÏÏÏ 2002-2030 $282,972 5.49% $246,458 5.88%Universal Standard Debt, net of $311 of deferred
costs for 2002 ($325 for 2001) ÏÏÏÏÏÏÏÏÏÏÏÏÏÏÏÏÏ 2002-2038 152,656 4.31 156,495 4.84Universal Retail Debt, net of $97 of deferred costs
for 2002 ($62 for 2001)ÏÏÏÏÏÏÏÏÏÏÏÏÏÏÏÏÏÏÏÏÏÏÏ 2002-2027 10,556 6.10 7,098 5.87Long-term other, net of $5,809 of deferred costs for
2002 ($6,998 for 2001) ÏÏÏÏÏÏÏÏÏÏÏÏÏÏÏÏÏÏÏÏÏÏÏ 2002-2032 3,681 7.71 3,383 7.23
449,865 5.12 413,434 5.50
Subordinated debt:Universal Benchmark Debt, net of $43 of deferred
costs for 2002 ($10 for 2001) ÏÏÏÏÏÏÏÏÏÏÏÏÏÏÏÏÏÏ 2002-2012 8,457 5.58 4,990 5.78Universal Standard Debt, net of $7 of deferred costs
for 2002 ($7 for 2001)ÏÏÏÏÏÏÏÏÏÏÏÏÏÏÏÏÏÏÏÏÏÏÏÏ 2002-2019 244 9.31 243 9.31Long-term other, net of $5,481 of deferred costs for
2002 ($5,655 for 2001) ÏÏÏÏÏÏÏÏÏÏÏÏÏÏÏÏÏÏÏÏÏÏÏ 2002-2019 1,269 10.01 1,160 9.97
9,970 6.23 6,393 6.67
Total senior and subordinated debtÏÏÏÏÏÏÏÏÏÏÏÏÏÏÏÏÏÏ 459,835 5.14% 419,827 5.52%Fair value adjustment for FAS 133(2) ÏÏÏÏÏÏÏÏÏÏÏÏÏÏÏ 8,889 1,423Adjustment for foreign currency translationÏÏÏÏÏÏÏÏÏÏÏ (154) (1,275)
Total due after one yearÏÏÏÏÏÏÏÏÏÏÏÏÏÏÏÏÏÏÏÏÏÏÏÏÏ $468,570 $419,975
(1) Represents weighted-average cost, which includes the amortization of discounts, premiums, issuance costs, hedgingresults, and the eÅects of currency and debt swaps. Averages have been calculated on a monthly average basis.
(2) Represents change in the fair value of hedged debt in fair value hedges.
We consolidated our outstanding debt agreements for various funding programs into one comprehensiveoÅering document, the Universal Debt Facility. This supersedes and replaces the Global Debt Facility,Medium-Term Notes, Short-Term Notes, and Debenture Programs.
Debentures, notes, and bonds at December 31, 2002 included $178 billion of callable debt. We canredeem this debt at our option any time on or after a speciÑed date in whole or in part. At December 31, 2002,our debentures, notes, and bonds were not subject to mandatory redemptions tied to certain indices or ratesafter an initial nonredemption period.
We have summarized in the following table the amounts, call periods, and maturity dates for our option-embedded Ñnancial instruments at December 31, 2002. These instruments include callable debt, callableswaps, and receive-Ñxed swaptions (excluding $9.9 billion of callable debt that was swapped to variable-rate
124

FANNIE MAE
NOTES TO FINANCIAL STATEMENTS Ì (Continued)
debt) as well as the notional amount of pay-Ñxed swaptions and caps. We also include universal debt that isredeemable at our option in the table.
Call Year of Amount AverageDate Maturity Outstanding Cost(1)
(Dollars in millions)
Callable debt, callable swaps and receive-Ñxed swaptions: Currently callable 2004-2020 $ 664 5.08%
2003 2003-2031 192,419 4.82
2004 2004-2022 75,191 5.95
2005 2007-2030 25,831 6.05
2006 2010-2031 22,384 6.25
2007 2011-2032 16,733 6.36
2008 and later 2012-2030 16,611 6.76
349,833 5.41%
Pay-Ñxed swaptions ÏÏÏÏÏÏÏÏÏÏÏÏÏÏÏÏÏÏÏÏÏÏÏÏÏÏÏÏÏÏÏÏÏÏ 129,225
Caps ÏÏÏÏÏÏÏÏÏÏÏÏÏÏÏÏÏÏÏÏÏÏÏÏÏÏÏÏÏÏÏÏÏÏÏÏÏÏÏÏÏÏÏÏÏÏ 122,393
Total option-embedded Ñnancial instrumentsÏÏÏÏÏÏÏÏÏÏÏÏÏ $601,451
(1) Averages have been calculated on a monthly average basis.
Listed below are the principal amounts of total debt payable as of December 31, 2002, for the years 2004-2008, assuming we pay oÅ callable debt at maturity and we redeem callable debt at the initial call date.
Assuming Callable DebtTotal Debt by Year Redeemed at Initial
of Maturity(1) Call Date(1)
(Dollars in millions)
2004 ÏÏÏÏÏÏÏÏÏÏÏÏÏÏÏÏÏÏÏÏÏÏÏÏÏÏÏÏÏÏÏÏÏÏÏÏÏÏÏÏÏÏÏÏÏÏÏÏÏÏÏÏÏÏÏÏÏÏ $105,232 $96,020
2005 ÏÏÏÏÏÏÏÏÏÏÏÏÏÏÏÏÏÏÏÏÏÏÏÏÏÏÏÏÏÏÏÏÏÏÏÏÏÏÏÏÏÏÏÏÏÏÏÏÏÏÏÏÏÏÏÏÏÏ 71,453 46,892
2006 ÏÏÏÏÏÏÏÏÏÏÏÏÏÏÏÏÏÏÏÏÏÏÏÏÏÏÏÏÏÏÏÏÏÏÏÏÏÏÏÏÏÏÏÏÏÏÏÏÏÏÏÏÏÏÏÏÏÏ 47,415 29,235
2007 ÏÏÏÏÏÏÏÏÏÏÏÏÏÏÏÏÏÏÏÏÏÏÏÏÏÏÏÏÏÏÏÏÏÏÏÏÏÏÏÏÏÏÏÏÏÏÏÏÏÏÏÏÏÏÏÏÏÏ 67,326 43,317
2008 ÏÏÏÏÏÏÏÏÏÏÏÏÏÏÏÏÏÏÏÏÏÏÏÏÏÏÏÏÏÏÏÏÏÏÏÏÏÏÏÏÏÏÏÏÏÏÏÏÏÏÏÏÏÏÏÏÏÏ 21,160 15,020
(1) Includes $9.9 billion of callable debt that was swapped to variable-rate debt.
We repurchased or called $182 billion of debt and swaps with an average cost of 5.36 percent in 2002,$183 billion of debt and swaps with an average cost of 6.23 percent in 2001, and $18 billion of debt and swapswith an average cost of 7.10 percent in 2000. We recorded losses of $710 million in 2002, losses of $524 millionin 2001, and gains of $49 million in 2000 on our debt extinguishments.
As part of our voluntary safety and soundness initiatives, we began issuing Subordinated BenchmarkNotes in the Ñrst quarter of 2001 on a periodic basis to create a new, liquid class of Ñxed-income assets forinvestors. We issued subordinated debt totaling $3.5 billion and $5.0 billion during 2002 and 2001,respectively. Outstanding Subordinated Benchmark Notes totaled $8.5 billion at December 31, 2002 versus$5.0 billion at the end of 2001. The total subordinated debt balance at December 31, 2002 and December 31,2001 includes other subordinated debt issuances that preceded this initiative.
Pursuant to Fannie Mae's Charter Act, the Secretary of the Treasury has the authority to approve FannieMae's issuance of debt obligations.
125

FANNIE MAE
NOTES TO FINANCIAL STATEMENTS Ì (Continued)
6. Income Taxes
The components of our federal income tax provision for the years ended December 31, 2002, 2001, and2000 were as follows:
2002 2001 2000
(Dollars in millions)
Current ÏÏÏÏÏÏÏÏÏÏÏÏÏÏÏÏÏÏÏÏÏÏÏÏÏÏÏÏÏÏÏÏÏÏÏÏÏÏÏÏÏÏÏÏÏÏÏÏÏÏÏÏÏÏÏÏÏÏÏÏÏ $ 3,055 $2,231 $1,422
Deferred ÏÏÏÏÏÏÏÏÏÏÏÏÏÏÏÏÏÏÏÏÏÏÏÏÏÏÏÏÏÏÏÏÏÏÏÏÏÏÏÏÏÏÏÏÏÏÏÏÏÏÏÏÏÏÏÏÏÏÏÏ (1,626) (190) 161
1,429 2,041 1,583
Tax expense of cumulative eÅect of change in accounting principleÏÏÏÏÏÏÏÏÏÏÏ Ì 90 Ì
Net federal income tax provisionÏÏÏÏÏÏÏÏÏÏÏÏÏÏÏÏÏÏÏÏÏÏÏÏÏÏÏÏÏÏÏÏÏÏÏÏÏÏÏÏ $ 1,429 $2,131 $1,583
The table above does not reÖect the tax eÅects of unrealized gains and losses on available-for-salesecurities and derivatives. We record the unrealized gains and losses on these items in AOCI, net of deferredtaxes. The tax expense associated with these items was a tax beneÑt of $2.5 billion in 2002 and $3.8 billion in2001, and a tax expense of $6 million in 2000.
The tax eÅects of temporary diÅerences between Ñnancial income and taxable income that gave rise tosigniÑcant portions of the deferred tax assets and deferred tax liabilities at December 31, 2002 and 2001consisted of the following:
2002 2001
(Dollars inmillions)
Deferred tax assets:
Derivatives in loss positions, netÏÏÏÏÏÏÏÏÏÏÏÏÏÏÏÏÏÏÏÏÏÏÏÏÏÏÏÏÏÏÏÏÏÏÏÏÏÏÏÏÏÏÏÏÏÏÏ $ 9,423 $3,679
Outstanding MBS and REMIC fees ÏÏÏÏÏÏÏÏÏÏÏÏÏÏÏÏÏÏÏÏÏÏÏÏÏÏÏÏÏÏÏÏÏÏÏÏÏÏÏÏÏÏÏ 1,337 915
Allowance for loan losses and guaranty liability for MBSÏÏÏÏÏÏÏÏÏÏÏÏÏÏÏÏÏÏÏÏÏÏÏÏÏÏ 325 314
Other items, net ÏÏÏÏÏÏÏÏÏÏÏÏÏÏÏÏÏÏÏÏÏÏÏÏÏÏÏÏÏÏÏÏÏÏÏÏÏÏÏÏÏÏÏÏÏÏÏÏÏÏÏÏÏÏÏÏÏÏÏÏ 160 143
Deferred tax assetsÏÏÏÏÏÏÏÏÏÏÏÏÏÏÏÏÏÏÏÏÏÏÏÏÏÏÏÏÏÏÏÏÏÏÏÏÏÏÏÏÏÏÏÏÏÏÏÏÏÏÏÏÏÏÏÏ 11,245 5,051
Deferred tax liabilities:
Unrealized gains on available-for-sale securitiesÏÏÏÏÏÏÏÏÏÏÏÏÏÏÏÏÏÏÏÏÏÏÏÏÏÏÏÏÏÏÏÏÏÏ 2,401 158
Debt-related expenses ÏÏÏÏÏÏÏÏÏÏÏÏÏÏÏÏÏÏÏÏÏÏÏÏÏÏÏÏÏÏÏÏÏÏÏÏÏÏÏÏÏÏÏÏÏÏÏÏÏÏÏÏÏÏÏ 446 536
BeneÑts from tax-advantaged investmentsÏÏÏÏÏÏÏÏÏÏÏÏÏÏÏÏÏÏÏÏÏÏÏÏÏÏÏÏÏÏÏÏÏÏÏÏÏÏÏ 214 125
Purchase discount and deferred fees ÏÏÏÏÏÏÏÏÏÏÏÏÏÏÏÏÏÏÏÏÏÏÏÏÏÏÏÏÏÏÏÏÏÏÏÏÏÏÏÏÏÏÏ 42 356
Other items, net ÏÏÏÏÏÏÏÏÏÏÏÏÏÏÏÏÏÏÏÏÏÏÏÏÏÏÏÏÏÏÏÏÏÏÏÏÏÏÏÏÏÏÏÏÏÏÏÏÏÏÏÏÏÏÏÏÏÏÏÏ 89 57
Deferred tax liabilities ÏÏÏÏÏÏÏÏÏÏÏÏÏÏÏÏÏÏÏÏÏÏÏÏÏÏÏÏÏÏÏÏÏÏÏÏÏÏÏÏÏÏÏÏÏÏÏÏÏÏÏÏÏ 3,192 1,232
Net deferred tax asset ÏÏÏÏÏÏÏÏÏÏÏÏÏÏÏÏÏÏÏÏÏÏÏÏÏÏÏÏÏÏÏÏÏÏÏÏÏÏÏÏÏÏÏÏÏÏÏÏÏÏÏÏÏÏÏÏÏ $ 8,053 $3,819
We anticipate it is more likely than not that the results of future operations will generate suÇcient taxableincome to realize the entire balance of deferred tax assets.
126

FANNIE MAE
NOTES TO FINANCIAL STATEMENTS Ì (Continued)
Our eÅective tax rates diÅered from statutory federal tax rates for the years ended December 31, 2002,2001, and 2000 as follows:
2002 2001 2000
Statutory corporate tax rateÏÏÏÏÏÏÏÏÏÏÏÏÏÏÏÏÏÏÏÏÏÏÏÏÏÏÏÏÏÏÏÏÏÏÏÏÏÏÏÏÏÏÏÏÏÏÏÏÏÏÏ 35% 35% 35%
Tax-exempt interest and dividends received deductionsÏÏÏÏÏÏÏÏÏÏÏÏÏÏÏÏÏÏÏÏÏÏÏÏÏÏÏÏ (5) (4) (5)
Equity investments in aÅordable housing projects ÏÏÏÏÏÏÏÏÏÏÏÏÏÏÏÏÏÏÏÏÏÏÏÏÏÏÏÏÏÏÏÏ (6) (4) (4)
EÅective tax rateÏÏÏÏÏÏÏÏÏÏÏÏÏÏÏÏÏÏÏÏÏÏÏÏÏÏÏÏÏÏÏÏÏÏÏÏÏÏÏÏÏÏÏÏÏÏÏÏÏÏÏÏÏÏÏÏÏÏÏÏ 24% 27% 26%
We are exempt from state and local taxes, except for real estate taxes.
7. Earnings per Common Share
The following table sets forth the computation of basic and diluted earnings per common share.
Year Ended December 31,
2002 2001 2000
Basic Diluted Basic Diluted Basic Diluted
(Dollars and shares in millions, except per share amounts)
Net income before cumulative eÅect of change inaccounting principle ÏÏÏÏÏÏÏÏÏÏÏÏÏÏÏÏÏÏÏÏÏÏÏÏÏÏÏÏÏÏÏ $4,619 $4,619 $5,726 $5,726 $4,448 $4,448
Cumulative eÅect of change in accounting principle ÏÏÏÏÏÏ Ì Ì 168 168 Ì Ì
Preferred stock dividendÏÏÏÏÏÏÏÏÏÏÏÏÏÏÏÏÏÏÏÏÏÏÏÏÏÏÏÏÏÏ (99) (99) (138) (138) (121) (121)
Net income available to common stockholders ÏÏÏÏÏÏÏÏÏÏÏ $4,520 $4,520 $5,756 $5,756 $4,327 $4,327
Weighted average common shares ÏÏÏÏÏÏÏÏÏÏÏÏÏÏÏÏÏÏÏÏÏ 992 992 1,000 1,000 1,003 1,003
Dilutive potential common shares(1) ÏÏÏÏÏÏÏÏÏÏÏÏÏÏÏÏÏÏÏÏ Ì 5 Ì 6 Ì 6
Average number of common shares outstanding used tocalculate earnings per common shareÏÏÏÏÏÏÏÏÏÏÏÏÏÏÏÏÏ 992 997 1,000 1,006 1,003 1,009
Earnings per common share before cumulative eÅect ofchange in accounting principle ÏÏÏÏÏÏÏÏÏÏÏÏÏÏÏÏÏÏÏÏÏÏ $ 4.56 $ 4.53 $ 5.58 $ 5.55 $ 4.31 $ 4.29
Cumulative eÅect of change in accounting principle ÏÏÏÏÏÏ Ì Ì .17 .17 Ì Ì
Net earnings per common share ÏÏÏÏÏÏÏÏÏÏÏÏÏÏÏÏÏÏÏÏÏÏÏ $ 4.56 $ 4.53 $ 5.75 $ 5.72 $ 4.31 $ 4.29
(1) Dilutive potential common shares consist primarily of the dilutive eÅect from employee stock options and other stockcompensation plans.
For additional disclosures regarding our stock compensation plans and outstanding preferred stock, referto Notes 8 and 12, respectively.
8. Stock-Based Compensation Plans
Employee Stock Purchase Plan
We have an Employee Stock Purchase Plan that allows us to issue up to 41 million shares of commonstock to qualiÑed employees at a price equal to 85 percent of the fair market value of the stock on the grantdate. This plan meets the deÑnition of a noncompensatory plan under APB 25; therefore, we did not recognizeany compensation expense for grants under the plan. Employees have the option of either receiving cash orshares through a Cashless Exercise Program or purchasing shares directly. In 2002, we granted each qualiÑedemployee, excluding certain oÇcers and other highly compensated employees, the right to purchase up to310 shares of common stock at $68.46 per share in January 2003. Under the 2002 oÅering, qualiÑed employees
127

FANNIE MAE
NOTES TO FINANCIAL STATEMENTS Ì (Continued)
purchased 5,580 shares at $68.46 per share, compared with purchasing 1,274,396 common shares at $66.00 pershare under the 2001 oÅering.
Employee Stock Ownership Plan
We have an Employee Stock Ownership Plan (ESOP) for qualiÑed employees who are regularlyscheduled to work at least 1,000 hours in a calendar year. Participation is not open to participants in theExecutive Pension Plan. We may contribute to the ESOP each year an amount based on achievement ofdeÑned corporate earnings goals, not to exceed 4 percent of the aggregate eligible salary for all participants.The Board of Directors determines the contribution percentage annually. We may contribute either shares ofFannie Mae common stock or cash to purchase Fannie Mae common stock. Such contributions are recordedas a current period expense. Unless employees elect to receive cash, ESOP dividends are automaticallyreinvested in Fannie Mae stock within the ESOP. Dividends are accrued four times a year and paid, pursuantto employees' elections, once a year in February for the four previous quarters. ESOP shares are included asoutstanding for purposes of our EPS calculations. Vested beneÑts are based on years of service. Eligibleemployees are 100 percent vested in their ESOP accounts either upon attainment of age 65 or more than Ñveyears of service. Employees who are at least 55 years of age, and have at least 10 years of participation in theESOP, may qualify to diversify vested ESOP shares into the same types of funds available under theRetirement Savings Plan without losing the tax deferred status of the value of the ESOP. Expense recorded in2002, 2001, and 2000 in connection with the ESOP was $7.6 million, $6.5 million, and $6.0 million,respectively. At December 31, 2002, 2001, and 2000, allocated shares held by the ESOP were 1,450,973common shares, 1,396,610 common shares, and 1,358,486 common shares, respectively, and committed-to-be-released shares held by the ESOP were 115,127 common shares, 80,459 common shares, and 66,495common shares, respectively. At December 31, 2002, 2001, and 2000, the ESOP shares held in suspense were2,105 common shares, 729 common shares, and 7,684 common shares, respectively. The fair value ofunearned ESOP shares was $1.4 million, $1.7 million, and $1.8 million at December 31, 2002, 2001, and 2000,respectively.
Performance Shares
Fannie Mae's Stock Compensation Plan of 1993 authorizes eligible employees to receive performanceawards. We generally issue awards with a performance period that can range from three to Ñve years. Theperformance shares become actual awards only if we attain our goals set for the award period. At the end ofthe award period, we pay out common stock in either two or three installments over a period not longer thanthree years. For the 2003-2005, 2002-2004, and 2001-2003 performance periods, there were 466,216 commonshares, 505,588 common shares, and 449,520 common shares, respectively, from outstanding contingentgrants.
NonqualiÑed Stock Options
Fannie Mae may grant stock options to eligible employees and nonmanagement members of the Board ofDirectors. Employees cannot generally exercise them until at least one year after the grant date. Nonmanage-ment directors can exercise them on the grant date. The stock options generally expire ten years from the grantdate for both groups. The exercise price of the common stock covered by each option is equal to the fair valueof the stock on the date we grant the option. Thus, we have not recorded compensation expense for grantsunder this plan under APB 25.
Under the Stock Compensation Plan of 1993, our Board of Directors approved the EPS ChallengeOption Grant in January 2000 for all regular full-time and part-time employees. At that time, all employees,other than management group employees, received an option grant of 350 shares at a price of $62.50 per share,the fair market value of the stock on the grant date. Management group employees received option grants
128

FANNIE MAE
NOTES TO FINANCIAL STATEMENTS Ì (Continued)
equivalent to a percentage of their November 1999 stock grants. We tied vesting for options granted to theachievement of a core business diluted earnings per share (EPS) goal of $6.46 by the end of 2003. Corebusiness earnings is a non-GAAP performance measure developed by management that ratably allocates thecost of purchased options over the period they are held instead of recognizing unrealized gains and losses onpurchased options in earnings. Core business diluted EPS reÖects net income less the after-tax unrealized gainor loss on purchased options plus the after-tax purchased options amortization expense. If our core businessdiluted EPS for 2003 is $6.46 or greater, then 100 percent of the EPS Challenge options will vest in January2004. If we do not reach a core business diluted EPS of $6.46 by the end of 2003, we delay vesting one yearand then vesting begins at a rate of 25 percent per year. The Board of Directors has discretion to oÅset futureoption grants or other forms of compensation if the core business diluted EPS goal is not reached. Theseoptions expire January 18, 2010.
The following table summarizes our nonqualiÑed stock option activity for the years 2000-2002.
2002 2001 2000
Weighted- Weighted- Weighted- Weighted- Weighted- Weighted-Average Average Average Average Average AverageExercise Fair Value Exercise Fair Value Exercise Fair Value
Options Price at Grant Date Options Price at Grant Date Options Price at Grant Date
(Options in thousands)
Balance, January 1, ÏÏ 26,234 $57.06 $19.22 25,310 $50.86 $16.90 22,349 $40.90 $12.81
Granted ÏÏÏÏÏÏÏÏÏÏÏÏ 865 78.38 26.23 4,173 80.37 28.07 7,741 66.79 24.11
ExercisedÏÏÏÏÏÏÏÏÏÏÏ (1,484) 29.58 9.37 (2,611) 31.92 9.90 (4,003) 23.88 7.31
Forfeited ÏÏÏÏÏÏÏÏÏÏÏ (484) 70.61 24.47 (638) 66.93 23.12 (777) 61.98 20.42
Balance,December 31, ÏÏÏÏÏ 25,131 $59.16 $22.76 26,234 $57.05 $19.22 25,310 $50.86 $16.90
Options vested,December 31, ÏÏÏÏÏ 15,619 $51.48 $16.71 13,919 $44.10 $13.92 13,551 $36.83 $11.36
The following table summarizes information about our nonqualiÑed stock options outstanding atDecember 31, 2002.
Options OutstandingOptions ExercisableWeighted-Average
Number of Remaining Weighted-Average Number of Weighted-AverageRange of Exercise Prices Options(1) Contractual Life Exercise Price Options(1) Exercise Price
$18.00 Ó $35.00 ÏÏÏÏÏÏÏÏÏÏÏ 4,444 1.5 yrs. $22.96 4,444 $22.96
35.01 Ó 53.00 ÏÏÏÏÏÏÏÏÏÏÏ 4,010 4.6 46.14 3,827 45.82
53.01 Ó 70.00 ÏÏÏÏÏÏÏÏÏÏÏ 6,717 6.5 64.06 3,140 66.48
70.01 Ó 87.00 ÏÏÏÏÏÏÏÏÏÏÏ 9,960 8.1 77.25 4,208 75.56
TotalÏÏÏÏÏÏÏÏÏÏÏÏÏÏÏÏÏÏÏÏ 25,131 6.1 yrs. $59.16 15,619 $51.48
(1) Options in thousands.
Restricted Stock
In 2002, we awarded, issued, and placed in escrow 85,927 shares of restricted stock under the StockCompensation Plan of 1993 (117,447 shares in 2001). We released 106,062 shares in 2002 as awards vested(105,560 shares in 2001).
129

FANNIE MAE
NOTES TO FINANCIAL STATEMENTS Ì (Continued)
Options Available for Future Issuance
At December 31, 2002, 4,727,809 and 11,569,275 shares remained available for grant under theEmployee Stock Purchase Plan and the Stock Compensation Plan of 1993, respectively. The StockCompensation Plan of 1993 expires in May 2003, at which time we will ask shareholders to approve a newplan.
9. Employee Retirement BeneÑts
Retirement Savings Plan
All regular employees of Fannie Mae scheduled to work 1,000 hours or more in a calendar year areeligible to participate in our Retirement Savings Plan, which includes a 401(k) option. In 2002, employeescould contribute up to the lower of 25 percent of their base salary or the current annual dollar cap establishedand revised annually by the Internal Revenue Service. Fannie Mae matches employee contributions up to3 percent of base salary in cash. Under the plan, employees may allocate investment balances to a variety ofinvestment options. As of December 31, 2002, there was no option to invest directly in stock of Fannie Mae.Expense recorded in 2002, 2001, and 2000 in connection with the Retirement Savings Plan was $10.8 million,$9.3 million, and $8.5 million, respectively.
Postretirement BeneÑt Plans
All regular employees of Fannie Mae scheduled to work 1,000 hours or more in a calendar year arecovered by a noncontributory corporate retirement plan or by the contributory Civil Service Retirement Law.BeneÑts payable under the corporate plan are based on years of service and compensation using the averagepay during the 36 consecutive highest-paid months of the last 120 months of employment. Our policy is tocontribute an amount no less than the minimum required employer contribution under the EmployeeRetirement Income Security Act of 1974. We contribute to the corporate plan in cash based on beneÑtsattributed to employees' service to date and compensation expected to be paid in the future. A contribution of$41 million was made to the corporate plan in 2002. Corporate plan assets consist primarily of listed stocks,Ñxed-income securities, and other liquid assets. Plan assets do not directly include any shares of Fannie Maestock.
At December 31, 2002 and 2001, the projected beneÑt obligations for services rendered were $391 millionand $319 million, respectively, while the plan assets were $234 million and $237 million, respectively. AtDecember 31, 2002 and 2001, the pension liability (included on the balance sheet under ""Other liabilities'')was $51 million and $65 million, respectively. Net periodic pension costs were $27 million, $14 million, and$5 million for the years ended December 31, 2002, 2001, and 2000, respectively. We use the straight-linemethod of amortization for prior service costs.
The assumptions we used to determine the net periodic pension costs and projected beneÑt obligationswere as follows:
2002 2001 2000
Discount rate used to determine pension expenseÏÏÏÏÏÏÏÏÏÏÏÏÏÏÏÏÏÏÏÏÏÏÏÏÏÏÏÏÏÏÏÏÏÏÏÏÏÏÏ 7.25% 7.75% 8.00%
Discount rate used to determine projected beneÑt obligation at year-end ÏÏÏÏÏÏÏÏÏÏÏÏÏÏÏÏÏÏÏ 6.75 7.25 7.75
Average rate of increase in future compensation levels ÏÏÏÏÏÏÏÏÏÏÏÏÏÏÏÏÏÏÏÏÏÏÏÏÏÏÏÏÏÏÏÏÏÏ 6.50 6.50 6.50
Expected long-term weighted average return on plan assets ÏÏÏÏÏÏÏÏÏÏÏÏÏÏÏÏÏÏÏÏÏÏÏÏÏÏÏÏÏÏ 8.50 9.50 9.00
Fannie Mae also has an Executive Pension Plan, Supplemental Pension Plan, and a bonus-basedSupplemental Pension Plan, which supplement the beneÑts payable under the retirement plan. We fundaccrued beneÑts under the Executive Pension Plan through a Rabbi trust. We accrue estimated beneÑts underthe supplementary plans as an expense over the period of employment.
130
FANNIE MAE
NOTES TO FINANCIAL STATEMENTS Ì (Continued)
We sponsor a post-retirement Health Care Plan that covers substantially all full-time employees. Theplan pays stated percentages of most necessary medical expenses incurred by retirees, after subtractingpayments by Medicare or other providers and after meeting a stated deductible. Participants become eligiblefor the subsidized beneÑts as follows: (1) for employees hired prior to January 1, 1998, if they retire fromFannie Mae after reaching age 55 with Ñve or more years of service; or (2) for employees hired January 1,1998, or later, if they retire from Fannie Mae after reaching age 55 with ten or more years of service.Employees hired January 1, 1998 or later who retire with less than ten years of service may purchase coverageby paying the full premium. The plan is contributory, with retiree contributions adjusted annually. We chargethe expected cost of these beneÑts to expense during the years that the employees render service and we payall beneÑts out of our general assets. We base cost-sharing percentages on length of service with Fannie Mae,eligibility for and date of retirement, and a deÑned dollar beneÑt cap.
Our accrued post-retirement health care cost liability for the years ended December 31, 2002 and 2001was $65 million and $52 million, respectively. The net post-retirement health care costs were $15 million,$9 million, and $8 million for the years ended December 31, 2002, 2001, and 2000, respectively. Indetermining the net post-retirement health care cost for 2002, we assumed a 13.50 percent annual rate ofincrease in the per capita cost of covered health care claims with the rate decreasing over the next Ñve years to4.50 percent and remaining at that level thereafter. In determining the net post-retirement health care cost for2001, we assumed a 4.75 percent annual rate of increase in the per capita cost of covered health care claimswith the rate decreasing gradually over the next year to 4.50 percent and remaining at that level thereafter. Indetermining the net post-retirement health care cost for 2000, we assumed a 5.00 percent annual rate ofincrease in the per capita cost of covered health care claims with the rate decreasing gradually over the nexttwo years to 4.50 percent and remaining at that level thereafter. The health care cost trend rate assumption hasa signiÑcant eÅect on the amounts reported. To illustrate, increasing the assumed health care cost trend ratesby one percentage point in each year would increase the accumulated post-retirement beneÑt obligation as ofDecember 31, 2002 by $5 million and the aggregate of the service and interest cost components of net post-retirement health care cost for the year by $1 million. Decreasing the assumed health care cost trend rates byone percentage point in each year would decrease the accumulated post-retirement beneÑt obligation as ofDecember 31, 2002 by $12 million and the aggregate of the service and interest cost components of net post-retirement health care cost for the year by $2 million.
The weighted-average discount rates we used to determine the health care cost and the year-endaccumulated post-retirement beneÑt obligation were 6.75 percent at December 31, 2002, 7.25 percent atDecember 31, 2001, and 7.75 percent at December 31, 2000.
10. Line of Business Reporting
We have two lines of business that generate revenue. These business lines also focus on managing our keybusiness risks. We measure the results of our lines of business based on core business earnings. We evaluatethe results of our business lines as though each were a stand-alone business. Hence, we allocate certain incomeand expenses to each line of business for purposes of business segment reporting. We eliminate certain inter-segment allocations in our consolidated core business earnings results.
Portfolio Investment Business: The Portfolio Investment business has two principal components: amortgage investment portfolio and a liquid investment portfolio. The mortgage investment portfolio purchasesmortgage loans, mortgage-related securities, and other investments from lenders, securities dealers, and othermarket participants. The LIP serves as an alternative source of funds to meet our cash Öow needs by investingin high quality, short-term and medium-term investments that provide an ongoing supply of funds that can beused as necessary for liquidity or reinvestment, or readily marketable, high credit quality securities that can besold to raise cash. We fund the purchase of the assets in our Portfolio Investment business by issuing debt inthe global capital markets. The Portfolio Investment business generates proÑts by ensuring that the interest
131

FANNIE MAE
NOTES TO FINANCIAL STATEMENTS Ì (Continued)
income from the mortgages, MBS, mortgage-related securities, and liquid investments we purchase is greaterthan our borrowing costs. A primary measure of proÑtability for the Portfolio Investment business is our netinterest margin. Our net interest margin reÖects the diÅerence between taxable-equivalent income on ourmortgage assets and non-mortgage investments and our borrowing expense, divided by average interest earningassets.
Our Portfolio Investment business focuses on managing Fannie Mae's interest rate risk. Interest rate riskis the risk that changes in interest rates could change cash Öows on our mortgage assets and debt in a way thatadversely aÅects Fannie Mae's earnings or long-term value.
Credit Guaranty Business: Our Credit Guaranty business has primary responsibility for managing all ofour mortgage credit risk. Credit risk is the risk of loss to future earnings and future cash Öows that may resultfrom the failure of a borrower or counterparty to fulÑll their contractual obligation to Fannie Mae. The CreditGuaranty business primarily generates income from guaranty fees for guaranteeing the timely payment ofscheduled principal and interest on mortgage-related securities we guarantee that are not owned by thePortfolio Investment business. The primary source of income for the Credit Guaranty business is thediÅerence between the guaranty fees earned and the costs of providing this service. Income is also allocated tothe Credit Guaranty business for the following activities:
‚ Managing the credit risk on mortgage-related assets held by the Portfolio Investment business.
‚ Providing capital to the Portfolio Investment business.
‚ Temporarily investing principal and interest payments on loans underlying MBS prior to remittance toinvestors.
Our Credit Guaranty business manages Fannie Mae's mortgage credit risk by managing the proÑle andquality of mortgages in the mortgage credit book of business, using credit enhancements to reduce our losses,assessing the sensitivity of credit losses to changes in economic conditions, and aggressively managing problemassets to mitigate losses.
We assign actual direct revenues and expenses among our two lines of business. We use estimates toapportion overhead and other corporate items. For example, we allocate administrative expenses as directexpenses for the line of business. If we cannot allocate expenses to a particular business, we base the allocationon revenues, proÑts, or volumes as applicable. We allocate capital to the lines of business through anassessment of the interest rate risk and credit risk associated with each business.
Core Business Earnings: The diÅerence between core business earnings and reported net income relatesto the FAS 133 accounting treatment for purchased options. Core business earnings does not exclude anyother accounting eÅects related to the application of FAS 133 or any other non-FAS 133 related adjustments.The guaranty fee income that we allocate to the Credit Guaranty business for managing the credit risk onmortgage-related assets held by the Portfolio Investment business is oÅset by a corresponding guaranty feeexpense allocation to the Portfolio Investment business in our line of business results. Thus, there is noreconciling adjustment between our total line of business guaranty fee income and our reported guaranty feeincome. We allocate transaction fees received for structuring and facilitating securities transactions for ourcustomers primarily to our Portfolio Investment business. We allocate technology-related fees received forproviding Desktop Underwriter and other on-line services and fees received for providing credit enhancementalternatives to our customers primarily to our Credit Guaranty business.
132

FANNIE MAE
NOTES TO FINANCIAL STATEMENTS Ì (Continued)
The following table shows our line of business results for the years ended December 31, 2002, 2001, and2000, and reconciles total core business earnings to reported GAAP results.
2002(a)
ReconcilingTotal Core Items Related
Portfolio Credit Business to Purchased ReportedInvestment Guaranty Earnings Options Results
Dollars in millions
Net interest income ÏÏÏÏÏÏÏÏÏÏÏÏÏÏÏÏÏÏÏÏÏÏÏÏÏÏÏÏÏ $ 9,869 $ 697 $10,566 $ Ì $10,566
Purchased options amortization expense ÏÏÏÏÏÏÏÏÏÏÏÏ (1,814) Ì (1,814) 1,814 (c) Ì
Core net interest income ÏÏÏÏÏÏÏÏÏÏÏÏÏÏÏÏÏÏÏÏÏÏÏÏÏ 8,055 697 8,752 1,814 10,566
Guaranty fee income (expense) ÏÏÏÏÏÏÏÏÏÏÏÏÏÏÏÏÏÏÏ (1,374) 3,190 1,816 Ì 1,816
Fee and other income (expense), net ÏÏÏÏÏÏÏÏÏÏÏÏÏÏ 348 (116) 232 Ì 232
Credit-related expenses(b) ÏÏÏÏÏÏÏÏÏÏÏÏÏÏÏÏÏÏÏÏÏÏÏÏ Ì (92) (92) Ì (92)
Administrative expenses ÏÏÏÏÏÏÏÏÏÏÏÏÏÏÏÏÏÏÏÏÏÏÏÏÏ (357) (862) (1,219) Ì (1,219)
Purchased options expense under FAS 133ÏÏÏÏÏÏÏÏÏÏ Ì Ì Ì (4,545)(d) (4,545)
Debt extinguishments, netÏÏÏÏÏÏÏÏÏÏÏÏÏÏÏÏÏÏÏÏÏÏÏÏ (710) Ì (710) Ì (710)
Income before federal income taxesÏÏÏÏÏÏÏÏÏÏÏÏÏÏÏÏ 5,962 2,817 8,779 (2,731) 6,048
Provision for federal income taxes ÏÏÏÏÏÏÏÏÏÏÏÏÏÏÏÏÏ (1,747) (638) (2,385) 956 (f) (1,429)
Net income ÏÏÏÏÏÏÏÏÏÏÏÏÏÏÏÏÏÏÏÏÏÏÏÏÏÏÏÏÏÏÏÏÏÏ $ 4,215 $2,179 $ 6,394 $(1,775) $ 4,619
2001(a)
ReconcilingTotal Core Items Related
Portfolio Credit Business to Purchased ReportedInvestment Guaranty Earnings Options Results
Dollars in millions
Net interest income ÏÏÏÏÏÏÏÏÏÏÏÏÏÏÏÏÏÏÏÏÏÏÏÏÏÏÏÏÏ $ 7,369 $ 721 $ 8,090 $ Ì $ 8,090
Purchased options amortization expense ÏÏÏÏÏÏÏÏÏÏÏÏ (590) Ì (590) 590 (c) Ì
Core net interest income ÏÏÏÏÏÏÏÏÏÏÏÏÏÏÏÏÏÏÏÏÏÏÏÏÏ 6,779 721 7,500 590 8,090
Guaranty fee income (expense) ÏÏÏÏÏÏÏÏÏÏÏÏÏÏÏÏÏÏÏ (1,109) 2,591 1,482 Ì 1,482
Fee and other income (expense), net ÏÏÏÏÏÏÏÏÏÏÏÏÏÏ 211 (60) 151 Ì 151
Credit-related expenses(b) ÏÏÏÏÏÏÏÏÏÏÏÏÏÏÏÏÏÏÏÏÏÏÏÏ Ì (78) (78) Ì (78)
Administrative expenses ÏÏÏÏÏÏÏÏÏÏÏÏÏÏÏÏÏÏÏÏÏÏÏÏÏ (302) (715) (1,017) Ì (1,017)
Special contribution ÏÏÏÏÏÏÏÏÏÏÏÏÏÏÏÏÏÏÏÏÏÏÏÏÏÏÏÏÏ (192) (108) (300) Ì (300)
Purchased options expense under FAS 133ÏÏÏÏÏÏÏÏÏÏ Ì Ì Ì (37)(d) (37)
Debt extinguishments, netÏÏÏÏÏÏÏÏÏÏÏÏÏÏÏÏÏÏÏÏÏÏÏÏ (524) Ì (524) Ì (524)
Income before federal income taxes and eÅect ofaccounting change ÏÏÏÏÏÏÏÏÏÏÏÏÏÏÏÏÏÏÏÏÏÏÏÏÏÏÏÏ 4,863 2,351 7,214 553 7,767
Cumulative eÅect of accounting change ÏÏÏÏÏÏÏÏÏÏÏÏ Ì Ì Ì 168 (e) 168
Provision for federal income taxes ÏÏÏÏÏÏÏÏÏÏÏÏÏÏÏÏÏ (1,374) (473) (1,847) (194)(f) (2,041)
Net income ÏÏÏÏÏÏÏÏÏÏÏÏÏÏÏÏÏÏÏÏÏÏÏÏÏÏÏÏÏÏÏÏÏÏ $ 3,489 $1,878 $ 5,367 $ 527 $ 5,894
133

FANNIE MAE
NOTES TO FINANCIAL STATEMENTS Ì (Continued)
2000
ReconcilingTotal Core Items Related
Portfolio Credit Business to Purchased ReportedInvestment Guaranty Earnings Options Results
Dollars in millions
Net interest income ÏÏÏÏÏÏÏÏÏÏÏÏÏÏÏÏÏÏÏÏÏÏÏÏÏÏÏÏÏ $ 5,055 $ 619 $ 5,674 $Ì $ 5,674
Purchased options amortization expense ÏÏÏÏÏÏÏÏÏÏÏÏ Ì Ì Ì Ì Ì
Core net interest income ÏÏÏÏÏÏÏÏÏÏÏÏÏÏÏÏÏÏÏÏÏÏÏÏÏ 5,055 619 5,674 Ì 5,674
Guaranty fee income (expense) ÏÏÏÏÏÏÏÏÏÏÏÏÏÏÏÏÏÏÏ (1,079) 2,430 1,351 Ì 1,351
Fee and other income (expense), net ÏÏÏÏÏÏÏÏÏÏÏÏÏÏ 27 (71) (44) Ì (44)
Credit-related expenses(b) ÏÏÏÏÏÏÏÏÏÏÏÏÏÏÏÏÏÏÏÏÏÏÏÏ Ì (94) (94) Ì (94)
Administrative expenses ÏÏÏÏÏÏÏÏÏÏÏÏÏÏÏÏÏÏÏÏÏÏÏÏÏ (254) (651) (905) Ì (905)
Debt extinguishments, netÏÏÏÏÏÏÏÏÏÏÏÏÏÏÏÏÏÏÏÏÏÏÏÏ 49 Ì 49 Ì 49
Income before federal income taxesÏÏÏÏÏÏÏÏÏÏÏÏÏÏÏÏ 3,798 2,233 6,031 Ì 6,031
Provision for federal income taxes ÏÏÏÏÏÏÏÏÏÏÏÏÏÏÏÏÏ (1,053) (530) (1,583) Ì (1,583)
Net income ÏÏÏÏÏÏÏÏÏÏÏÏÏÏÏÏÏÏÏÏÏÏÏÏÏÏÏÏÏÏÏÏÏÏ $ 2,745 $1,703 $ 4,448 $Ì $ 4,448
(a) Reported net income for 2002 and 2001 includes the eÅect of FAS 133, which was adopted on January 1, 2001.
(b) Credit-related expenses includes the income statement line items ""Provision for losses'' and ""Foreclosed propertyincome.''
(c) This amount represents the straight-line amortization of purchased options expense that we allocate to interestexpense over the original expected life of the options. We include this amount in core business earnings instead ofrecording the unrealized gains and losses on purchased options to make it consistent with the accounting for theembedded options in our callable debt and the vast majority of our mortgages.
(d) This amount, which is recorded in our income statement under purchased options expense, represents unrealizedgains and losses on purchased options recorded in accordance with FAS 133. We exclude this amount from our corebusiness earnings measure because it does not reÖect our strategy to hold options to maturity or exercise date and it isnot our strategy to realize the period-to-period Öuctuations in the value of options.
(e) This non-recurring amount represents the one-time transition recorded upon the adoption of FAS 133 on January 1,2001. We exclude the transition gain from core business earnings because it relates to unrealized gains on purchasedoptions that were recorded when we adopted FAS 133.
(f) This amount represents the net federal income tax eÅect of core business earnings adjustments based on theapplicable federal income tax rate of 35 percent.
The Portfolio Investment business represented $869 billion, or 98 percent of total assets, at December 31,2002 and $785 billion, or 98 percent of total assets, at December 31, 2001.
11. Dividend Restrictions and Regulatory Capital Ratios
Our ability to pay dividends may be subject to certain statutory restrictions. We would need approval bythe Director of OFHEO for any dividend payment that would cause our capital to fall below speciÑed capitallevels. We have exceeded the applicable capital standard since the adoption of these restrictions in 1992;therefore, we have been making dividend payments without the need for director approval. The capitaladequacy standard requires that our core capital equal or exceed a minimum capital standard and a criticalcapital standard.
OFHEO published regulations under the Federal Housing Enterprises Financial Safety and SoundnessAct of 1992 in September 2001, as amended on March 15, 2002, establishing a risk-based capital test todetermine the amount of total capital we must hold under the risk-based capital standard on a quarterly basis.The risk-based capital standard was implemented by OFHEO on September 13, 2002.
134

FANNIE MAE
NOTES TO FINANCIAL STATEMENTS Ì (Continued)
The following table shows how our capital at December 31, 2002 and 2001 compared with theserequirements.
2002 2001
(Dollars in millions)
Core capital(1)ÏÏÏÏÏÏÏÏÏÏÏÏÏÏÏÏÏÏÏÏÏÏÏÏÏÏÏÏÏÏÏÏÏÏÏÏÏÏÏÏÏÏÏÏÏÏÏÏÏÏÏÏÏÏÏÏÏÏÏÏÏÏÏÏÏÏÏÏÏÏ $28,079 $25,182
Required minimum capital(2)(5) ÏÏÏÏÏÏÏÏÏÏÏÏÏÏÏÏÏÏÏÏÏÏÏÏÏÏÏÏÏÏÏÏÏÏÏÏÏÏÏÏÏÏÏÏÏÏÏÏÏÏÏÏÏÏÏ 27,203 24,182
Excess of core capital over minimum capital(5) ÏÏÏÏÏÏÏÏÏÏÏÏÏÏÏÏÏÏÏÏÏÏÏÏÏÏÏÏÏÏÏÏÏÏÏÏÏÏÏÏÏÏ $ 877 $ 1,000
Total capital(3) ÏÏÏÏÏÏÏÏÏÏÏÏÏÏÏÏÏÏÏÏÏÏÏÏÏÏÏÏÏÏÏÏÏÏÏÏÏÏÏÏÏÏÏÏÏÏÏÏÏÏÏÏÏÏÏÏÏÏÏÏÏÏÏÏÏÏÏÏÏ $28,871 $25,976
Required risk-based capital ÏÏÏÏÏÏÏÏÏÏÏÏÏÏÏÏÏÏÏÏÏÏÏÏÏÏÏÏÏÏÏÏÏÏÏÏÏÏÏÏÏÏÏÏÏÏÏÏÏÏÏÏÏÏÏÏÏÏÏ 17,434 N/A
Excess of total capital over required risk-based capital ÏÏÏÏÏÏÏÏÏÏÏÏÏÏÏÏÏÏÏÏÏÏÏÏÏÏÏÏÏÏÏÏÏÏÏÏ 11,437 N/A
Required critical capital(4)(5)ÏÏÏÏÏÏÏÏÏÏÏÏÏÏÏÏÏÏÏÏÏÏÏÏÏÏÏÏÏÏÏÏÏÏÏÏÏÏÏÏÏÏÏÏÏÏÏÏÏÏÏÏÏÏÏÏÏÏ $13,880 $12,324
Excess of core capital over required critical capital(5) ÏÏÏÏÏÏÏÏÏÏÏÏÏÏÏÏÏÏÏÏÏÏÏÏÏÏÏÏÏÏÏÏÏÏÏÏÏ 14,199 12,859
(1) The sum of (a) the stated value of common stock; (b) the stated value of outstanding noncumulative perpetualpreferred stock; (c) paid-in capital; and (d) retained earnings, less treasury stock. Core capital excludes accumulatedother comprehensive income (AOCI).
(2) The sum of (a) 2.50 percent of on-balance sheet assets; (b) .45 percent of outstanding MBS; and (c) .45 percent ofother oÅ-balance sheet obligations, which may be adjusted by the Director of OFHEO under certain circumstances(See 12 CFR 1750.4 for existing adjustments made by the Director of OFHEO).
(3) The sum of (a) core capital and (b) the total allowance for loan losses and guaranty liability, less (c) the speciÑc lossallowance. SpeciÑc loss allowances totaled $19 million and $13 million for the years ended December 31, 2002 andDecember 31, 2001, respectively.
(4) The sum of (a) 1.25 percent of on-balance sheet assets; (b) .25 percent of outstanding MBS; and (c) .25 percent ofother oÅ-balance sheet obligations, which may be adjusted by the Director of OFHEO under certain circumstances.
(5) These amounts do not reÖect the reclassiÑcation from our ""Allowance for loan losses'' to a ""Guaranty liability forMBS'' the amount associated with the guaranty obligation for MBS that we own that occurred in 2002. See Note 1 tothe notes to the financial statements, Summary of SigniÑcant Accounting Policies Ì Allowance for Loan Losses andGuaranty Liability for MBS. The reclassiÑcation will not have a material eÅect on these amounts.
Payment of dividends on common stock is subordinate to any payment of dividends on preferred stockoutstanding. Payment of preferred stock dividends is not mandatory.
135

FANNIE MAE
NOTES TO FINANCIAL STATEMENTS Ì (Continued)
12. Preferred Stock
The following table presents preferred stock outstanding as of December 31, 2002.
Shares Issued Statedand Value Annual Redeemable
Issue Date Outstanding per Share Dividend Rate On or After
Series D ÏÏÏÏÏÏÏÏÏÏÏÏÏÏÏÏÏ September 30, 1998 3,000,000 $50 5.250% September 30, 1999
Series E ÏÏÏÏÏÏÏÏÏÏÏÏÏÏÏÏÏ April 15, 1999 3,000,000 50 5.100 April 15, 2004
Series F ÏÏÏÏÏÏÏÏÏÏÏÏÏÏÏÏÏ March 20, 2000 13,800,000 50 3.540(1) March 31, 2002(3)
Series G ÏÏÏÏÏÏÏÏÏÏÏÏÏÏÏÏÏ August 8, 2000 5,750,000 50 1.830(2) September 30, 2002(3)
Series H ÏÏÏÏÏÏÏÏÏÏÏÏÏÏÏÏÏ April 6, 2001 8,000,000 50 5.810 April 6, 2006
Series IÏÏÏÏÏÏÏÏÏÏÏÏÏÏÏÏÏÏ October 28, 2002 6,000,000 50 5.375 October 28, 2007
Series JÏÏÏÏÏÏÏÏÏÏÏÏÏÏÏÏÏÏ November 26, 2002 14,000,000 50 3.780(4) November 26, 2004
Total ÏÏÏÏÏÏÏÏÏÏÏÏÏÏÏÏÏÏÏÏÏÏÏÏÏÏÏÏÏÏÏÏÏÏÏÏÏÏÏ 53,550,000
(1) Rate eÅective March 31, 2002. Variable dividend rate that resets every two years thereafter at the Constant MaturityU.S. Treasury Rate minus .16 percent with a cap of 11 percent per year.
(2) Rate eÅective September 30, 2002. Variable dividend rate that resets every two years thereafter at the ConstantMaturity U.S. Treasury Rate minus .18 percent with a cap of 11 percent per year.
(3) Represents initial call date. Redeemable every two years thereafter.
(4) Initial rate. Variable dividend rate that resets every two years thereafter at the two-year U.S. Dollar Swap Rate plus1.38 percent with a cap of 8 percent per year.
In general, our preferred stock has no par value, has a stated value and liquidation preference of $50 pershare, and is not convertible into or exchangeable for any of our other stock or obligations. Holders ofpreferred stock are entitled to receive noncumulative, quarterly dividends when, and if, declared by our Boardof Directors, but will have no right to require redemption of any shares of preferred stock. Payment ofdividends on preferred stock is not mandatory, but has priority over payment of dividends on common stock.After a speciÑed period, we have the option to redeem preferred stock at its stated value. All outstandingpreferred stock is nonvoting.
We redeemed all 7.5 million of our outstanding Series B preferred stock on February 28, 2002 and all5.0 million shares of our outstanding Series C preferred stock on July 31, 2002.
13. Derivative Instruments and Hedging Activities
Fannie Mae issues various types of debt to Ñnance the acquisition of mortgages. We typically usederivative instruments to hedge against the impact of interest rate movements on our debt costs to preservemortgage-to-debt spreads. We do not engage in trading or other speculative usage of derivative instruments.
We principally use interest-rate swaps, basis swaps, swaptions, and caps in our hedging activities. Swapsprovide for the exchange of Ñxed and variable interest payments based on contractual notional principalamounts. These may include callable swaps, which give counterparties or us the right to terminate interest rateswaps before their stated maturities. Or, these may include foreign currency swaps, where Fannie Mae and ourcounterparties exchange payments in diÅerent types of currencies. Basis swaps provide for the exchange ofvariable payments that have maturities similar to hedged debt, but have payments based on diÅerent interestrate indices. Swaptions give us the option to enter into swaps at a future date, thereby mirroring the economiceÅect of callable debt. Interest rate caps provide ceilings on the interest rates of variable-rate debt.
We formally document all relationships between hedging instruments and the hedged items, including therisk management objective and strategy for undertaking various hedge transactions. We link all derivatives tospeciÑc assets and liabilities on the balance sheet or to speciÑc forecasted transactions and designate them ascash Öow or fair value hedges. We also formally assess, both at the hedge's inception and on an ongoing basis,
136

FANNIE MAE
NOTES TO FINANCIAL STATEMENTS Ì (Continued)
whether the derivatives that we use in hedging transactions are highly eÅective in oÅsetting changes in thecash Öows or fair values of the hedged items.
The following table reÖects the hedge classiÑcation of the notional balances of derivatives by type that weheld at December 31, 2002 and 2001.
2002 2001
Fair Value Cash Flow Fair Value Cash FlowHedges Hedges Total Hedges Hedges Total
(Dollars in millions)
Interest rate swaps:Pay-Ñxed ÏÏÏÏÏÏÏÏÏÏÏÏÏÏÏÏÏÏÏÏÏÏÏÏÏÏ $ 16,355 $152,157 $168,512 $ 7,063 $206,617 $213,680Receive-Ñxed and basis ÏÏÏÏÏÏÏÏÏÏÏÏÏÏ 29,636 48,259 77,895 10,989 75,134 86,123
Interest rate capsÏÏÏÏÏÏÏÏÏÏÏÏÏÏÏÏÏÏÏÏÏÏ Ì 122,393 122,393 Ì 75,893 75,893Swaptions:
Pay-Ñxed ÏÏÏÏÏÏÏÏÏÏÏÏÏÏÏÏÏÏÏÏÏÏÏÏÏÏ Ì 129,225 129,225 Ì 69,650 69,650Receive-Ñxed ÏÏÏÏÏÏÏÏÏÏÏÏÏÏÏÏÏÏÏÏÏÏÏ 94,750 51,500 146,250 74,400 Ì 74,400
Other(1) ÏÏÏÏÏÏÏÏÏÏÏÏÏÏÏÏÏÏÏÏÏÏÏÏÏÏÏÏÏ 4,120 8,200 12,320 8,843 4,550 13,393
Total ÏÏÏÏÏÏÏÏÏÏÏÏÏÏÏÏÏÏÏÏÏÏÏÏÏÏÏÏÏÏÏÏ $144,861 $511,734 $656,595 $101,295 $431,844 $533,139
(1) Includes foreign currency swaps, forward starting swaps, asset swaps, and other derivatives used to hedge anticipateddebt issues.
We discontinue hedge accounting prospectively when
‚ the derivative is no longer eÅective in oÅsetting changes in the cash Öows or fair value of a hedgeditem;
‚ the derivative expires or is sold, terminated, or exercised;
‚ the derivative is de-designated as a hedge instrument because it is unlikely that a forecasted transactionwill occur; or,
‚ designation of the derivative as a hedge instrument is no longer appropriate.
Cash Flow Hedges
Objectives and Context
We employ cash Öow hedges to lock in the interest spread on purchased assets by hedging existingvariable-rate debt and the forecasted issuance of debt through our Benchmark Program. The issuance of short-term Discount Notes and variable-rate long-term debt during periods of rising interest rates can result in amismatch of cash Öows relative to Ñxed-rate mortgage assets. We minimize the risk of mismatched cash Öowsby converting variable-rate interest expense to Ñxed-rate interest expense in order to lock-in our funding costsand interest spread.
Risk Management Strategies and Policies
We enter into interest rate swaps, swaptions, and caps to hedge the variability of cash Öows resulting fromchanges in interest rates. We enter into pay-Ñxed interest rate swaps to protect against an increase in interestrates by converting the debt's variable rate to a Ñxed rate and to protect against Öuctuations in market prices ofanticipated debt issuances.
We enter into pay-Ñxed interest rate swaps and swaptions as well as interest rate caps to change thevariable-rate cash Öow exposure on our short-term Discount Notes and long-term variable-rate debt to Ñxed-rate cash Öows. Under the swap agreements, we eÅectively create Ñxed-rate debt by receiving variable interest
137

FANNIE MAE
NOTES TO FINANCIAL STATEMENTS Ì (Continued)
payments and making Ñxed interest payments. We purchase swaptions that give us the option to enter into apay-Ñxed, receive-variable interest rate swap at a future date. Under interest rate cap agreements, we reducethe variability of cash Öows on our variable-rate debt by purchasing the right to receive cash if interest ratesrise above a speciÑed level.
We continually monitor changes in interest rates and identify interest rate exposures that may adverselyimpact expected future cash Öows on our mortgage and debt portfolios. We use analytical techniques,including cash Öow sensitivity analysis, to estimate the expected impact of changes in interest rates on ourfuture cash Öows. We did not discontinue any cash Öow hedges during the year because it was no longerprobable that the hedged debt would be issued. We had no open positions for hedging the forecasted issuanceof debt at December 31, 2002.
Financial Statement Impact
Consistent with FAS 133, we record changes in the fair value of derivatives used as cash Öow hedges inAOCI to the extent they are eÅective hedges. We amortize fair value gains or losses in AOCI into the incomestatement and reÖect them as either a reduction or increase in interest expense over the life of the hedgeditem. We recognize the income or expense associated with derivative instruments as an adjustment to theeÅective cost of the hedged debt. We will amortize an estimated $4.7 billion, net of taxes, out of AOCI andinto earnings during the next 12 months. Actual amortization results in 2003 will likely diÅer from theamortization estimate because actual swap yields during 2003 will change from the swap yield curveassumptions at December 31, 2002.
The reconciliation below reÖects the change in AOCI, net of taxes, from January 1, 2001 throughDecember 31, 2002 associated with FAS 133:
FAS 133Impact
(Dollars in millions) on AOCI
Transition adjustment to adopt FAS 133, January 1, 2001 ÏÏÏÏÏÏÏÏÏÏÏÏÏÏÏÏÏÏÏÏÏÏÏÏÏÏÏÏÏÏÏÏÏÏÏÏÏÏÏÏÏ $ (3,972)
Losses on cash Öow hedges, net ÏÏÏÏÏÏÏÏÏÏÏÏÏÏÏÏÏÏÏÏÏÏÏÏÏÏÏÏÏÏÏÏÏÏÏÏÏÏÏÏÏÏÏÏÏÏÏÏÏÏÏÏÏÏÏÏÏÏÏÏÏÏÏ (5,530)
ReclassiÑcations to earnings, netÏÏÏÏÏÏÏÏÏÏÏÏÏÏÏÏÏÏÏÏÏÏÏÏÏÏÏÏÏÏÏÏÏÏÏÏÏÏÏÏÏÏÏÏÏÏÏÏÏÏÏÏÏÏÏÏÏÏÏÏÏÏÏ 2,143
Balance at December 31, 2001 ÏÏÏÏÏÏÏÏÏÏÏÏÏÏÏÏÏÏÏÏÏÏÏÏÏÏÏÏÏÏÏÏÏÏÏÏÏÏÏÏÏÏÏÏÏÏÏÏÏÏÏÏÏÏÏÏÏÏÏÏÏÏÏÏ (7,359)
Losses on cash Öow hedges, net ÏÏÏÏÏÏÏÏÏÏÏÏÏÏÏÏÏÏÏÏÏÏÏÏÏÏÏÏÏÏÏÏÏÏÏÏÏÏÏÏÏÏÏÏÏÏÏÏÏÏÏÏÏÏÏÏÏÏÏÏÏÏÏ (14,274)
ReclassiÑcations to earnings, netÏÏÏÏÏÏÏÏÏÏÏÏÏÏÏÏÏÏÏÏÏÏÏÏÏÏÏÏÏÏÏÏÏÏÏÏÏÏÏÏÏÏÏÏÏÏÏÏÏÏÏÏÏÏÏÏÏÏÏÏÏÏÏ 5,382
Balance at December 31, 2002 ÏÏÏÏÏÏÏÏÏÏÏÏÏÏÏÏÏÏÏÏÏÏÏÏÏÏÏÏÏÏÏÏÏÏÏÏÏÏÏÏÏÏÏÏÏÏÏÏÏÏÏÏÏÏÏÏÏÏÏÏÏÏÏÏ $(16,251)
If there is any hedge ineÅectiveness or derivatives do not qualify as cash Öow hedges, we record theineÅective portion in the ""Fee and other income, net'' line item on the income statement. We included a pre-tax loss of $.4 million in 2002 and $3 million in 2001 related to the ineÅective portion of cash Öow hedges in""Fee and other income, net.''
We include only changes in the intrinsic value of swaptions and interest rate caps in our assessment ofhedge eÅectiveness. Therefore, we exclude changes in the time value of these contracts from the assessment ofhedge eÅectiveness and recognize them in the ""Purchased options expense'' line item on the incomestatement. We recorded a pre-tax loss of $2.57 billion in 2002 and $34 million in 2001 in ""Purchased optionsexpense'' for the change in time value of options designated as cash Öow hedges.
138

FANNIE MAE
NOTES TO FINANCIAL STATEMENTS Ì (Continued)
Fair Value Hedges
Objectives and Context
We employ fair value hedges to preserve our mortgage-to-debt interest spreads when there is a decline ininterest rates by converting Ñxed-rate debt to variable-rate debt. A decline in interest rates increases the risk ofmortgage assets repricing at lower yields while Ñxed-rate debt remains at above-market costs. We limit theinterest rate risk inherent in our Ñxed-rate debt instruments by using fair value hedges to convert Ñxed-ratedebt to variable-rate debt.
Risk Management Strategies and Policies
We enter into various types of derivative instruments, such as receive-Ñxed interest rate swaps andswaptions, to convert Ñxed-rate debt to Öoating-rate debt and preserve mortgage-to-debt interest spreads wheninterest rates decline. Under receive-Ñxed interest rate swaps, we receive Ñxed interest payments and makevariable interest payments, thereby creating Öoating-rate debt. Receive-Ñxed swaptions give us the option toenter into an interest rate swap at a future date. In this event, we eÅectively create callable debt that repricesat a lower interest rate because we will receive Ñxed interest payments and make variable interest payments.
Financial Statement Impact
We record changes in the fair value of derivatives used as fair value hedges in the ""Fee and other income,net'' line item on the income statement along with oÅsetting changes in the fair value of the hedged itemsattributable to the risk being hedged. Our fair value hedges produced hedge ineÅectiveness totaling $.2 millionof expense during the year ended December 31, 2002. Our fair value hedges produced no hedge ineÅectivenessduring the year ended December 31, 2001.
We only include changes in the intrinsic value of swaptions in our assessment of hedge effectiveness. Weexclude changes in the time value of receive-fixed swaptions used as fair value hedges from the assessment ofhedge effectiveness and record them in the ""Purchased options expense'' line item on the income statement. Forthe years ended December 31, 2002 and 2001, we recorded pre-tax purchased options expense of $1.97 billionand $3 million, respectively, in the income statement for the change in the time value of these contracts.
Foreign Currency Hedges
Fannie Mae uses derivatives to hedge foreign currency exposure on debt issued in a foreign currency.Because all of our assets are denominated in U.S. dollars, we enter into currency swaps to eÅectively convertthe foreign currency debt into U.S. dollars. Our foreign denominated debt is not material, representing.5 percent of total debt outstanding.
14. Financial Instruments with OÅ-Balance-Sheet Risk
We are involved in Ñnancial instrument transactions that create oÅ-balance-sheet risk. We enter intothese transactions to fulÑll our statutory purpose of meeting the Ñnancing needs of the secondary residentialmortgage market and to reduce our own exposure to interest rate Öuctuations. These Ñnancial instrumentsinclude guaranteed MBS and other mortgage-related securities, commitments to purchase mortgage portfolioassets or to issue and guarantee MBS, and credit enhancements. These instruments involve elements of creditand interest rate risk in excess of amounts recognized on the balance sheet to varying degrees.
Guaranteed MBS and Mortgage-Related Securities
As guarantor of MBS, we are obligated to disburse scheduled monthly installments of principal andinterest at the certiÑcate rate plus the UPB of any foreclosed mortgage to MBS investors whether or not theyhave been received. We are paid a guaranty fee for assuming this credit risk. We also are obligated to disburse
139

FANNIE MAE
NOTES TO FINANCIAL STATEMENTS Ì (Continued)
unscheduled principal payments received from borrowers on MBS. The borrower, lender, or Fannie Mae maypurchase credit enhancements, such as mortgage insurance, to protect against the risk of loss from borrowerdefault. Occasionally, lenders may elect to remain at risk for the loans underlying MBS through recoursearrangements. Lenders that keep recourse retain the primary default risk, in whole or in part, in exchange for alower guaranty fee. We may also enter into other credit enhancement arrangements. Fannie Mae, however,bears the ultimate risk of default on MBS. To a much more limited extent, we guarantee the payment ofprincipal and interest on other mortgage-related securities.
At December 31, 2002, the maximum potential amount of future principal payments we could berequired to make under our guarantee of MBS and other mortgage-related securities was $1.029 trillion. Wehave recognized a liability of $471 million at year-end 2002 for these guaranty obligations based on ourestimate of probable credit losses in the loans underlying MBS and other mortgage-related securities as ofDecember 31, 2002.
In the event we were required to make the maximum amount of future payments under the guarantees,we would Ñrst pursue recovering these payments by proceeding against the underlying collateral of the loans. Ifthe value of the collateral was less than the payments made under our guarantees, then we would recoverpayments from third-party providers of credit enhancements. In the event that the principal amount of single-family loans exceeds the value of the underlying properties, then we have credit enhancements with maximumcoverage totaling $66.1 billion in primary mortgage insurance, $7.0 billion in pool insurance, and $31.5 billionin full recourse to lenders on single-family loans. If the collateral proceeds for multifamily loans wereinsuÇcient, then we have credit enhancements totaling $4.2 billion in recourse to multifamily lenders.
Commitments
We enter into master delivery commitments with lenders on either a mandatory or an optional basis.Under a mandatory master commitment, a lender must either deliver loans under an MBS contract at aspeciÑed guaranty fee rate or enter into a mandatory portfolio commitment with the yield established uponexecuting the portfolio commitment.
We will also accept mandatory or lender-option delivery commitments not issued pursuant to a mastercommitment. These commitments may be for purchases for our mortgage portfolio or for issuances of ourMBS. The guaranty fee rate on MBS lender-option commitments is speciÑed in the contract, while the yieldfor portfolio lender-option commitments is set at the date of conversion to a mandatory commitment.
We generally hedge the cost of funding future portfolio purchases upon issuance of, or conversion to, amandatory commitment. Therefore, we largely mitigate the interest rate risk relating to loans purchasedpursuant to those commitments.
Credit Enhancements
Credit enhancements typically represent credit enhancement and liquidity support for taxable or tax-exempt housing bonds issued by state and local governmental entities to Ñnance multifamily housing for low-and moderate-income families and for other obligations related to the Ñnancing. We issue MBS, pledge aninterest in certain mortgages we own, or otherwise provide contractual assurance of payment to a trustee forthe bonds or another party in the transaction. Our direct credit enhancement improves the rating on the bonds,thus resulting in lower-cost Ñnancing for multifamily housing.
140

FANNIE MAE
NOTES TO FINANCIAL STATEMENTS Ì (Continued)
Credit Exposure for OÅ-Balance-Sheet Financial Instruments
The following table presents the contractual amount of oÅ-balance-sheet Ñnancial instruments atDecember 31, 2002 and 2001. Contractual or notional amounts do not necessarily represent the credit risk ofthe positions.
2002 2001
(Dollars inbillions)
Contractual amounts:
Outstanding MBS(1) ÏÏÏÏÏÏÏÏÏÏÏÏÏÏÏÏÏÏÏÏÏÏÏÏÏÏÏÏÏÏÏÏÏÏÏÏÏÏÏÏÏÏÏÏÏÏÏÏÏÏÏÏÏÏÏÏÏÏÏÏÏÏÏÏÏÏÏ $1,029 $859
Master commitments:
Mandatory ÏÏÏÏÏÏÏÏÏÏÏÏÏÏÏÏÏÏÏÏÏÏÏÏÏÏÏÏÏÏÏÏÏÏÏÏÏÏÏÏÏÏÏÏÏÏÏÏÏÏÏÏÏÏÏÏÏÏÏÏÏÏÏÏÏÏÏÏÏÏÏÏÏÏÏ 41 24
Optional ÏÏÏÏÏÏÏÏÏÏÏÏÏÏÏÏÏÏÏÏÏÏÏÏÏÏÏÏÏÏÏÏÏÏÏÏÏÏÏÏÏÏÏÏÏÏÏÏÏÏÏÏÏÏÏÏÏÏÏÏÏÏÏÏÏÏÏÏÏÏÏÏÏÏÏÏÏ 6 16
Portfolio commitments:
Mandatory ÏÏÏÏÏÏÏÏÏÏÏÏÏÏÏÏÏÏÏÏÏÏÏÏÏÏÏÏÏÏÏÏÏÏÏÏÏÏÏÏÏÏÏÏÏÏÏÏÏÏÏÏÏÏÏÏÏÏÏÏÏÏÏÏÏÏÏÏÏÏÏÏÏÏÏ 85 55
Optional ÏÏÏÏÏÏÏÏÏÏÏÏÏÏÏÏÏÏÏÏÏÏÏÏÏÏÏÏÏÏÏÏÏÏÏÏÏÏÏÏÏÏÏÏÏÏÏÏÏÏÏÏÏÏÏÏÏÏÏÏÏÏÏÏÏÏÏÏÏÏÏÏÏÏÏÏÏ 3 2
Other investments ÏÏÏÏÏÏÏÏÏÏÏÏÏÏÏÏÏÏÏÏÏÏÏÏÏÏÏÏÏÏÏÏÏÏÏÏÏÏÏÏÏÏÏÏÏÏÏÏÏÏÏÏÏÏÏÏÏÏÏÏÏÏÏÏÏÏÏÏÏÏÏ 3 2
Credit enhancements ÏÏÏÏÏÏÏÏÏÏÏÏÏÏÏÏÏÏÏÏÏÏÏÏÏÏÏÏÏÏÏÏÏÏÏÏÏÏÏÏÏÏÏÏÏÏÏÏÏÏÏÏÏÏÏÏÏÏÏÏÏÏÏÏÏÏÏÏ 12 16
(1) Includes MBS and other mortgage-related securities guaranteed by Fannie Mae and held by investorsother than Fannie Mae.
15. Concentrations of Credit Risk
Concentrations of credit risk exist when a number of counterparties engage in similar activities and havesimilar economic characteristics that make them susceptible to similar changes in economic conditions thatcould aÅect their ability to meet contractual obligations. In our case, these counterparties include single-family borrowers, servicers, mortgage insurers, and derivative counterparties.
Regional economic conditions aÅect a borrower's ability to repay and the value of the collateralunderlying a loan. Geographic concentrations increase the susceptibility of our portfolio to changes in creditrisk. Our single-family geographic concentrations have been consistently diversiÑed over the past three yearswith our largest exposure to the western region of the U.S. No region or state experienced negative home pricegrowth. No signiÑcant concentration existed at the state level at December 31, 2002 and 2001 except forCalifornia, where 18 percent of the gross UPB of our conventional single-family mortgage loans in portfolioand those underlying MBS in portfolio and outstanding MBS was located at both December 31, 2002 and2001. The following table presents the regional geographic distribution of properties underlying our conven-tional single-family mortgage loans in portfolio and those underlying MBS in portfolio and outstanding MBSat December 31, 2002 and 2001. Excluded from this population at December 31, 2002 and 2001 are non-Fannie Mae mortgage securities for which geographic information is not available.
Geographic Distribution(1)
Midwest Northeast Southeast Southwest West Total
2002 ÏÏÏÏÏÏÏÏÏÏÏÏÏÏÏÏÏÏÏÏÏÏÏÏÏÏÏÏÏÏÏÏÏÏÏÏÏÏÏÏÏÏ 18% 19% 21% 16% 26% 100%
2001 ÏÏÏÏÏÏÏÏÏÏÏÏÏÏÏÏÏÏÏÏÏÏÏÏÏÏÏÏÏÏÏÏÏÏÏÏÏÏÏÏÏÏ 19 18 21 16 26 100
(1) Midwest includes IL, IN, IA, MI, MN, NE, ND, OH, SD, WI; Northeast includes CT, DE, ME, MA, NH, NJ, NY,PA, PR, RI, VT, VI; Southeast includes AL, DC, FL, GA, KY, MD, NC, MS, SC, TN, VA, WV; Southwest includesAZ, AR, CO, KS, LA, MO, NM, OK, TX, UT; West includes AK, CA, GU, HI, ID, MT, NV, OR, WA, WY.
141

FANNIE MAE
NOTES TO FINANCIAL STATEMENTS Ì (Continued)
To manage credit risk and comply with legal requirements, we require primary mortgage insurance orother credit enhancement if the current LTV ratio of a single-family conventional mortgage loan is greaterthan 80 percent when the loan is delivered to us. We may also require credit enhancement if the original LTVratio of a single-family conventional mortgage loan is less than 80 percent when the loan is delivered to us.
The primary credit risk associated with mortgage insurers is that they will fail to fulÑll their obligations toreimburse us for claims under insurance policies. We were the beneÑciary of primary mortgage insurancecoverage on $316 billion of single-family loans in portfolio or underlying MBS at December 31, 2002 and$314 billion at December 31, 2001. Seven mortgage insurance companies, all rated AA or higher by Standard& Poor's, provided approximately 99 percent of the total coverage at the end of 2002 and 2001.
The primary risk associated with mortgage lenders is that they will fail to fulÑll their servicing obligations.Mortgage servicers collect mortgage and escrow payments from borrowers, pay taxes and insurance costs fromescrow accounts, monitor and report delinquencies, and perform other required activities on our behalf. Aservicing contract breach could result in credit losses for us, or we could incur the cost of Ñnding areplacement servicer, which could be substantial for loans that require a special servicer. Our ten largestsingle-family mortgage servicers serviced 63 percent of our single-family book of business at both year-end2002 and year-end 2001. Our Ñfteen largest multifamily mortgage servicers serviced 70 percent of ourmultifamily book of business at year-end 2002, compared with 67 percent at year-end 2001.
The primary credit exposure we have on a derivative transaction is that a counterparty might default onpayments due, which could result in having to replace the derivative with a diÅerent counterparty at a highercost. Over 99 percent of the $657 billion and $533 billion notional amount of our outstanding derivativetransactions were with counterparties rated A or better both by Standard & Poor's (S&P) and Moody's atDecember 31, 2002 and 2001, respectively (one counterparty was downgraded below an A rating after thecontract was entered into). Our derivative instruments were diversiÑed among 21 and 23 counterparties atyear-end 2002 and 2001, respectively, to reduce our credit risk concentrations. At December 31, 2002, eightcounterparties with credit ratings of A or better represented approximately 76 percent of the total notionalamount of outstanding derivatives transactions. At December 31, 2001, eight counterparties with credit ratingsof A or better represented approximately 78 percent of the total notional amount of outstanding derivativestransactions.
Seventy-one percent of our net exposure of $197 million at December 31, 2002 was with sixcounterparties rated AA or better by S&P and Aa or better by Moody's. The percentage of our exposure withthese six counterparties ranged from 2 to 23 percent. In comparison, Ñve counterparties rated AA or better byS&P and Aa or better by Moody's accounted for 83 percent of our net exposure of $110 million atDecember 31, 2001. The percentage of our net exposure with counterparties rated AA or better by S&P andAa or better by Moody's fell during 2002 because of a change in the relative mix of our derivative products inresponse to changes in market conditions that shifted the relative level of activity and exposure betweenindividual counterparties.
16. Fair Value of Financial Instruments
The basic assumptions used and the estimates disclosed in the Fair Value Balance Sheets represent ourbest judgment of appropriate valuation methods. These estimates are based on pertinent information availableto us as of December 31, 2002 and 2001. In certain cases, fair values are not subject to precise quantiÑcationor veriÑcation and may change as economic and market factors, and our evaluation of those factors, change.Although we use our best judgment in estimating the fair value of these Ñnancial instruments, there areinherent limitations in any estimation technique. Therefore, these fair value estimates are not necessarilyindicative of the amounts that we would realize in a market transaction. The accompanying Fair ValueBalance Sheets do not represent an estimate of the overall market value of Fannie Mae as a going concern,which would take into account future business opportunities.
142

FANNIE MAE
NOTES TO FINANCIAL STATEMENTS Ì (Continued)
Fair Value Balance Sheets
December 31, 2002 December 31, 2001
Carrying Estimated Carrying EstimatedAmount Fair Value Amount Fair Value
(Dollars in millions)
Assets
Mortgage portfolio, net ÏÏÏÏÏÏÏÏÏÏÏÏÏÏÏÏÏÏÏÏÏÏÏÏÏÏÏÏÏÏÏÏÏÏÏÏÏÏÏ $797,693 $826,870 $705,324 $720,174
Nonmortgage investments ÏÏÏÏÏÏÏÏÏÏÏÏÏÏÏÏÏÏÏÏÏÏÏÏÏÏÏÏÏÏÏÏÏÏÏÏ 59,844 59,845 74,554 74,716
Cash and cash equivalents ÏÏÏÏÏÏÏÏÏÏÏÏÏÏÏÏÏÏÏÏÏÏÏÏÏÏÏÏÏÏÏÏÏÏÏÏ 1,710 1,710 1,518 1,518
Other assets ÏÏÏÏÏÏÏÏÏÏÏÏÏÏÏÏÏÏÏÏÏÏÏÏÏÏÏÏÏÏÏÏÏÏÏÏÏÏÏÏÏÏÏÏÏÏÏÏ 24,602 19,316 17,598 13,020
Derivatives in gain positionsÏÏÏÏÏÏÏÏÏÏÏÏÏÏÏÏÏÏÏÏÏÏÏÏÏÏÏÏÏÏÏÏÏÏÏ 3,666 3,666 954 954
887,515 911,407 799,948 810,382
OÅ-balance-sheet items:
Guaranty fee income, net(1) ÏÏÏÏÏÏÏÏÏÏÏÏÏÏÏÏÏÏÏÏÏÏÏÏÏÏÏÏÏÏÏÏÏ Ì 5,146 Ì 6,451
Mortgage purchase commitments(2) ÏÏÏÏÏÏÏÏÏÏÏÏÏÏÏÏÏÏÏÏÏÏÏÏÏÏ Ì 1,650 Ì (567)
Total assetsÏÏÏÏÏÏÏÏÏÏÏÏÏÏÏÏÏÏÏÏÏÏÏÏÏÏÏÏÏÏÏÏÏÏÏÏÏÏÏÏÏÏÏÏÏ $887,515 $918,203 $799,948 $816,266
Liabilities and Net Assets
Liabilities:
Senior debt
Due within one year ÏÏÏÏÏÏÏÏÏÏÏÏÏÏÏÏÏÏÏÏÏÏÏÏÏÏÏÏÏÏÏÏÏÏÏÏÏ $382,412 $382,453 $343,492 $343,648
Due after one yearÏÏÏÏÏÏÏÏÏÏÏÏÏÏÏÏÏÏÏÏÏÏÏÏÏÏÏÏÏÏÏÏÏÏÏÏÏÏÏ 458,600 485,297 413,582 427,209
Subordinated debt
Due within one year ÏÏÏÏÏÏÏÏÏÏÏÏÏÏÏÏÏÏÏÏÏÏÏÏÏÏÏÏÏÏÏÏÏÏÏÏÏ Ì Ì Ì Ì
Due after one yearÏÏÏÏÏÏÏÏÏÏÏÏÏÏÏÏÏÏÏÏÏÏÏÏÏÏÏÏÏÏÏÏÏÏÏÏÏÏÏ 9,970 12,424 6,393 7,625
850,982 880,174 763,467 778,482
Other liabilities ÏÏÏÏÏÏÏÏÏÏÏÏÏÏÏÏÏÏÏÏÏÏÏÏÏÏÏÏÏÏÏÏÏÏÏÏÏÏÏÏÏÏÏ 14,548 10,202 13,294 10,040
Derivatives in loss positions ÏÏÏÏÏÏÏÏÏÏÏÏÏÏÏÏÏÏÏÏÏÏÏÏÏÏÏÏÏÏÏÏÏ 5,697 5,697 5,069 5,069
Total liabilities ÏÏÏÏÏÏÏÏÏÏÏÏÏÏÏÏÏÏÏÏÏÏÏÏÏÏÏÏÏÏÏÏÏÏÏÏÏÏÏÏÏÏ 871,227 896,073 781,830 793,591
Net assets, net of tax eÅect ÏÏÏÏÏÏÏÏÏÏÏÏÏÏÏÏÏÏÏÏÏÏÏÏÏÏÏÏÏÏÏÏÏÏÏ $ 16,288 $ 22,130 $ 18,118 $ 22,675
(1) At December 31, 2002 and 2001, total MBS was $1,538 billion and $1,290 billion, respectively. Refer to Note 14,""Financial Instruments with OÅ-Balance-Sheet Risk,'' for more information on the nature of this item.
(2) At December 31, 2002 and 2001, the amount of mandatory mortgage purchase commitments was $85 billion and$55 billion, respectively. Refer to Note 14, ""Financial Instruments with OÅ-Balance-Sheet Risk,'' for moreinformation on the nature of this item.
See accompanying Notes to Fair Value Balance Sheets.
Notes to Fair Value Balance Sheets
The following discussion summarizes the signiÑcant methodologies and assumptions we used to estimatethe fair values in the accompanying Fair Value Balance Sheets.
Mortgage Portfolio, Net
The fair value calculations of our mortgage portfolio considered such variables as interest rates, creditquality, and loan collateral. Because an active market does not exist for a portion of mortgage loans in theportfolio, the portfolio's unsecuritized mortgages were aggregated into pools by product type, coupon, andmaturity and converted into notional MBS. A normal guaranty fee that our securitization business would
143

FANNIE MAE
NOTES TO FINANCIAL STATEMENTS Ì (Continued)
charge for a pool of loans with similar characteristics was subtracted from the weighted-average coupon rateless servicing fees. We describe the method for estimating this guaranty fee and the credit risk associated withthe mortgage portfolio under ""Guaranty fee income.''
We then employed an option-adjusted spread (OAS) approach to estimate fair values for MBS held inportfolio and other mortgage-related securities. The OAS approach represents the risk premium or incremen-tal interest spread over some market benchmark rates, typically our debt rates, that is included in a security'syield to compensate an investor for the uncertain eÅects of embedded prepayment options on mortgages. TheOAS was calculated using quoted market values for selected benchmark securities and provided a generallyapplicable return measure that considers the eÅect of prepayment risk and interest rate volatility.
Nonmortgage Investments
We based fair values of our nonmortgage investment portfolio on actual quoted prices or prices quoted forsimilar Ñnancial instruments.
Cash and Cash Equivalents
We used the carrying amount of cash and cash equivalents as a reasonable estimate of their fair value.
Other Assets
Other assets include accrued interest receivable, net currency swap receivables, and several other smallerasset categories. The fair value of other assets, excluding certain deferred items that have no fair value and netcurrency swap receivables, approximates their carrying amount. We estimated the fair value of net currencyswap receivables based on either the expected cash Öows or quoted market values of these instruments.
The fair value amount also includes the estimated eÅect on deferred income taxes of providing for federalincome taxes for the diÅerence between net assets at fair value and at cost at the statutory corporate tax rate of35 percent.
Derivatives
We enter into interest rate swaps, including callable swaps that, in general, extend or adjust the eÅectivematurity of certain debt obligations. Under these swaps, we generally pay a Ñxed rate and receive a Öoatingrate based on a notional amount. We also enter into interest rate swaps that are linked to speciÑc investments(asset swaps) or speciÑc debt issues (debt swaps). We estimated the fair value of interest rate swaps based oneither the expected cash Öows or quoted market values of these instruments, net of tax. We included the eÅectof netting under master agreements in determining swap obligations in a gain position or loss position.
In addition, we enter into swaptions and interest rate caps. Under a swaption, we have the option to enterinto a swap, as described above, at a future date. We use interest rate caps to eÅectively manage our interestexpense in a period of rising interest rates by entering into an agreement whereby a counterparty makespayments to us for interest rates above a speciÑed rate. We estimated the fair values of these derivativeinstruments based on either the expected cash Öows or the quoted market values of these instruments, net oftax.
Guaranty Fee Income
Guaranteed MBS and other mortgage-related securities are not assets owned by us, except when acquiredfor investment purposes. We receive a guaranty fee calculated on the outstanding principal balance of theMBS or other mortgage-related assets held by third-parties. The guaranty fee represents a future incomestream for us. Under generally accepted accounting principles, we recognize this guaranty fee as income over
144
FANNIE MAE
NOTES TO FINANCIAL STATEMENTS Ì (Continued)
the life of the securities. The Fair Value Balance Sheets reÖect the present value of guaranty fees, net ofestimated future administrative costs and credit losses, taking into account estimated prepayments.
We estimated the credit loss exposure attached to the notional amount of guaranteed MBS and othermortgage-related securities held by third-party investors. We deducted estimated credit losses from theprojected guaranty fee cash Öows to arrive at fair value. We calculated estimated credit losses with an internalforecasting model based on our actual historical loss experience. We then valued the net guaranty fee cashÖows with reference to the pricing of similar assets.
Noncallable and Callable Debt
We estimated the fair value of our noncallable debt using quotes for selected Fannie Mae debt securitieswith similar terms. We estimated the fair value of callable debt with an OAS model similar to the valuation ofthe mortgage portfolio.
Other Liabilities
Other liabilities primarily include accrued interest payable, amounts payable to MBS holders, estimatedlosses on guaranteed MBS, net currency swap payables, and several other smaller liability categories. The fairvalue of other liabilities often approximates their carrying amount; however, certain deferred liabilities have nofair value. We included credit loss exposure for guaranteed MBS and other mortgage-related securities as acomponent of the net MBS guaranty fee. We estimated the fair value of net currency swap payables based onthe expected cash Öows or quoted market values of these instruments.
Mortgage Purchase Commitments
Mortgage purchase commitments include mandatory commitments to purchase MBS and loans. Weestimated their fair value based on the prices for similar MBS that are being traded in the marketplace.
145

INDEPENDENT AUDITORS' REPORT
To the Board of Directors and Stockholders of Fannie Mae:
We have audited the accompanying balance sheets of Fannie Mae as of December 31, 2002 and 2001,and the related statements of income, changes in stockholders' equity, and cash Öows for each of the years inthe three-year period ended December 31, 2002. These Ñnancial statements are the responsibility of FannieMae's management. Our responsibility is to express an opinion on these Ñnancial statements based on ouraudits.
We conducted our audits in accordance with auditing standards generally accepted in the United Statesof America. Those standards require that we plan and perform the audit to obtain reasonable assurance aboutwhether the Ñnancial statements are free of material misstatement. An audit includes examining, on a testbasis, evidence supporting the amounts and disclosures in the Ñnancial statements. An audit also includesassessing the accounting principles used and signiÑcant estimates made by management, as well as evaluatingthe overall Ñnancial statement presentation. We believe that our audits provide a reasonable basis for ouropinion.
In our opinion, the Ñnancial statements referred to above present fairly, in all material respects, theÑnancial position of Fannie Mae as of December 31, 2002 and 2001, and the results of its operations and itscash Öows for each of the years in the three-year period ended December 31, 2002, in conformity withaccounting principles generally accepted in the United States of America.
As discussed in Note 13 to the Ñnancial statements, Fannie Mae changed its method of accounting forderivative instruments and hedging activities in 2001 in accordance with the adoption of Financial AccountingStandard No. 133, Accounting for Derivative Instruments and Hedging Activities.
We also have audited in accordance with auditing standards generally accepted in the United States ofAmerica the supplemental fair value balance sheets of Fannie Mae as of December 31, 2002 and 2001,included in Note 16 to the Ñnancial statements. As described in Note 16, the supplemental fair value balancesheets have been prepared by management to present relevant Ñnancial information that is not provided by theÑnancial statements and is not intended to be a presentation in conformity with accounting principles generallyaccepted in the United States of America. In addition, the supplemental fair value balance sheets do notpurport to present the net realizable, liquidation, or market value of Fannie Mae as a whole. Furthermore,amounts ultimately realized by Fannie Mae from the disposal of assets may vary signiÑcantly from the fairvalues presented. In our opinion, the supplemental fair value balance sheets included in Note 16 present fairly,in all material respects, the information set forth therein.
/s/ KPMG LLP
Washington, DCJanuary 14, 2003
146

REPORT OF MANAGEMENT
To The Stockholders Of Fannie Mae:
The management of Fannie Mae is responsible for the preparation, integrity, and fair presentation of theaccompanying Ñnancial statements and other information appearing elsewhere in this report. In our opinion,the Ñnancial statements have been prepared in conformity with accounting principles generally accepted in theUnited States of America appropriate in the circumstances, and the other Ñnancial information in this report isconsistent with such statements. In preparing the Ñnancial statements and in developing the other Ñnancialinformation, it has been necessary to make informed judgments and estimates of the eÅects of business eventsand transactions. We believe that these judgments and estimates are reasonable, that the Ñnancial informationcontained in this report reÖects in all material respects the substance of all business events and transactions towhich the corporation was a party, and that all material uncertainties have been appropriately accounted for ordisclosed.
The management of Fannie Mae is also responsible for maintaining internal control over Ñnancialreporting that provides reasonable assurance that transactions are executed in accordance with appropriateauthorization, permits preparation of Ñnancial statements in conformity with accounting principles generallyaccepted in the United States of America, and establishes accountability for the assets of the corporation.
Internal control over Ñnancial reporting includes controls for the execution, documentation, and recordingof transactions, and an organizational structure that provides an eÅective segregation of duties and responsibil-ities. Fannie Mae has an internal OÇce of Auditing whose responsibilities include monitoring compliance withestablished controls and evaluating the corporation's internal controls over Ñnancial reporting. Organization-ally, the internal OÇce of Auditing is independent of the activities it reviews.
Fannie Mae's Ñnancial statements are audited by KPMG LLP, the corporation's independent auditors,whose audit is performed in accordance with auditing standards generally accepted in the United States ofAmerica. In addition, KPMG LLP obtained an understanding of our internal controls over Ñnancial reportingand conducted such tests and other auditing procedures as they considered necessary to express the opinion onthe Ñnancial statements in their report that follows.
The Board of Directors of Fannie Mae exercises its oversight of Ñnancial reporting and related controlsthrough an Audit Committee, which is composed solely of directors who are not oÇcers or employees of thecorporation. The Audit Committee meets with management and the internal OÇce of Auditing periodically toreview the work of each and to evaluate the eÅectiveness with which they discharge their respectiveresponsibilities. In addition, the committee meets periodically with KPMG LLP, who has free access to thecommittee, without management present. The appointment of the independent auditors is made annually bythe Board of Directors subject to ratiÑcation by the stockholders.
Management recognizes that there are inherent limitations in the eÅectiveness of any internal controlenvironment. However, management believes that, as of December 31, 2002, Fannie Mae's internal controlenvironment, as described herein, provided reasonable assurance as to the integrity and reliability of theÑnancial statements and related Ñnancial information.
/s/ TIMOTHY HOWARD /s/ LEANNE G. SPENCER
Timothy Howard Leanne G. SpencerExecutive Vice President and Senior Vice President andChief Financial OÇcer Controller
147

FANNIE MAEQUARTERLY RESULTS OF OPERATIONS (Unaudited)
The following unaudited results of operations include, in the opinion of management, all adjustmentsnecessary for a fair presentation of the results of operations for such periods.
2002 Quarter Ended
December September June March
(Dollars in millions,except per common share amounts)
Net interest income ÏÏÏÏÏÏÏÏÏÏÏÏÏÏÏÏÏÏÏÏÏÏÏÏÏÏÏÏÏÏÏÏÏÏÏÏÏÏÏÏÏÏÏÏÏÏ $ 3,012 $ 2,591 $2,532 $2,431Guaranty fee incomeÏÏÏÏÏÏÏÏÏÏÏÏÏÏÏÏÏÏÏÏÏÏÏÏÏÏÏÏÏÏÏÏÏÏÏÏÏÏÏÏÏÏÏÏÏÏ 523 463 423 407Fee and other income (expense), netÏÏÏÏÏÏÏÏÏÏÏÏÏÏÏÏÏÏÏÏÏÏÏÏÏÏÏÏÏÏÏÏ 95 91 42 4Provision for losses ÏÏÏÏÏÏÏÏÏÏÏÏÏÏÏÏÏÏÏÏÏÏÏÏÏÏÏÏÏÏÏÏÏÏÏÏÏÏÏÏÏÏÏÏÏÏÏ (41) (26) (33) (28)Foreclosed property income ÏÏÏÏÏÏÏÏÏÏÏÏÏÏÏÏÏÏÏÏÏÏÏÏÏÏÏÏÏÏÏÏÏÏÏÏÏÏÏÏ 8 12 9 7Administrative expenses ÏÏÏÏÏÏÏÏÏÏÏÏÏÏÏÏÏÏÏÏÏÏÏÏÏÏÏÏÏÏÏÏÏÏÏÏÏÏÏÏÏÏÏ (313) (315) (301) (290)Purchased options expenseÏÏÏÏÏÏÏÏÏÏÏÏÏÏÏÏÏÏÏÏÏÏÏÏÏÏÏÏÏÏÏÏÏÏÏÏÏÏÏÏÏ (1,881) (1,378) (499) (787)Debt extinguishments, net ÏÏÏÏÏÏÏÏÏÏÏÏÏÏÏÏÏÏÏÏÏÏÏÏÏÏÏÏÏÏÏÏÏÏÏÏÏÏÏÏÏ (176) (138) (224) (172)
Income before federal income taxes ÏÏÏÏÏÏÏÏÏÏÏÏÏÏÏÏÏÏÏÏÏÏÏÏÏÏÏÏÏÏÏÏÏ 1,227 1,300 1,949 1,572Provision for federal income taxesÏÏÏÏÏÏÏÏÏÏÏÏÏÏÏÏÏÏÏÏÏÏÏÏÏÏÏÏÏÏÏÏÏÏÏ (275) (307) (485) (362)
Net income ÏÏÏÏÏÏÏÏÏÏÏÏÏÏÏÏÏÏÏÏÏÏÏÏÏÏÏÏÏÏÏÏÏÏÏÏÏÏÏÏÏÏÏÏÏÏÏÏÏÏÏÏÏ $ 952 $ 993 $1,464 $1,210
Preferred stock dividends ÏÏÏÏÏÏÏÏÏÏÏÏÏÏÏÏÏÏÏÏÏÏÏÏÏÏÏÏÏÏÏÏÏÏÏÏÏÏÏÏÏÏ (20) (22) (24) (33)
Net income available to common stockholders ÏÏÏÏÏÏÏÏÏÏÏÏÏÏÏÏÏÏÏÏÏÏÏÏ $ 932 $ 971 $1,440 $1,177
Diluted earnings per common share ÏÏÏÏÏÏÏÏÏÏÏÏÏÏÏÏÏÏÏÏÏÏÏÏÏÏÏÏÏÏÏÏÏ $ .94 $ .98 $ 1.44 $ 1.17Cash dividends per common share ÏÏÏÏÏÏÏÏÏÏÏÏÏÏÏÏÏÏÏÏÏÏÏÏÏÏÏÏÏÏÏÏÏÏ .33 .33 .33 .33
2001 Quarter Ended
December September June March
(Dollars in millions,except per common share amounts)
Net interest income ÏÏÏÏÏÏÏÏÏÏÏÏÏÏÏÏÏÏÏÏÏÏÏÏÏÏÏÏÏÏÏÏÏÏÏÏÏÏÏÏÏÏÏÏÏÏ $ 2,404 $ 2,079 $1,900 $1,707Guaranty fee incomeÏÏÏÏÏÏÏÏÏÏÏÏÏÏÏÏÏÏÏÏÏÏÏÏÏÏÏÏÏÏÏÏÏÏÏÏÏÏÏÏÏÏÏÏÏÏ 398 384 357 343Fee and other income (expense), netÏÏÏÏÏÏÏÏÏÏÏÏÏÏÏÏÏÏÏÏÏÏÏÏÏÏÏÏÏÏÏÏ 51 49 24 27Provision for losses ÏÏÏÏÏÏÏÏÏÏÏÏÏÏÏÏÏÏÏÏÏÏÏÏÏÏÏÏÏÏÏÏÏÏÏÏÏÏÏÏÏÏÏÏÏÏÏ (21) (18) (24) (31)Foreclosed property income ÏÏÏÏÏÏÏÏÏÏÏÏÏÏÏÏÏÏÏÏÏÏÏÏÏÏÏÏÏÏÏÏÏÏÏÏÏÏÏÏ 5 3 6 2Administrative expenses ÏÏÏÏÏÏÏÏÏÏÏÏÏÏÏÏÏÏÏÏÏÏÏÏÏÏÏÏÏÏÏÏÏÏÏÏÏÏÏÏÏÏÏ (251) (273) (254) (239)Special contribution ÏÏÏÏÏÏÏÏÏÏÏÏÏÏÏÏÏÏÏÏÏÏÏÏÏÏÏÏÏÏÏÏÏÏÏÏÏÏÏÏÏÏÏÏÏÏ (300) Ì Ì ÌPurchased options income (expense) ÏÏÏÏÏÏÏÏÏÏÏÏÏÏÏÏÏÏÏÏÏÏÏÏÏÏÏÏÏÏÏÏ 578 (413) 36 (238)Debt extinguishments, net ÏÏÏÏÏÏÏÏÏÏÏÏÏÏÏÏÏÏÏÏÏÏÏÏÏÏÏÏÏÏÏÏÏÏÏÏÏÏÏÏÏ (91) (207) (142) (84)
Income before federal income taxes and cumulative eÅect of change inaccounting principle ÏÏÏÏÏÏÏÏÏÏÏÏÏÏÏÏÏÏÏÏÏÏÏÏÏÏÏÏÏÏÏÏÏÏÏÏÏÏÏÏÏÏÏÏ 2,773 1,604 1,903 1,487
Provision for federal income taxesÏÏÏÏÏÏÏÏÏÏÏÏÏÏÏÏÏÏÏÏÏÏÏÏÏÏÏÏÏÏÏÏÏÏÏ (804) (375) (500) (362)
Income before cumulative eÅect of change in accounting principle ÏÏÏÏÏÏÏ 1,969 1,229 1,403 1,125Cumulative eÅect of change in accounting principle, net of tax eÅectÏÏÏÏÏ Ì Ì Ì 168
Net income ÏÏÏÏÏÏÏÏÏÏÏÏÏÏÏÏÏÏÏÏÏÏÏÏÏÏÏÏÏÏÏÏÏÏÏÏÏÏÏÏÏÏÏÏÏÏÏÏÏÏÏÏÏ $ 1,969 $ 1,229 $1,403 $1,293
Preferred stock dividends ÏÏÏÏÏÏÏÏÏÏÏÏÏÏÏÏÏÏÏÏÏÏÏÏÏÏÏÏÏÏÏÏÏÏÏÏÏÏÏÏÏÏ (35) (35) (35) (33)
Net income available to common stockholders ÏÏÏÏÏÏÏÏÏÏÏÏÏÏÏÏÏÏÏÏÏÏÏÏ $ 1,934 $ 1,194 $1,368 $1,260
Diluted earnings per common share:Earnings before cumulative eÅect of change in accounting principle ÏÏÏÏ $ 1.92 $ 1.19 $ 1.36 $ 1.08Cumulative eÅect of change in accounting principle ÏÏÏÏÏÏÏÏÏÏÏÏÏÏÏÏÏ Ì Ì Ì .17
Net earnings ÏÏÏÏÏÏÏÏÏÏÏÏÏÏÏÏÏÏÏÏÏÏÏÏÏÏÏÏÏÏÏÏÏÏÏÏÏÏÏÏÏÏÏÏÏÏÏÏÏÏ $ 1.92 $ 1.19 $ 1.36 $ 1.25
Cash dividends per common share ÏÏÏÏÏÏÏÏÏÏÏÏÏÏÏÏÏÏÏÏÏÏÏÏÏÏÏÏÏÏÏÏÏÏ $ .30 $ .30 $ .30 $ .30
148

FANNIE MAEFINANCIAL AND STATISTICAL SUMMARY (Unaudited)
For the Year 2002 2001 2000 1999 1998
(Dollars in millions, except per common share amounts)
Summary Statements of Income:Interest income ÏÏÏÏÏÏÏÏÏÏÏÏÏÏÏÏÏÏÏÏÏÏÏÏÏÏÏÏ $ 50,853 $ 49,170 $ 42,781 $ 35,495 $ 29,995Interest expenseÏÏÏÏÏÏÏÏÏÏÏÏÏÏÏÏÏÏÏÏÏÏÏÏÏÏÏÏ (40,287) (41,080) (37,107) (30,601) (25,885)
Net interest income ÏÏÏÏÏÏÏÏÏÏÏÏÏÏÏÏÏÏÏÏÏÏÏÏ 10,566 8,090 5,674 4,894 4,110Guaranty fee incomeÏÏÏÏÏÏÏÏÏÏÏÏÏÏÏÏÏÏÏÏÏÏÏÏ 1,816 1,482 1,351 1,282 1,229Fee and other income (expense), netÏÏÏÏÏÏÏÏÏÏ 232 151 (44) 191 275Provision for losses ÏÏÏÏÏÏÏÏÏÏÏÏÏÏÏÏÏÏÏÏÏÏÏÏÏ (128) (94) (122) (151) (245)Foreclosed property income (expense)ÏÏÏÏÏÏÏÏÏ 36 16 28 24 (16)Administrative expenses ÏÏÏÏÏÏÏÏÏÏÏÏÏÏÏÏÏÏÏÏÏ (1,219) (1,017) (905) (800) (708)Special contribution ÏÏÏÏÏÏÏÏÏÏÏÏÏÏÏÏÏÏÏÏÏÏÏÏ Ì (300) Ì Ì ÌPurchased options expense ÏÏÏÏÏÏÏÏÏÏÏÏÏÏÏÏÏÏÏ (4,545) (37) Ì Ì ÌDebt extinguishments (loss) gain, net ÏÏÏÏÏÏÏÏÏ (710) (524) 49 (14) (40)
Income before federal income taxes andcumulative eÅect of change in accountingprinciple ÏÏÏÏÏÏÏÏÏÏÏÏÏÏÏÏÏÏÏÏÏÏÏÏÏÏÏÏÏÏÏÏ 6,048 7,767 6,031 5,426 4,605
Provision for federal income taxesÏÏÏÏÏÏÏÏÏÏÏÏÏ (1,429) (2,041) (1,583) (1,514) (1,187)
Income before cumulative eÅect of change inaccounting principle ÏÏÏÏÏÏÏÏÏÏÏÏÏÏÏÏÏÏÏÏÏÏ 4,619 5,726 4,448 3,912 3,418
Cumulative eÅect of change in accountingprinciple, net of tax eÅect ÏÏÏÏÏÏÏÏÏÏÏÏÏÏÏÏÏ Ì 168 Ì Ì Ì
Net income ÏÏÏÏÏÏÏÏÏÏÏÏÏÏÏÏÏÏÏÏÏÏÏÏÏÏÏÏÏÏÏ $ 4,619 $ 5,894 $ 4,448 $ 3,912 $ 3,418
Preferred stock dividends ÏÏÏÏÏÏÏÏÏÏÏÏÏÏÏÏÏÏÏÏ (99) (138) (121) (78) (66)
Net income available to common stockholders ÏÏ $ 4,520 $ 5,756 $ 4,327 $ 3,834 $ 3,352
Basic earnings per common share:Earnings before cumulative eÅect of change in
accounting principle ÏÏÏÏÏÏÏÏÏÏÏÏÏÏÏÏÏÏÏÏÏÏ $ 4.56 $ 5.58 $ 4.31 $ 3.75 $ 3.26Cumulative eÅect of change in accounting
principle ÏÏÏÏÏÏÏÏÏÏÏÏÏÏÏÏÏÏÏÏÏÏÏÏÏÏÏÏÏÏÏÏ Ì .17 Ì Ì Ì
Net earnings ÏÏÏÏÏÏÏÏÏÏÏÏÏÏÏÏÏÏÏÏÏÏÏÏÏÏÏÏÏÏ $ 4.56 $ 5.75 $ 4.31 $ 3.75 $ 3.26
Diluted earnings per common share:Earnings before cumulative eÅect of change in
accounting principle ÏÏÏÏÏÏÏÏÏÏÏÏÏÏÏÏÏÏÏÏÏÏ $ 4.53 $ 5.55 $ 4.29 $ 3.72 $ 3.23Cumulative eÅect of change in accounting
principle ÏÏÏÏÏÏÏÏÏÏÏÏÏÏÏÏÏÏÏÏÏÏÏÏÏÏÏÏÏÏÏÏ Ì .17 Ì Ì Ì
Net earnings ÏÏÏÏÏÏÏÏÏÏÏÏÏÏÏÏÏÏÏÏÏÏÏÏÏÏÏÏÏÏ $ 4.53 $ 5.72 $ 4.29 $ 3.72 $ 3.23
Cash dividends per common share ÏÏÏÏÏÏÏÏÏÏÏÏÏÏ $ 1.32 $ 1.20 $ 1.12 $ 1.08 $ .96Mortgages purchased:
Single-family ÏÏÏÏÏÏÏÏÏÏÏÏÏÏÏÏÏÏÏÏÏÏÏÏÏÏÏÏÏÏ $ 363,149 $ 262,440 $ 149,674 $ 191,642 $185,863Multifamily ÏÏÏÏÏÏÏÏÏÏÏÏÏÏÏÏÏÏÏÏÏÏÏÏÏÏÏÏÏÏÏ 7,492 8,144 4,557 3,568 2,585
Total mortgages purchasedÏÏÏÏÏÏÏÏÏÏÏÏÏÏÏÏÏ $ 370,641 $ 270,584 $ 154,231 $ 195,210 $188,448
Average net yield on mortgages purchased ÏÏÏ 5.92% 6.56% 7.62% 6.88% 6.61%Debt issued:
Short-term debtÏÏÏÏÏÏÏÏÏÏÏÏÏÏÏÏÏÏÏÏÏÏÏÏÏÏÏÏ $1,635,919 $1,756,691 $1,143,131 $1,136,001 $695,495Long-term debt ÏÏÏÏÏÏÏÏÏÏÏÏÏÏÏÏÏÏÏÏÏÏÏÏÏÏÏÏ 238,467 249,352 110,215 139,020 147,430
Total ÏÏÏÏÏÏÏÏÏÏÏÏÏÏÏÏÏÏÏÏÏÏÏÏÏÏÏÏÏÏÏÏÏÏÏ $1,874,386 $2,006,043 $1,253,346 $1,275,021 $842,925
Average cost of debt issued ÏÏÏÏÏÏÏÏÏÏÏÏÏÏÏÏÏÏ 2.21% 3.97% 6.34% 5.33% 5.49%MBS issues acquired by others ÏÏÏÏÏÏÏÏÏÏÏÏÏÏÏÏÏ $ 478,260 $ 344,739 $ 105,407 $ 174,850 $220,723
149

FANNIE MAEFINANCIAL AND STATISTICAL SUMMARY (Unaudited)
At December 31,
2002 2001 2000 1999 1998
(Dollars in millions, except per common share amounts)
Summary Balance Sheets:
Mortgage portfolio:
Mortgage-related securities:
Held-to-maturity ÏÏÏÏÏÏÏÏÏÏÏÏÏÏÏÏÏÏÏÏÏ $ 437,932 $ 509,155 $ 443,872 $ 365,749 $ 250,274
Available-for-sale ÏÏÏÏÏÏÏÏÏÏÏÏÏÏÏÏÏÏÏÏÏ 173,706 32,900 11,434 8,501 9,021
Total ÏÏÏÏÏÏÏÏÏÏÏÏÏÏÏÏÏÏÏÏÏÏÏÏÏÏÏÏÏ 611,638 542,055 455,306 374,250 259,295
Loans held-for-investmentÏÏÏÏÏÏÏÏÏÏÏÏÏÏÏÏ 185,652 165,917 152,437 149,101 155,774
Allowance for loan losses ÏÏÏÏÏÏÏÏÏÏ (79) (48) (51) (56) (79)
Unamortized premiums (discounts)and deferred price adjustments, net 337 (2,640) (209) (378) 360
Loans held-for-saleÏÏÏÏÏÏÏÏÏÏÏÏÏÏÏÏÏÏÏÏÏÏ 145 40 68 4 5
Mortgage portfolio, net ÏÏÏÏÏÏÏÏÏÏÏÏÏÏÏÏÏÏÏÏ 797,693 705,324 607,551 522,921 415,355
Other assets ÏÏÏÏÏÏÏÏÏÏÏÏÏÏÏÏÏÏÏÏÏÏÏÏÏÏÏÏÏ 89,822 94,624 67,673 52,387 69,791
Total assets ÏÏÏÏÏÏÏÏÏÏÏÏÏÏÏÏÏÏÏÏÏÏÏÏÏÏÏÏ $ 887,515 $ 799,948 $ 675,224 $ 575,308 $ 485,146
Debentures, notes, and bonds, net:
Due within one yearÏÏÏÏÏÏÏÏÏÏÏÏÏÏÏÏÏÏÏÏÏ $ 382,412 $ 343,492 $ 280,322 $ 226,582 $ 205,413
Due after one year ÏÏÏÏÏÏÏÏÏÏÏÏÏÏÏÏÏÏÏÏÏÏ 468,570 419,975 362,360 321,037 254,878
Total debentures, notes, and bonds, netÏÏÏ 850,982 763,467 642,682 547,619 460,291
Guaranty liability for MBSÏÏÏÏÏÏÏÏÏÏÏÏÏÏÏÏÏ 729 755 755 745 720
Other liabilitiesÏÏÏÏÏÏÏÏÏÏÏÏÏÏÏÏÏÏÏÏÏÏÏÏÏÏÏ 19,516 17,608 10,949 9,315 8,682
Total liabilities ÏÏÏÏÏÏÏÏÏÏÏÏÏÏÏÏÏÏÏÏÏÏÏÏÏ 871,227 781,830 654,386 557,679 469,693
Stockholders' equityÏÏÏÏÏÏÏÏÏÏÏÏÏÏÏÏÏÏÏÏÏÏÏ 16,288 18,118 20,838 17,629 15,453
Total liabilities and stockholders' equity ÏÏÏÏ $ 887,515 $ 799,948 $ 675,224 $ 575,308 $ 485,146
Core capitalÏÏÏÏÏÏÏÏÏÏÏÏÏÏÏÏÏÏÏÏÏÏÏÏÏÏÏÏÏÏÏÏ $ 28,079 $ 25,182 $ 20,827 $ 17,876 $ 15,465
Excess of core capital over minimum capital ÏÏÏÏ 877 1,000 533 106 131
Excess of core capital over required criticalcapital ÏÏÏÏÏÏÏÏÏÏÏÏÏÏÏÏÏÏÏÏÏÏÏÏÏÏÏÏÏÏÏÏÏÏ 14,199 12,859 10,490 8,748 7,602
Yield on net mortgage portfolio ÏÏÏÏÏÏÏÏÏÏÏÏÏÏÏ 6.45% 6.95% 7.24% 7.08% 7.12%
Yield on total interest earning assets ÏÏÏÏÏÏÏÏÏÏÏ 6.13 6.53 7.21 7.01 6.95
Cost of debt outstanding ÏÏÏÏÏÏÏÏÏÏÏÏÏÏÏÏÏÏÏÏÏ 4.81 5.49 6.47 6.18 6.10
Book value per common share ÏÏÏÏÏÏÏÏÏÏÏÏÏÏÏÏ $ 13.76 $ 15.86 $ 18.58 $ 16.02 $ 13.95
Common shares outstanding ÏÏÏÏÏÏÏÏÏÏÏÏÏÏÏÏÏÏ 989 997 999 1,019 1,025
Outstanding MBS ÏÏÏÏÏÏÏÏÏÏÏÏÏÏÏÏÏÏÏÏÏÏÏÏÏÏ $1,029,456 $ 858,867 $ 706,684 $ 679,169 $ 637,143
Book of businessÏÏÏÏÏÏÏÏÏÏÏÏÏÏÏÏÏÏÏÏÏÏÏÏÏÏÏÏ 1,820,256 1,564,034 1,314,083 1,201,949 1,052,366
150

Item 9. Changes in and Disagreements With Accountants on Accounting and Financial Disclosure
There were no changes in or disagreements with our accountants on accounting and Ñnancial disclosureduring the two most recent Ñscal years.
PART III
Item 10. Directors and Executive OÇcers of the Registrant
Information relating to directors and executive oÇcers of Fannie Mae is set forth under Item 5 of theForm 10 and incorporated by reference herein.
Section 16(a) BeneÑcial Ownership Reporting Compliance
During 2002, no Fannie Mae executive oÇcer or director failed to Ñle any report required bySection 16(a) with respect to equity securities of Fannie Mae on a timely basis.
Item 11. Executive Compensation
Information on certain transactions with directors and indebtedness of executive oÇcers is set forth underItem 6 of the Form 10 and incorporated by reference herein.
Item 12. Security Ownership of Certain BeneÑcial Owners and Management and Related StockholderMatters
Information about the beneÑcial ownership of Fannie Mae common stock by each Fannie Mae director,certain executive oÇcers, and by all directors and executive oÇcers as a group is set forth under Item 4 of theForm 10 and incorporated by reference herein.
The table setting forth information on our compensation plans under which common stock is authorizedfor issuance is set forth under Item 9 of the Form 10 and incorporated by reference herein. The materialfeatures of each plan are brieÖy described under Item 6 of the Form 10 and incorporated by reference herein.
Item 13. Certain Relationships and Related Transactions
Information about certain relationships and related transactions is set forth under Item 7 of the Form 10and incorporated by reference herein.
Item 14. Controls and Procedures
Franklin D. Raines, our Chairman of the Board of Directors and Chief Executive OÇcer, and J. TimothyHoward, our Executive Vice President and Chief Financial OÇcer, have evaluated Fannie Mae's disclosurecontrols and procedures, as deÑned in Rule 13a-14(c), within 90 days of the Ñling date of this Annual Reportand concluded that they have been eÅective. Mr. Raines and Mr. Howard have also indicated that there wereno signiÑcant changes in Fannie Mae's internal controls or in other factors that could signiÑcantly aÅectinternal controls subsequent to the date of their most recent evaluation, including any corrective actions withregard to signiÑcant deÑciencies and material weaknesses.
151

PART IV
Item 15. Exhibits, Financial Statement Schedules and Reports on Form 8-K
(a) Documents Ñled as part of this report
1. Financial Statements
The Ñnancial statements required to be Ñled as part of this report are contained in Item 8 beginningon page 103, and included in this report following page 103.
2. Financial Statement Schedules
The financial statement schedule required to be Ñled as part of this report is listed on page 103 andappears on page 148. All other schedules have been omitted because they are not required or are notapplicable or because the required information is included in the Financial Statements or the Notes.
3. Exhibits
An index to exhibits has been Ñled as part of this Report beginning on page E-1 and is incorporatedherein by reference.
(b) Reports on Form 8-K
Fannie Mae Ñled no reports on Form 8-K during the period covered by this Report.
152

SIGNATURES
Pursuant to the requirements of Section 13 or 15(d) of the Securities Exchange Act of 1934, theregistrant has duly caused this report to be signed on its behalf by the undersigned, thereunto duly authorized.
FEDERAL NATIONAL MORTGAGE ASSOCIATION
Date: March 31, 2003 By: /s/ FRANKLIN D. RAINES
Franklin D. RainesChairman and Chief Executive OÇcer
Pursuant to the requirements of the Securities Exchange Act of 1934, this report has been signed belowby the following persons on behalf of the registrant and in the capacities and on the dates indicated.
Signature Title Date
/s/ FRANKLIN D. RAINES Chairman of the Board of Directors March 31, 2003and Chief Executive OÇcerFranklin D. Raines
/s/ J. TIMOTHY HOWARD Executive Vice President and Chief March 31, 2003Financial OÇcerJ. Timothy Howard
/s/ LEANNE G. SPENCER Senior Vice President and Controller March 31, 2003
Leanne G. Spencer
/s/ VICTOR H. ASHE Director March 31, 2003
Victor H. Ashe
/s/ STEPHEN B. ASHLEY Director March 31, 2003
Stephen B. Ashley
/s/ MOLLY H. BORDONARO Director March 31, 2003
Molly H. Bordonaro
/s/ KENNETH M. DUBERSTEIN Director March 31, 2003
Kenneth M. Duberstein
/s/ THOMAS P. GERRITY Director March 31, 2003
Thomas P. Gerrity
/s/ JAMIE S. GORELICK Vice Chair March 31, 2003
Jamie S. Gorelick
/s/ WILLIAM R. HARVEY Director March 31, 2003
William R. Harvey
/s/ MANUEL J. JUSTIZ Director March 31, 2003
Manuel J. Justiz
153

Signature Title Date
/s/ ANN MCLAUGHLIN KOROLOGOS Director March 31, 2003
Ann McLaughlin Korologos
/s/ FREDERIC V. MALEK Director March 31, 2003
Frederic V. Malek
/s/ DONALD B. MARRON Director March 31, 2003
Donald B. Marron
/s/ DANIEL H. MUDD Vice Chairman and Chief March 31, 2003Operating OÇcerDaniel H. Mudd
/s/ ANNE M. MULCAHY Director March 31, 2003
Anne M. Mulcahy
/s/ JOE K. PICKETT Director March 31, 2003
Joe K. Pickett
/s/ TAYLOR C. SEGUE, III Director March 31, 2003
Taylor C. Segue, III
/s/ H. PATRICK SWYGERT Director March 31, 2003
H. Patrick Swygert
154

CERTIFICATIONS
PURSUANT TO SECURITIES EXCHANGE ACT RULE 13a-14
I, Franklin D. Raines, certify that:
1. I have reviewed this annual report on Form 10-K of Fannie Mae (formally, the Federal NationalMortgage Association);
2. Based on my knowledge, this annual report does not contain any untrue statement of a materialfact or omit to state a material fact necessary to make the statements made, in light of the circumstancesunder which such statements were made, not misleading with respect to the period covered by this annualreport;
3. Based on my knowledge, the Ñnancial statements, and other Ñnancial information included inthis annual report, fairly present in all material respects the Ñnancial condition, results of operations andcash Öows of the registrant as of, and for, the periods presented in this annual report;
4. The registrant's other certifying oÇcers and I are responsible for establishing and maintainingdisclosure controls and procedures (as deÑned in Exchange Act Rules 13a-14 and 15d-14) for theregistrant and have:
(a) designed such disclosure controls and procedures to ensure that material informationrelating to the registrant, including its consolidated subsidiaries, is made known to us by otherswithin those entities, particularly during the period in which this annual report is being prepared;
(b) evaluated the eÅectiveness of the registrant's disclosure controls and procedures as of adate within 90 days prior to the Ñling date of this annual report (the ""Evaluation Date''); and
(c) presented in this annual report our conclusions abut the eÅectiveness of the disclosurecontrols and procedures based on our evaluation as of the Evaluation Date;
5. The registrant's other certifying oÇcers and I have disclosed, based on our most recentevaluation, to the registrant's auditors and the audit committee of the registrant's board of directors (orpersons performing the equivalent functions):
(a) all signiÑcant deÑciencies in the design or operation of internal controls which couldadversely aÅect the registrant's ability to record, process, summarize and report Ñnancial data andhave identiÑed for the registrant's auditors any material weaknesses in internal controls; and
(b) any fraud, whether or not material, that involves management or other employees whohave a signiÑcant role in the registrant's internal controls; and
6. The registrant's other certifying oÇcers and I have indicated in this annual report whether therewere signiÑcant changes in internal controls or in other factors that could signiÑcantly aÅect internalcontrols subsequent to the date of our most recent evaluation, including any corrective actions with regardto signiÑcant deÑciencies and material weaknesses.
/s/ FRANKLIN D. RAINES
Franklin D. RainesChairman of the Board of Directors and
Chief Executive OÇcer
Date: March 31, 2003
155

I, J. Timothy Howard, certify that:
1. I have reviewed this annual report on Form 10-K of Fannie Mae (formally, the Federal NationalMortgage Association);
2. Based on my knowledge, this annual report does not contain any untrue statement of a materialfact or omit to state a material fact necessary to make the statements made, in light of the circumstancesunder which such statements were made, not misleading with respect to the period covered by this annualreport;
3. Based on my knowledge, the Ñnancial statements, and other Ñnancial information included inthis annual report, fairly present in all material respects the Ñnancial condition, results of operations andcash Öows of the registrant as of, and for, the periods presented in this annual report;
4. The registrant's other certifying oÇcers and I are responsible for establishing and maintainingdisclosure controls and procedures (as deÑned in Exchange Act Rules 13a-14 and 15d-14) for theregistrant and have:
(a) designed such disclosure controls and procedures to ensure that material informationrelating to the registrant, including its consolidated subsidiaries, is made known to us by otherswithin those entities, particularly during the period in which this annual report is being prepared;
(b) evaluated the eÅectiveness of the registrant's disclosure controls and procedures as of adate within 90 days prior to the Ñling date of this annual report (the ""Evaluation Date''); and
(c) presented in this annual report our conclusions abut the eÅectiveness of the disclosurecontrols and procedures based on our evaluation as of the Evaluation Date;
5. The registrant's other certifying oÇcers and I have disclosed, based on our most recentevaluation, to the registrant's auditors and the audit committee of the registrant's board of directors (orpersons performing the equivalent functions):
(a) all signiÑcant deÑciencies in the design or operation of internal controls which couldadversely aÅect the registrant's ability to record, process, summarize and report Ñnancial data andhave identiÑed for the registrant's auditors any material weaknesses in internal controls; and
(b) any fraud, whether or not material, that involves management or other employees whohave a signiÑcant role in the registrant's internal controls; and
6. The registrant's other certifying oÇcers and I have indicated in this annual report whether therewere signiÑcant changes in internal controls or in other factors that could signiÑcantly aÅect internalcontrols subsequent to the date of our most recent evaluation, including any corrective actions with regardto signiÑcant deÑciencies and material weaknesses.
/s/ J. TIMOTHY HOWARD
J. Timothy HowardExecutive Vice President and Chief
Financial OÇcer
Date: March 31, 2003
156

6,000,000 Shares
5.125% Non-Cumulative Preferred Stock, Series L(stated value $50 per share)
OFFERING CIRCULAR
Lehman Brothers
Goldman, Sachs & Co.
Bear, Stearns & Co. Inc.
Deutsche Bank Securities
Utendahl Capital Partners, L.P.