Embed Size (px)
Citation preview

Investor Relations 2019
2
Total Solution Provider
2
This Presentation is written by DOHWA Engineering co.,Ltd. for the purpose of offering information to investors.
Please aware that copy and redistribution of this material is prohibited.
The company does not make any representation or accept liability, as to the accuracy or completeness of the information
contained in this material. The format and contents of this document are subject to change for future filings and reports.
DOHWA is not liable for providing future updates on all figures included in this document.
Disclaimers

3
Total Solution Provider1. Introduction of DOHWA
3
u DOHWA Engineering Co.,Ltd.• CEO : Kim Young Yoon, Park Seung Woo
Ro Jin Myung, Kwak Jun Sang• Established Date : 1957. 08. 15• IPO Date : 2010. 08. 12• Address : 438, Samseong-ro, Gangnam-gu,
Seoul, Republic of Korea• Capital : 16.86 billion won• Financial outcome : Revenue → 402.5 billion won
Operating Profit : 17.3 billion won(2018.12.31, Consolidated)
• Number of Employee : 2,049 (2018.12.31)(524 PE among 1,773Engineer)
u Main Business• Planning / Feasibility Study / Design /
Supervision / CM / EPC / O&M
u Global Networkž Operate 21 branch offices & corporation
world widež Performed multiple engineering projects mainly
financed by Multilateral Development Bank
(EDCF WB, ADB, IDB, AFDB)
u Mission : We value people and nature
u Vision : We design the world for the future of humanityKorea’s first to the world’s best. The 2020 ENR Top Rank
u Core Value : People, Collaboration, Creativity
• Water & Wastewater
• Urban planning / Design
• Railway
• Plant(Photovoltaics /Renewable Energy)
• Infrastructure(Water Resources/Road/Harbor/Transportation)
• Supervision/CM, EPC, O&M
Outline Business Sector
4
Total Solution Provider2. Business Process of Engineering
4
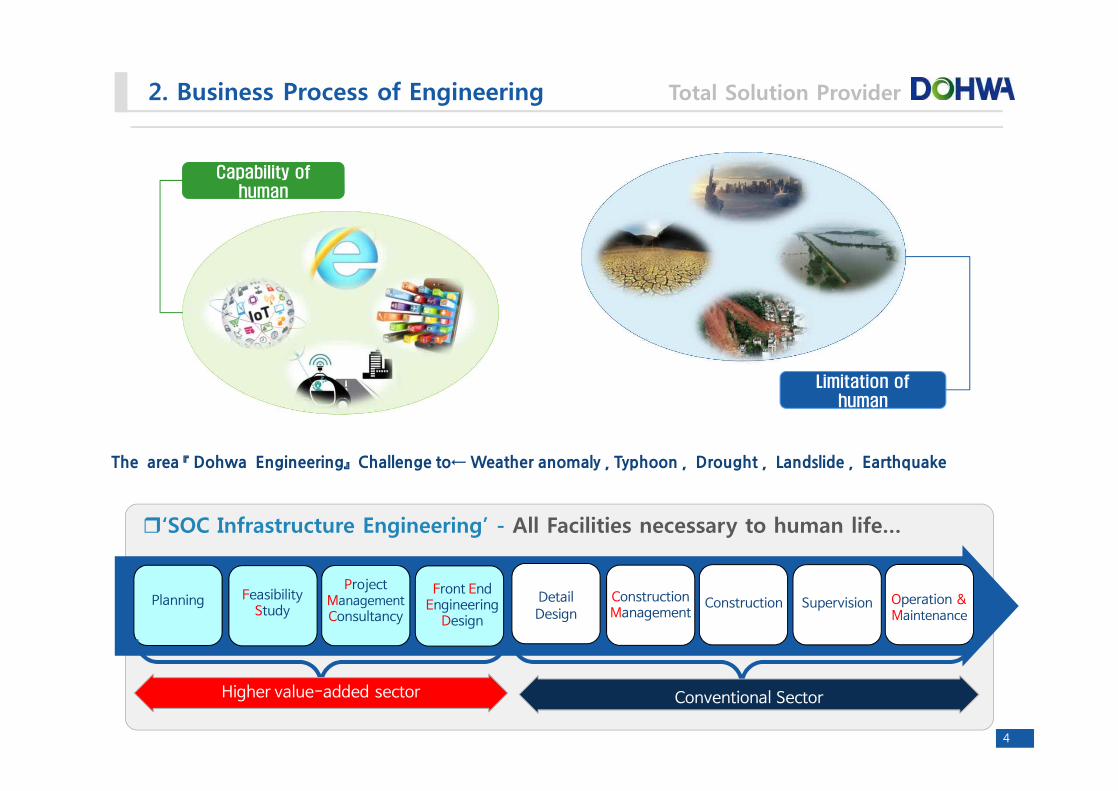
Capability of human
The��area�『 Dohwa Engineering』 Challenge�to←�Weather�anomaly ,�Typhoon ,��Drought ,��Landslide ,��Earthquake
Limitation of human
PlanningProject
ManagementConsultancy
Operation &Maintenance
r‘SOC Infrastructure Engineering’ - All Facilities necessary to human life…
Higher value-added sector Conventional Sector
DetailDesign
Construction SupervisionConstructionManagement
Feasibility Study
Front End Engineering
Design
5
Total Solution Provider3. Market Environment
5
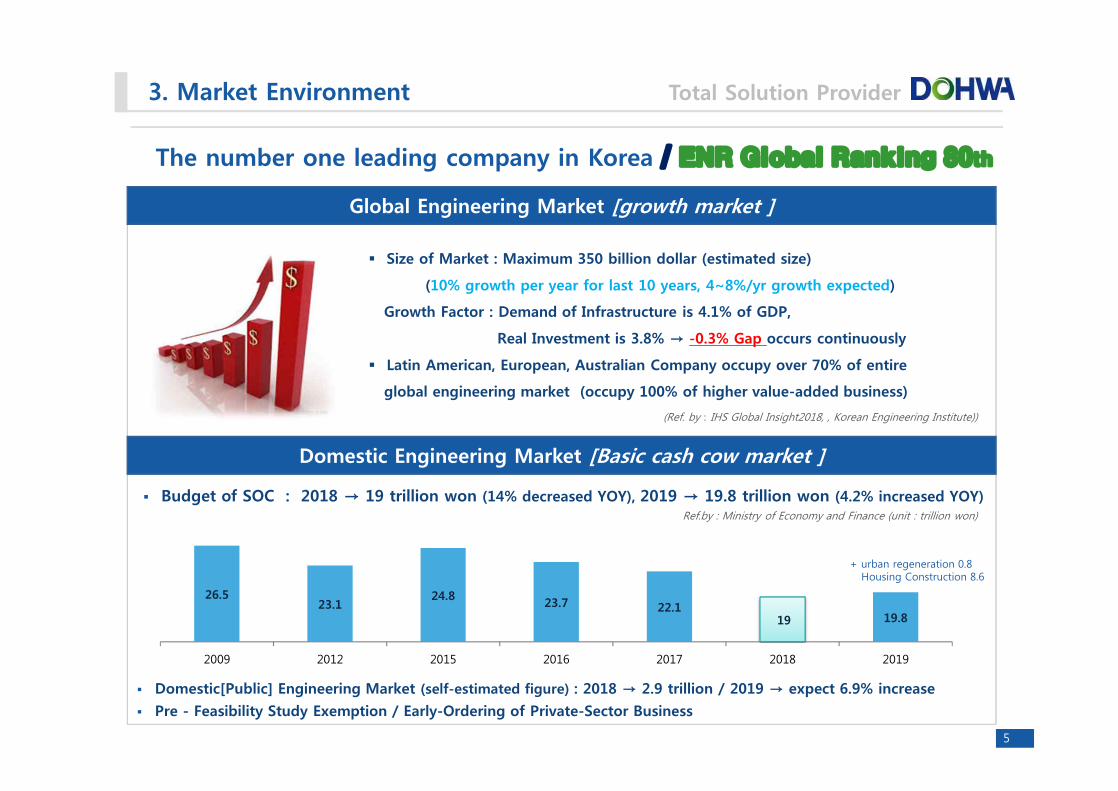
The number one leading company in Korea / ENR Global Ranking 80th
(Ref. by : IHS Global Insight2018, , Korean Engineering Institute))
Global Engineering Market [growth market ]
§ Size of Market : Maximum 350 billion dollar (estimated size)
(10% growth per year for last 10 years, 4~8%/yr growth expected)
Growth Factor : Demand of Infrastructure is 4.1% of GDP,
Real Investment is 3.8% → -0.3% Gap occurs continuously
§ Latin American, European, Australian Company occupy over 70% of entire
global engineering market (occupy 100% of higher value-added business)
Domestic Engineering Market [Basic cash cow market ]
26.523.1
24.8 23.7 22.119 19.8
2009 2012 2015 2016 2017 2018 2019
§ Budget of SOC : 2018 → 19 trillion won (14% decreased YOY), 2019 → 19.8 trillion won (4.2% increased YOY)Ref.by : Ministry of Economy and Finance (unit : trillion won)
+ urban regeneration 0.8Housing Construction 8.6
§ Domestic[Public] Engineering Market (self-estimated figure) : 2018 → 2.9 trillion / 2019 → expect 6.9% increase
§ Pre - Feasibility Study Exemption / Early-Ordering of Private-Sector Business

6
Total Solution Provider4. Performance in Global Market
6
High Growth in global engineering market ☞ Actively performed oversea projectsRemarkable results by each department
Water & Wastewater
Kathmandu Nepal/Water Supply System
Ethiopia /Kilinto Industrial Parks
Design/Supervision
Peru Lima/Metro Line2
Plant(Renewable Energy)
Indonesia BiomassFired Power
Japan Hamada/Photovoltaic
power generation
Nicaragua Juigalpa/Water supply system
Railway
Algeria Annaba/Orantram, Metro
Bangladesh/Akhaura-Laksam
Double Track Project
Algeria Constantine/River Improvementof Urban Zones
Pakistan/E-35
Expressway (57Km) Georgia Anaklia
Costal Development
Urban Supervision / CM
RoadWater Resources Harbor
ENR RANK
2018 80th
2017 105th
2016 135th

7
Total Solution Provider
7
5. Major Project by Business sector
Have Know-how by Performing 10000 cases of Infra Engineering ProjectPerformed Domestic/Oversea Mega project based on Global network
Division Project StatusOutlineProject Type Sum of Order
Water&
Wastewater
Railway
Plant
Infra
Managingpublically owned treatment works
O&M
300 billion won Per year
(seongnam sewerage- 7billion/y)
• Managing publically owned treatment works from Private enterprise• Market Size : 1.3 trillion won per year
Total21 project,
About 700billion(2014~2018)
GTX-A LinePrivate Business
Lead by FI
Working DesignBasic Design
(F/S, PM, SE and etc.)
• GTX-A Line PPP• Key role in first FI Business
7.55billion3.16billion
Renewable Energy,Biomass
EPCO&M
Actively promote Renewable Energy
Business
• Photovoltaics in Japan(EPC: 7 projects, O&M: 8 projects)
• QNY 40MW Solar Power Plant in Vietnam• Wando Wind Plant EPC• Gangneung Biomass EPC
EPC 31.78 billionO&M 13.08billon
EPC 6.2billionEPC 4.73billionEPC 4.07billion
IndonesiaHydroelectric
Power Generation
Strategic Investment
onEPC, O&M
Contract Upcoming• Construction/Operation of Siborpa / Tripa
100MW Hydroelectric Power Generation• Equity Participation in SPC with KOMIPO
30 biliionfor
Each EPC
(Unit: Won)

8
Total Solution Provider
• Maintain Domestic Market share/ Switch-over Basic cash flow
• Strategically Focus on Countries like Vietnam, Bangladesh, Indonesia,
Tanzania, Peru and etc.
• Secure New growth engines in renewable energy ; Solar, Wind, Biomass
• Expand to EPC, O&M Business based on Design, Supervision
• Strategic Approach to Investment Project lead by Financial Investor ;
GTX-A line → Pioneer PMC, FEED
• Projects for North Korea, Urban Regeneration and etc.
6. Strategy for Sustainable Growth
8
Diversion ofTarget Market
Strategic Approach
toward oversea
market
Portfolio Diversification
Advance to Private Market
Develop New Business
“Based on mission, vision, core value we will pioneer a global market which gives convenience for humanity”
9
Total Solution Provider7. Goal toward Sustainable growth
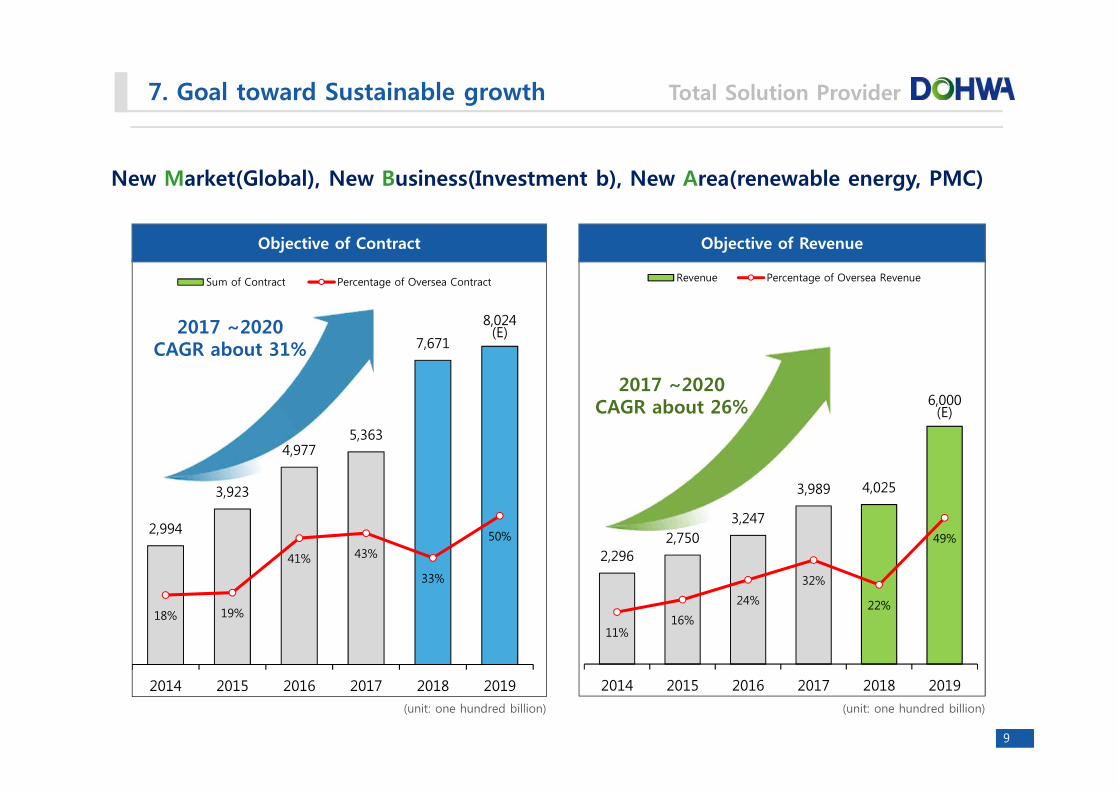
New Market(Global), New Business(Investment b), New Area(renewable energy, PMC)
9
2017 ~2020CAGR about 26%
2017 ~2020CAGR about 31%
(unit: one hundred billion)
2,2962,750
3,247
3,989 4,025
6,000(E)
11%16%
24%
32%
22%
49%
2014 2015 2016 2017 2018 2019
Revenue Percentage of Oversea Revenue
2,994
3,923
4,9775,363
7,671
8,024(E)
18% 19%
41% 43%
33%
50%
2014 2015 2016 2017 2018 2019
Sum of Contract Percentage of Oversea Contract
(unit: one hundred billion)
Objective of Contract Objective of Revenue
10
Total Solution Provider8. About Stock
10
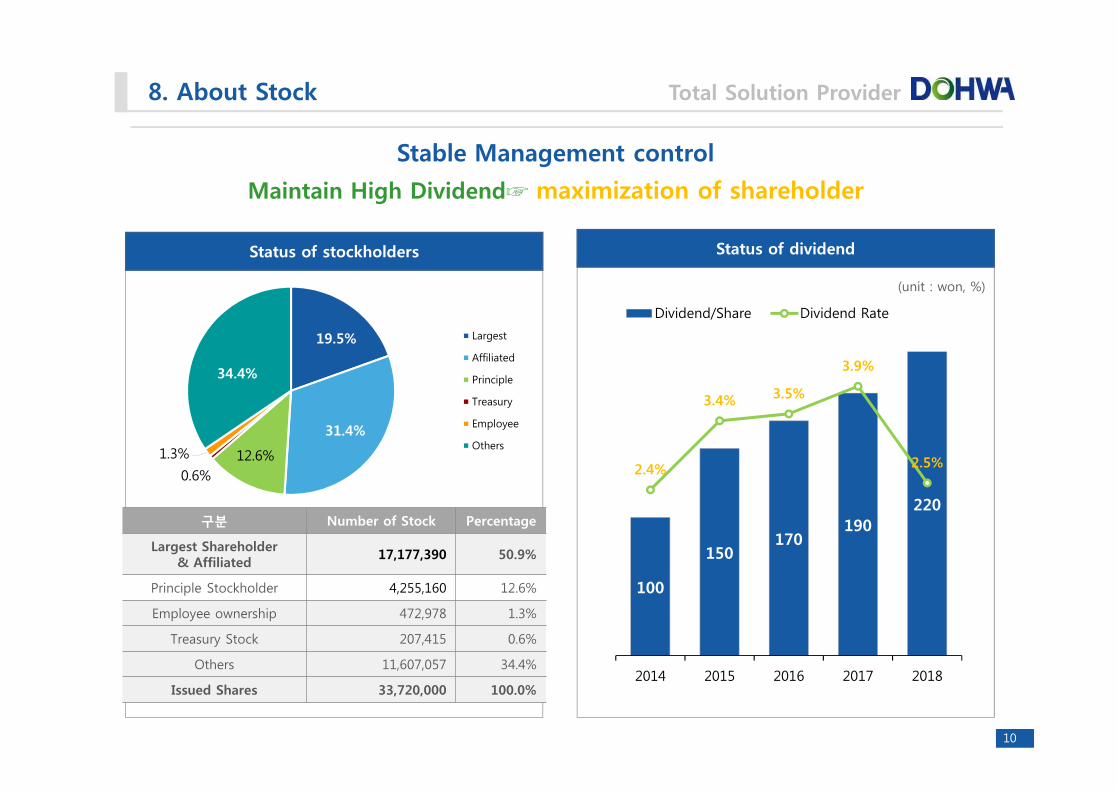
Stable Management control
Maintain High Dividend☞ maximization of shareholder
(unit : won, %)
Status of stockholders Status of dividend
구분 Number of Stock Percentage
Largest Shareholder& Affiliated
17,177,390 50.9%
Principle Stockholder 4,255,160 12.6%
Employee ownership 472,978 1.3%
Treasury Stock 207,415 0.6%
Others 11,607,057 34.4%
Issued Shares 33,720,000 100.0%
특수관계인25%
19.5%
31.4%
12.6%0.6%
1.3%
34.4%
Largest
Affiliated
Principle
Treasury
Employee
Others
100
150170
190220
2.4%
3.4% 3.5%
3.9%
2.5%
2014 2015 2016 2017 2018
Dividend/Share Dividend Rate
11
Total Solution Provider9. Business Outcome
11
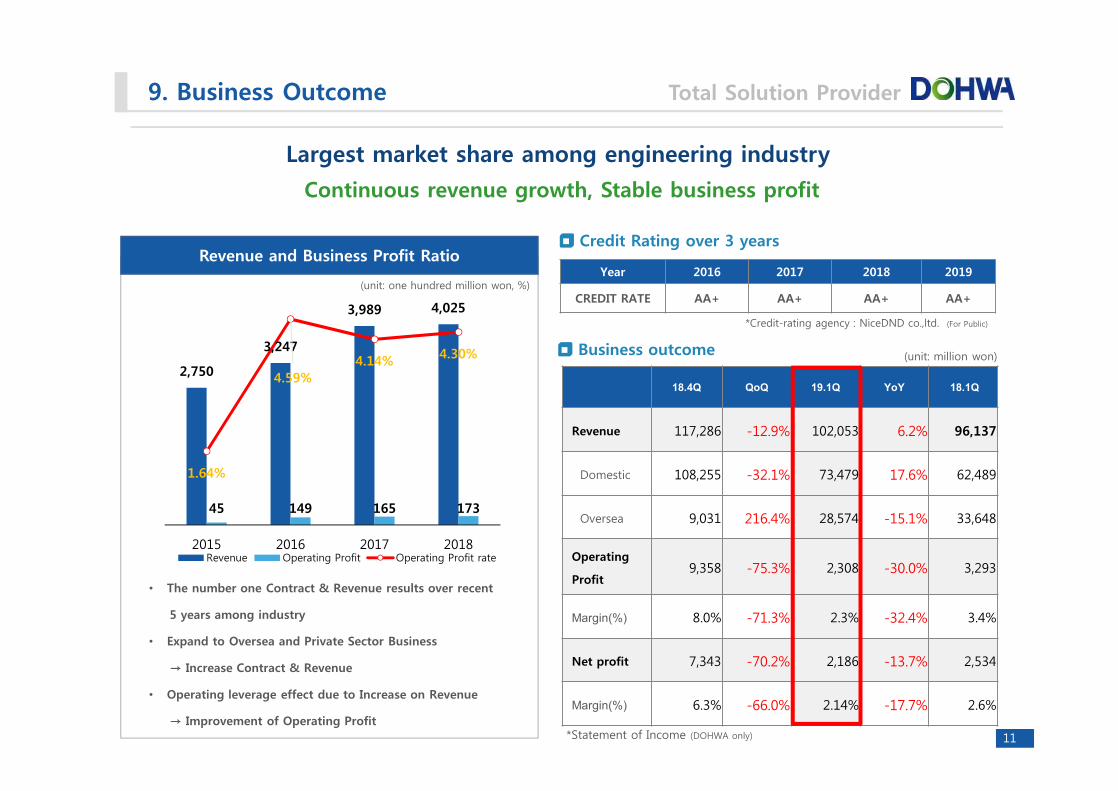
Largest market share among engineering industry
Continuous revenue growth, Stable business profit
(unit: one hundred million won, %)Year 2016 2017 2018 2019
CREDIT RATE AA+ AA+ AA+ AA+
18.4Q QoQ 19.1Q YoY 18.1Q
Revenue 117,286 -12.9% 102,053 6.2% 96,137
Domestic 108,255 -32.1% 73,479 17.6% 62,489
Oversea 9,031 216.4% 28,574 -15.1% 33,648
Operating
Profit9,358 -75.3% 2,308 -30.0% 3,293
Margin(%) 8.0% -71.3% 2.3% -32.4% 3.4%
Net profit 7,343 -70.2% 2,186 -13.7% 2,534
Margin(%) 6.3% -66.0% 2.14% -17.7% 2.6%
*Credit-rating agency : NiceDND co.,ltd. (For Public)
(unit: million won)
Revenue and Business Profit Ratio
• The number one Contract & Revenue results over recent
5 years among industry
• Expand to Oversea and Private Sector Business
→ Increase Contract & Revenue
• Operating leverage effect due to Increase on Revenue
→ Improvement of Operating Profit
r Business outcome
r Credit Rating over 3 years
2,750
3,247
3,989 4,025
45 149 165 173
1.64%
4.59%4.14% 4.30%
2015 2016 2017 2018Revenue Operating Profit Operating Profit rate
*Statement of Income (DOHWA only)

12
Total Solution Provider10. Financial Statement
12
short-term debt
long-term debt
TotalDebt
TotalCapital
Debt to Asset
4.6 38.6 43.1 3,760 1.15%
2016.12 2017.12 2018.12
Asset 308,514 328,595 375,922
Current Asset 99,393 112,724 156,080
Non-Current Asset 209,121 215,871 219,842
Liabilities 82,450 92,816 127,182
Current Liabilities 82,450 88,634 123,278
Non-Current Liabilities-
4,182 3,904
Equity 226,064 235,778 248,740
Capital 16,860 16,860 16,860
Capital Surplus 33,779 33,771 33,771
Earned Surplus 178,522 185,191 202,753
Financial Position
Current ratio 126.6%, Liabilities ratio 51.1%, Debt to Asset 1.15%
Maintain Industry-Leading Financial Reliability
(unit: million won) State of Debt
(Base Date : 2018.12.31, consolidated financial statement)
128.7%120.6%
127.2% 126.6%
73.4% 73.3% 71.8%66.2%
36.3% 36.5% 36.3%
51.1%
2015 2016 2017 2018
Current ratio Capital Ratio Liabilities ratio
(unit: one hundred million won)