Embed Size (px)
Citation preview

Investor Presentation
December 2015

Safe Harbor
All statements in this communication, other than those relating to historical facts, are “forward-looking statements” within the meaning of Section 21E of the Securities Exchange Act of 1934, as amended These forward-looking statements and projections are not guarantees of future performance and are subject to a number of assumptions, risks, projections and uncertainties, many of which are beyond our control, which could cause actual results to differ materially from such statements or projections. Important factors that could cause actual results to differ materially from our expectations include, among others: loss or impairment of business licenses or mining permits or concessions; natural disasters; failure to raise the water level in evaporation Pond 5 in the Dead Sea; accidents or disruptions at our seaport shipping facilities or regulatory restrictions affecting our ability to export our products overseas; labor disputes, slowdowns and strikes involving our employees; currency rate fluctuations; rising interest rates; general market, political or economic conditions in the countries in which we operate; pension and health insurance liabilities; price increases or shortages with respect to our principal raw materials; volatility of supply and demand and the impact of competition; changes to laws or regulations (including environmental protection and safety and tax laws or regulations), or the application or interpretation of such laws or regulations; government examinations or investigations; the difference between actual reserves and our reserve estimates; failure to integrate or realize expected benefits from acquisitions and joint ventures; volatility or crises in the financial markets; cyclicality of our businesses; changes in demand for our fertilizer products due to a decline in agricultural product prices, lack of available credit, weather conditions, government policies or other factors beyond our control; decreases in demand for bromine-based products and other industrial products; litigation, arbitration and regulatory proceedings; and war or acts of terror. More detailed information about factors that may affect our performance may be found in “Risk Factors” in our Annual Report Form 20-F filed with the U.S. Securities and Exchange Commission on March 20, 2015. Forward-looking statements and projections represent our views and are given only as of the date of this communication and we disclaim any obligation to update or revise them, whether as a result of new information, future events or otherwise, except as required by law.
All information included in this document speaks only as of the date on which they are made, and we do not undertake any obligation to update such information afterwards. Some of the market and industry information is based on independent industry publications or other publicly available information, while other information is based on internal studies. Although we believe that these independent sources and our internal data are reliable as of their respective dates, the information contained in them has not been independently verified and we can not assure you as to the accuracy or completeness of this information.
2
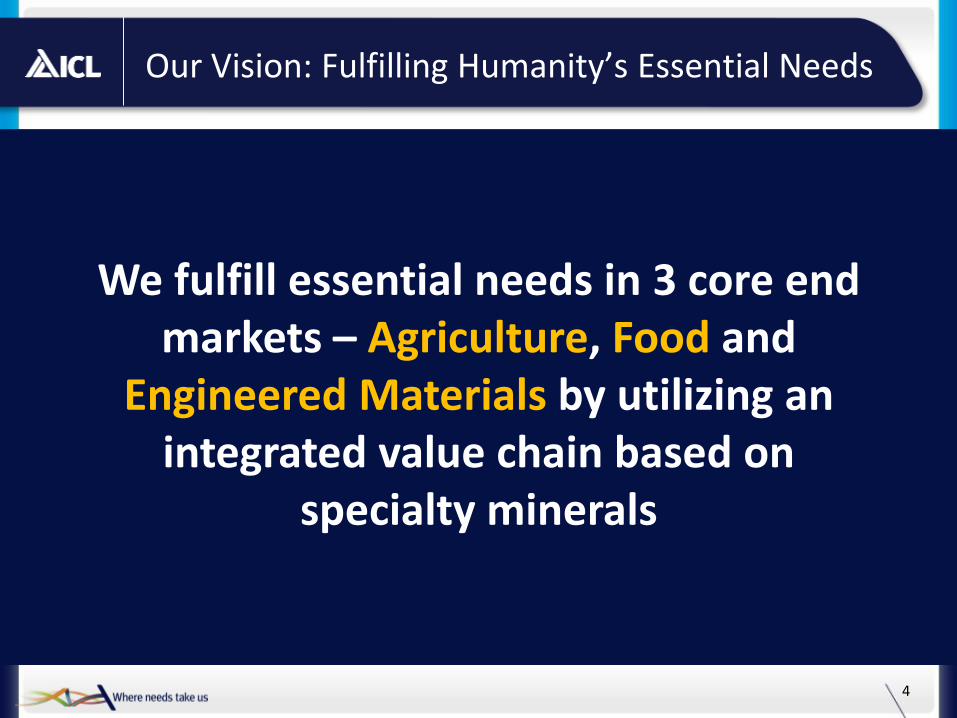
Our Vision: Fulfilling Humanity’s Essential Needs
4
Rise of the middle class and standard of living across the globe
Increased demand for and use of natural resources
Environmental stewardship and sustainability
We fulfill essential needs in 3 core end markets – Agriculture, Food and
Engineered Materials by utilizing an integrated value chain based on
specialty minerals

Strategy Highlights – Build Integrated Company Focused On Specialty End Markets
5
Unique business model – Global integrated value
chain into specialty markets
Grow core business – Organic growth, M&A
Operational excellence - Execute on $350M efficiency improvements
Balanced capital allocation and strong dividend yield
5

From Commodity Raw Materials to Specialty Products
6
End Markets
Flame Retardants
Industrial Solutions
Advanced Additives
~$470M ~$780M ~$650M
Food Specialties
~$530M
Segments
Business lines
Contribution to sales*
Potash Fertilizers
Phosphates Fertilizers
Specialty Fertilizers
~$1,820M ~$910M ~$770M
* In 2014, including inter-segment sales
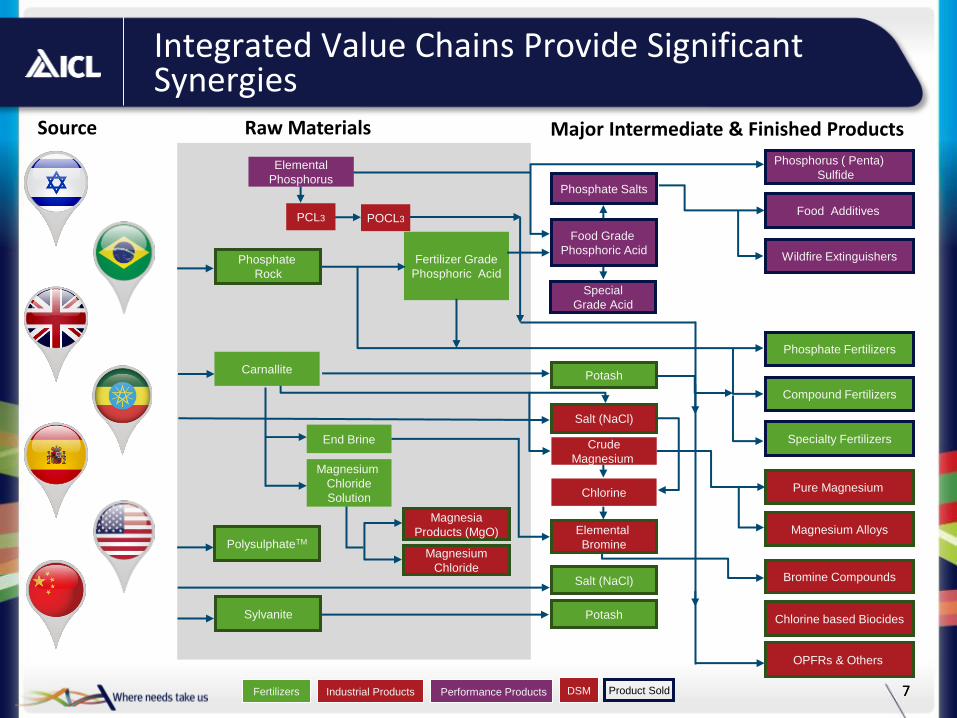
Integrated Value Chains Provide Significant Synergies
7 7
Phosphate Fertilizers
Fertilizer Grade
Phosphoric Acid
Food Grade
Phosphoric Acid
Salt (NaCl)
Phosphate Salts
Pure Magnesium
Magnesium Alloys
Compound Fertilizers
Salt (NaCl)
Potash
Specialty Fertilizers
Chlorine based Biocides
Bromine Compounds
Magnesium
Chloride
Solution
Magnesium
Chloride
Raw Materials
Potash
Sylvanite
Crude
Magnesium
Fertilizers Industrial Products Performance Products DSM Product Sold
End Brine
Elemental
Bromine
Phosphate
Rock
Chlorine
Elemental
Phosphorus
Special
Grade Acid
OPFRs & Others
Magnesia
Products (MgO)
Source Major Intermediate & Finished Products
Wildfire Extinguishers
Food Additives
Phosphorus ( Penta)
Sulfide
PolysulphateTM
Carnallite
PCL3 POCL3

Unique Portfolio of Mineral Assets – Providing Competitive Raw Materials
8
Logistical advantage - close to port of Barcelona
Vast reserves
Cost reduction initiatives
Significant expansion opportunities
Logistical advantage - close to Teesside port
PolysulphateTM –increase production to 1 million tonnes by 2020
Low CAPEX using existing infrastructure
Lower PolysulphateTM
production costs to double operating income with margins over 30% by 2020
ICL UK ICL Iberia
Dead Sea
Potash, Bromine Magnesium
Potash Potash PolysulphateTM
Low cost in potash, the world’s lowest in bromine
Near-infinite reserve life – potash and bromine
Logistical advantages – stockpiling ability, geographical position
Ongoing operational efficiency measures, including labor reduction
Integrated value chain highly biased towards value added specialty products
Successful efficiency and operational excellence plan executed at ICL Rotem
Negev Desert
Phosphate

Unique Portfolio of Mineral Assets – Providing Competitive Raw Materials
9
Logistical advantage - close to port of Barcelona
Vast reserves
Cost reduction initiatives
Significant expansion opportunities
Logistical advantage - close to Teesside port
PolysulphateTM –increase production to 1 million tonnes by 2020
Low CAPEX using existing infrastructure
Lower PolysulphateTM
production costs to double operating income with margins over 30% by 2020
ICL UK ICL Iberia
Dead Sea
Potash, Bromine Magnesium
Potash Potash PolysulphateTM
Low cost in potash, the world’s lowest in bromine
Near-infinite reserve life – potash and bromine
Logistical advantages – stockpiling ability, geographical position
Ongoing operational efficiency measures, including labor reduction
Integrated value chain highly biased towards value added specialty products
Successful efficiency and operational excellence plan executed at ICL Rotem
Negev Desert
Phosphate

Attractive Growing Specialty Business
10
Specialty Fertilizers Performance Products Enlarge Product Portfolio: R&D, Strategic Partners Establish production in attractive markets Reduce cost of production
Specialty Fertilizers
Estimated CAGR (organic) 2015-2019: 4-8%
Estimated CAPEX 2015-2019: $20-40 million p.a.
Core growth through R&D: potential 2020 sales contribution ~$150M, significant LT contribution
Margin expansion, pricing, advocacy, focus on customer unmet needs
Estimated CAGR (organic) 2015-2019: 2-4%
Estimated CAPEX 2015-2019: $60-75 million p.a.
Industrial Products
Advanced Additives: geographic expansion, product differentiation, Lean and reliable
Food Specialties: New products, geographical expansion, new ingredients and technologies through R&D
Estimated CAGR (organic) 2015-2019: 4-6%
Estimated CAPEX 2015-2019: $20-40 million p.a.
Performance Products
Executing on Our Business Strategy

Efficiency Initiatives Contribution – Segment Breakdown
12
USD millions/year
2016 efficiency gains run-rate of $350M Segment run-rate contribution*
2016E2015E2014A
ICL PP
ICL IP
Phosphatesand fertilizers
Potash
$240 million
$120 million
$350 million
Anticipated labor costs savings in 2015 ~$25 million*
Gross average yearly labor costs savings as of 2017
~$80 million*
Anticipated labor costs savings in 2016 ~$70 million*
Production cost efficiency
Procurement
HR
*Vs. 2013
*Labor cost reduction at ICL Dead Sea and ICL Neot Hovav

Operational Excellence Expected to Generate Accumulated Savings of Over $350M
13
400kt Dead Sea additional production
Labor reduction ~10% of workforce
Labor reduction at ICL UK
Cost per tonne reduction
Labor reduction of ~10%
YTD P2O5 production up by ~15%
Fertilizers & rock production up by ~10%
Operational Excellence initiatives implementation started in 2015
Labor at ICL’s bromine operations down by over 10% by 2018
Procurement and energy savings
Potash Phosphates Specialties
~ $120 million ~ $80 million ~ $60 million
Procurement and energy savings ~ $150 million
2016 EBITDA contribution*: 2016 EBITDA contribution*: 2016 EBITDA contribution*:
*Year end run-rate Vs. 2013

Reduced Cost for Phosphate Rock, Phosphoric Acid, and Phosphate Fertilizers
14
Cost reduction initiatives are bearing fruits
Potash –realized full cost per tonne sold* (indexed)
100% 98%
90% 86%
79%
GTSP Cost indexed ($/tonne FOB)
100% 110%
97% 89%
79%
White phosphoric Acid Cost indexed ($/tonne FOB)
83%
92% 99% 101% 100%
Phosphate Rock Cost indexed ($/tonne FOB)
100%
86%
76%
* Calculation based on adjusted full costs, including COGS, royalties, depreciation, freight and transportation, G&A, S&M.

1,196
960 ~990
910 ~ 940
2013 A 2014 A 2015 E 2016 E
ICL operating income ICL operating income - potash price effect
Balanced Business Model Supports Profitability Despite Potash Headwinds
15
ICL’s operating income adjusted to potash price developments
Specialty business, lower costs and cost reduction initiatives offset the negative impact of lower potash prices
US$ Million
~
~
~
~830
660
~890
1,100
Adjusted operating income Adjusted operating income – only potash price effect
16
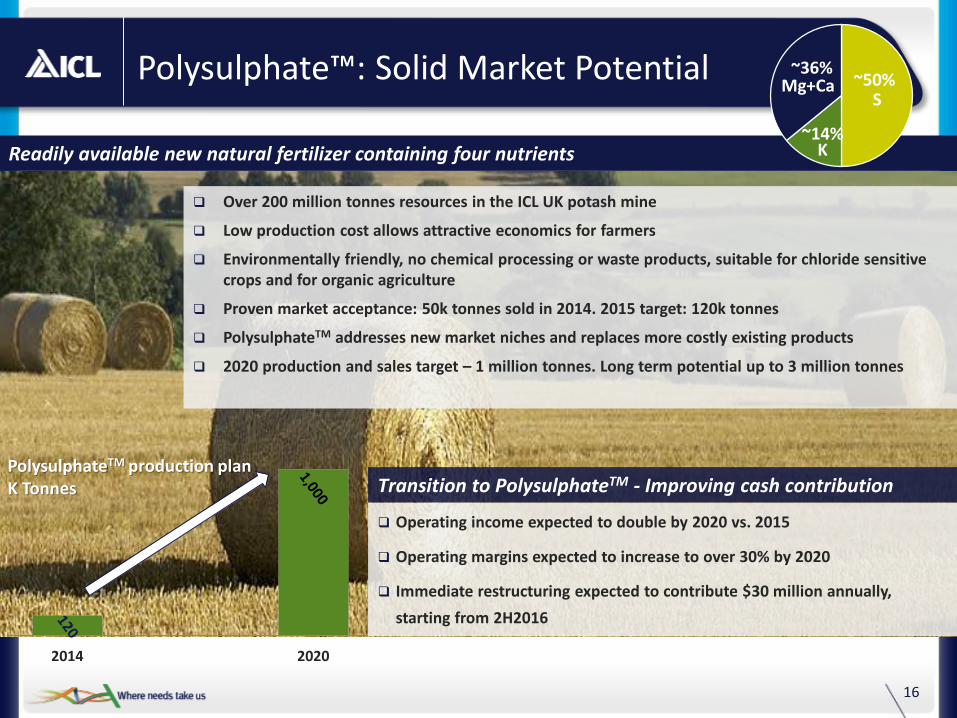
Polysulphate™: Solid Market Potential
Readily available new natural fertilizer containing four nutrients
~50%
~14% K
S
~36% Mg+Ca
Over 200 million tonnes resources in the ICL UK potash mine
Low production cost allows attractive economics for farmers
Environmentally friendly, no chemical processing or waste products, suitable for chloride sensitive crops and for organic agriculture
Proven market acceptance: 50k tonnes sold in 2014. 2015 target: 120k tonnes
PolysulphateTM addresses new market niches and replaces more costly existing products
2020 production and sales target – 1 million tonnes. Long term potential up to 3 million tonnes
2014 2020
PolysulphateTM production plan K Tonnes
Operating income expected to double by 2020 vs. 2015
Operating margins expected to increase to over 30% by 2020
Immediate restructuring expected to contribute $30 million annually,
starting from 2H2016
Transition to PolysulphateTM - Improving cash contribution
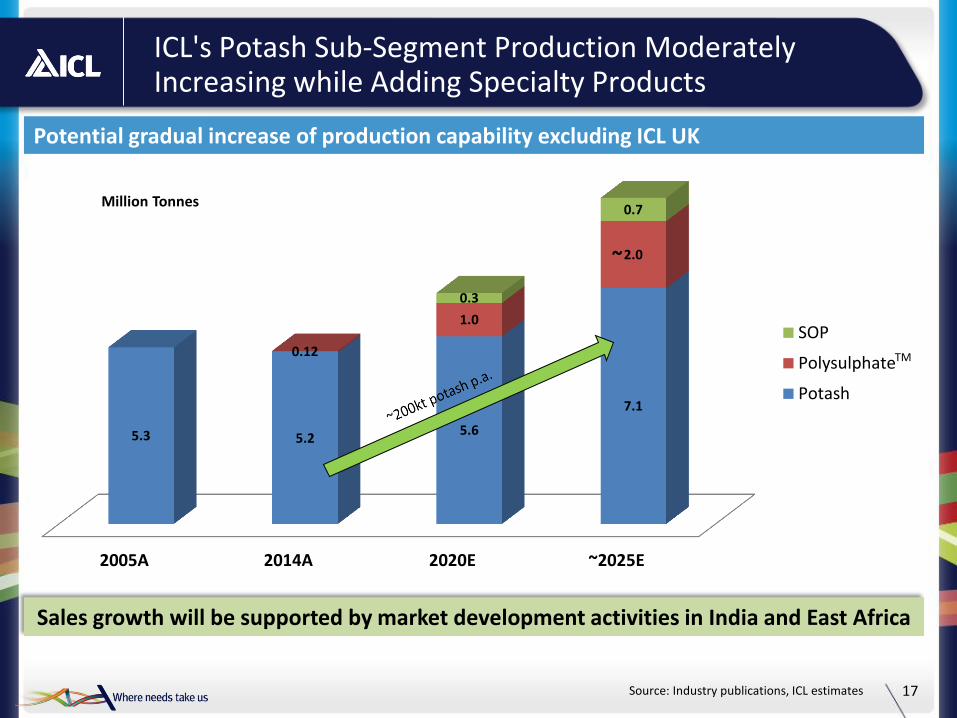
2005A 2014A 2020E ~2025E
5.3 5.2 5.6
7.1
0.12
1.0
2.0
0.3
0.7
SOP
Polysulphate
Potash
ICL's Potash Sub-Segment Production Moderately Increasing while Adding Specialty Products
17
Potential gradual increase of production capability excluding ICL UK
Source: Industry publications, ICL estimates
Sales growth will be supported by market development activities in India and East Africa
Million Tonnes
~
TM

ICL to Become a Leading Player in China’s Phosphate Sector
18
JV includes upstream mining, bulk fertilizers and downstream specialty businesses
R&D platform: 11 projects in Food, Engineered Materials, Agro and process improvement. Additional projects by year-end
A key milestone in our strategy:
I. increasing phosphate platform by more than 50%, securing long-term reserves
II. expanding phosphate end-to-end business model with a focus on Asia
III. transforming into the world’s leading specialty phosphate player
IV. improving cost competitiveness of our phosphate network
The JV in Numbers
~$180M in the JV Investment
~RMB2,900 (~$450M) in year 1 to ~RMB3,900 (~$600M) in year 5
Revenues
Break even to low single digits in year 1 to low teens in year 5
Operating Income Margins
About $340 million spread over 5 years Additional CAPEX
Change Total ICL* JV Production capability
63% 6.5mt 2.5mt Phosphate Rock
45% 2.7mt 850kt Commodity Fertilizers
15% 895kt 115kt Specialty Fertilizers
117% 1.3mt 700kt Phosphoric Acid
26% 290kt 60kt Purified Phosphoric Acid
64% 410kt 160kt - Incl. Expansion Plans
Formation of phosphate JV with Yunnan Yuntianhua completed:
* Including 100% of the JV’s production capability
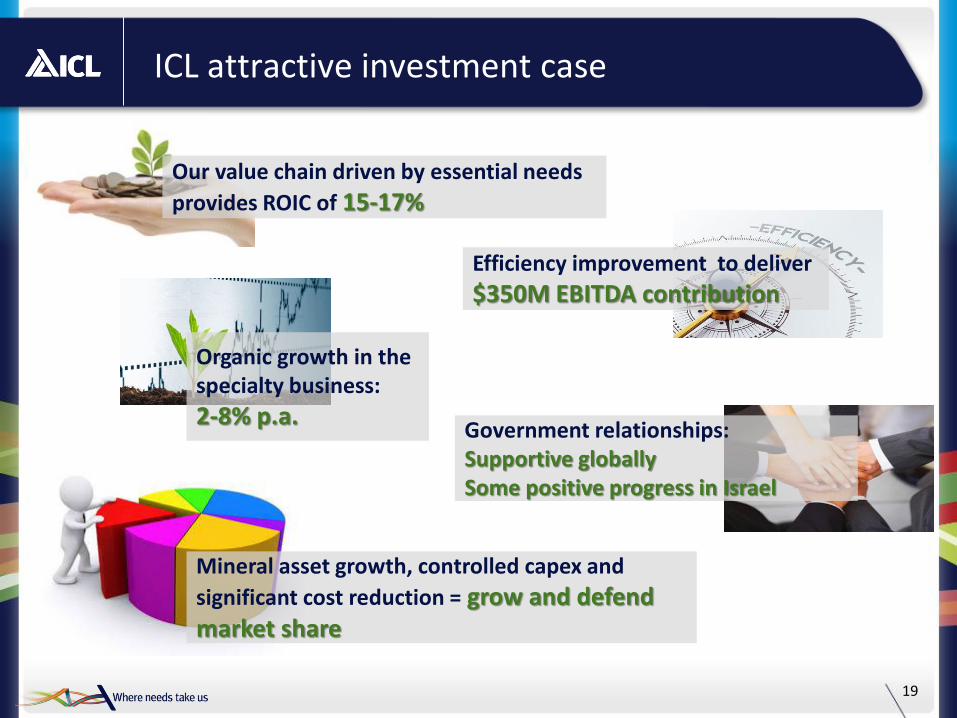
ICL attractive investment case
19
Our value chain driven by essential needs
provides ROIC of 15-17%
Efficiency improvement to deliver
$350M EBITDA contribution
Organic growth in the specialty business:
2-8% p.a. Government relationships: Supportive globally Some positive progress in Israel
Mineral asset growth, controlled capex and
significant cost reduction = grow and defend market share
Committed to Responsible Value Creation
Thank you
Appendices
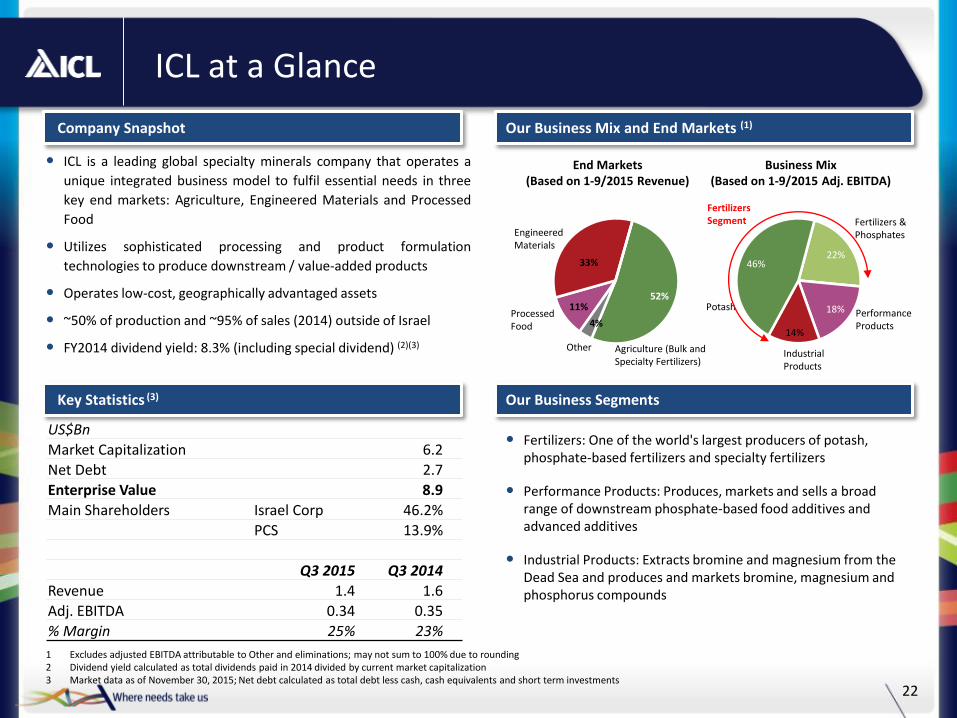
ICL at a Glance
22
ICL is a leading global specialty minerals company that operates a
unique integrated business model to fulfil essential needs in three
key end markets: Agriculture, Engineered Materials and Processed
Food
Utilizes sophisticated processing and product formulation
technologies to produce downstream / value-added products
Operates low-cost, geographically advantaged assets
~50% of production and ~95% of sales (2014) outside of Israel
FY2014 dividend yield: 8.3% (including special dividend) (2)(3)
Company Snapshot
Key Statistics (3) Our Business Segments
US$Bn
Market Capitalization 6.2
Net Debt 2.7
Enterprise Value 8.9
Main Shareholders Israel Corp 46.2%
PCS 13.9%
Q3 2015 Q3 2014
Revenue 1.4 1.6
Adj. EBITDA 0.34 0.35
% Margin 25% 23%
Fertilizers: One of the world's largest producers of potash, phosphate-based fertilizers and specialty fertilizers
Performance Products: Produces, markets and sells a broad range of downstream phosphate-based food additives and advanced additives
Industrial Products: Extracts bromine and magnesium from the Dead Sea and produces and markets bromine, magnesium and phosphorus compounds
22%
18%
14%
46%
Our Business Mix and End Markets (1)
Potash
Fertilizers & Phosphates
Industrial Products
Performance Products
52%
4%
11%
33%
Processed Food
Engineered Materials
Agriculture (Bulk and Specialty Fertilizers)
Fertilizers Segment
Business Mix (Based on 1-9/2015 Adj. EBITDA)
End Markets (Based on 1-9/2015 Revenue)
Other
1 Excludes adjusted EBITDA attributable to Other and eliminations; may not sum to 100% due to rounding 2 Dividend yield calculated as total dividends paid in 2014 divided by current market capitalization 3 Market data as of November 30, 2015; Net debt calculated as total debt less cash, cash equivalents and short term investments

Agriculture

Growth Factors - Fertilizers and Food Products
24
Meat Consumption
Population
Fertilizer consumption
1.0
2.0
3.0
4.0
5.0
6.0 Index, relative to 1962
Yield Growth Required to Meet World’s Food Needs Population, Meat and Fertilizers [Base 1962]
Source: IFA, USDA, USA Census
Diminishing arable land per capita

World Grains Production & Consumption
25 Grains and Pulses: Barley, Corn, Millet, Mixed Grain, Oats, Rice, Rye, Sorghum, Wheat
16.72%
19.80%
21.77%
16%
18%
20%
22%
24%
26%
28%
30%
32%
34%
36%
38%
1.4
1.5
1.6
1.7
1.8
1.9
2.0
2.1
2.2
2.3
2.4
2.5
Bill
ion
To
nn
e
Consumption Production Stock to Use
Sources: USDA, (Updated October 2015)
$1
$3
$5
$7
$9
$11
$13
$15
$17
CHICAGO BOARD OF TRADE (CBOT) CROP PRICES $/bushel
Corn
Rice
Soybean
Wheat
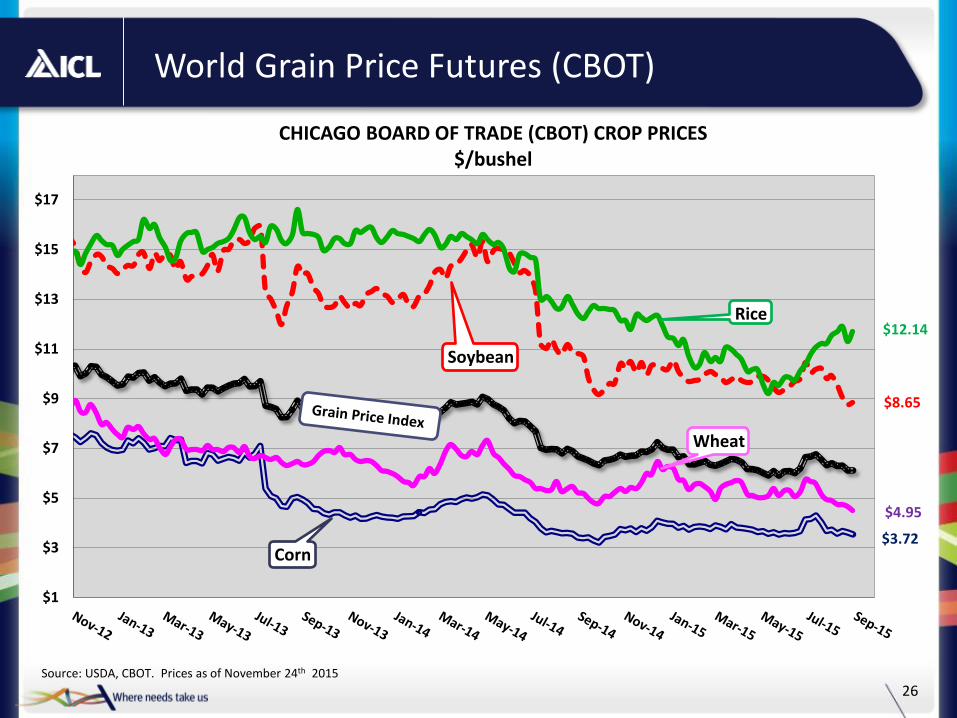
World Grain Price Futures (CBOT)
26 Source: USDA, CBOT. Prices as of November 24th 2015
$12.14
$4.95
$3.72
$8.65

27
Fertilizer Prices
Potash Prices
FOB Vancouver standard KCl
US$/t spot US$/t spot
Average DAP fob Tampa
Average GTSP, fob North Africa
Phosphate Prices
* Source: Fertilizer Week, prices as of November 19, 2015
FOB NOLA granular KCl
200
250
300
350
400
450
500
550
600
650
0
100
200
300
400
500
600
700

28
0.5
1.0
1.5
2.0
2.5
3.0
3.5
4.0
4.5
Ind
ex o
f Fe
rtili
zer
Pri
ce R
atio
to
GP
I Bas
e 20
02
MOP/GPI
DAP/GPI
Fertilizers are Affordable
*GPI = Grain Price Index formula: [(wheat price*7) + (maize price*8) + (rice price*4.5) + (soybean price*2.5)] /22]
Source: CBOT, Fertilizer Week & ICL
China China China
China China India
India India
India India
Brazil
Brazil
Brazil
Brazil
Brazil
USA
USA
USA
USA
USA
SE Asia
SE Asia
SE Asia
SE Asia
SE Asia
RoW
RoW
RoW
RoW
RoW China India
Brazil
RoW
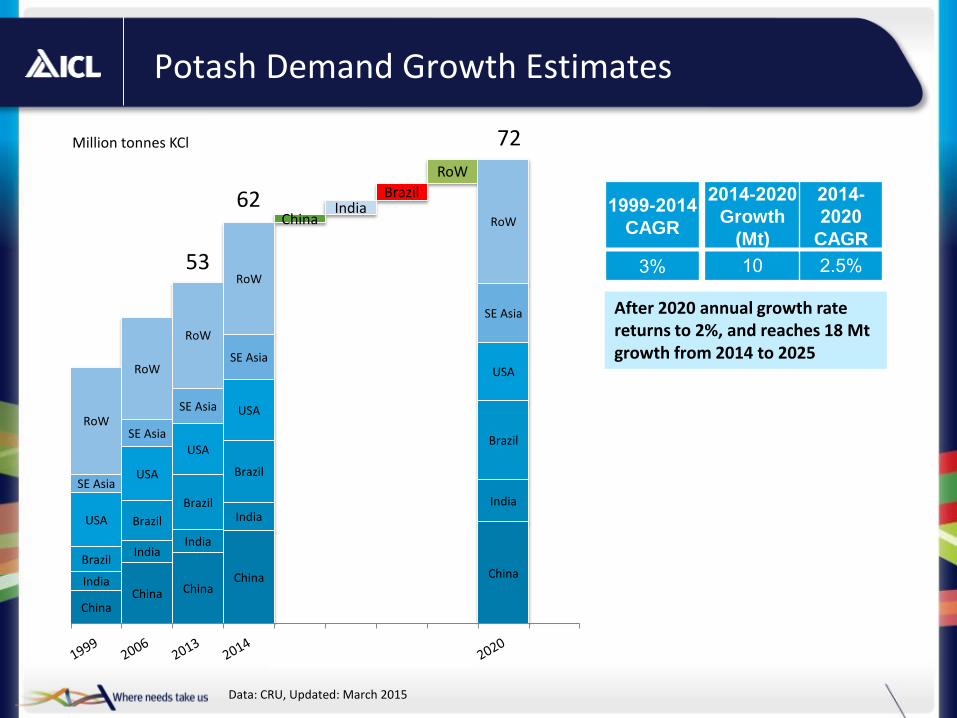
72
53
62
Potash Demand Growth Estimates
Data: CRU, Updated: March 2015
1999-2014
CAGR
2014-2020
Growth
(Mt)
2014-
2020
CAGR
3% 10 2.5%
After 2020 annual growth rate returns to 2%, and reaches 18 Mt growth from 2014 to 2025
Million tonnes KCl
62
72
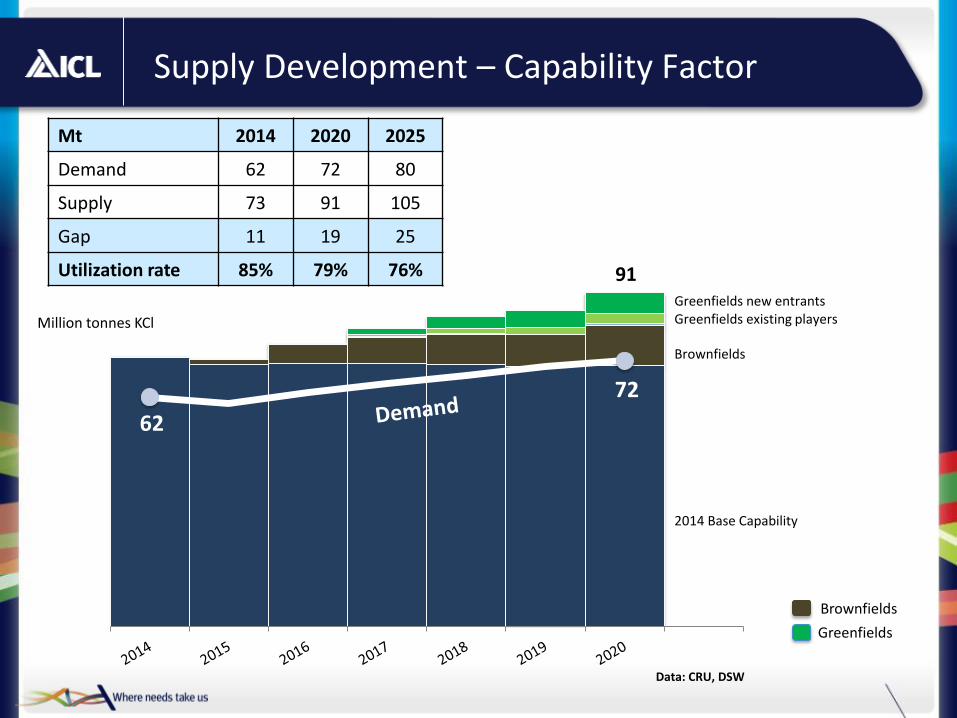
Supply Development – Capability Factor
Data: CRU, DSW
Brownfields
Greenfields
2014 Base Capability
Brownfields
Mt 2014 2020 2025
Demand 62 72 80
Supply 73 91 105
Gap 11 19 25
Utilization rate 85% 79% 76%
Greenfields new entrants Greenfields existing players
91
Million tonnes KCl
31
Agriculture
ICL Dead Sea
ICL Rotem
ICL Turkey
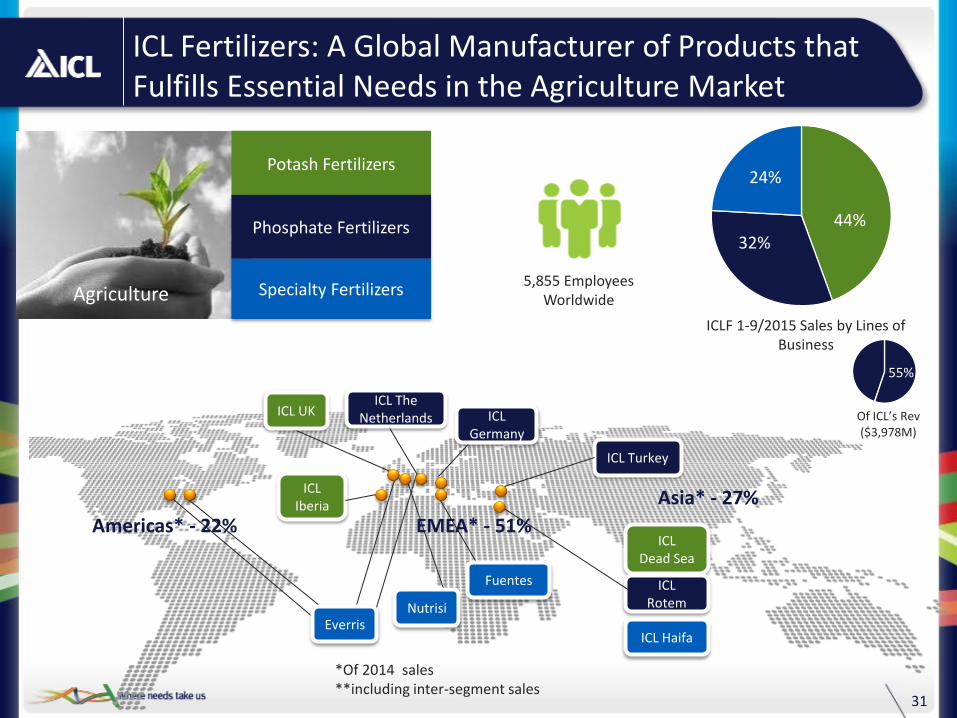
5,855 Employees Worldwide
ICL Haifa
ICL UK
ICL Iberia
ICL Germany
ICL The Netherlands
Fuentes
Nutrisi Everris
ICL Fertilizers: A Global Manufacturer of Products that Fulfills Essential Needs in the Agriculture Market
Potash Fertilizers
Phosphate Fertilizers
Specialty Fertilizers
44% 32%
24%
ICLF 1-9/2015 Sales by Lines of Business
Of ICL’s Rev ($3,978M)
55%
Americas* - 22%
Asia* - 27%
EMEA* - 51%
*Of 2014 sales **including inter-segment sales
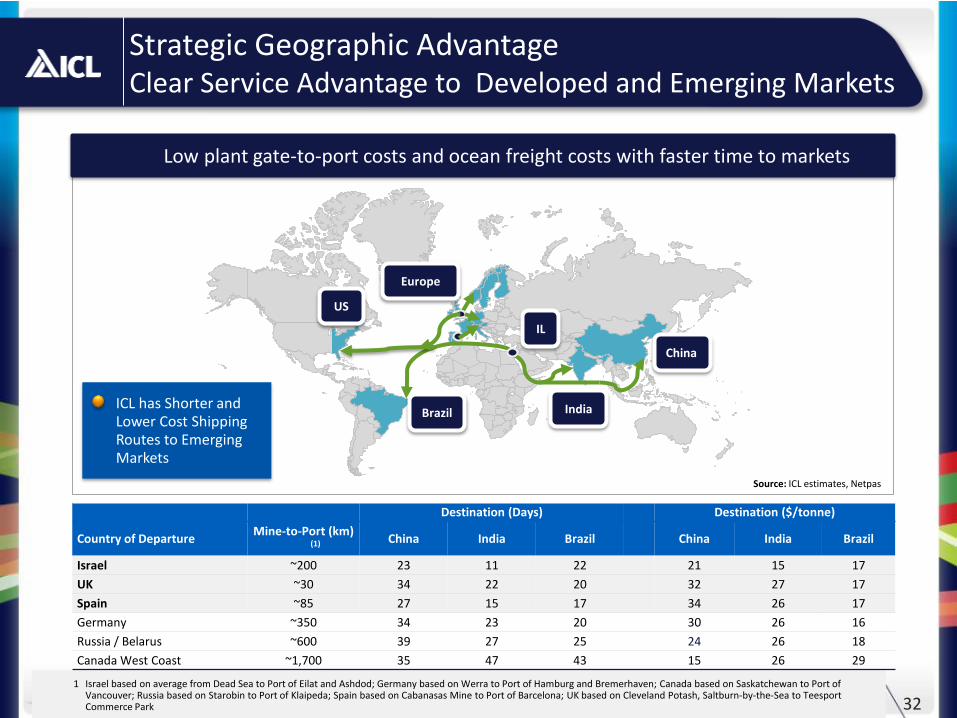
Strategic Geographic Advantage Clear Service Advantage to Developed and Emerging Markets
Destination (Days) Destination ($/tonne)
Country of Departure Mine-to-Port (km)
(1) China India Brazil China India Brazil
Israel ~200 23 11 22 21 15 17
UK ~30 34 22 20 32 27 17
Spain ~85 27 15 17 34 26 17
Germany ~350 34 23 20 30 26 16
Russia / Belarus ~600 39 27 25 24 26 18
Canada West Coast ~1,700 35 47 43 15 26 29
Source: ICL estimates, Netpas
China
India
IL
Europe
Brazil
US
Low plant gate-to-port costs and ocean freight costs with faster time to markets
• ICL has Shorter and Lower Cost Shipping Routes to Emerging Markets
32 1 Israel based on average from Dead Sea to Port of Eilat and Ashdod; Germany based on Werra to Port of Hamburg and Bremerhaven; Canada based on Saskatchewan to Port of
Vancouver; Russia based on Starobin to Port of Klaipeda; Spain based on Cabanasas Mine to Port of Barcelona; UK based on Cleveland Potash, Saltburn-by-the-Sea to Teesport Commerce Park
33
1
3
4
5
2
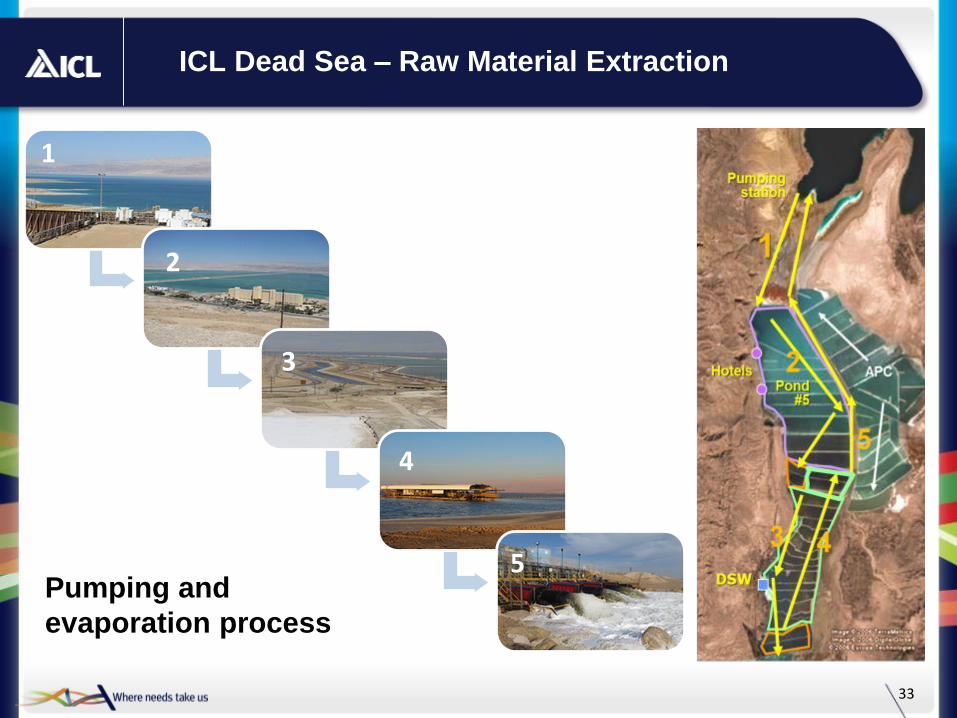
ICL Dead Sea – Raw Material Extraction
Pumping and
evaporation process
1
2
3
4
5
34
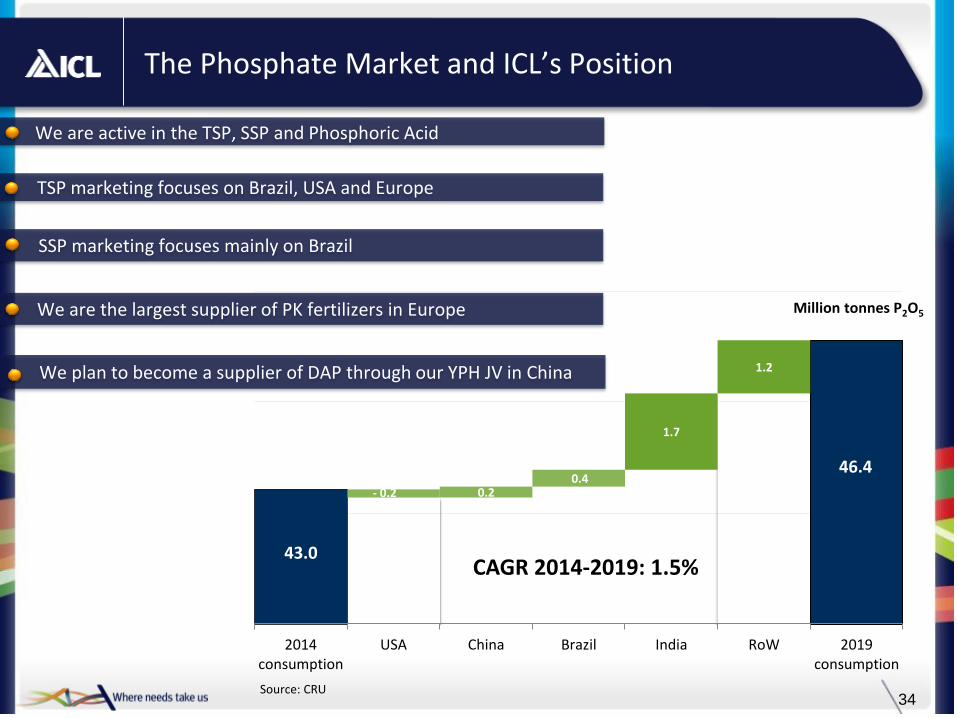
The Phosphate Market and ICL’s Position
43.0
46.4
- 0.2 0.2 0.4
1.7
1.2
2014consumption
USA China Brazil India RoW 2019consumption
Million tonnes P2O5
Source: CRU
We are active in the TSP, SSP and Phosphoric Acid
• TSP marketing focuses on Brazil, USA and Europe
SSP marketing focuses mainly on Brazil
• We are the largest supplier of PK fertilizers in Europe
• We plan to become a supplier of DAP through our YPH JV in China
CAGR 2014-2019: 1.5%

Specialties
Light
Specialties
Commodities
• Added value
• Higher prices
• Smaller volumes
• Selective distribution
Specialty Fertilizers vs. Commodities
CRF (Controlled Release Fertilizers)
WSNPK (Water Soluble Fertilizers)
NOP (Potassium Nitrate)
CN (Calcium Nitrate)
Soluble (MAP/MKP)
“Special NPK”
35

Our Advantages
Supply chain
Production process-technology adding
value
Market position R&D Innovate the next generation
• Controlled release fertilizers • Fertigation and foliar solubles • Enhanced nutrients and water efficiency
• Back integrated • Access to high quality raw material • Efficient supply chain (high synergies)
• Highly professional Agronomic Sales team • Integrated and tailored service • Full product portfolio • Distributor loyalty • Strong Branding
36
37
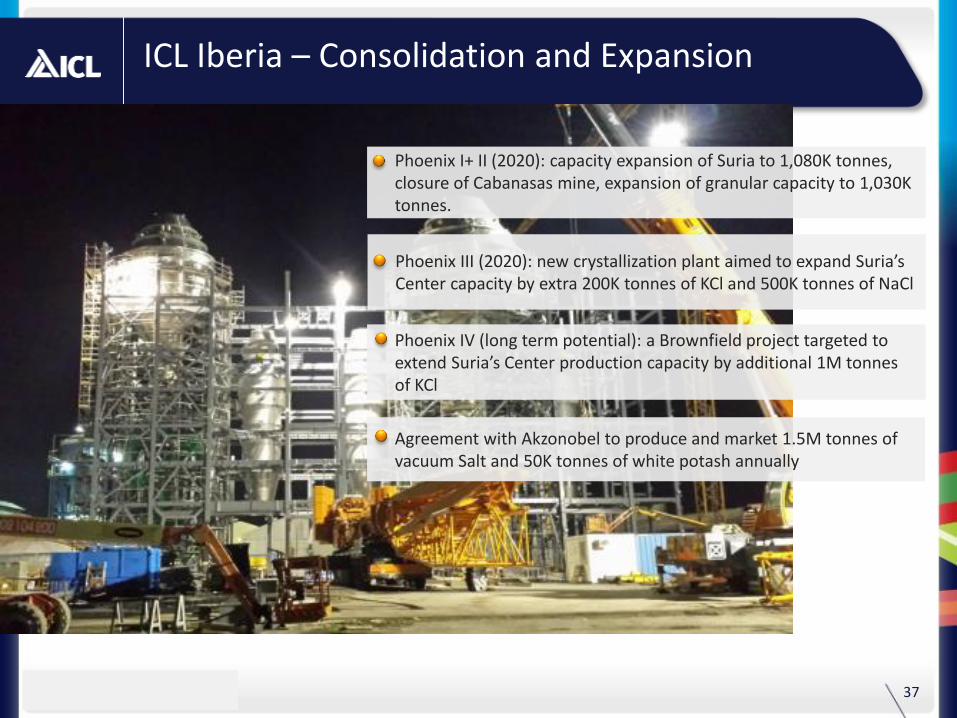
ICL Iberia – Consolidation and Expansion
• Phoenix I+ II (2020): capacity expansion of Suria to 1,080K tonnes, closure of Cabanasas mine, expansion of granular capacity to 1,030K tonnes.
• Phoenix III (2020): new crystallization plant aimed to expand Suria’s Center capacity by extra 200K tonnes of KCl and 500K tonnes of NaCl
• Phoenix IV (long term potential): a Brownfield project targeted to extend Suria’s Center production capacity by additional 1M tonnes of KCl
• Agreement with Akzonobel to produce and market 1.5M tonnes of vacuum Salt and 50K tonnes of white potash annually
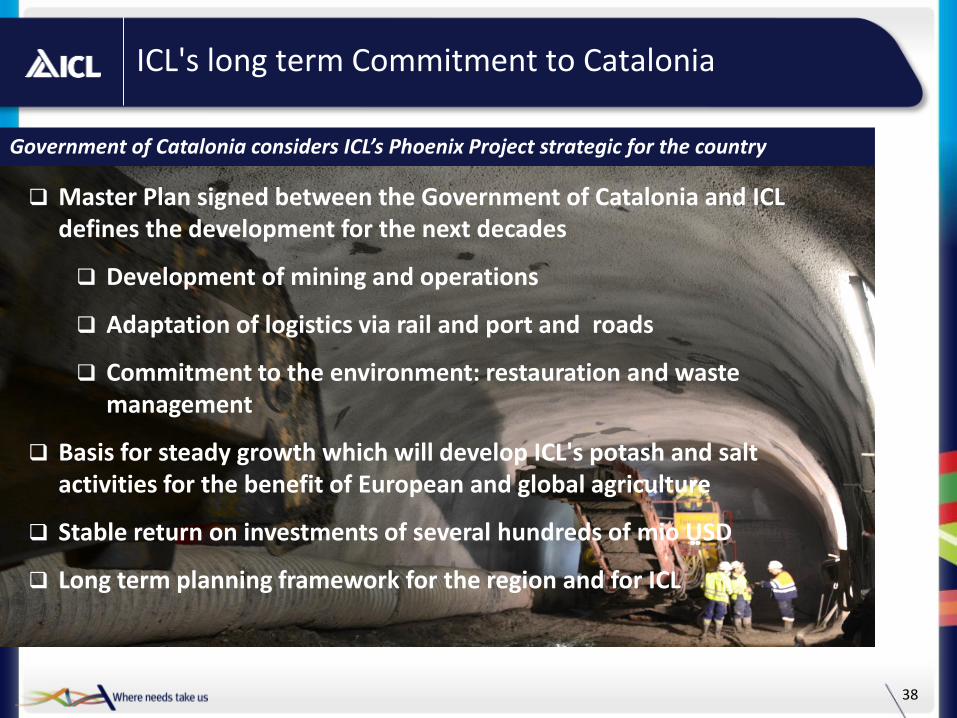
ICL's long term Commitment to Catalonia
38
Master Plan signed between the Government of Catalonia and ICL defines the development for the next decades
Development of mining and operations
Adaptation of logistics via rail and port and roads
Commitment to the environment: restauration and waste management
Basis for steady growth which will develop ICL's potash and salt activities for the benefit of European and global agriculture
Stable return on investments of several hundreds of mio USD
Long term planning framework for the region and for ICL
Government of Catalonia considers ICL’s Phoenix Project strategic for the country

ICL to Establish Bulk Blending Facilities Across Ethiopia to Support Demand Growth
Bulk Blending - fertilizer plant designed to blend several nutrients. The final formula is determined according to the crop needs and availability of nutrient in the soil
Several locations has been investigated
First Bulk Blend was already established in Tulu Bolo by the Ethiopian Government
Djibouti Port
Allana Potash
Oromia
Amhara
SNNP
Tigray Mekele
Nekemte
Tulu Bolo
Worabe
Bahar Dar
• Alternatives examined by ICL • Sites where the Ethiopian Government established or intend to
establish BB facilities without any private business partner
Fertilizers are considered as a strategic commodity in Ethiopia
The plants are design to serve an area of about 200Km radius, use 150 k tonnes of potash annually through various number of formulas
The Ethiopian Gov. is defining the preferred cooperation model between the public and private sectors
39
40
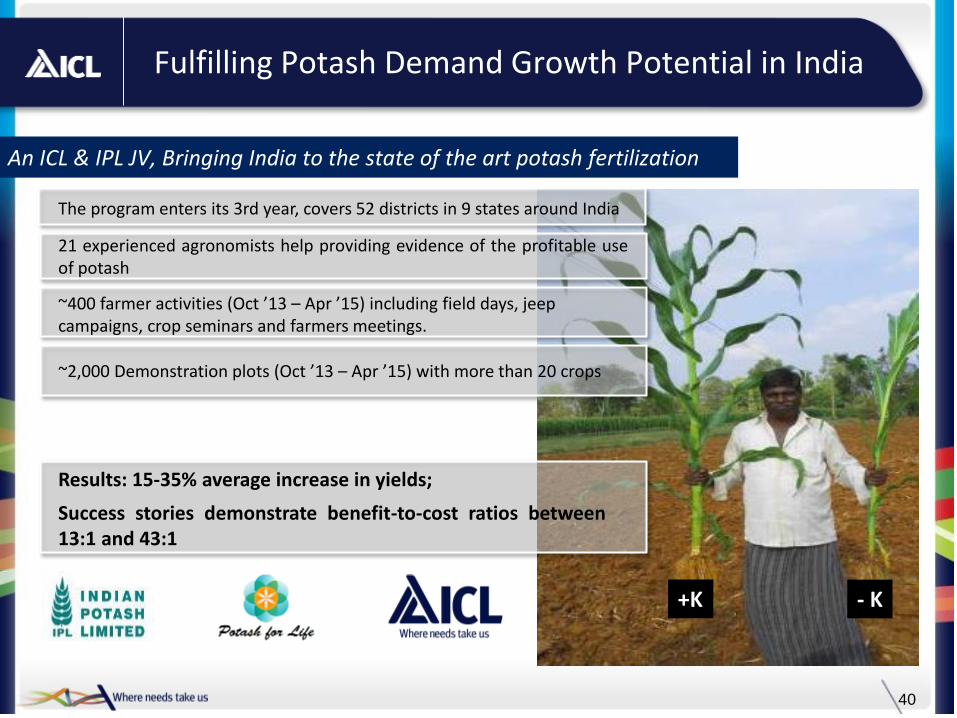
Fulfilling Potash Demand Growth Potential in India
An ICL & IPL JV, Bringing India to the state of the art potash fertilization
- K +K
The program enters its 3rd year, covers 52 districts in 9 states around India
21 experienced agronomists help providing evidence of the profitable use of potash
~400 farmer activities (Oct ’13 – Apr ’15) including field days, jeep campaigns, crop seminars and farmers meetings.
~2,000 Demonstration plots (Oct ’13 – Apr ’15) with more than 20 crops
Results: 15-35% average increase in yields;
Success stories demonstrate benefit-to-cost ratios between 13:1 and 43:1
41
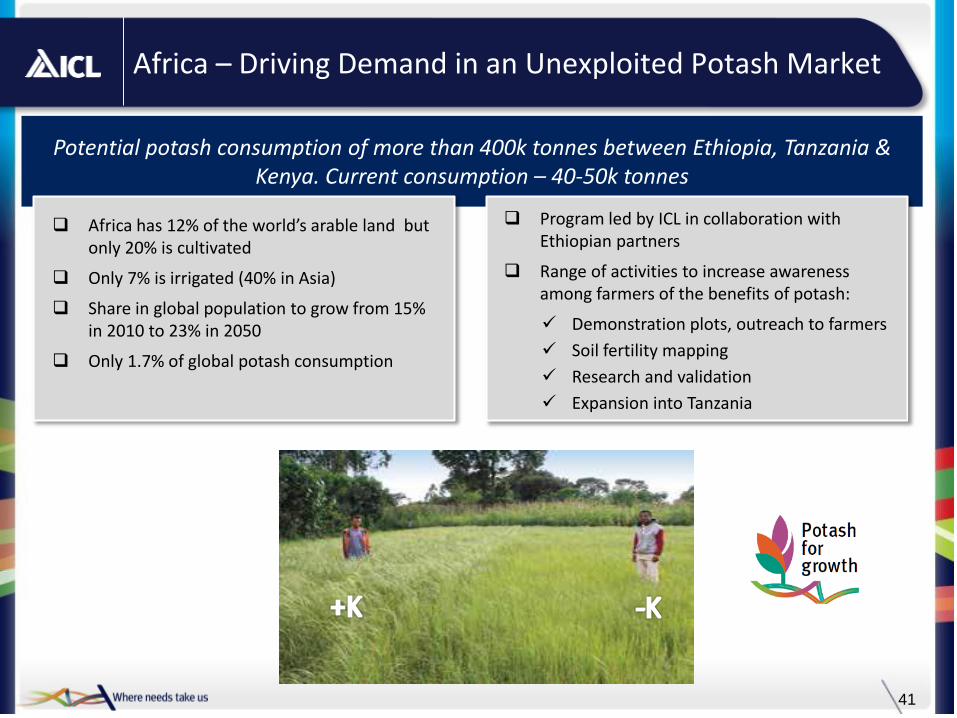
Africa – Driving Demand in an Unexploited Potash Market
Potential potash consumption of more than 400k tonnes between Ethiopia, Tanzania & Kenya. Current consumption – 40-50k tonnes
Africa has 12% of the world’s arable land but only 20% is cultivated
Only 7% is irrigated (40% in Asia)
Share in global population to grow from 15% in 2010 to 23% in 2050
Only 1.7% of global potash consumption
Program led by ICL in collaboration with
Ethiopian partners
Range of activities to increase awareness among farmers of the benefits of potash:
Demonstration plots, outreach to farmers
Soil fertility mapping
Research and validation
Expansion into Tanzania
42
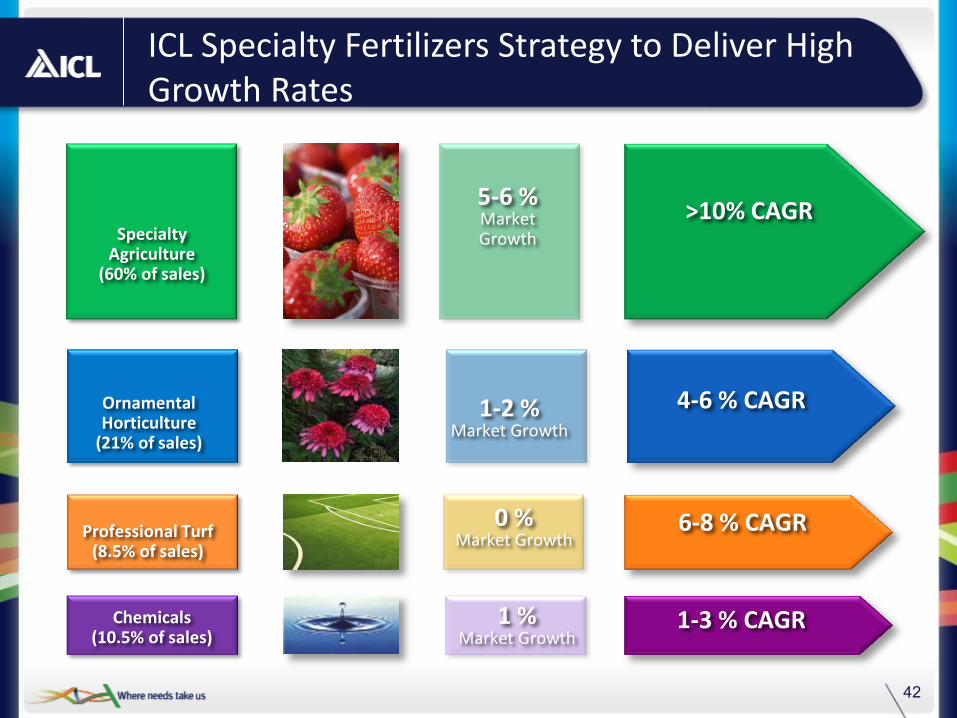
ICL Specialty Fertilizers Strategy to Deliver High Growth Rates
4-6 % CAGR
1-2 % Market Growth
Ornamental Horticulture
(21% of sales)
6-8 % CAGR
0 % Market Growth Professional Turf
(8.5% of sales)
>10% CAGR
5-6 % Market Growth Specialty
Agriculture (60% of sales)
1-3 % CAGR
1 % Market Growth
Chemicals (10.5% of sales)
43
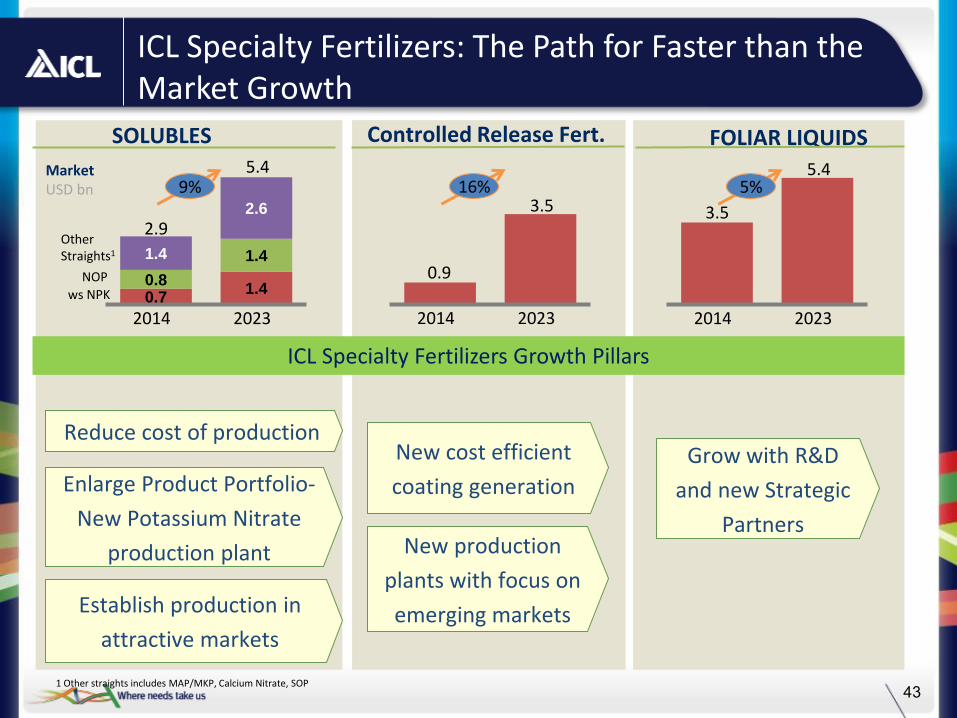
ICL Specialty Fertilizers: The Path for Faster than the Market Growth
0.7 1.4
0.8
1.4 1.4
2.6
2023
5.4
2014
2.9
Market USD bn
1 Other straights includes MAP/MKP, Calcium Nitrate, SOP
ws NPK
NOP
Other Straights1
9%
SOLUBLES
2023
5.4
2014
3.5
5%
FOLIAR LIQUIDS
2023
3.5
2014
0.9
16%
Controlled Release Fert.
ICL Specialty Fertilizers Growth Pillars
Establish production in
attractive markets
Enlarge Product Portfolio-
New Potassium Nitrate
production plant
Reduce cost of production
New production
plants with focus on
emerging markets
Grow with R&D
and new Strategic
Partners
New cost efficient
coating generation
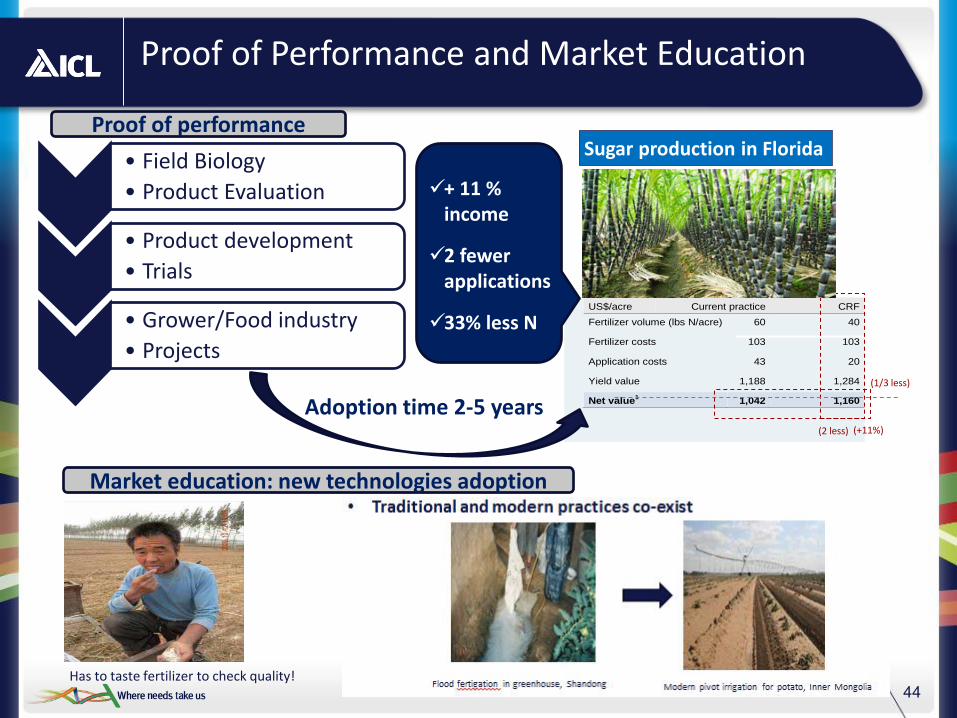
44
Produt Development Trials US$/acre Current practice CRF
Fertilizer volume (lbs N/acre) 60 40
Fertilizer costs 103 103
Application costs 43 20
Yield value 1,188 1,284
Net value1 1,042 1,160
(2 less)
(1/3 less)
(+11%)
Sugar production in Florida
+ 11 % income
2 fewer applications
33% less N
Adoption time 2-5 years
Has to taste fertilizer to check quality!
Proof of Performance and Market Education
Proof of performance
Market education: new technologies adoption
• Field Biology
• Product Evaluation
• Product development
• Trials
• Grower/Food industry
• Projects
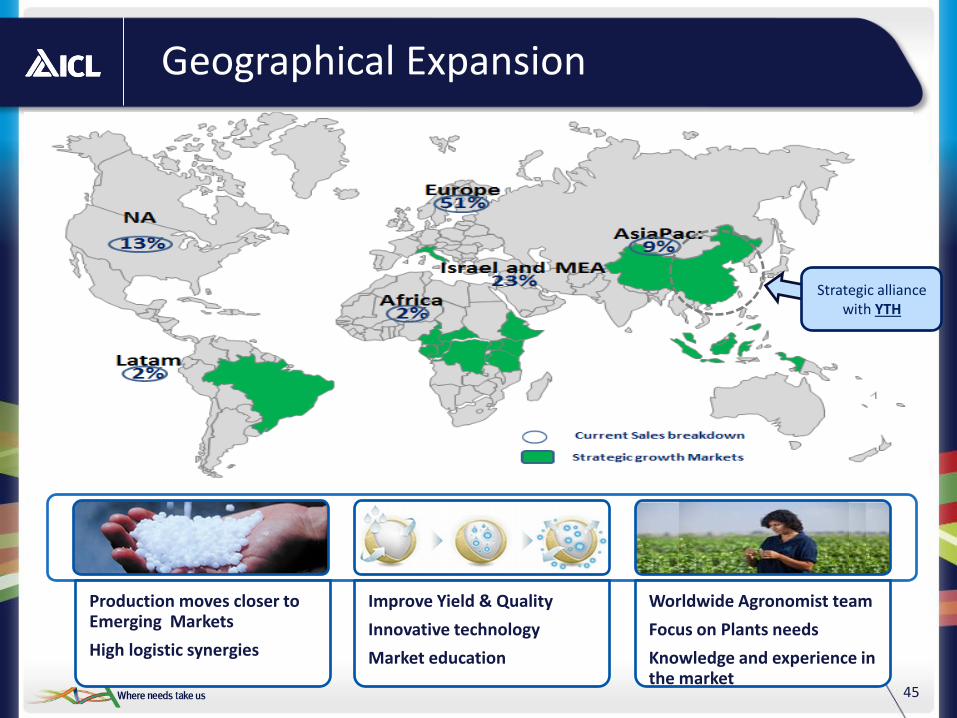
Geographical Expansion
45
Production moves closer to Emerging Markets
High logistic synergies
Improve Yield & Quality
Innovative technology
Market education
Worldwide Agronomist team
Focus on Plants needs
Knowledge and experience in the market
Strategic alliance with YTH

Engineered Materials
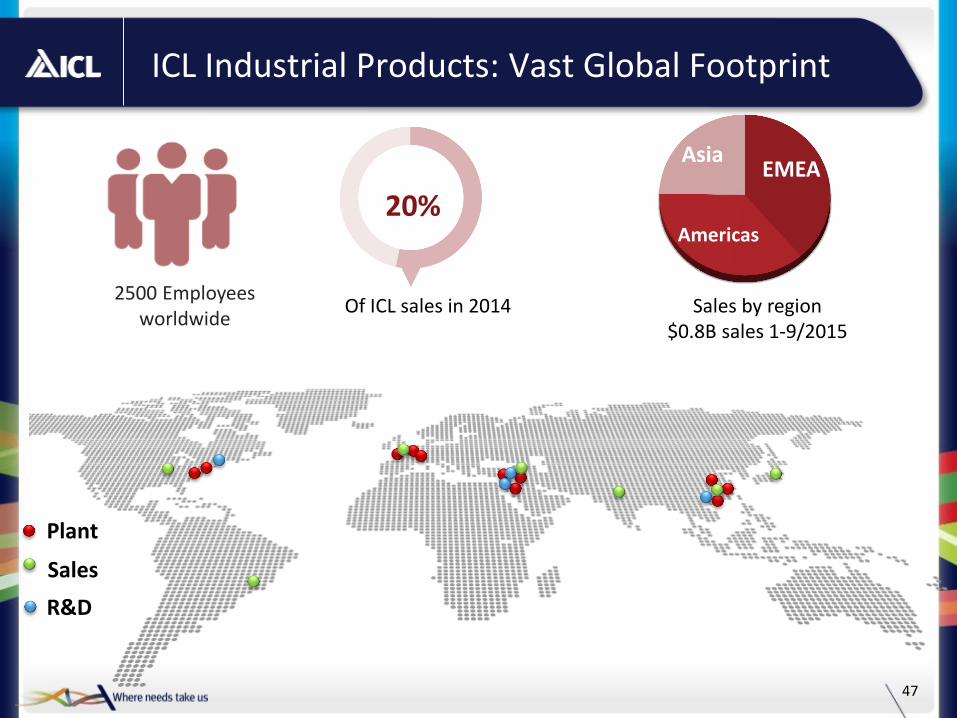
ICL Industrial Products: Vast Global Footprint
47
2500 Employees worldwide
Of ICL sales in 2014
20% EMEA
Americas
Asia
Plant
Sales
R&D
Sales by region $0.8B sales 1-9/2015

ICL Industrial Products - from Assets to Markets
48
Bromine
Phosphorus
Mineral Salts
Magnesium
Chlorine
Flame Retardants
Energy and Intermediates
Microbial Solutions
Mineral Applications
Chemistries Key Markets
Back Integration to Customer Solutions

Global Trends Supporting Our Business
49
Population Regulation & Environmental Standard of living
FURNITURE & TEXTILE TRANSPORTATION
WATER TREATMENT
CONSTRUCTION
INTERMEDIATES FOR FOOD,
PHARMA, AGRO OIL & GAS
POWER PLANTS
ELECTRONICS

Global Cost Leader in Bromine
50
0.02 – 0.03 0.03 – 0.05 0.5 – 0.9
3.5 – 4.5 2.5 – 5.5
11.0 – 12.0 g/liter
UndergroundWells
(China)
Sea Water(China, Japan)
Shallow Sea(Ukraine)
Salt Lake(India)
UndergroundWells (U.S.)
Dead SeaOperations
(Israel, Jordan)
• The Dead Sea provides the highest concentration of Bromine
• Cost is related to concentration
• Abundant supply
Source: ICL estimates, MarketsandMarkets
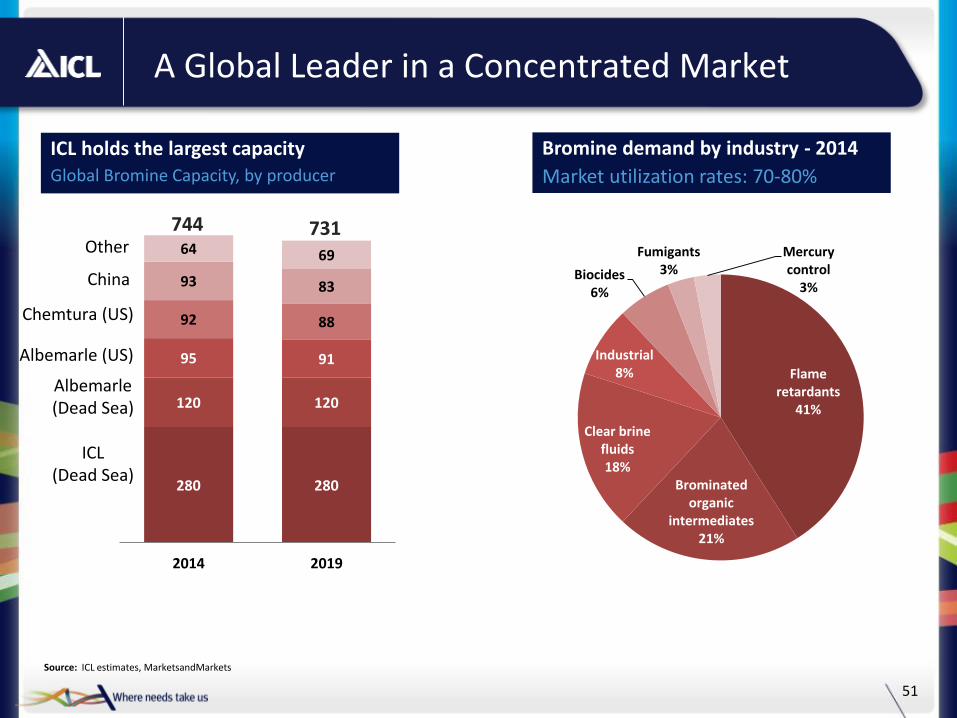
A Global Leader in a Concentrated Market
51
ICL holds the largest capacity Global Bromine Capacity, by producer
280 280
120 120
95 91
92 88
93 83
64 69
2014 2019
Albemarle (Dead Sea)
ICL (Dead Sea)
Other
Albemarle (US)
Chemtura (US)
China
Bromine demand by industry - 2014
Market utilization rates: 70-80%
Flame retardants
41%
Brominated organic
intermediates 21%
Clear brine fluids 18%
Industrial 8%
Biocides 6%
Fumigants 3%
Mercury control
3%
744 731
Source: ICL estimates, MarketsandMarkets
52
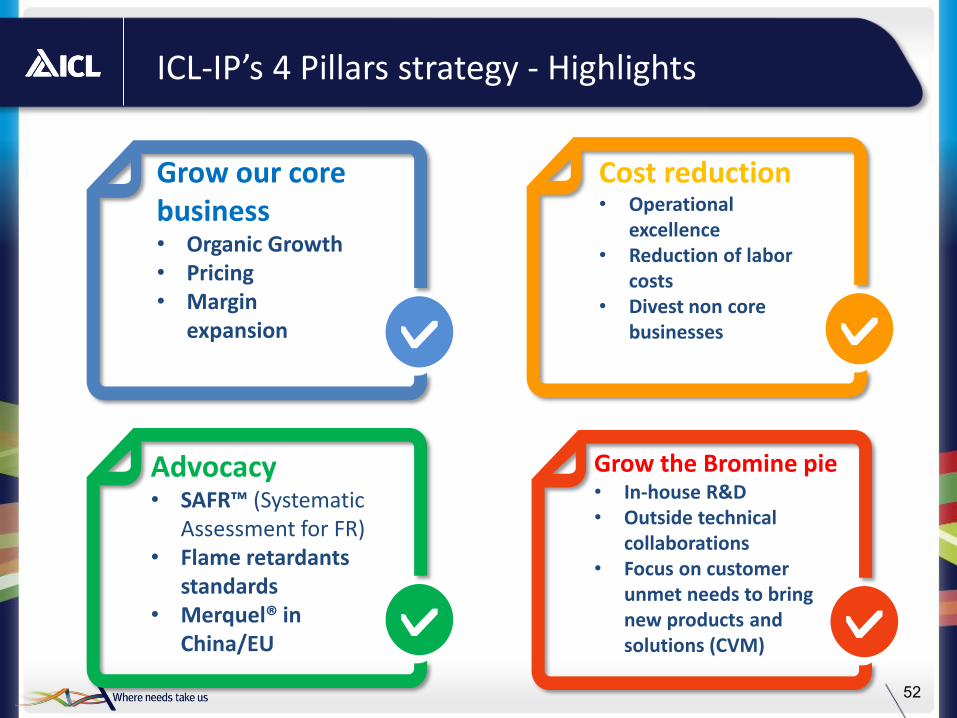
ICL-IP’s 4 Pillars strategy - Highlights
Grow our core business • Organic Growth • Pricing • Margin
expansion
Cost reduction • Operational
excellence • Reduction of labor
costs • Divest non core
businesses
Advocacy • SAFR™ (Systematic
Assessment for FR) • Flame retardants
standards • Merquel® in
China/EU
Grow the Bromine pie • In-house R&D • Outside technical
collaborations • Focus on customer
unmet needs to bring new products and solutions (CVM)
53
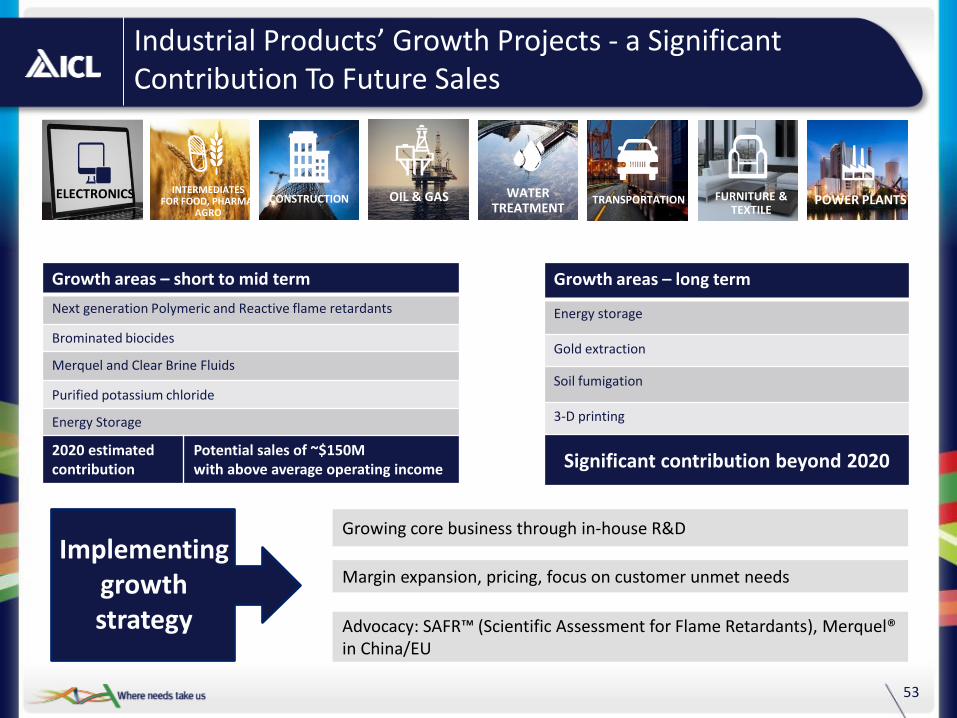
Industrial Products’ Growth Projects - a Significant Contribution To Future Sales
FURNITURE & TEXTILE
TRANSPORTATION WATER
TREATMENT CONSTRUCTION
INTERMEDIATES FOR FOOD, PHARMA,
AGRO
OIL & GAS POWER PLANTS ELECTRONICS
Growth areas – short to mid term
Next generation Polymeric and Reactive flame retardants
Brominated biocides
Merquel and Clear Brine Fluids
Purified potassium chloride
Energy Storage
2020 estimated contribution
Potential sales of ~$150M with above average operating income
Growth areas – long term
Energy storage
Gold extraction
Soil fumigation
3-D printing
Significant contribution beyond 2020
Growing core business through in-house R&D
Margin expansion, pricing, focus on customer unmet needs
Advocacy: SAFR™ (Scientific Assessment for Flame Retardants), Merquel® in China/EU
Implementing
growth strategy
54
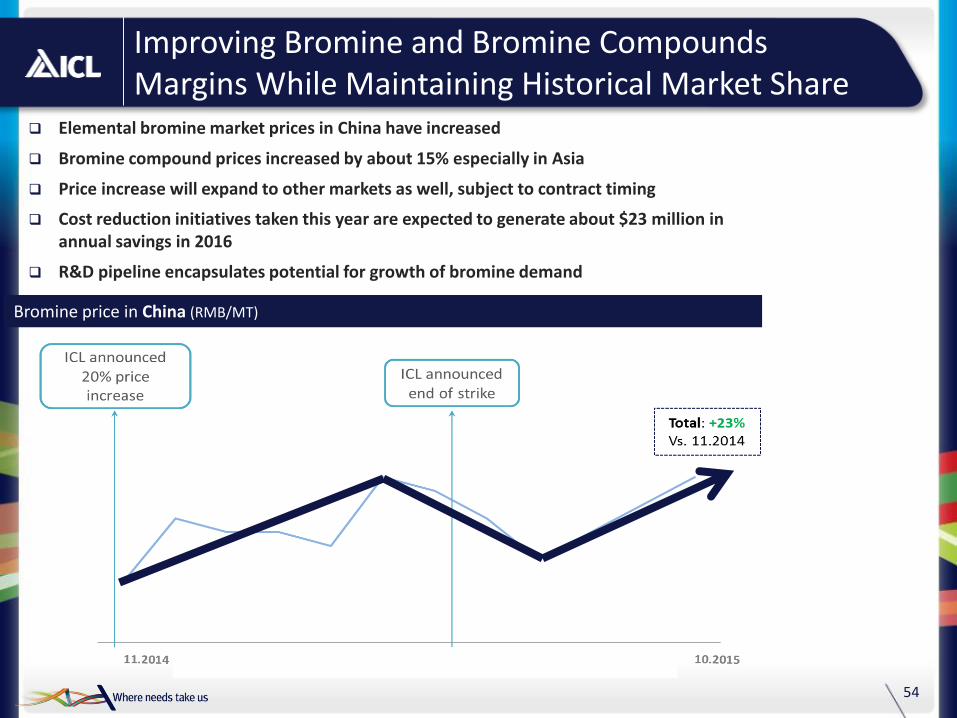
Improving Bromine and Bromine Compounds Margins While Maintaining Historical Market Share
Elemental bromine market prices in China have increased
Bromine compound prices increased by about 15% especially in Asia
Price increase will expand to other markets as well, subject to contract timing
Cost reduction initiatives taken this year are expected to generate about $23 million in annual savings in 2016
R&D pipeline encapsulates potential for growth of bromine demand
Bromine price in China (RMB/MT)

ICL Performance Products: Overview
55
Of ICL Sales in 1-9/2015
28% 54%
41%
5% Non Core
3,300 Employees Worldwide
Advanced Additives
Food Specialties
Sales by Business unit $1.1B sales in 1-9/2015
Americas 40%
Asia/Pacific 15%
EMEA 45%

'06 '07 '08 '09 '10 '11 '12 '13 '14 '15E '16E '17E '18E '19E
Op
era
tin
g In
com
e %
Rev
en
ue
(m
$)
Core (Rev $) Non Core (Rev $) Core (OI %) Non Core (OI %)
ICL Performance Products: Focus on Core
56
Thermphos –
P2S5
business
$1,711M
1,533
Estimated CAGR 2015-2019: 3-5% Estimated operating margin expansion: about 150-250 basis points
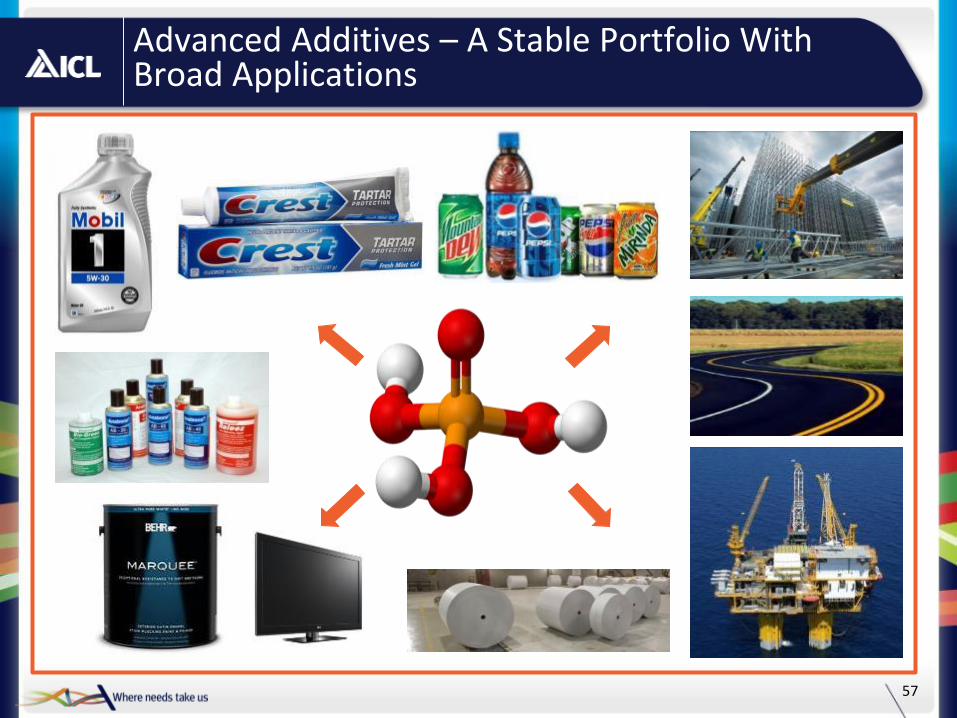
Advanced Additives – A Stable Portfolio With Broad Applications
57

Advanced Additives – Expand Through Differentiation
58
Class A Fire
ICL provides products and services that help prevent, control, and suppress fires
World-wide reputation A strong market position
2014 acquisition of Auxquimia: specialists in the Class B Foam for oil, refinery and chemical industry
Complete and broad portfolio Own testing facilities Fluorine free product innovations
Class B Fire
Fire Safety Products

Food
60
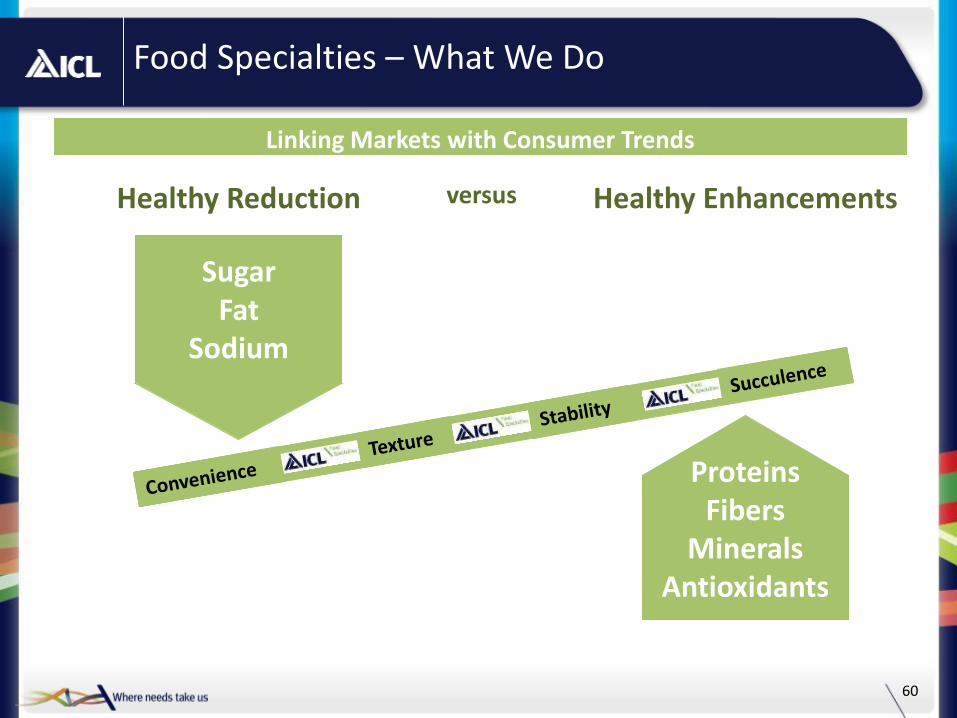
Food Specialties – What We Do
Linking Markets with Consumer Trends
Sugar Fat
Sodium
Proteins Fibers
Minerals Antioxidants
Healthy Reduction versus Healthy Enhancements

Food Specialties- Increased Global Demand for Proteins
61
Upside potential for protein consumption
per capita
Brazil China
Ethiopia
Germany
India Indonesia
Nigeria
USA
40
60
80
100
120
0 500 1,000 1,500 2,000
Dai
ly P
rote
in /
Cap
ita
(g)
Population (mil)
3.0
7.7 0.45
0.2
'60 '70 '80 '90 '00 '10 '20P
Ara
ble
Lan
d (
ha/
cap
ita)
Wo
rld
Po
pu
lati
on
(b
ilio
ns)
The world population grows, and the arable
land per capita decreases
Decade
Source: GS&PA Research, FAO

Food Specialties – Add Technology Platforms: Whey Proteins in Europe
62
Acquisition of Prolactal/Rovita in Q1/2015 is a big step in implementing the strategy
2014 annual revenue of $110 M; market growth of approximately 10% annually
Proprietary technology can be expanded into other regions
Dair
y
Meat/
Po
ult
ry
/ S
eafo
od
Bakery
Bevera
ge
Phosphate Salts
Whey Proteins
Vegetable Proteins
Spices

Efficiency and Operational Excellence

ACE Drives Functional Excellence in 5 Key Processes
Commercial excellence
ACE streams
Energy efficiency
Procurement
CAPEX (investment)
R&D
Current Status
Establishment of the commercial excellence
program.
Establishment of a new global function: CIO
Establishment of a new global function: CTO
Establishment of a new global function: CPO
Ongoing efforts
Volume Activity
~ $6000 million of Revenues
Annual spending: ~ $400 million
Annual spending: ~ $4000 million
Annual CAPEX spending: ~ $800 million
~ $6000 million of Revenues
Asset productivity
Revenue increase
Cost reduction
ICL’s core value creation drivers
64

Procurement Savings: Three Potential Levers
What did we do? • One global ICL
approach – regions & management level
• Coordination alignment between global and regional
• Excellent global team work
• Exploration of supply options over the entire value chain
• One global contract or no contract
Result: • Annual saving: $2.1 M
(25%) • Global contract for the
US, Israel & Europe
Supplier management
Process management
Demand management
Volume consolidation
Supplier partnerships
Negotiation
Transportation agreements
Make-or-buy opportunities
Simplify specifications to fulfill (not exceed) requirements
Find "replacements" and alternative technologies
Manage service levels/demand
Reduce waste
Success story- Phenol contract
65

As project progresses, budget is committed, ability to change project decisions/add value decreases:
100%
Low
High
Project life cycle
0%
CAPEX Value Engineering
A systematic and structured approach for improving projects, products, and processes
Used to analyze and improve manufacturing products and processes, design and construction projects
Helps achieve an optimum balance between function, performance, quality, safety and cost
The proper balance results in the maximum value for the project
Ability to improve value
Commitment of funds
CAPEX value engineering:
Potential cash flow contribution: ~$100M
66
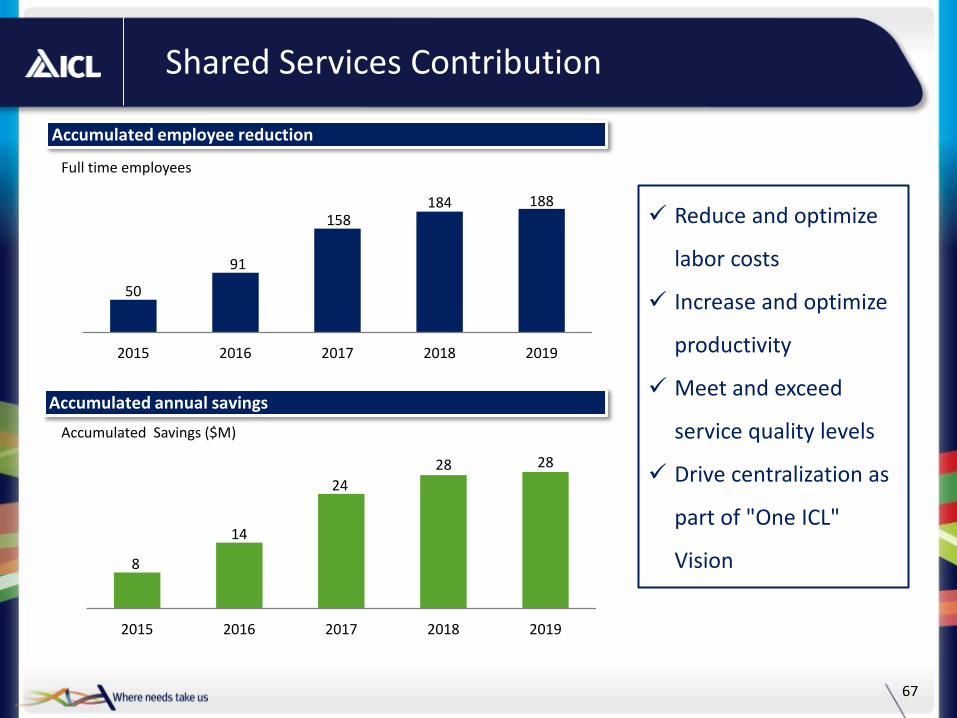
Shared Services Contribution
Reduce and optimize
labor costs
Increase and optimize
productivity
Meet and exceed
service quality levels
Drive centralization as
part of "One ICL"
Vision
Full time employees
50
91
158 184 188
2015 2016 2017 2018 2019
Accumulated employee reduction
Accumulated annual savings
Accumulated Savings ($M)
8
14
24
28 28
2015 2016 2017 2018 2019
67

Thank you