Embed Size (px)
Citation preview

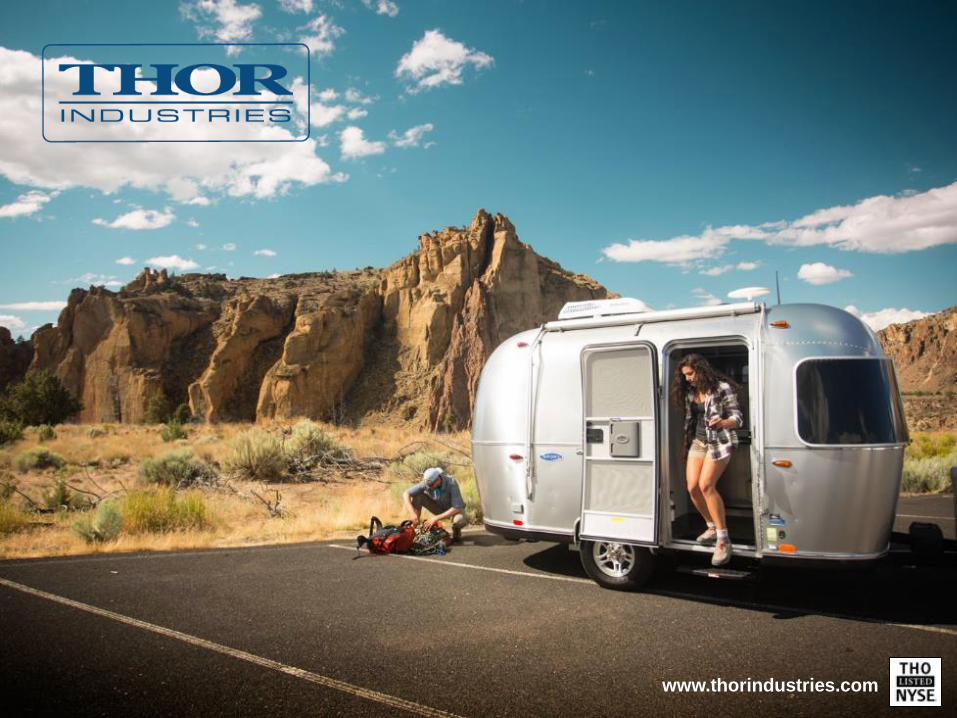
www.thorindustries.com
INVESTOR PRESENTATION
SEPTEMBER 27, 2017
www.thorindustries.com
Forward Looking Statements
This presentation includes certain statements that are “forward looking” statements within the meaning of the U.S. Private Securities
Litigation Reform Act of 1995, Section 27A of the Securities Act of 1933, as amended, and Section 21E of the Securities Exchange Act
of 1934, as amended. These forward looking statements are made based on management’s current expectations and beliefs regarding
future and anticipated developments and their effects upon Thor, and inherently involve uncertainties and risks. These forward looking
statements are not a guarantee of future performance. We cannot assure you that actual results will not differ from our expectations.
Factors which could cause materially different results include, among others, raw material and commodity price fluctuations, raw
material or chassis supply restrictions, the level of warranty claims incurred, legislative, regulatory and tax policy developments, the
costs of compliance with increased governmental regulation, legal and compliance issues including those that may arise in conjunction
with recent transactions, the potential impact of increased tax burdens on our dealers and retail consumers, lower consumer confidence
and the level of discretionary consumer spending, interest rate fluctuations, the potential impact of rising interest rates on the general
economy and specifically on our dealers and consumers, restrictive lending practices, management changes, the success of new
product introductions, the pace of obtaining and producing at new production facilities, the pace of acquisitions, the potential loss of
existing customers of acquisitions, the integration of new acquisitions, our ability to retain key management personnel of acquired
companies, a shortage of necessary personnel for production, the loss or reduction of sales to key dealers, the availability of delivery
personnel, asset impairment charges, cost structure changes, competition, the impact of potential losses under repurchase agreements,
the potential impact of the strength of the U.S. dollar on international demand, general economic, market and political conditions and
other risks and uncertainties, including those discussed more fully in ITEM 1A of our Annual Report on Form 10-K for the year ended
July 31, 2017.
We disclaim any obligation or undertaking to disseminate any updates or revisions to any forward looking statements contained in this
presentation or to reflect any change in our expectations after the date of this presentation or any change in events, conditions or
circumstances on which any statement is based, except as required by law.
2

Table of Contents
Overview and Current Industry Conditions 4
Fourth Quarter 2017 Update 14
Appendix: Financial & Market Data 22
3

4
Overview and Current Industry
Conditions
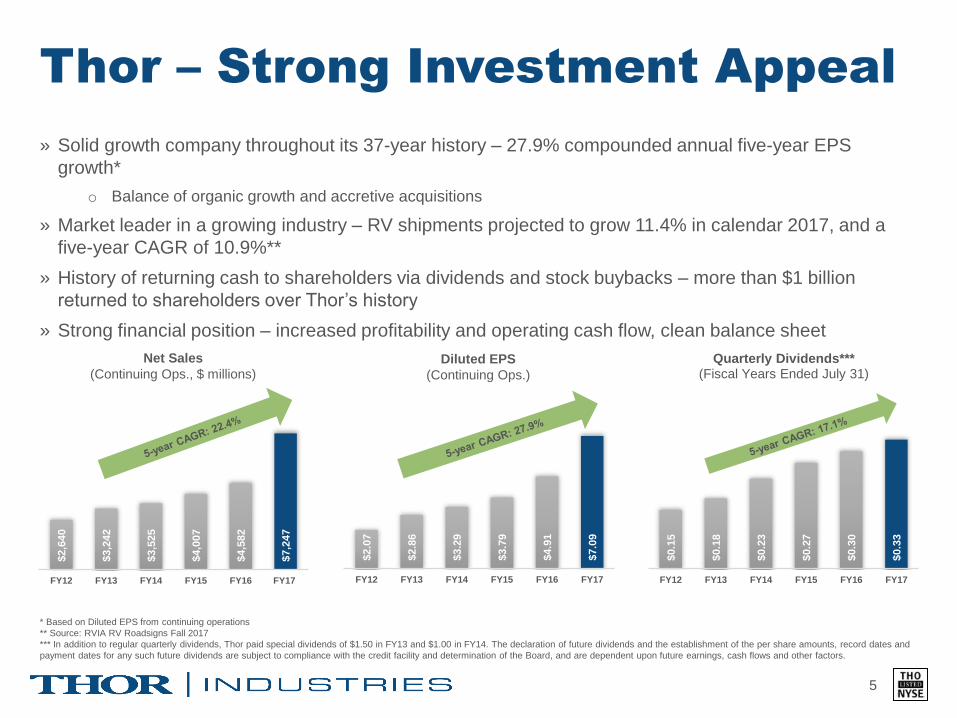
Thor – Strong Investment Appeal
» Solid growth company throughout its 37-year history – 27.9% compounded annual five-year EPS
growth*
o Balance of organic growth and accretive acquisitions
» Market leader in a growing industry – RV shipments projected to grow 11.4% in calendar 2017, and a
five-year CAGR of 10.9%**
» History of returning cash to shareholders via dividends and stock buybacks – more than $1 billion
returned to shareholders over Thor’s history
» Strong financial position – increased profitability and operating cash flow, clean balance sheet
5
$2,6
40
$3,2
42
$3,5
25
$4,0
07
$4,5
82
$7,2
47
FY12 FY13 FY14 FY15 FY16 FY17
Net Sales
(Continuing Ops., $ millions)$2.0
7
$2.8
6
$3.2
9
$3.7
9
$4.9
1
$7.0
9
FY12 FY13 FY14 FY15 FY16 FY17
Diluted EPS
(Continuing Ops.)
$0.1
5
$0.1
8
$0.2
3
$0.2
7
$0.3
0
$0.3
3
FY12 FY13 FY14 FY15 FY16 FY17
Quarterly Dividends***(Fiscal Years Ended July 31)
* Based on Diluted EPS from continuing operations
** Source: RVIA RV Roadsigns Fall 2017
*** In addition to regular quarterly dividends, Thor paid special dividends of $1.50 in FY13 and $1.00 in FY14. The declaration of future dividends and the establishment of the per share amounts, record dates and
payment dates for any such future dividends are subject to compliance with the credit facility and determination of the Board, and are dependent upon future earnings, cash flows and other factors.
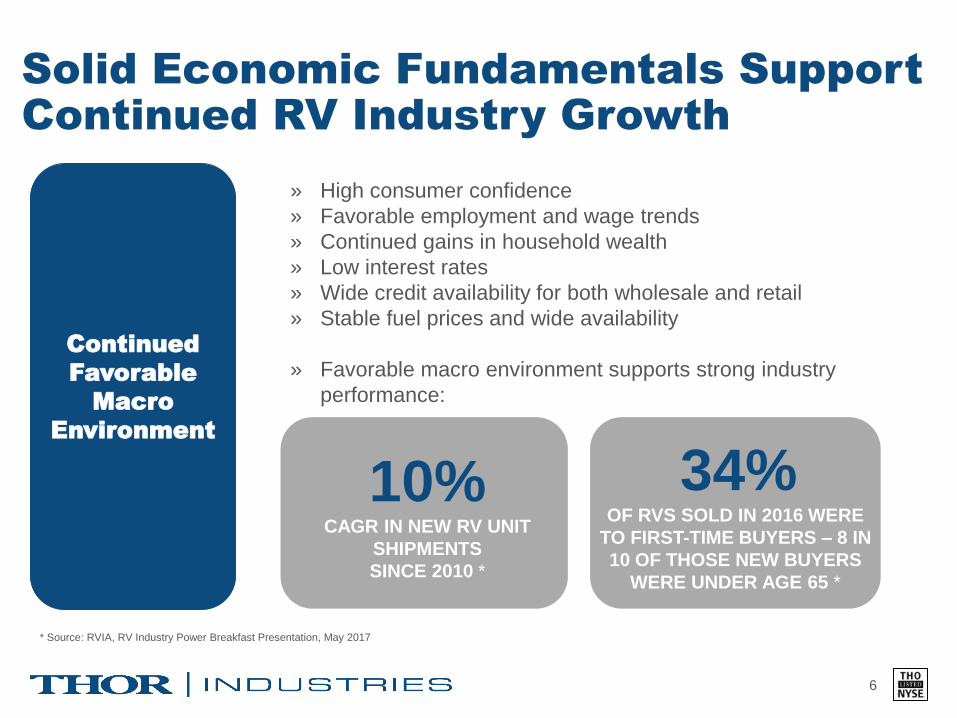
Solid Economic Fundamentals Support
Continued RV Industry Growth
6
Continued
Favorable
Macro
Environment
» High consumer confidence
» Favorable employment and wage trends
» Continued gains in household wealth
» Low interest rates
» Wide credit availability for both wholesale and retail
» Stable fuel prices and wide availability
» Favorable macro environment supports strong industry
performance:
10% CAGR IN NEW RV UNIT
SHIPMENTS
SINCE 2010 *
34%OF RVS SOLD IN 2016 WERE
TO FIRST-TIME BUYERS – 8 IN
10 OF THOSE NEW BUYERS
WERE UNDER AGE 65 *
* Source: RVIA, RV Industry Power Breakfast Presentation, May 2017
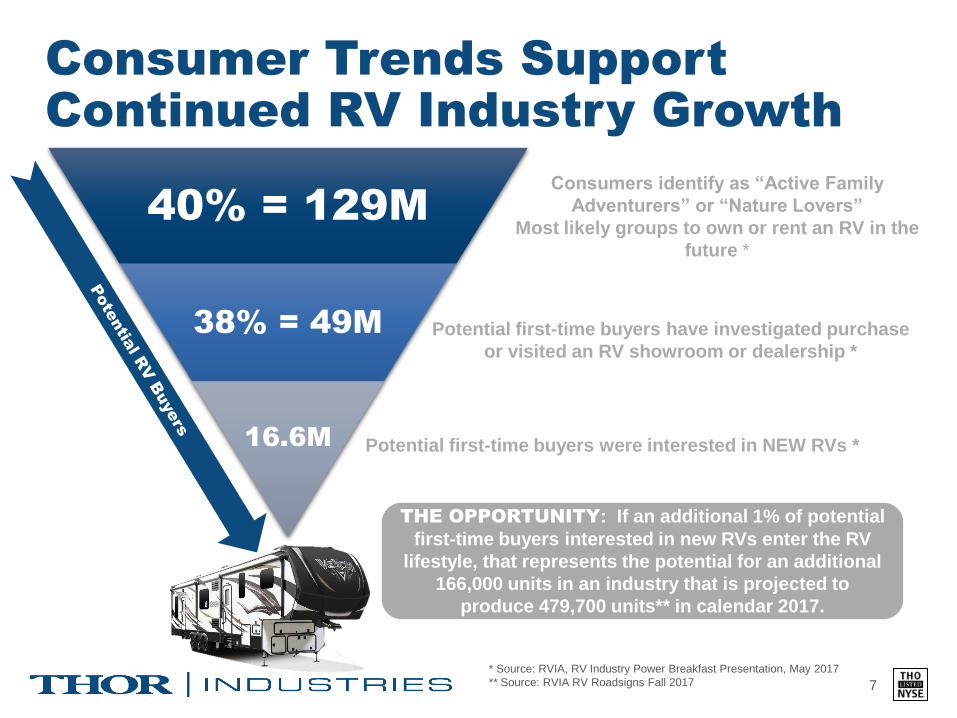
Consumer Trends Support
Continued RV Industry Growth
7
THE OPPORTUNITY: If an additional 1% of potential
first-time buyers interested in new RVs enter the RV
lifestyle, that represents the potential for an additional
166,000 units in an industry that is projected to
produce 479,700 units** in calendar 2017.
* Source: RVIA, RV Industry Power Breakfast Presentation, May 2017
** Source: RVIA RV Roadsigns Fall 2017
40% = 129M
38% = 49M
16.6M
Consumers identify as “Active Family
Adventurers” or “Nature Lovers”
Most likely groups to own or rent an RV in the
future *
Potential first-time buyers were interested in NEW RVs *
Potential first-time buyers have investigated purchase
or visited an RV showroom or dealership *
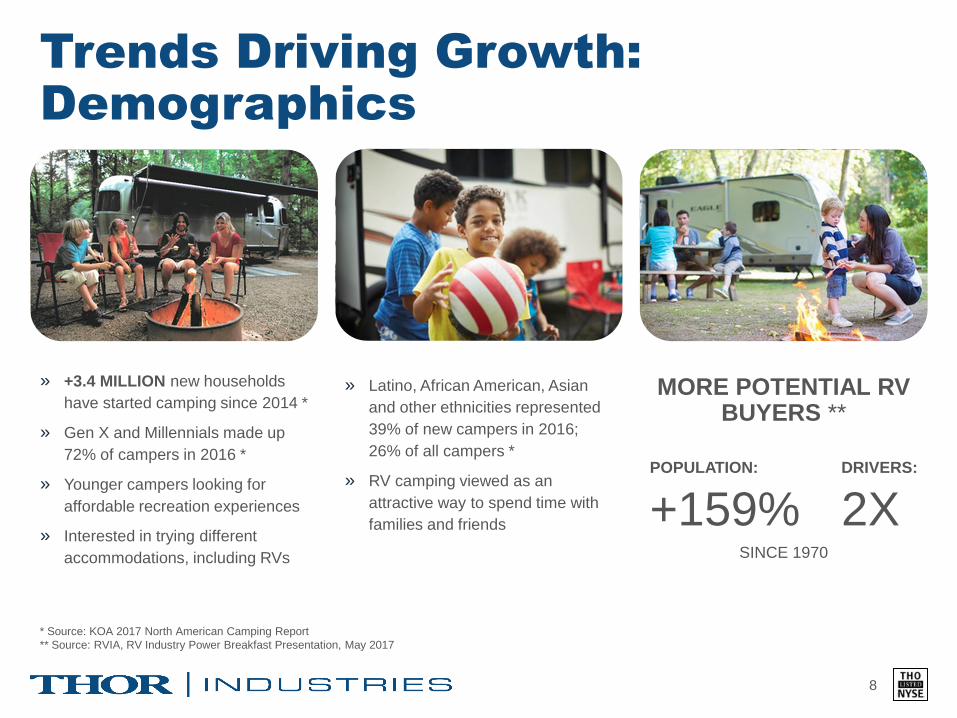
Trends Driving Growth:
Demographics
8
» +3.4 MILLION new households
have started camping since 2014 *
» Gen X and Millennials made up
72% of campers in 2016 *
» Younger campers looking for
affordable recreation experiences
» Interested in trying different
accommodations, including RVs
» Latino, African American, Asian
and other ethnicities represented
39% of new campers in 2016;
26% of all campers *
» RV camping viewed as an
attractive way to spend time with
families and friends
MORE POTENTIAL RV BUYERS **
POPULATION: DRIVERS:
+159% 2X SINCE 1970
* Source: KOA 2017 North American Camping Report
** Source: RVIA, RV Industry Power Breakfast Presentation, May 2017
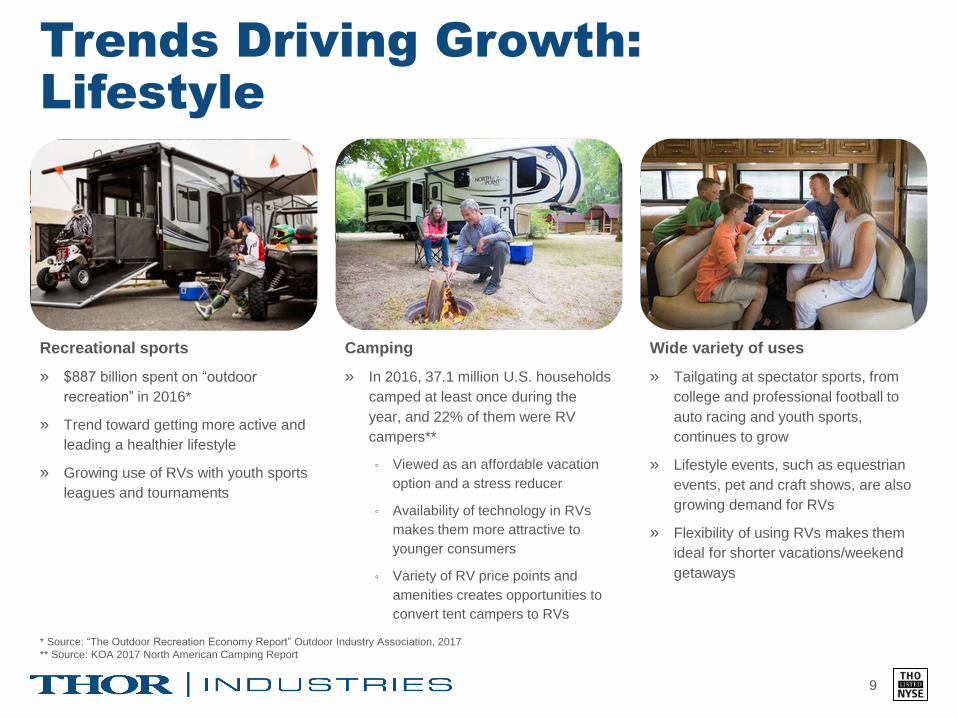
Trends Driving Growth:
Lifestyle
9
Recreational sports
» $887 billion spent on “outdoor
recreation” in 2016*
» Trend toward getting more active and
leading a healthier lifestyle
» Growing use of RVs with youth sports
leagues and tournaments
Camping
» In 2016, 37.1 million U.S. households
camped at least once during the
year, and 22% of them were RV
campers**
◦ Viewed as an affordable vacation
option and a stress reducer
◦ Availability of technology in RVs
makes them more attractive to
younger consumers
◦ Variety of RV price points and
amenities creates opportunities to
convert tent campers to RVs
Wide variety of uses
» Tailgating at spectator sports, from
college and professional football to
auto racing and youth sports,
continues to grow
» Lifestyle events, such as equestrian
events, pet and craft shows, are also
growing demand for RVs
» Flexibility of using RVs makes them
ideal for shorter vacations/weekend
getaways
* Source: “The Outdoor Recreation Economy Report” Outdoor Industry Association, 2017
** Source: KOA 2017 North American Camping Report
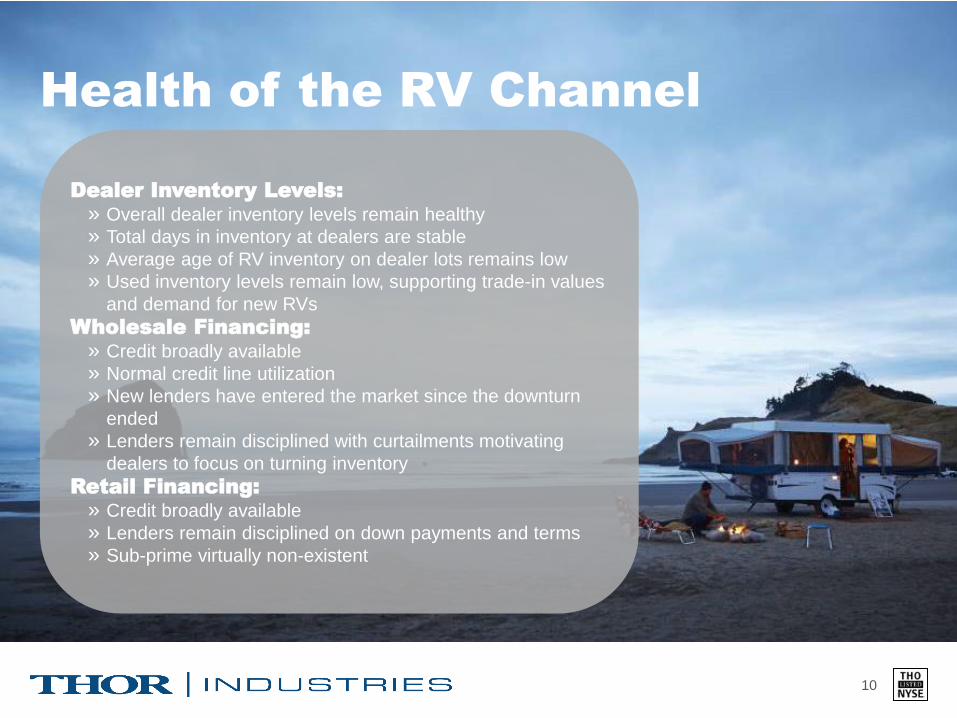
Health of the RV Channel
10
Dealer Inventory Levels:
» Overall dealer inventory levels remain healthy
» Total days in inventory at dealers are stable
» Average age of RV inventory on dealer lots remains low
» Used inventory levels remain low, supporting trade-in values
and demand for new RVs
Wholesale Financing:
» Credit broadly available
» Normal credit line utilization
» New lenders have entered the market since the downturn
ended
» Lenders remain disciplined with curtailments motivating
dealers to focus on turning inventory
Retail Financing:
» Credit broadly available
» Lenders remain disciplined on down payments and terms
» Sub-prime virtually non-existent
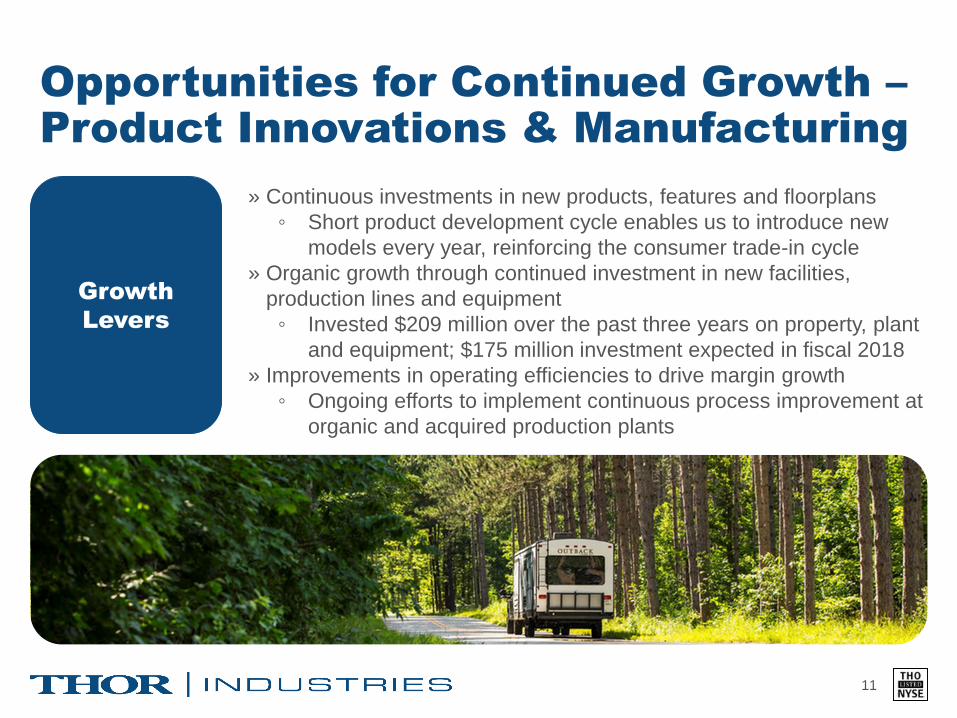
Opportunities for Continued Growth –
Product Innovations & Manufacturing
11
Growth
Levers
» Continuous investments in new products, features and floorplans
◦ Short product development cycle enables us to introduce new
models every year, reinforcing the consumer trade-in cycle
» Organic growth through continued investment in new facilities,
production lines and equipment
◦ Invested $209 million over the past three years on property, plant
and equipment; $175 million investment expected in fiscal 2018
» Improvements in operating efficiencies to drive margin growth
◦ Ongoing efforts to implement continuous process improvement at
organic and acquired production plants
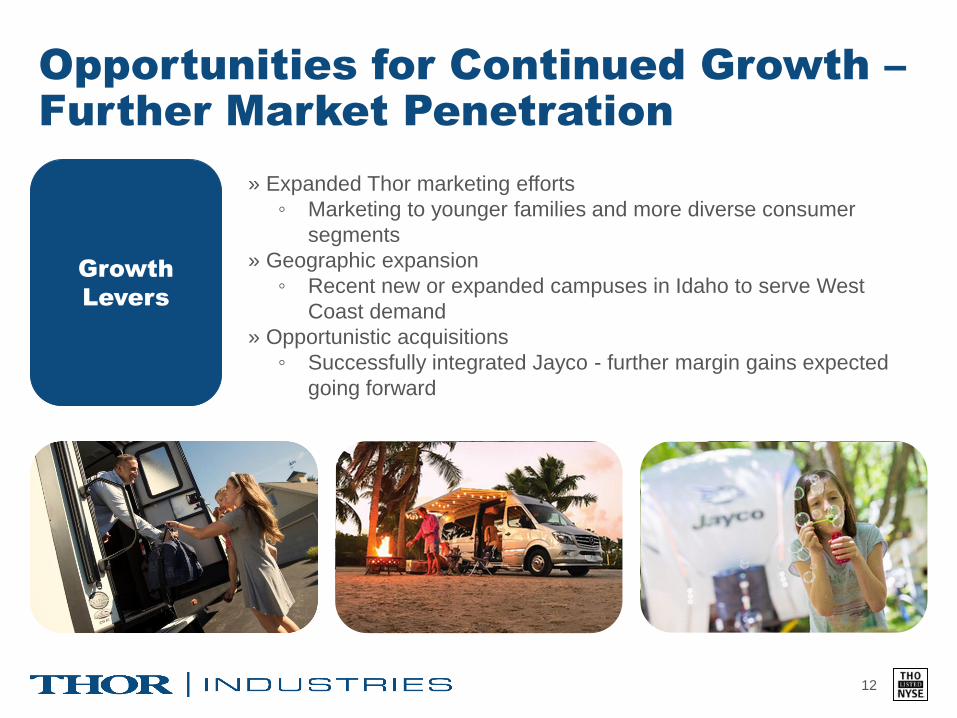
Opportunities for Continued Growth –
Further Market Penetration
12
Growth
Levers
» Expanded Thor marketing efforts
◦ Marketing to younger families and more diverse consumer
segments
» Geographic expansion
◦ Recent new or expanded campuses in Idaho to serve West
Coast demand
» Opportunistic acquisitions
◦ Successfully integrated Jayco - further margin gains expected
going forward
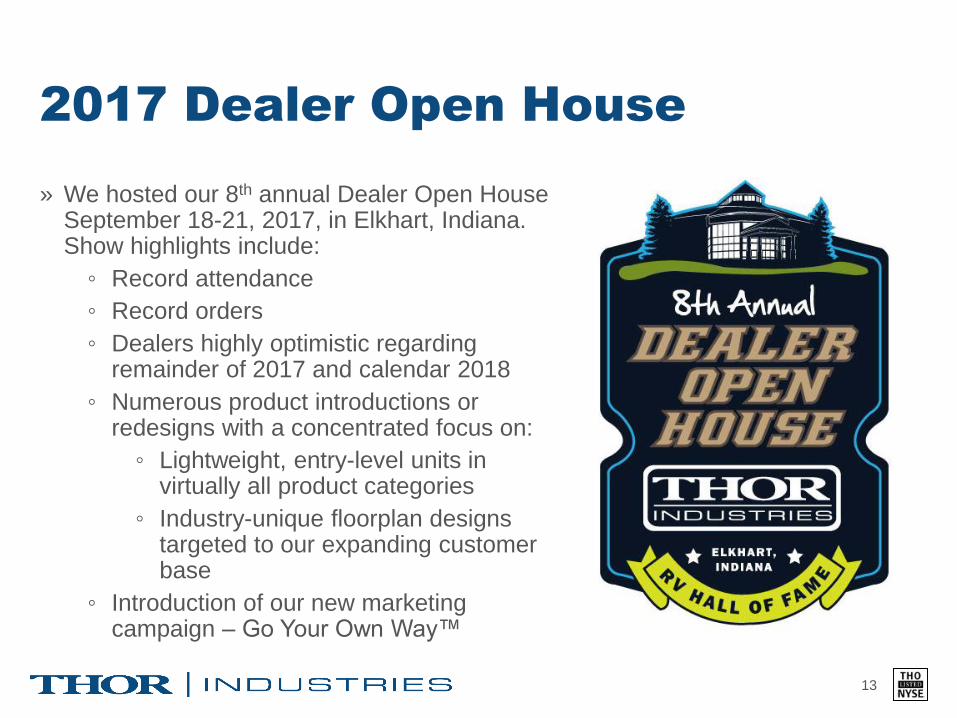
2017 Dealer Open House
» We hosted our 8th annual Dealer Open House September 18-21, 2017, in Elkhart, Indiana. Show highlights include:
◦ Record attendance
◦ Record orders
◦ Dealers highly optimistic regarding remainder of 2017 and calendar 2018
◦ Numerous product introductions or redesigns with a concentrated focus on:
◦ Lightweight, entry-level units in virtually all product categories
◦ Industry-unique floorplan designs targeted to our expanding customer base
◦ Introduction of our new marketing campaign – Go Your Own Way™
13

14
Fourth Quarter Key Messages
15
Strategic
Execution
Robust
Consumer
Demand
Outlook
» 14th quarter of record revenues from continuing operations for the applicable quarter
» Strong growth in revenues, both organically and from acquisitions
» Double-digit organic sales growth in both segments – towables and motorized –
outpacing the industry
◦ Organic sales growth of 20.4% in the fourth quarter of fiscal 2017
» Successful execution of our strategic plan
◦ Integration of Jayco acquisition with significant margin improvement throughout
the year
» Consolidated Recreational Vehicle (RV) backlogs nearly doubled to $2.33 billion
versus 2016 fourth quarter of $1.20 billion
» Demand driven by continued strong consumer preference for our affordably-priced
travel trailers and motorhomes
» Continued strength in the RV Industry macro environment, health of the dealer
channel and expanding consumer base give us reason for continued optimism on
Thor’s future

Fourth Quarter 2017
Results Up Double Digits
16
» Record fourth-quarter results
» Gross profit up, though gross margins were lower due primarily to market driven changes in product mix and acquisition impact
» Strength at retail shows and dealer lot activity has continued, as new consumers embrace the benefits of RVing
$1,292.6
$1,934.7
Q4FY16 Q4FY17
Net Sales ($ millions)
$82.8
$119.5
Q4FY16 Q4FY17
Net Income ($ millions)
$1.57
$2.26
Q4FY16 Q4FY17
Diluted EPS
$223.4
$301.3
Q4FY16 Q4FY17
Gross Profit($ millions)
Fourth Quarter 2017
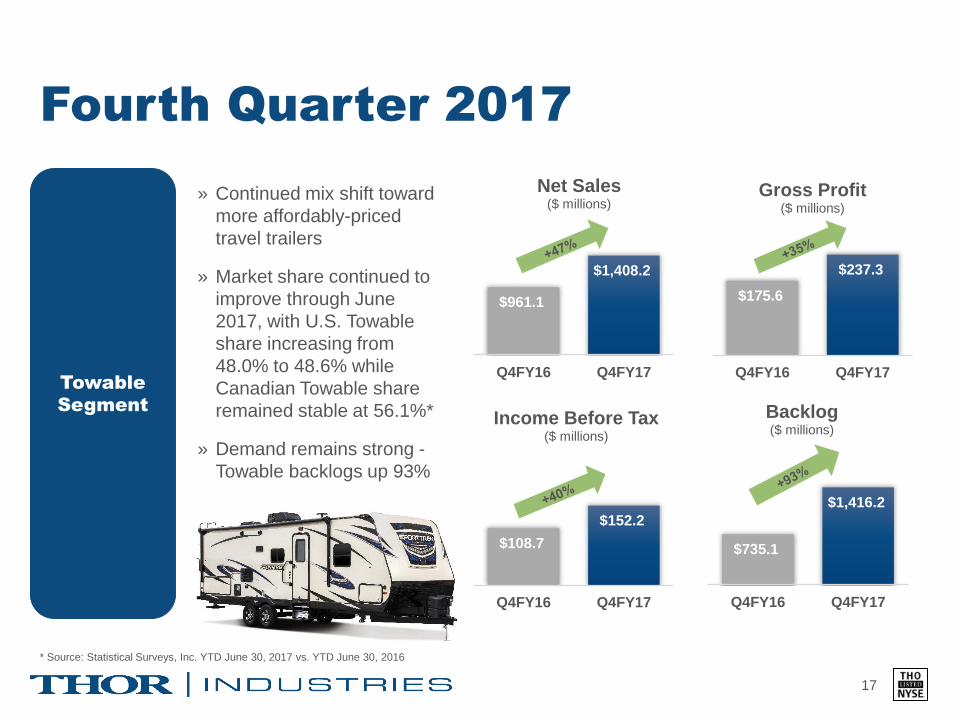
17
Towable
Segment
» Continued mix shift toward
more affordably-priced
travel trailers
» Market share continued to
improve through June
2017, with U.S. Towable
share increasing from
48.0% to 48.6% while
Canadian Towable share
remained stable at 56.1%*
» Demand remains strong -
Towable backlogs up 93%
$961.1
$1,408.2
Q4FY16 Q4FY17
Net Sales ($ millions)
$735.1
$1,416.2
Q4FY16 Q4FY17
Backlog($ millions)
$108.7
$152.2
Q4FY16 Q4FY17
Income Before Tax($ millions)
$175.6
$237.3
Q4FY16 Q4FY17
Gross Profit ($ millions)
* Source: Statistical Surveys, Inc. YTD June 30, 2017 vs. YTD June 30, 2016
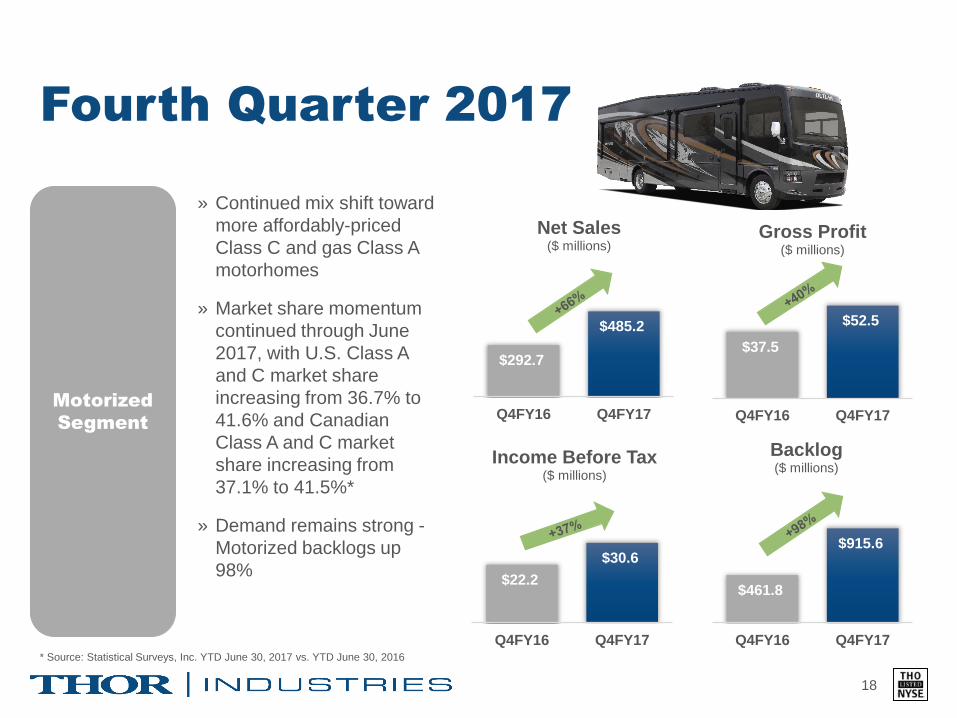
Fourth Quarter 2017
18
Motorized
Segment
» Continued mix shift toward
more affordably-priced
Class C and gas Class A
motorhomes
» Market share momentum
continued through June
2017, with U.S. Class A
and C market share
increasing from 36.7% to
41.6% and Canadian
Class A and C market
share increasing from
37.1% to 41.5%*
» Demand remains strong -
Motorized backlogs up
98%
$292.7
$485.2
Q4FY16 Q4FY17
Net Sales ($ millions)
$461.8
$915.6
Q4FY16 Q4FY17
Backlog($ millions)
$22.2
$30.6
Q4FY16 Q4FY17
Income Before Tax($ millions)
$37.5
$52.5
Q4FY16 Q4FY17
Gross Profit ($ millions)
* Source: Statistical Surveys, Inc. YTD June 30, 2017 vs. YTD June 30, 2016
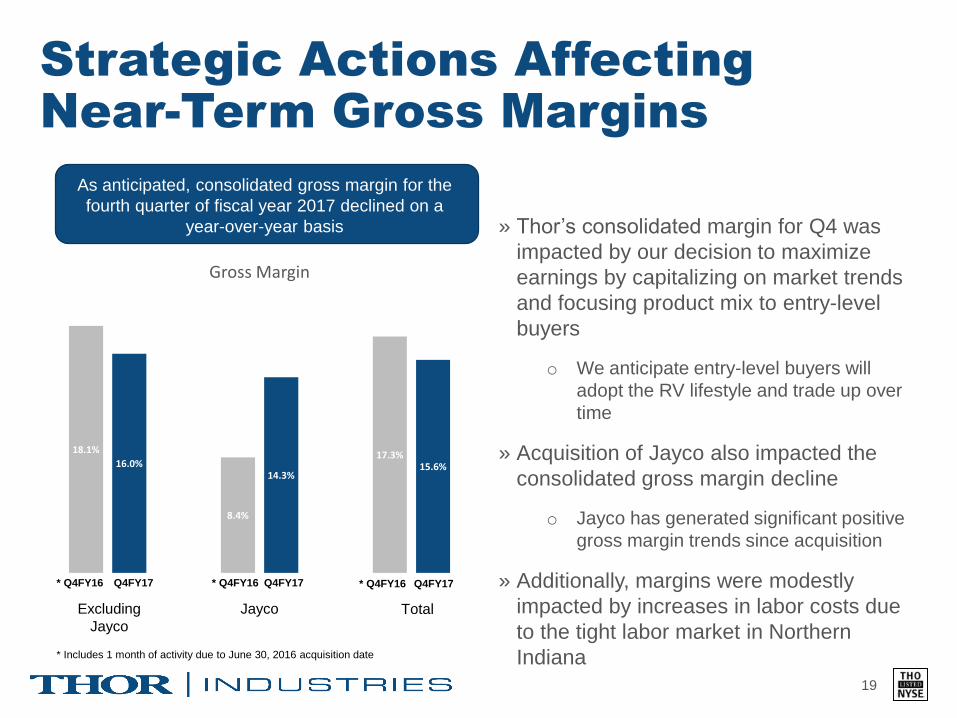
Strategic Actions Affecting
Near-Term Gross Margins
19
» Thor’s consolidated margin for Q4 was
impacted by our decision to maximize
earnings by capitalizing on market trends
and focusing product mix to entry-level
buyers
o We anticipate entry-level buyers will
adopt the RV lifestyle and trade up over
time
» Acquisition of Jayco also impacted the
consolidated gross margin decline
o Jayco has generated significant positive
gross margin trends since acquisition
» Additionally, margins were modestly
impacted by increases in labor costs due
to the tight labor market in Northern
Indiana
As anticipated, consolidated gross margin for the
fourth quarter of fiscal year 2017 declined on a
year-over-year basis
18.1%
8.4%
17.3%16.0%
14.3%15.6%
Gross Margin
* Q4FY16 Q4FY17 * Q4FY16 Q4FY17 * Q4FY16 Q4FY17
Excluding
Jayco
Jayco Total
* Includes 1 month of activity due to June 30, 2016 acquisition date

Fourth Quarter Jayco Impact
20
» Jayco had a significant, positive impact
on the fourth quarter, given three
months of results in Q4 FY17 vs. one in
Q4 FY16:
◦ Incremental $399.1 million in revenues
◦ Incremental $63.2 million to gross profit,
but dilutive to gross profit margin as
expected
» Jayco gross margin improved to 14.3% in the
fourth quarter, from less than 11% in the first
nine months of fiscal 2017
» Accretive to the fourth quarter
» Results included amortization expense of
$10.0 million associated with the acquisition
in Q4 FY17 vs. $4.5 million in Q4 of FY16
» Q4 of FY16 also included purchase
accounting adjustments which reduced
gross profit $2.2 million
$111.4
$151.7
$175.5
$202.0
$258.0
$374.3
FY12 FY13 FY14 FY15 FY16 FY17
Net Income
(Continuing Ops., $ millions)
$2,6
40
$3,2
42
$3,5
25
$4,0
07
$4,5
82
$7,2
47
FY12 FY13 FY14 FY15 FY16 FY17
Net Sales
(Continuing Ops., $ millions)
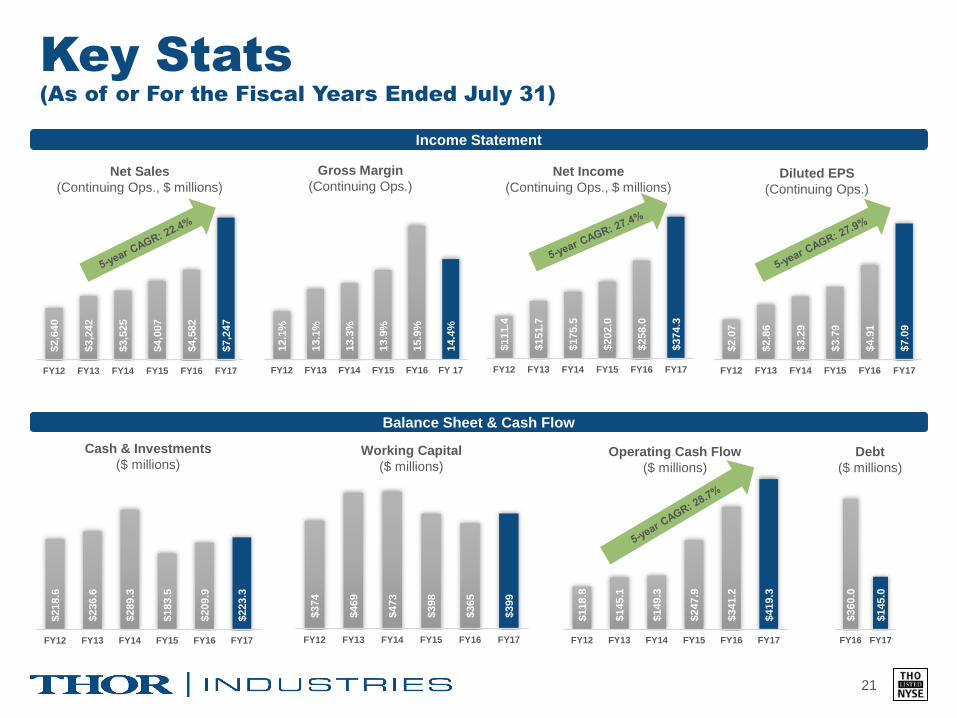
Key Stats (As of or For the Fiscal Years Ended July 31)
21
$2.0
7
$2.8
6
$3.2
9
$3.7
9
$4.9
1
$7.0
9
FY12 FY13 FY14 FY15 FY16 FY17
Diluted EPS
(Continuing Ops.)
12.1
%
13.1
%
13.3
%
13.9
%
15.9
%
14.4
%
FY12 FY13 FY14 FY15 FY16 FY 17
Gross Margin
(Continuing Ops.)
Income Statement
Balance Sheet & Cash Flow
$218.6
$236.6
$289.3
$183.5
$209.9
$223.3
FY12 FY13 FY14 FY15 FY16 FY17
Cash & Investments
($ millions)
$374
$469
$473
$398
$365
$399
FY12 FY13 FY14 FY15 FY16 FY17
Working Capital
($ millions)
$118.8
$145.1
$149.3
$247.9
$341.2
$419.3
FY12 FY13 FY14 FY15 FY16 FY17
Operating Cash Flow
($ millions)
$360.0
$145.0
FY16 FY17
Debt
($ millions)

Appendix: Financial & Market Data
22

Seasonal Shipment Patterns
23
0
10,000
20,000
30,000
40,000
50,000
60,000
Units
Retail * Wholesale *** Source: Statistical Surveys, Inc., U.S. and Canada
** Source: Recreation Vehicle Industry Association

RV Wholesale Market Trends
(Units 000s)
24
10
6.9 13
3.6
14
0.6
19
6.6
21
5.7
18
6.9
18
9.9 21
1.7
21
5.8
18
7.9
17
3.1
16
3.1
20
3.4 22
7.8 2
59
.5
24
7.2
24
7.5
25
4.5
29
2.7 32
1.2
30
0.1
25
6.8
31
1.0
32
0.8
37
0.1
38
4.4
39
0.5
35
3.5
23
7.0
16
5.6
24
2.3
25
2.3 2
85
.8 32
1.1 3
56
.8
37
4.2
43
0.7
47
9.7
49
1.2
198
0
198
1
198
2
198
3
198
4
198
5
198
6
198
7
198
8
198
9
199
0
199
1
199
2
199
3
199
4
199
5
199
6
199
7
199
8
199
9
200
0
200
1
200
2
200
3
200
4
200
5
200
6
200
7
200
8
200
9
201
0
201
1
201
2
201
3
201
4
201
5
201
6
201
7 (
e)
201
8 (
e)
Historical Data: Recreation Vehicle Industry Association; Calendar years 2017 and 2018 represent RVIA estimates as of Fall RV Roadsigns, published in August 2017
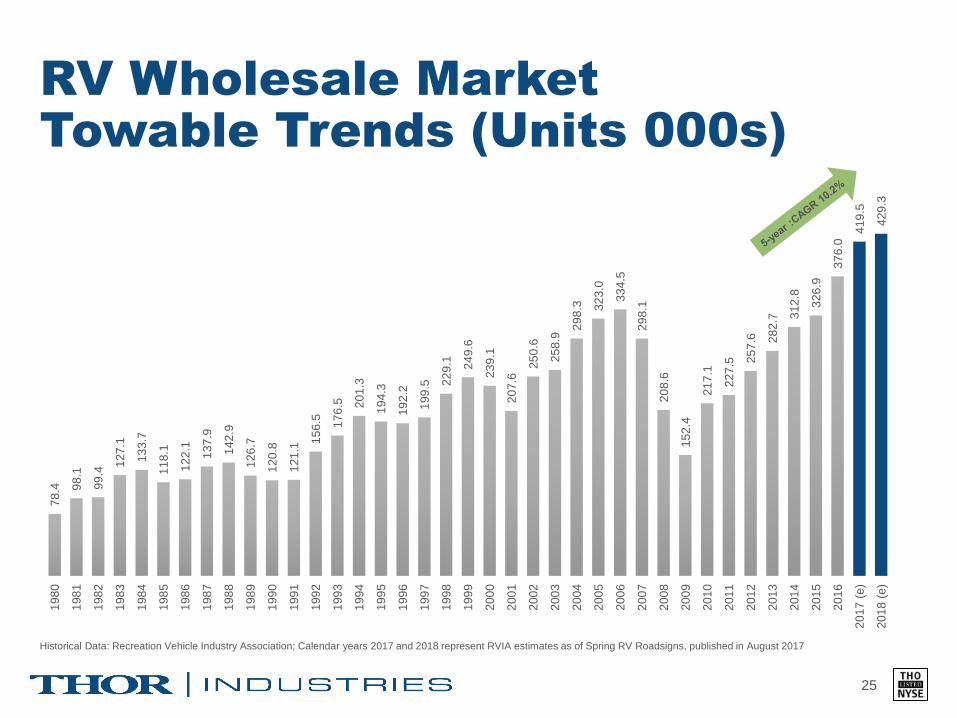
RV Wholesale Market
Towable Trends (Units 000s)
25
78
.4 98
.1
99
.4
12
7.1
13
3.7
11
8.1
12
2.1
13
7.9
14
2.9
12
6.7
12
0.8
12
1.1
15
6.5 17
6.5 20
1.3
19
4.3
19
2.2
19
9.5 2
29
.1 24
9.6
23
9.1
20
7.6
25
0.6
25
8.9
29
8.3 32
3.0
33
4.5
29
8.1
20
8.6
15
2.4
21
7.1
22
7.5 2
57
.6 28
2.7 3
12
.8
32
6.9
37
6.0
41
9.5
42
9.3
198
0
198
1
198
2
198
3
198
4
198
5
198
6
198
7
198
8
198
9
199
0
199
1
199
2
199
3
199
4
199
5
199
6
199
7
199
8
199
9
200
0
200
1
200
2
200
3
200
4
200
5
200
6
200
7
200
8
200
9
201
0
201
1
201
2
201
3
201
4
201
5
201
6
201
7 (
e)
201
8 (
e)
Historical Data: Recreation Vehicle Industry Association; Calendar years 2017 and 2018 represent RVIA estimates as of Spring RV Roadsigns, published in August 2017

RV Wholesale Market
Motorized Trends (Units 000s)
26
28
.5
35
.4
41
.2
69
.5
82
.0
68
.7
67
.7
73
.7
72
.8
61
.1
52
.3
41
.9
46
.9
51
.3
58
.2
52
.8 55
.3
55
.1
63
.5
71
.5
61
.0
49
.2
60
.4
62
.0
71
.7
61
.4
55
.8
55
.4
28
.4
13
.2
25
.2
24
.8 28
.2
38
.4
44
.0 47
.3
54
.7
60
.2 61
.9
198
0
198
1
198
2
198
3
198
4
198
5
198
6
198
7
198
8
198
9
199
0
199
1
199
2
199
3
199
4
199
5
199
6
199
7
199
8
199
9
200
0
200
1
200
2
200
3
200
4
200
5
200
6
200
7
200
8
200
9
201
0
201
1
201
2
201
3
201
4
201
5
201
6
201
7 (
e)
201
8 (
e)
Historical Data: Recreation Vehicle Industry Association; Calendar years 2017 and 2018 represent RVIA estimates as of Fall RV Roadsigns, published in August 2017
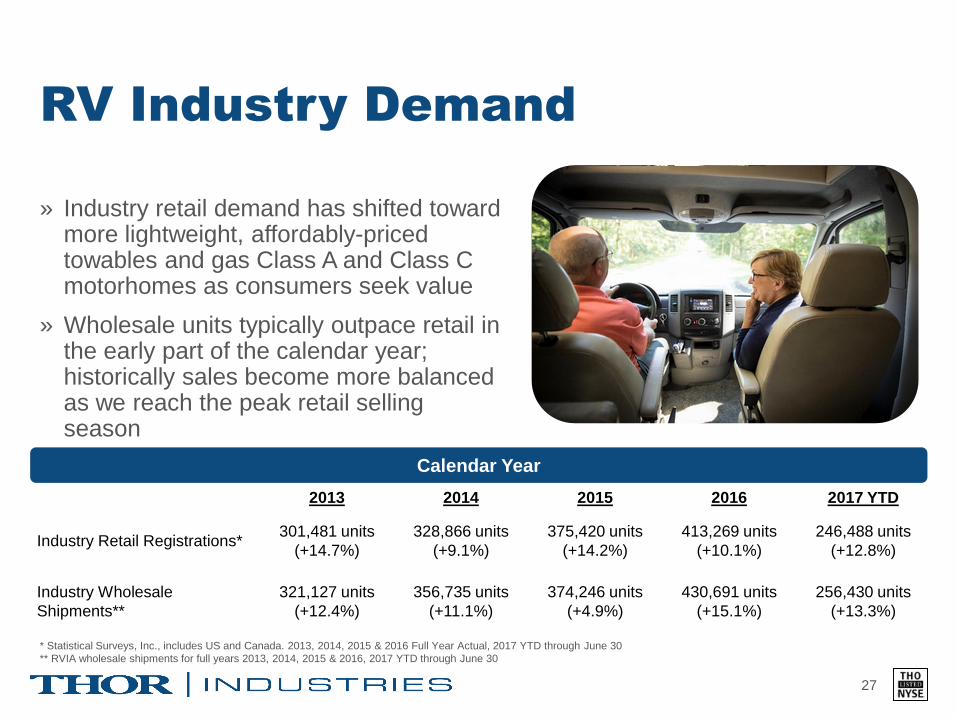
RV Industry Demand
» Industry retail demand has shifted toward more lightweight, affordably-priced towables and gas Class A and Class C motorhomes as consumers seek value
» Wholesale units typically outpace retail in the early part of the calendar year; historically sales become more balanced as we reach the peak retail selling season
27
2013 2014 2015 2016 2017 YTD
Industry Retail Registrations*301,481 units
(+14.7%)
328,866 units
(+9.1%)
375,420 units
(+14.2%)
413,269 units
(+10.1%)
246,488 units
(+12.8%)
Industry Wholesale
Shipments**
321,127 units
(+12.4%)
356,735 units
(+11.1%)
374,246 units
(+4.9%)
430,691 units
(+15.1%)
256,430 units
(+13.3%)
* Statistical Surveys, Inc., includes US and Canada. 2013, 2014, 2015 & 2016 Full Year Actual, 2017 YTD through June 30
** RVIA wholesale shipments for full years 2013, 2014, 2015 & 2016, 2017 YTD through June 30
Calendar Year
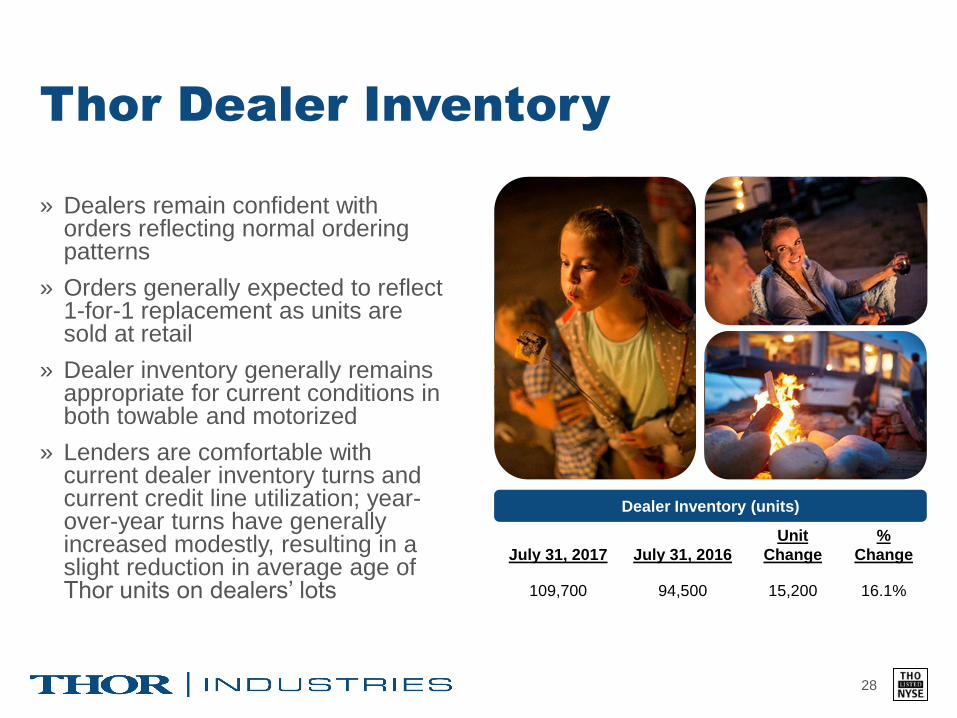
Thor Dealer Inventory
» Dealers remain confident with orders reflecting normal ordering patterns
» Orders generally expected to reflect 1-for-1 replacement as units are sold at retail
» Dealer inventory generally remains appropriate for current conditions in both towable and motorized
» Lenders are comfortable with current dealer inventory turns and current credit line utilization; year-over-year turns have generally increased modestly, resulting in a slight reduction in average age of Thor units on dealers’ lots
28
July 31, 2017 July 31, 2016
Unit
Change
%
Change
109,700 94,500 15,200 16.1%
Dealer Inventory (units)
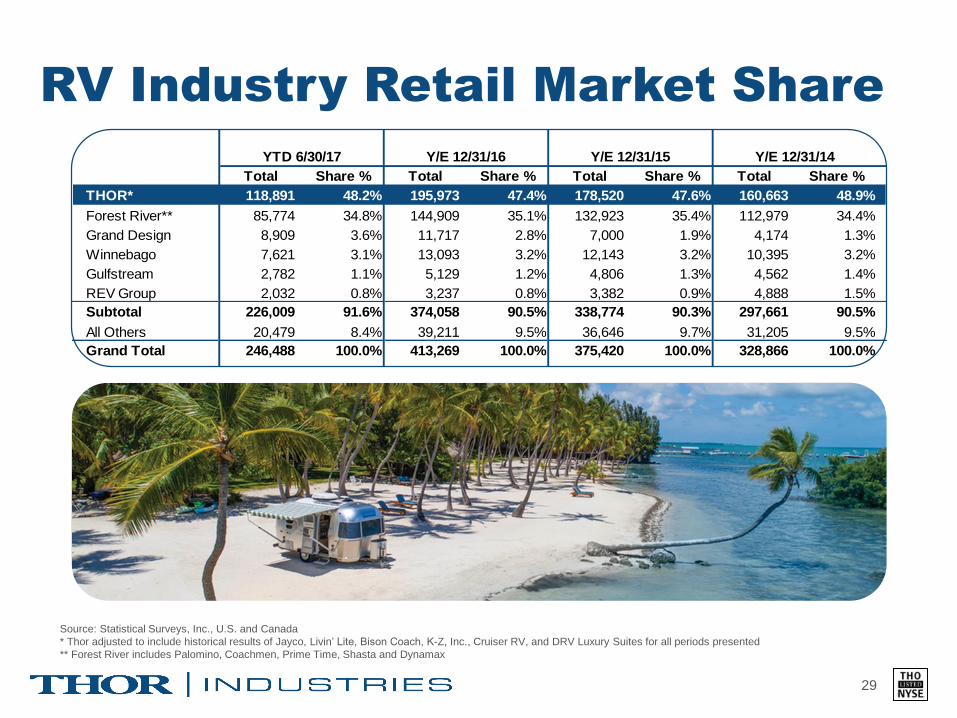
Total Share % Total Share % Total Share % Total Share %
THOR* 118,891 48.2% 195,973 47.4% 178,520 47.6% 160,663 48.9%
Forest River** 85,774 34.8% 144,909 35.1% 132,923 35.4% 112,979 34.4%
Grand Design 8,909 3.6% 11,717 2.8% 7,000 1.9% 4,174 1.3%
Winnebago 7,621 3.1% 13,093 3.2% 12,143 3.2% 10,395 3.2%
Gulfstream 2,782 1.1% 5,129 1.2% 4,806 1.3% 4,562 1.4%
REV Group 2,032 0.8% 3,237 0.8% 3,382 0.9% 4,888 1.5%
Subtotal 226,009 91.6% 374,058 90.5% 338,774 90.3% 297,661 90.5%
All Others 20,479 8.4% 39,211 9.5% 36,646 9.7% 31,205 9.5%
Grand Total 246,488 100.0% 413,269 100.0% 375,420 100.0% 328,866 100.0%
Y/E 12/31/16 Y/E 12/31/15 Y/E 12/31/14YTD 6/30/17
RV Industry Retail Market Share
29
Source: Statistical Surveys, Inc., U.S. and Canada
* Thor adjusted to include historical results of Jayco, Livin’ Lite, Bison Coach, K-Z, Inc., Cruiser RV, and DRV Luxury Suites for all periods presented
** Forest River includes Palomino, Coachmen, Prime Time, Shasta and Dynamax

Thor RV Retail Market Share
Trend (Units)
30
54.9%53.7%
51.3%49.7% 48.9% 49.5%
25.4%
29.4%31.0%
32.8%
37.8%
41.6%
16.7%
22.1% 21.9% 22.1%
18.3%
14.9%
2012 2013 2014 2015 2016 2017 YTD
Towable Retail Share* Class A/C Retail Share* Class B Retail Share*
*Source: Statistical Surveys Inc., U.S. and Canada, calendar years 2012-16, 2017 YTD through June 30. Historical results adjusted to include results of Jayco, Livin’ Lite, Bison Coach,
K-Z, Inc., Cruiser RV and DRV Luxury Suites for all periods presented. Note: Towable market share includes Travel Trailers, Fifth Wheels, Camping Trailers and Park Models.
www.thorindustries.com