Embed Size (px)
Citation preview

INVESTOR PRESENTATIONQ4 2017
2CRIUS ENERGY | INVESTOR PRESENTATION | Q4 2017
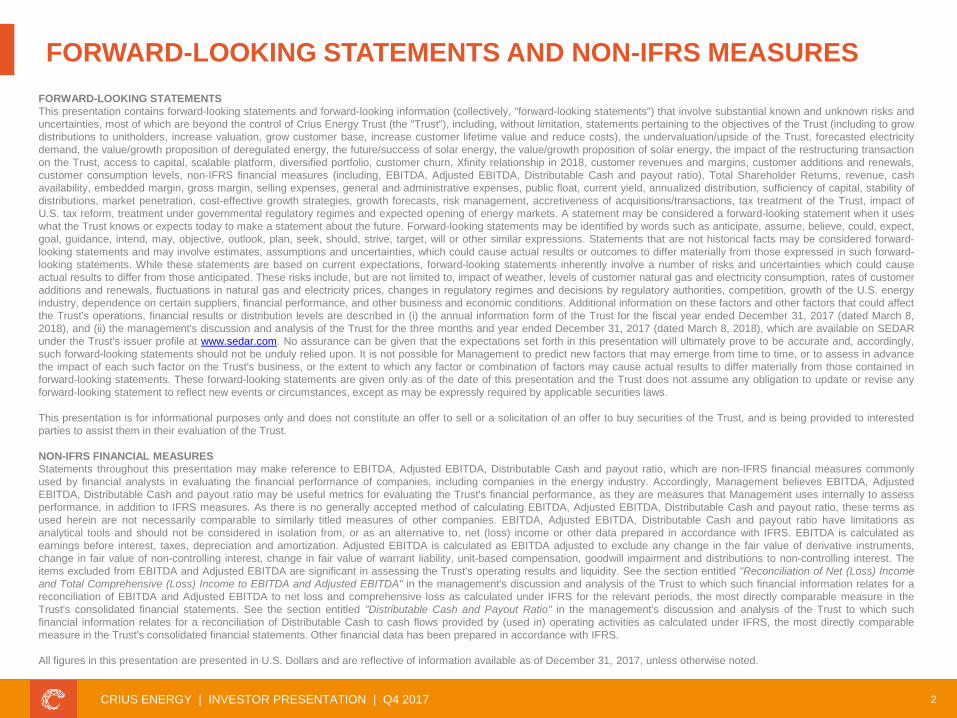
FORWARD-LOOKING STATEMENTS
This presentation contains forward-looking statements and forward-looking information (collectively, "forward-looking statements") that involve substantial known and unknown risks and
uncertainties, most of which are beyond the control of Crius Energy Trust (the "Trust"), including, without limitation, statements pertaining to the objectives of the Trust (including to grow
distributions to unitholders, increase valuation, grow customer base, increase customer lifetime value and reduce costs), the undervaluation/upside of the Trust, forecasted electricity
demand, the value/growth proposition of deregulated energy, the future/success of solar energy, the value/growth proposition of solar energy, the impact of the restructuring transaction
on the Trust, access to capital, scalable platform, diversified portfolio, customer churn, Xfinity relationship in 2018, customer revenues and margins, customer additions and renewals,
customer consumption levels, non-IFRS financial measures (including, EBITDA, Adjusted EBITDA, Distributable Cash and payout ratio), Total Shareholder Returns, revenue, cash
availability, embedded margin, gross margin, selling expenses, general and administrative expenses, public float, current yield, annualized distribution, sufficiency of capital, stability of
distributions, market penetration, cost-effective growth strategies, growth forecasts, risk management, accretiveness of acquisitions/transactions, tax treatment of the Trust, impact of
U.S. tax reform, treatment under governmental regulatory regimes and expected opening of energy markets. A statement may be considered a forward-looking statement when it uses
what the Trust knows or expects today to make a statement about the future. Forward-looking statements may be identified by words such as anticipate, assume, believe, could, expect,
goal, guidance, intend, may, objective, outlook, plan, seek, should, strive, target, will or other similar expressions. Statements that are not historical facts may be considered forward-
looking statements and may involve estimates, assumptions and uncertainties, which could cause actual results or outcomes to differ materially from those expressed in such forward-
looking statements. While these statements are based on current expectations, forward-looking statements inherently involve a number of risks and uncertainties which could cause
actual results to differ from those anticipated. These risks include, but are not limited to, impact of weather, levels of customer natural gas and electricity consumption, rates of customer
additions and renewals, fluctuations in natural gas and electricity prices, changes in regulatory regimes and decisions by regulatory authorities, competition, growth of the U.S. energy
industry, dependence on certain suppliers, financial performance, and other business and economic conditions. Additional information on these factors and other factors that could affect
the Trust's operations, financial results or distribution levels are described in (i) the annual information form of the Trust for the fiscal year ended December 31, 2017 (dated March 8,
2018), and (ii) the management's discussion and analysis of the Trust for the three months and year ended December 31, 2017 (dated March 8, 2018), which are available on SEDAR
under the Trust's issuer profile at www.sedar.com. No assurance can be given that the expectations set forth in this presentation will ultimately prove to be accurate and, accordingly,
such forward-looking statements should not be unduly relied upon. It is not possible for Management to predict new factors that may emerge from time to time, or to assess in advance
the impact of each such factor on the Trust's business, or the extent to which any factor or combination of factors may cause actual results to differ materially from those contained in
forward-looking statements. These forward-looking statements are given only as of the date of this presentation and the Trust does not assume any obligation to update or revise any
forward-looking statement to reflect new events or circumstances, except as may be expressly required by applicable securities laws.
This presentation is for informational purposes only and does not constitute an offer to sell or a solicitation of an offer to buy securities of the Trust, and is being provided to interested
parties to assist them in their evaluation of the Trust.
NON-IFRS FINANCIAL MEASURES
Statements throughout this presentation may make reference to EBITDA, Adjusted EBITDA, Distributable Cash and payout ratio, which are non-IFRS financial measures commonly
used by financial analysts in evaluating the financial performance of companies, including companies in the energy industry. Accordingly, Management believes EBITDA, Adjusted
EBITDA, Distributable Cash and payout ratio may be useful metrics for evaluating the Trust's financial performance, as they are measures that Management uses internally to assess
performance, in addition to IFRS measures. As there is no generally accepted method of calculating EBITDA, Adjusted EBITDA, Distributable Cash and payout ratio, these terms as
used herein are not necessarily comparable to similarly titled measures of other companies. EBITDA, Adjusted EBITDA, Distributable Cash and payout ratio have limitations as
analytical tools and should not be considered in isolation from, or as an alternative to, net (loss) income or other data prepared in accordance with IFRS. EBITDA is calculated as
earnings before interest, taxes, depreciation and amortization. Adjusted EBITDA is calculated as EBITDA adjusted to exclude any change in the fair value of derivative instruments,
change in fair value of non-controlling interest, change in fair value of warrant liability, unit-based compensation, goodwill impairment and distributions to non-controlling interest. The
items excluded from EBITDA and Adjusted EBITDA are significant in assessing the Trust's operating results and liquidity. See the section entitled "Reconciliation of Net (Loss) Income
and Total Comprehensive (Loss) Income to EBITDA and Adjusted EBITDA" in the management's discussion and analysis of the Trust to which such financial information relates for a
reconciliation of EBITDA and Adjusted EBITDA to net loss and comprehensive loss as calculated under IFRS for the relevant periods, the most directly comparable measure in the
Trust's consolidated financial statements. See the section entitled "Distributable Cash and Payout Ratio" in the management's discussion and analysis of the Trust to which such
financial information relates for a reconciliation of Distributable Cash to cash flows provided by (used in) operating activities as calculated under IFRS, the most directly comparable
measure in the Trust's consolidated financial statements. Other financial data has been prepared in accordance with IFRS.
All figures in this presentation are presented in U.S. Dollars and are reflective of information available as of December 31, 2017, unless otherwise noted.
FORWARD-LOOKING STATEMENTS AND NON-IFRS MEASURES

3CRIUS ENERGY | INVESTOR PRESENTATION | Q4 2017
CRIUS: A DIVERSIFIED ENERGY COMPANY
ELECTRICITY - NATURAL GAS - SOLAR
BROAD RANGE OF ENERGY PRODUCTS NOT OFFERED BY TRADITIONAL UTILITIES
ACTIVE IN 19 STATES + DC
SERVING OVER 1.4 MILLION CUSTOMERS*
BEST-IN-CLASS RISK MANAGEMENT
FULL SUITE OF SALES CHANNELS AND FAMILY OF BRANDS STRATEGY
*Measured in Residential Customer Equivalents or RCEs. An RCE is a unit of measure used by the energy industry to denote the typical annual commodity consumption by a single-family residential customer. A single RCE represents 100 MMBtu of natural gas or 10 MWh of electricity.

4CRIUS ENERGY | INVESTOR PRESENTATION | Q4 2017
KEY METRICS: FINANCIALS
ADJUSTED EBITDAREVENUE
PAYOUT RATIO
DISTRIBUTABLE CASH(in US$ millions) (in US$ millions) (in US$ millions)
GROSS MARGIN(in US$ millions)
EMBEDDED MARGIN(in US$ millions)
$507 $601
$686 $744
$876
2013 2014 2015 2016 2017
$32 $38
$53
$61 $65
2013 2014 2015 2016 2017
$27 $29
$35 $39
$45
2013 2014 2015 2016 2017
$103
$129
$164 $159
$184
2013 2014 2015 2016 2017
146%
99%
58% 58% 64%
2013 2014 2015 2016 2017
$267 $248 $280
$300
$474
2013 2014 2015 2016 2017
5CRIUS ENERGY | INVESTOR PRESENTATION | Q4 2017
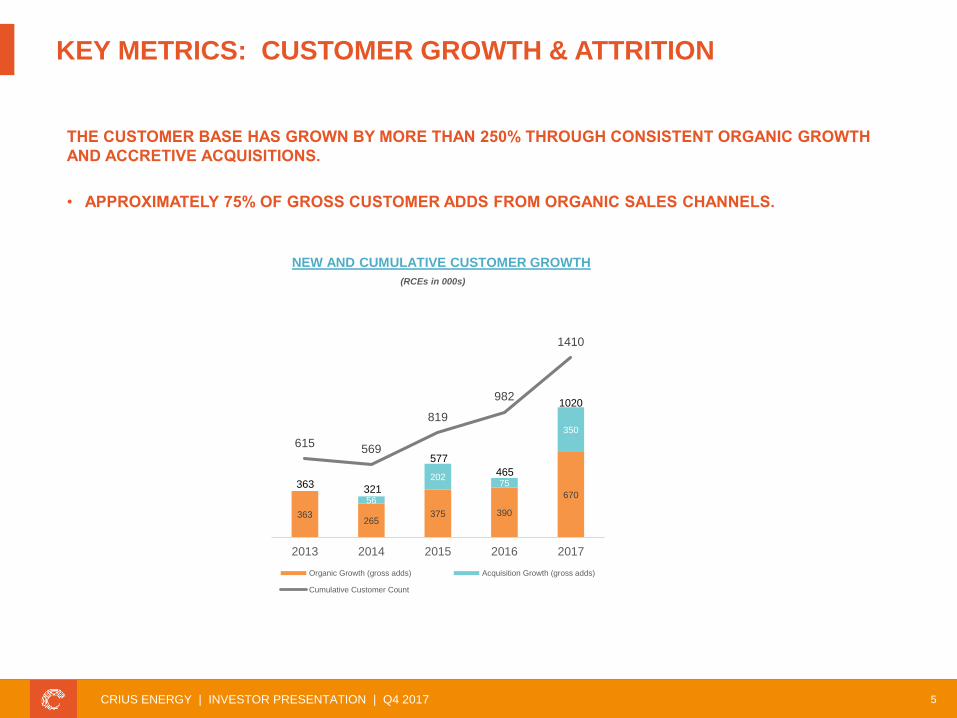
363265
375 390
67056
20275
350
615569
819
982
1410
2013 2014 2015 2016 2017
Organic Growth (gross adds) Acquisition Growth (gross adds)
Cumulative Customer Count
KEY METRICS: CUSTOMER GROWTH & ATTRITION
NEW AND CUMULATIVE CUSTOMER GROWTH
(RCEs in 000s)
THE CUSTOMER BASE HAS GROWN BY MORE THAN 250% THROUGH CONSISTENT ORGANIC GROWTH
AND ACCRETIVE ACQUISITIONS.
• APPROXIMATELY 75% OF GROSS CUSTOMER ADDS FROM ORGANIC SALES CHANNELS.
363 321
577
465
1020

6CRIUS ENERGY | INVESTOR PRESENTATION | Q4 2017
SERVICE AREA
CRIUS IS ACTIVE IN
19 STATES IN THE U.S. AND THE DISTRICT OF
COLUMBIA U.S. Source: U.S. Census Bureau; DNV GL Research; Intl. Source: World’s International Energy Consumption, Energy Central; U.S .
Solar Source: U.S. Census Bureau; SEIA.org
LARGE ADDRESSABLE MARKET
100 Million+ eligible customers
27% penetrationU.S.
35 Countries with energy choice
44% Deregulation worldwide
U.S. SOLAR ENERGY
<2%penetration
77Mowner-occupied homes
DEREGULATED ENERGY
INTL.

7CRIUS ENERGY | INVESTOR PRESENTATION | Q4 2017
SALES & MARKETING
COMMERCIAL ENERGY
SMALL & LARGE COMMERCIAL CUSTOMERS AND
MUNICIPAL AGGREGATIONS
BROKERS, AGGREGATORS & CONSULTANTS,
TELESALES
MASS MARKET ENERGY
RESIDENTIAL CUSTOMERS
EXCLUSIVE PARTNERHIPS,
INTEGRATED ENERGY PLATFORM
DOOR-TO-DOOR, TELESALES,
ONLINE & DIGITAL
DIVERSIFIED STRATEGY AND LOW CUSTOMER ACQUISITION COST PROVIDE A COMPETITIVE ADVANTAGE
Full suite of sales
channels and
family of brands
strategy
Access to
millions of
“warm”
customers
Top rankings by
J.D. Power for
customer
satisfaction
Proprietary, web-
based broker
portal
5-year track record
of success with
Municipal
Aggregations
More than 800
broker
relationships
8CRIUS ENERGY | INVESTOR PRESENTATION | Q4 2017
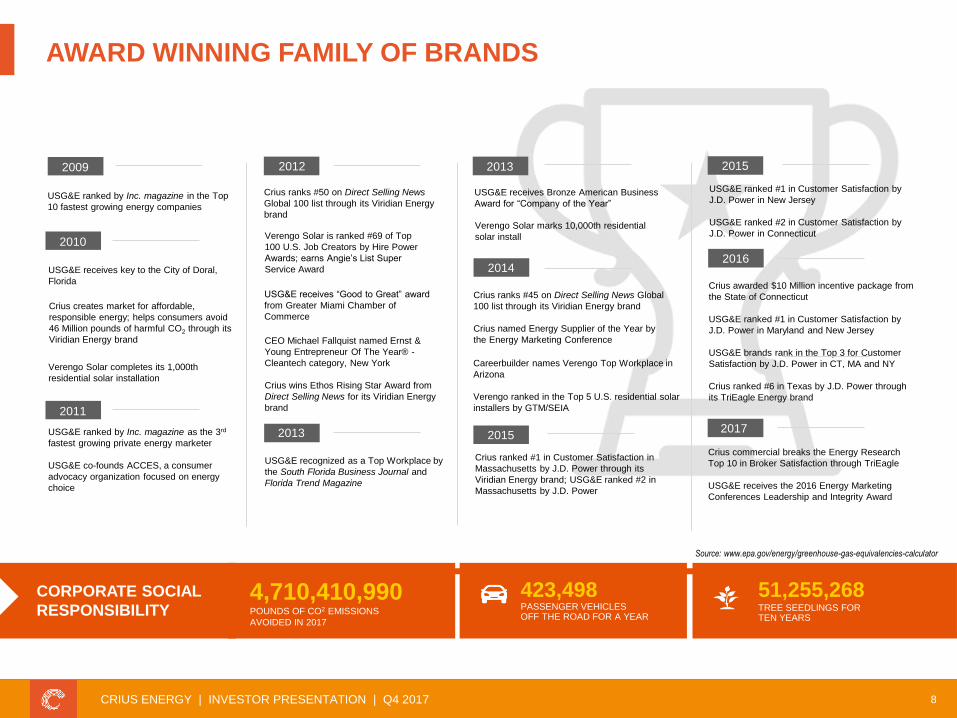
CORPORATE SOCIAL
RESPONSIBILITY4,710,410,990POUNDS OF CO2 EMISSIONS
AVOIDED IN 2017
423,498 PASSENGER VEHICLES OFF THE ROAD FOR A YEAR
51,255,268TREE SEEDLINGS FOR TEN YEARS
USG&E ranked by Inc. magazine in the Top
10 fastest growing energy companies
USG&E receives key to the City of Doral,
Florida
Crius creates market for affordable,
responsible energy; helps consumers avoid
46 Million pounds of harmful CO2 through its
Viridian Energy brand
2009
2010
Verengo Solar completes its 1,000th
residential solar installation
USG&E ranked by Inc. magazine as the 3rd
fastest growing private energy marketer
USG&E co-founds ACCES, a consumer
advocacy organization focused on energy
choice
2011
Crius ranks #50 on Direct Selling News
Global 100 list through its Viridian Energy
brand
2012
Verengo Solar is ranked #69 of Top
100 U.S. Job Creators by Hire Power
Awards; earns Angie’s List Super
Service Award
USG&E receives “Good to Great” award
from Greater Miami Chamber of
Commerce
2013
CEO Michael Fallquist named Ernst &
Young Entrepreneur Of The Year® -
Cleantech category, New York
Crius wins Ethos Rising Star Award from
Direct Selling News for its Viridian Energy
brand
USG&E recognized as a Top Workplace by
the South Florida Business Journal and
Florida Trend Magazine
USG&E receives Bronze American Business
Award for “Company of the Year”
Verengo Solar marks 10,000th residential
solar install
2014
Crius ranks #45 on Direct Selling News Global
100 list through its Viridian Energy brand
Crius named Energy Supplier of the Year by
the Energy Marketing Conference
Careerbuilder names Verengo Top Workplace in
Arizona
Verengo ranked in the Top 5 U.S. residential solar
installers by GTM/SEIA
2015
Crius ranked #1 in Customer Satisfaction in
Massachusetts by J.D. Power through its
Viridian Energy brand; USG&E ranked #2 in
Massachusetts by J.D. Power
2015
Crius awarded $10 Million incentive package from
the State of Connecticut
USG&E ranked #1 in Customer Satisfaction by
J.D. Power in Maryland and New Jersey
USG&E brands rank in the Top 3 for Customer
Satisfaction by J.D. Power in CT, MA and NY
Crius ranked #6 in Texas by J.D. Power through
its TriEagle Energy brand
2017
Crius commercial breaks the Energy Research
Top 10 in Broker Satisfaction through TriEagle
USG&E receives the 2016 Energy Marketing
Conferences Leadership and Integrity Award
2013
Source: www.epa.gov/energy/greenhouse-gas-equivalencies-calculator
USG&E ranked #1 in Customer Satisfaction by
J.D. Power in New Jersey
USG&E ranked #2 in Customer Satisfaction by
J.D. Power in Connecticut
2016
AWARD WINNING FAMILY OF BRANDS
9CRIUS ENERGY | INVESTOR PRESENTATION | Q4 2017
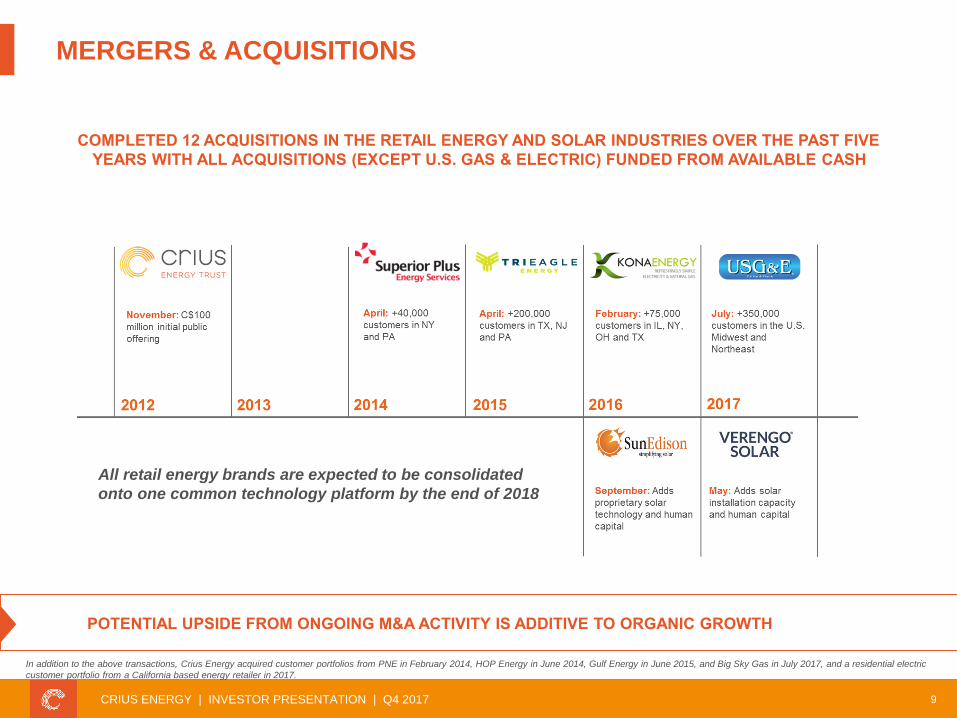
MERGERS & ACQUISITIONS
POTENTIAL UPSIDE FROM ONGOING M&A ACTIVITY IS ADDITIVE TO ORGANIC GROWTH
COMPLETED 12 ACQUISITIONS IN THE RETAIL ENERGY AND SOLAR INDUSTRIES OVER THE PAST FIVE
YEARS WITH ALL ACQUISITIONS (EXCEPT U.S. GAS & ELECTRIC) FUNDED FROM AVAILABLE CASH
In addition to the above transactions, Crius Energy acquired customer portfolios from PNE in February 2014, HOP Energy in June 2014, Gulf Energy in June 2015, and Big Sky Gas in July 2017, and a residential electric
customer portfolio from a California based energy retailer in 2017.
All retail energy brands are expected to be consolidated
onto one common technology platform by the end of 2018

10CRIUS ENERGY | INVESTOR PRESENTATION | Q4 2017
BUSINESS UPDATE - ACQUISITION OF U.S. GAS & ELECTRIC INC. (USG&E)
BUSINESS OVERVIEW:
• Leading U.S. retail energy company with solid
organic growth and strong margins per RCE*
• Electricity and natural gas markets
• Residential and small commercial customers
• Approximately 350,000 RCEs
• Customers in 11 states and D.C., in 62
deregulated utility markets
KEY TRANSACTION BENEFITS
• On a pro forma basis as of March 31, 2017:
• ~16% accretive to distributable cash and
expected to deliver strong accretion in 2018,
before accounting for planned synergies
• Robust direct-to-consumer sales channels added
and expected to deliver incremental residential
customer growth
• Increased natural gas customer base from 6% to
14% of total customer portfolio
• Expanded service territory to include the Michigan
and Kentucky natural gas markets
*An RCE is a unit of measure used by the energy industry to denote the typical annual commodity consumption by a single-family residential customer. A single RCE represents 100 MMBtu of natural gas or 10 MWh of
electricity. **This forward looking information uses assumptions and estimates that have not been projected beyond the end of Crius’ next fiscal year. However, such assumptions and estimates have been expressed over
a three year period as the synergies are expected to be realized over that period.
EXPECTED POST TAX-REFORM
SYNERGIES:
• After-tax synergies to Distributable Cash
of $41 million to $47 million over a three-
year period**
• Annual run-rate after-tax cash
synergies of $10 - $12 million through
restructuring, transition to Crius’
technology platform, renegotiated
credit facility pricing and trading terms
and tax benefits.
• One-time cash tax savings of ~$11
million in net operating losses of
Verengo to offset current and future
taxable income over the next two to
three years.
SYNERGIES OF
$41 - $47 M

11CRIUS ENERGY | INVESTOR PRESENTATION | Q4 2017
Portfolio Optimization Mergers & Acquisitions Customer Engagement Integrated Energy
Description
• Segment new and existing
customers to provide
differentiated product offers
and service levels
• Acquire U.S. and
international energy
retailers
• Engage customer
continuously throughout life
of relationship
• Develop integrated energy
product strategy
Business
Drivers
• Increase margin, increase
retention
• Reduce risk profile (scale,
diversity), lower costs
(operating leverage),
expand sales channels,
new products or
geographies
• Increase retention, enable
cross-sell, customer
acquisition, reduce cost-to-
serve
• Improve customer value
proposition, increase
retention, increase margin,
enhance sales
Activities
• Customer segmentation to
calculate individual customer
lifetime value
• Individualized customer
offers to meet minimum
margin requirements
• Customer service, renewal
and retention segmented on
CLV
• Customer book acquisitions
• Strategic business
acquisitions
• USG&E Integration
• Identify technologies /
strategies to facilitate
ongoing customer
interaction
• Integrate electricity and
natural gas products with
adjacent energy
management products (e.g.
demand response, energy
efficiency)
• Priority to integrate
residential solar and retail
electricity
KEY STRATEGIC PRIORITIES TO GROW DISTRIBUTABLE CASH THROUGH
MARGIN GROWTH AND COST REDUCTION
STRATEGIC PRIORITIES

FINANCIALS
13CRIUS ENERGY | INVESTOR PRESENTATION | Q4 2017
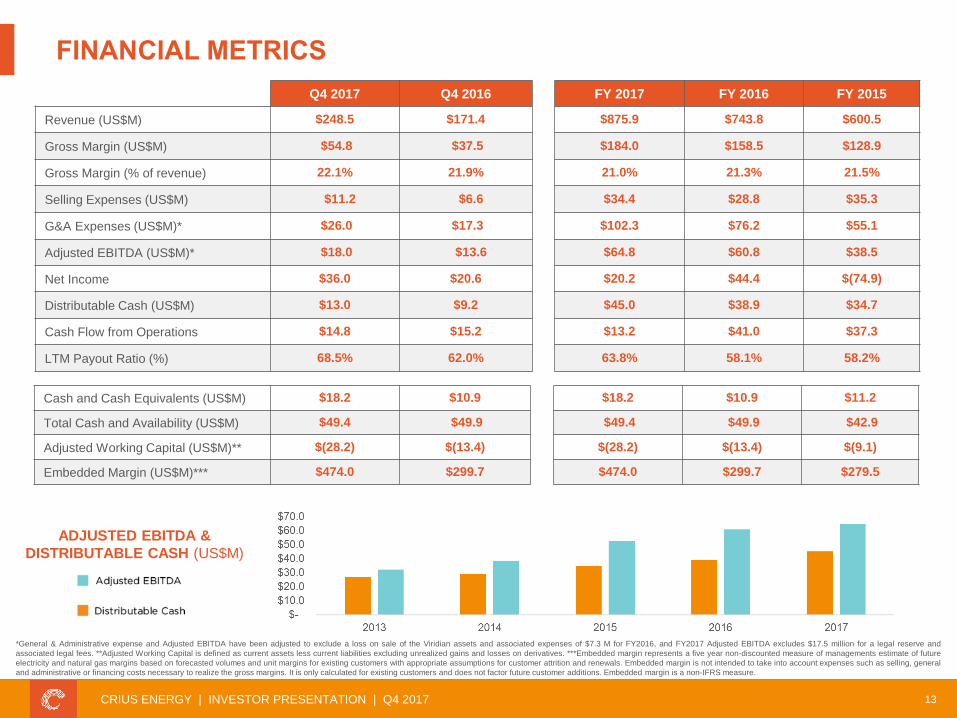
FINANCIAL METRICS
Q4 2017 Q4 2016 FY 2017 FY 2016 FY 2015
Revenue (US$M) $248.5 $171.4 $875.9 $743.8 $600.5
Gross Margin (US$M) $54.8 $37.5 $184.0 $158.5 $128.9
Gross Margin (% of revenue) 22.1% 21.9% 21.0% 21.3% 21.5%
Selling Expenses (US$M) $11.2 $6.6 $34.4 $28.8 $35.3
G&A Expenses (US$M)* $26.0 $17.3 $102.3 $76.2 $55.1
Adjusted EBITDA (US$M)* $18.0 $13.6 $64.8 $60.8 $38.5
Net Income $36.0 $20.6 $20.2 $44.4 $(74.9)
Distributable Cash (US$M) $13.0 $9.2 $45.0 $38.9 $34.7
Cash Flow from Operations $14.8 $15.2 $13.2 $41.0 $37.3
LTM Payout Ratio (%) 68.5% 62.0% 63.8% 58.1% 58.2%
Cash and Cash Equivalents (US$M) $18.2 $10.9 $18.2 $10.9 $11.2
Total Cash and Availability (US$M) $49.4 $49.9 $49.4 $49.9 $42.9
Adjusted Working Capital (US$M)** $(28.2) $(13.4) $(28.2) $(13.4) $(9.1)
Embedded Margin (US$M)*** $474.0 $299.7 $474.0 $299.7 $279.5
ADJUSTED EBITDA &
DISTRIBUTABLE CASH (US$M)
*General & Administrative expense and Adjusted EBITDA have been adjusted to exclude a loss on sale of the Viridian assets and associated expenses of $7.3 M for FY2016, and FY2017 Adjusted EBITDA excludes $17.5 million for a legal reserve and
associated legal fees. **Adjusted Working Capital is defined as current assets less current liabilities excluding unrealized gains and losses on derivatives. ***Embedded margin represents a five year non-discounted measure of managements estimate of future
electricity and natural gas margins based on forecasted volumes and unit margins for existing customers with appropriate assumptions for customer attrition and renewals. Embedded margin is not intended to take into account expenses such as selling, general
and administrative or financing costs necessary to realize the gross margins. It is only calculated for existing customers and does not factor future customer additions. Embedded margin is a non-IFRS measure.

14CRIUS ENERGY | INVESTOR PRESENTATION | Q4 2017
GROSS MARGIN
• Unit margins trended lower from 2015 to 2017 following the
acquisition of TriEagle Energy, primarily as a result of the
changing sales channel mix as the portfolio now has a higher
proportion of lower-margin commercial / municipal
aggregation customers
• Improved margin profile post-USG&E acquisition due to the
higher-margin, residential and small commercial customer
base of USG&E, which historically generated margins of
over $200/RCE per year
• Management expect the past declining margin trend to
moderate and for margins to remain near current levels, due
to:
– Higher margin residential-focused USG&E channels
– Increased focus on small commercial segment
– Strategic initiatives focused on margin enhancement
including portfolio optimization and increased customer
engagement
Management expect a reversal of channel-mix-driven declining unit margin trends, due to focus on
higher-margin residential and commercial customers and strategic initiatives
*LTM figures represent ‘as reported’ i.e., Q4 2016 through Q2 2017 Crius Energy-only and Q3 2017 including USG&E results. ** Pro-Forma figures represent Crius Energy and USG&E unaudited results, excluding synergies.
$119
$159 $154 $178
$221
FY 2014 FY 2015 FY 2016 FY 2017 PF 2017**
GROSS MARGIN (US$M)
$201
$229
$171 $163 $173
FY 2014 FY 2015 FY 2016 FY 2017 PF 2017**
GROSS MARGIN (US$/RCE, PER YEAR)
15CRIUS ENERGY | INVESTOR PRESENTATION | Q4 2017
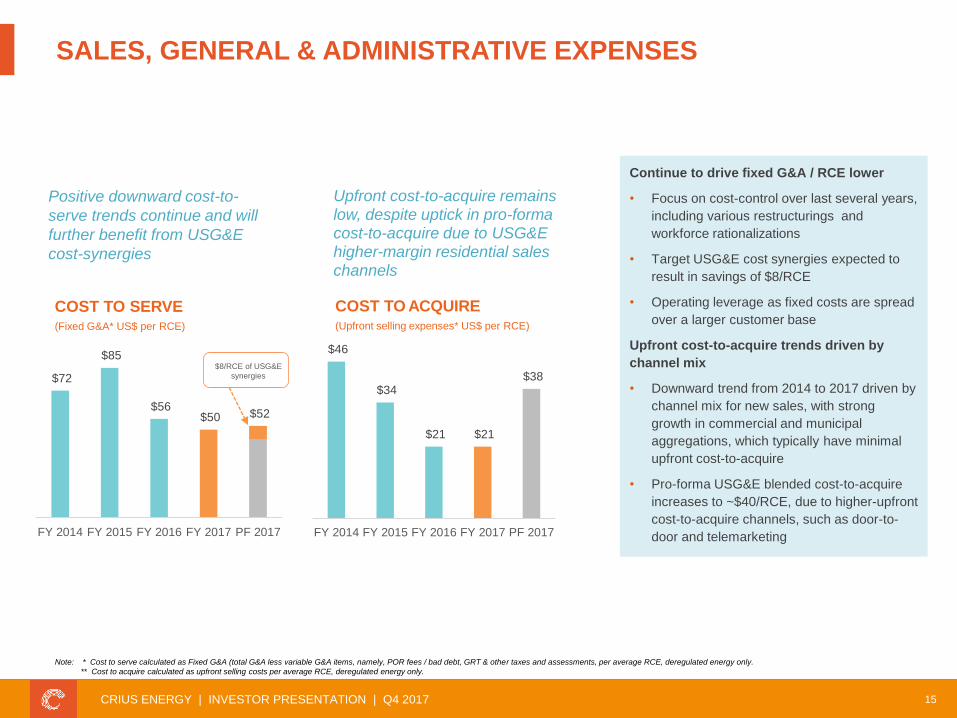
$72
$85
$56 $50 $52
FY 2014 FY 2015 FY 2016 FY 2017 PF 2017
Continue to drive fixed G&A / RCE lower
• Focus on cost-control over last several years,
including various restructurings and
workforce rationalizations
• Target USG&E cost synergies expected to
result in savings of $8/RCE
• Operating leverage as fixed costs are spread
over a larger customer base
Upfront cost-to-acquire trends driven by
channel mix
• Downward trend from 2014 to 2017 driven by
channel mix for new sales, with strong
growth in commercial and municipal
aggregations, which typically have minimal
upfront cost-to-acquire
• Pro-forma USG&E blended cost-to-acquire
increases to ~$40/RCE, due to higher-upfront
cost-to-acquire channels, such as door-to-
door and telemarketing
SALES, GENERAL & ADMINISTRATIVE EXPENSES
COST TO SERVE(Fixed G&A* US$ per RCE)
COST TO ACQUIRE(Upfront selling expenses* US$ per RCE)
Positive downward cost-to-
serve trends continue and will
further benefit from USG&E
cost-synergies
Note: * Cost to serve calculated as Fixed G&A (total G&A less variable G&A items, namely, POR fees / bad debt, GRT & other taxes and assessments, per average RCE, deregulated energy only.
** Cost to acquire calculated as upfront selling costs per average RCE, deregulated energy only.
Upfront cost-to-acquire remains low, despite uptick in pro-forma cost-to-acquire due to USG&E
higher-margin residential sales channels
$8/RCE of USG&E
synergies
$46
$34
$21 $21
$38
FY 2014 FY 2015 FY 2016 FY 2017 PF 2017
16CRIUS ENERGY | INVESTOR PRESENTATION | Q4 2017
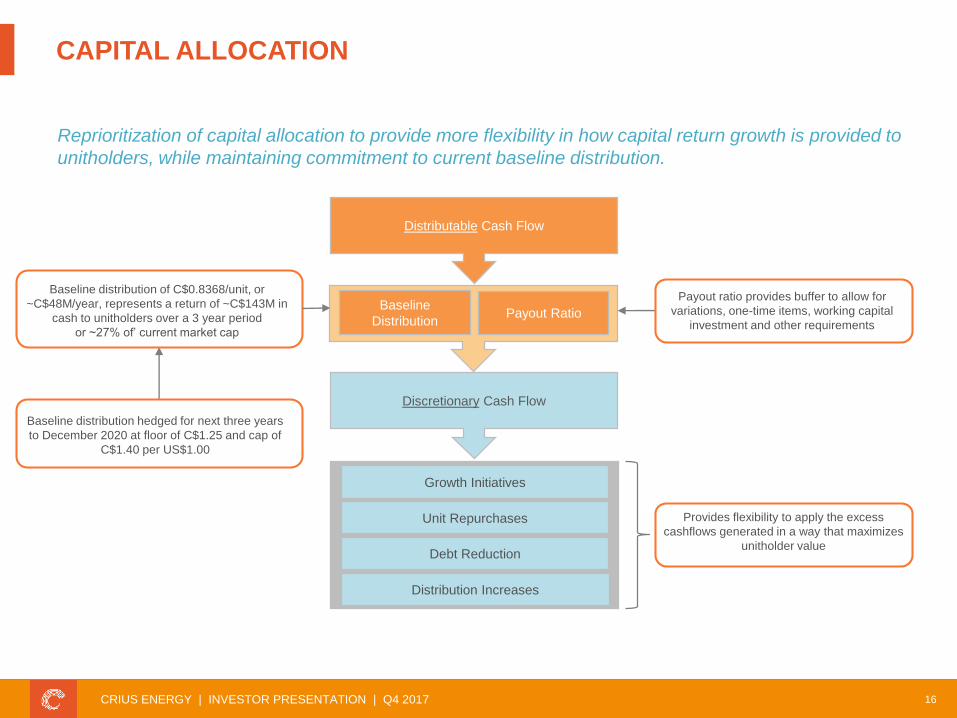
Payout RatioBaseline
Distribution
Distributable Cash Flow
Growth Initiatives
Debt Reduction
Unit Repurchases
Distribution Increases
Baseline distribution hedged for next three years
to December 2020 at floor of C$1.25 and cap of
C$1.40 per US$1.00
Baseline distribution of C$0.8368/unit, or
~C$48M/year, represents a return of ~C$143M in
cash to unitholders over a 3 year period
or ~27% of’ current market cap
Provides flexibility to apply the excess
cashflows generated in a way that maximizes
unitholder value
Payout ratio provides buffer to allow for
variations, one-time items, working capital
investment and other requirements
Reprioritization of capital allocation to provide more flexibility in how capital return growth is provided to
unitholders, while maintaining commitment to current baseline distribution.
Discretionary Cash Flow
CAPITAL ALLOCATION

17CRIUS ENERGY | INVESTOR PRESENTATION | Q4 2017
Insiders Non-Insiders
UNITHOLDER LOCK-UPS
• Lock-up agreements in place primarily with
founding LLC holders and certain USG&E
sellers to ensure orderly trading of units
following transactions in 2016 and 2017
• Upon the closing of the USG&E acquisition,
10.4M units were subject to lock-up
(representing 18% of units outstanding)
• As of January 6, 2018 only 3.3M units remain
subject to lock-up (representing 6% of units
outstanding, with only 2% held by non-
insiders)
• Final tranche expires on June 24, 2018
13%
7%
Over six-month period from closing of USG&E acquisition, 7.2M units, representing 13% or ~C$65M of
KWH units became freely-tradeable with minimal activity and/or impact to the unit price.
* Insiders comprised of >10% holders and Crius Energy CEO
10%
8%
10%
8%
10%
8%
10%
8%
4% 4% 4% 4% 4%
2% 2% 2%
7/17 8/17 9/17 10/17 11/17 12/17 1/18 2/18 3/18 4/18 5/18 6/18
10
8
6
4
2 4% 4%
2% 2%
Units (
M)
LOCK-UP SUMMARY
KWH.UN unit price0%
-10%
10%

18CRIUS ENERGY | INVESTOR PRESENTATION | Q4 2017
BALANCED RISK PORTFOLIO
CONTRACT TYPE
COMMODITY / GEOGRAPHY
Mid-Atlantic (PJM) represents all or parts of DE, IL, IN, KY, MD, MI, NC, NJ, OH, PA, TN, VA, WV and DC. New York (NY-ISO) represents NY
exclusively. New England (ISO-NE) represents all or parts of CT, MA, ME, NH, RI and VT. Midwest (MISO) represents all or parts of AK, IA, IL, IN, KY,
LA, MI, MN, MO, MS, MT, ND, SD, WI, and Manitoba, Canada. Texas (ERCOT) represents TX exclusively.
• Strong and diversified electricity and natural gas customer base
• Other income streams – including solar and fee revenue – provide further diversification
• Further diversification benefits realized from acquisition of U.S. Gas & Electric
REVENUE EXPOSURE
CUSTOMER SEGMENT
45%
18%
13%
8%
2%
14%
Mid-Atlantic - Electric New England - Electric
Texas - Electric New York - Electric
Midwest - Electric Natural Gas
20%
80%
Credit Check Utility Guaranteed
36%
64%
Commercial Mass Market
70%
30%
Fixed Variable

19CRIUS ENERGY | INVESTOR PRESENTATION | Q4 2017
WHY OWN CRIUS?
HIGH GROWTH BUSINESS
– Demonstrated track record of organic and acquisitive growth
with ~75% of gross customer adds from our diversified sales
channels and differentiated, highly acclaimed family of brands
– Significant growth potential from exclusive 5-year Comcast
partnership and proprietary Integrated Energy Platform
strategy
– Further upside from solar business once fully integrated with
retail energy operations
SUFFICIENT CAPITAL TO GROW
– Low customer acquisition cost
– $49.4 million of cash availability
– ~1x Debt-to-Adjusted EBITDA ratio
STABLE DISTRIBUTIONS
– Large, diversified customer portfolio supported by best-in-
class risk management capabilities
– Distribution increased by ~20% since the beginning of 2016
– Payout ratio of 64%
C$7.82
57 M
C$446 M
C$0.84 / unit
10.7%
~ 6%
Unit Price at 7-Mar-2018
Units Outstanding
Market Capitalization
Annual Distribution
Yield
Management/Board Ownership
KWH.UNToronto Stock Exchange
Total return over
9% since January 1, 2016
Management/Board Ownership reflects interests held by Senior Management
and the Trust Board, including approximately 2 million phantom unit rights
(PURs) that are subject to performance targets.

APPENDIX
21CRIUS ENERGY | INVESTOR PRESENTATION | Q4 2017
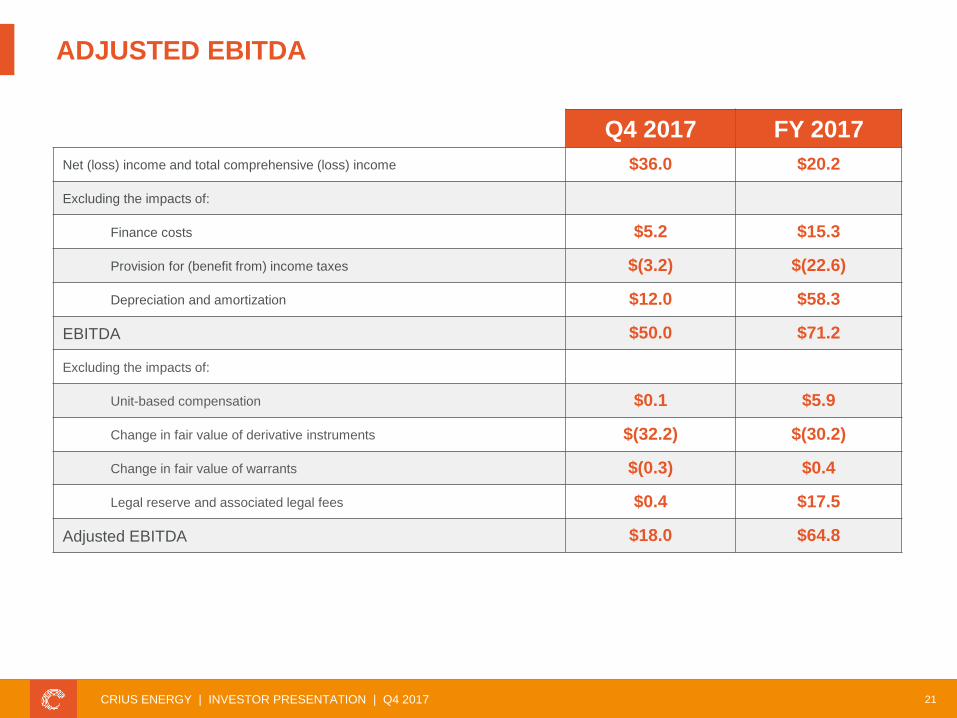
Q4 2017 FY 2017
Net (loss) income and total comprehensive (loss) income $36.0 $20.2
Excluding the impacts of:
Finance costs $5.2 $15.3
Provision for (benefit from) income taxes $(3.2) $(22.6)
Depreciation and amortization $12.0 $58.3
EBITDA $50.0 $71.2
Excluding the impacts of:
Unit-based compensation $0.1 $5.9
Change in fair value of derivative instruments $(32.2) $(30.2)
Change in fair value of warrants $(0.3) $0.4
Legal reserve and associated legal fees $0.4 $17.5
Adjusted EBITDA $18.0 $64.8
ADJUSTED EBITDA
22CRIUS ENERGY | INVESTOR PRESENTATION | Q4 2017
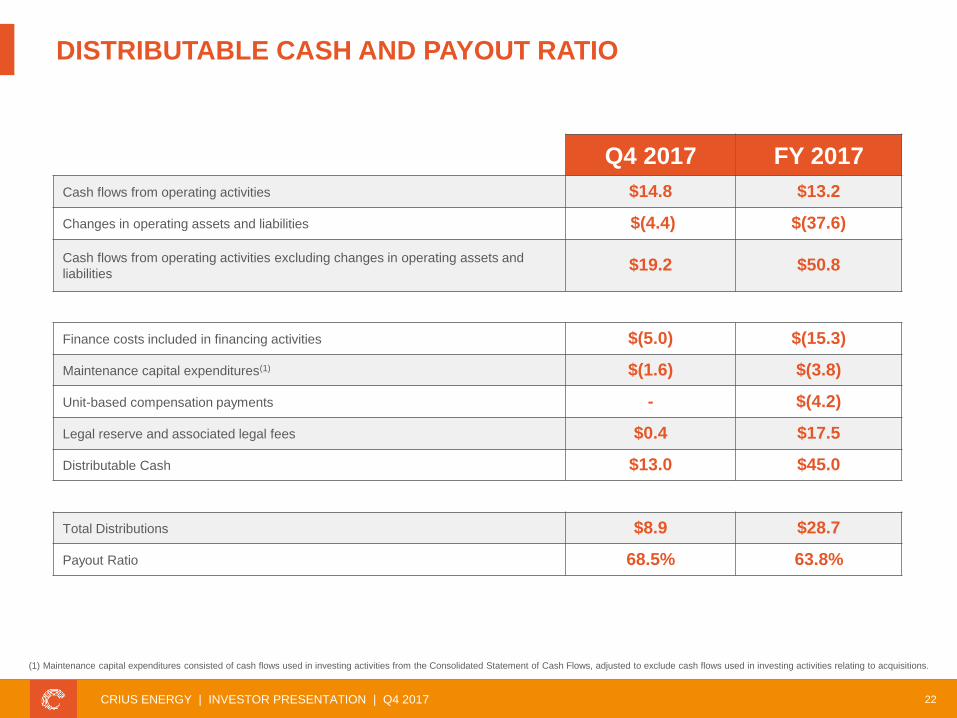
Q4 2017 FY 2017
Cash flows from operating activities $14.8 $13.2
Changes in operating assets and liabilities $(4.4) $(37.6)
Cash flows from operating activities excluding changes in operating assets and
liabilities$19.2 $50.8
Finance costs included in financing activities $(5.0) $(15.3)
Maintenance capital expenditures(1) $(1.6) $(3.8)
Unit-based compensation payments - $(4.2)
Legal reserve and associated legal fees $0.4 $17.5
Distributable Cash $13.0 $45.0
Total Distributions $8.9 $28.7
Payout Ratio 68.5% 63.8%
DISTRIBUTABLE CASH AND PAYOUT RATIO
(1) Maintenance capital expenditures consisted of cash flows used in investing activities from the Consolidated Statement of Cash Flows, adjusted to exclude cash flows used in investing activities relating to acquisitions.

23CRIUS ENERGY | INVESTOR PRESENTATION | Q4 2017
CRIUS EXECUTIVE TEAMMichael FallquistChief Executive Officer
• Successful executive and entrepreneur who founded the company in 2009 and led the IPO for Crius Energy on the TSX in 2012
• Served as COO of Commerce Energy and in various roles at Macquarie Group in the U.S. and Australia
• Winner of 2012 Ernst & Young Entrepreneur of the Year Award (NY region – Cleantech category)
• Graduate of Colgate University (BA, Economics) and Cornell University (MBA)
Roop BhullarChief Financial Officer
• Over 12 years of financial leadership in the retail energy industry, both in the U.S. and internationally
• Track record of success raising equity and debt capital
• Formerly with Just Energy, Universal Energy, Commerce Energy, King Country Energy
• Graduate of University of Waikato (BMS/LLB Hons) and UCLA (MBA)
Chaitu ParikhChief Operating Officer
• Over 18 years of operational growth in the retail energy industry
• Leader in business strategy and multi-location operations
• Successful track record in leading mergers & acquisitions
• Former President and CEO of MXEnergy
Barbara ClayChief Legal Officer
• Over 19 years in compliance, law and governance in highly regulated industries
• 9 years in private practice representing energy, communication and financial industry clients for M&A, joint ventures, and complex contract matters
• Graduate of Rutgers University, and earned her J.D. at Pace Law School
Rob CantrellExecutive VP, Commercial
Energy
• Over 21 years of sales leadership
• 10 years in the retail energy industry
• Former President and Chief Operating Officer for TriEagle Energy
Pat McCamleyExecutive VP,
Corporate Development
• Over 21 years of corporate and business development leadership
• Lead the onboarding of Comcast, FairPoint and Cincinnati Bell as strategic energy distribution partners
• Formerly with Skyline Partners, Siemens, Convergys
• Graduate of Pennsylvania State University
Christian McArthurExecutive VP,
Energy Pricing and Supply
• Leader in trading, risk management, customer analytics and forecasting with over 15 years of retail energy expertise
• Led retail supply at Just Energy, oversaw growth from Canadian market to current international footprint
• Led 2 strategic solar acquisitions and launched Crius Solar, a vertically integrated solar and company
• Graduate of Queens University (BASc Engineering Physics) and University of Waterloo (MASc Electrical Engineering)
Kevin McMinnExecutive VP,
Mass Market Energy
• Over 21 years of leadership and operational success with U.S. and international corporations with proven performance in a wide range of industries
• COO of USG&E leading a cultural transition to a customer focused environment, garnering high rankings by JD Power while increasing profitability
• Served as EVP and Board Member of ESPI bringing the company to recognition as #9 of the Top 10 Energy Companies on the INC500/2008
• Successful track record in managing natural gas and power procurement, financial hedging and risk management operations
Ravi ThuraisinghamExecutive VP, Solar
• Over 21 years of solar energy and business development leadership
• Former President of American Solar Direct and co-founder, CEO and Chairman of LightWing Inc., a solar energy sales and technology platform
provider which was acquired by SunEdison and subsequently acquired by Crius
• Graduate of University of Toronto with undergraduate and graduate degrees in Nuclear Engineering, and a CFA Charter holder

24CRIUS ENERGY | INVESTOR PRESENTATION | Q4 2017
David Kerr Chairman, Independent Director
• CEO, Thorium Power Canada Inc.
• Founder, Algonquin Power Income Fund
• Director of 3GS, a private UK corporation
• President of Algonquin Power Corporation, a private renewable energy developer
James AjelloIndependent Director
• Director, American Savings Bank, and SKAI Ventures and Member of the National Academy of
Science Committee on Energy Resource Potential for the U.S. Department of Energy Lands
• Former Executive VP, CFO, Treasurer & Chief Risk Officer of Hawaiian Electric Industries, Inc.
• Former Senior VP of Business Development and Senior VP & GM of Commercial and Industrial
Marketing and President of ReliantEnergy Solutions, LLC
Brian Burden Independent Director
• Director, Trinidad Drilling Ltd.
• Former CFO, TransAlta Corp.
• Former CFO, Molson Coors
Robert HuggardIndependent Director
• Former President, Direct Energy Canada
• Former President, Direct Energy Home and Business Services
• President of Lindaura Consulting
Daniel Sullivan Independent Director
• Director, Choice Property Real Estate Trust
• Director, Allied Properties Real Estate Investment Trust
• Former Consul General for Canada in New York
Michael FallquistDirector & CEO
• Founded Crius Energy, Viridian Energy and forged initial strategic partnerships
• Commerce Energy, Macquarie Group
• Over 11 years in the retail energy industry
CRIUS BOARD OF DIRECTORS

Michael Fallquist Roop Bhullar Kelly Castledine
Chief Executive Officer
203.663.7545
Chief Financial Officer
203.883.9900
Investor Relations
416.644.1753
CONTACT INFORMATION