Embed Size (px)
Citation preview

1Risk Review • December 7 • 2010
Investor Presentation Q4 10
December 7 2010

2Risk Review • December 7 • 2010
Forward Looking Statements & Non-GAAP MeasuresCaution Regarding Forward-Looking Statements
Bank of Montreal’s public communications often include written or oral forward-looking statements. Statements of this type are included in this document, and may be included in other filings with Canadian securities regulators or the U.S. Securities and Exchange Commission, or in other communications. All such statements are made pursuant to the “safe harbor” provisions of, and are intended to be forward-looking statements under, the United States Private Securities Litigation Reform Act of 1995 and any applicable Canadian securities legislation. Forward-looking statements may involve, but are not limited to, comments with respect to our objectives and priorities for 2011 and beyond, our strategies or future actions, our targets, expectations for our financial condition or share price, and the results of or outlook for our operations or for the Canadian and U.S. economies.
By their nature, forward-looking statements require us to make assumptions and are subject to inherent risks and uncertainties. There is significant risk that predictions, forecasts, conclusions or projections will not prove to be accurate, that our assumptions may not be correct and that actual results may differ materially from such predictions, forecasts, conclusions or projections. We caution readers of this document not to place undue reliance on our forward-looking statements as a number of factors could cause actual future results, conditions, actions or events to differ materially from the targets, expectations, estimates or intentions expressed in the forward-looking statements.
The future outcomes that relate to forward-looking statements may be influenced by many factors, including but not limited to: general economic and market conditions in the countries in which we operate; weak, volatile or illiquid capital and/or credit markets; interest rate and currency value fluctuations; changes in monetary, fiscal or economic policy; the degree of competition in the geographic and business areas in which we operate; changes in laws or in supervisory expectations or requirements, including capital and liquidity requirements and guidance; judicial or regulatory proceedings; the accuracy and completeness of the information we obtain with respect to our customers and counterparties; our ability to execute our strategic plans and to complete and integrate acquisitions; critical accounting estimates; operational and infrastructure risks; general political conditions; global capital markets activities; the possible effects on our business of war or terrorist activities; disease or illness that affects local, national or international economies; disruptions to public infrastructure, such as transportation, communications, power or water supply; and technological changes.
We caution that the foregoing list is not exhaustive of all possible factors. Other factors could adversely affect our results. For more information, please see the discussion on pages 29 and 30 of Bank of Montreal’s Management’s Discussion and Analysis for 2010, which outlines in detail certain key factors that may affect Bank of Montreal’s future results. When relying on forward-looking statements to make decisions with respect to Bank of Montreal, investors and others should carefully consider these factors, as well as other uncertainties and potential events, and the inherent uncertainty of forward-looking statements. Bank of Montreal does not undertake to update any forward-looking statements, whether written or oral, that may be made from time to time by the organization or on its behalf, except as required by law. The forward-looking information contained in this document is presented for the purpose of assisting our shareholders in understanding our financial position as at and for the periods ended on the dates presented, as well as our strategic priorities and objectives, and may not be appropriate for other purposes.
In calculating the pro-forma impact of Basel III on our regulatory capital, regulatory capital ratios, and risk-weighted assets (including Counterparty Credit Risk and Market Risk), we have assumed our interpretation of the proposed rules announced by the Basel Committee on Banking Supervision (BCBS) as of this date and our models used to assess those requirements are consistent with the final requirements that will be promulgated by BCBS and the Office of the Superintendent of Financial Institutions Canada (OSFI). We have also assumed that the proposed changes affecting capital deductions, risk-weighted assets, the regulatory capital treatment for non-common share capital instruments (i.e. grandfathered capital instruments) and the minimum regulatory capital ratios are adopted as proposed by BCBS and OSFI. We also assumed that existing capital instruments that are non-Basel III compliant but are Basel II compliant can be fully included in the October 31, 2010 pro-forma calculations. The full impact of the Basel III proposals has been quantified based on our financial and risk positions at year end or as close to year end as was practical. The Basel rules are not yet finalized and are subject to change, which may impact the results of our analysis. In setting out the expectation that we will be able to refinance certain capital instruments in the future, as and when necessary to meet regulatory capital requirements, we have assumed that factors beyond our control, including the state of the economic and capital markets environment, will not impair our ability to do so.
Our expectations regarding the key impacts of our transition to International Financial Reporting Standards (IFRS) are based on IFRS as issued by the International Accounting Standards Board (IASB) that are in effect as of this date. Should IFRS change prior to our transition to IFRS, our expectations of the key impacts of transition could change.
Assumptions about the performance of the Canadian and U.S. economies in 2011 and how that will affect our businesses were material factors we considered when setting our strategic priorities and objectives, and our outlook for our businesses. Key assumptions included that the Canadian and U.S. economies will grow moderately in 2011, that interest rates will remain low and that our assumptions regarding regulatory reforms will be consistent with the implementation of such reforms. We also assumed that housing markets will strengthen in Canada and the United States. We assumed that conditions in capital markets will improve somewhat and that the Canadian dollar will strengthen modestly relative to the U.S. dollar. In determining our expectations for economic growth, both broadly and in the financial services sector, we primarily consider historical economic data provided by the Canadian and U.S. governments and their agencies.
Non-GAAP Measures
Bank of Montreal uses both GAAP and non-GAAP measures to assess performance. Readers are cautioned that earnings and other measures adjusted to a basis other than GAAP do not have standardized meanings under GAAP and are unlikely to be comparable to similar measures used by other companies. Reconciliations of GAAP to non-GAAP measures as well as the rationale for their use can be found in Bank of Montreal’s Fourth Quarter 2010 Earnings Release and Bank of Montreal’s 2010 Management’s Discussion and Analysis, all of which are available on our website at www.bmo.com/investorrelations.
Examples of non-GAAP amounts or measures include: cash earnings per share and cash productivity; revenue and other measures presented on a taxable equivalent basis (teb); amounts presented net of applicable taxes, earnings which exclude the impact of provision for credit losses and taxes, and core earnings which exclude non recurring items such as acquisition integration costs.
Bank of Montreal provides supplemental information on combined business segments to facilitate comparisons to peers.

3Risk Review • December 7 • 2010
Bill DownePresident & Chief Executive Officer
BMO Financial Group
Strategic Highlights Q4 10
December 7 2010
4Risk Review • December 7 • 2010
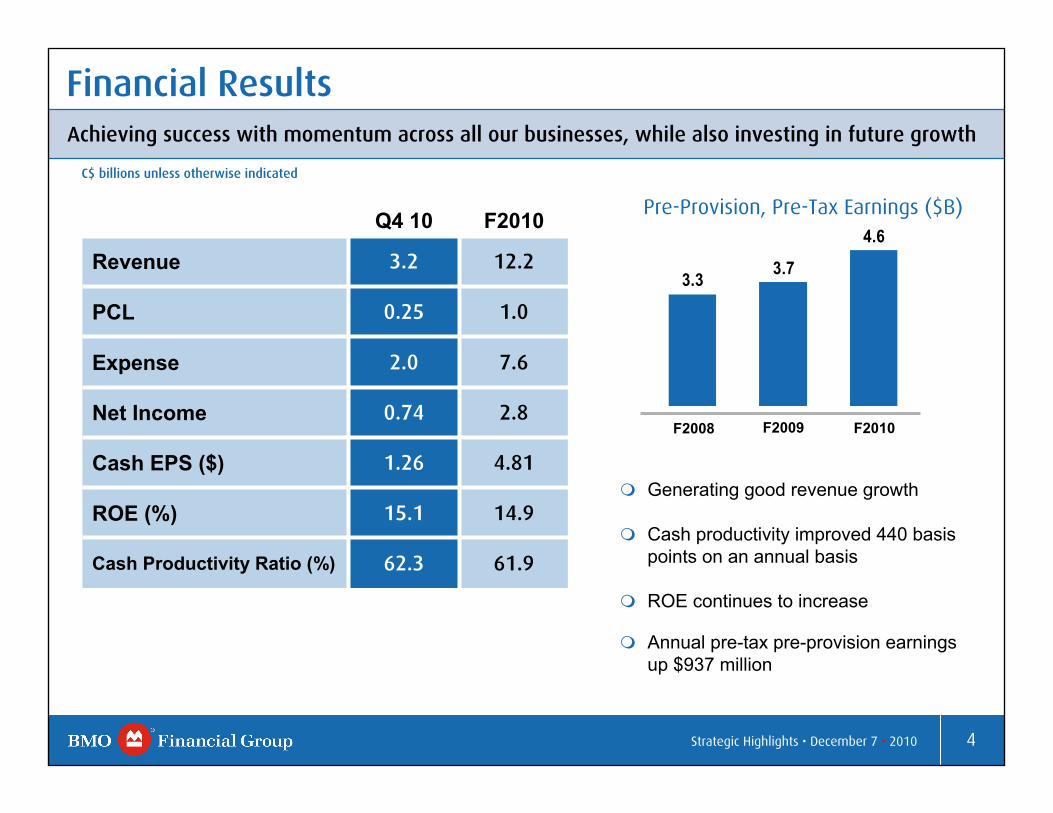
Financial Results
Generating good revenue growth
Cash productivity improved 440 basis points on an annual basis
ROE continues to increase
Annual pre-tax pre-provision earnings up $937 million
Achieving success with momentum across all our businesses, while also investing in future growth
61.962.3Cash Productivity Ratio (%)
14.915.1ROE (%)
4.811.26Cash EPS ($)
2.80.74Net Income
7.62.0Expense
1.00.25PCL
3.2Revenue 12.2
F2010Q4 10
C$ billions unless otherwise indicated
3.3 3.7
4.6
F2008 F2009 F2010
Pre-Provision, Pre-Tax Earnings ($B)
Strategic Highlights • December 7 • 2010

5Risk Review • December 7 • 2010
Operating Group Highlights
Continues to excel achieving double-digit growth in revenue and net income for each of the past two years
Personal and Commercial loyalty scores up from 2008 levels
Investing strategically to improve competitive position
P&C CanadaP&C CanadaP&C CanadaP&C Canada
Delivered strong earnings with Y/Y revenue growth across most businesses
Good growth in AUM / AUA and improved equity market conditions
Bank of Montreal (China) Co. Limited opened for business with local incorporation
Private Client GroupPrivate Client GroupPrivate Client GroupPrivate Client Group
Q4 10 net income, excluding acquisition integration costs, essentially unchanged compared to prior year
Added new checking accounts, increased personal core deposits and market share and NPS remained high
Awarded 2010 TNS Choice Award for superior performance in Chicago
P&C U.S.P&C U.S.P&C U.S.P&C U.S.
Good overall performance in fourth quarter and the year
Performance returned to levels experienced in the first half of this year
Expanded and strengthened distribution capabilities to create integrated North American platform
BMO Capital MarketsBMO Capital MarketsBMO Capital MarketsBMO Capital Markets
Strategic Highlights • December 7 • 2010

6Risk Review • December 7 • 2010
13.4513.5513.2712.5312.24
Q4 Q1 Q2 Q3 Q4
BMO Cdn Peer Group
Strong Capital Position
Common Equity Ratio (Basel II)
(%)
1009
Tier 1 Capital Ratio (Basel II)
(%)
Strong capital ratios on a Basel II basis: Common Equity Ratio at 10.26%Tier 1 Capital Ratio at 13.45%
Our proforma Basel III Common Equity Ratio as of October 31, 2010 is estimated to be 7.8% -exceeding today - the announced Basel III 2019 minimum capital requirement of 7.0%
09 10
Positioned well to execute our growth strategy
8.95 9.219.83
10.27 10.26
Q4 Q1 Q2 Q3 Q4
BMO Cdn Peer Group
Strategic Highlights • December 7 • 2010
7Risk Review • December 7 • 2010
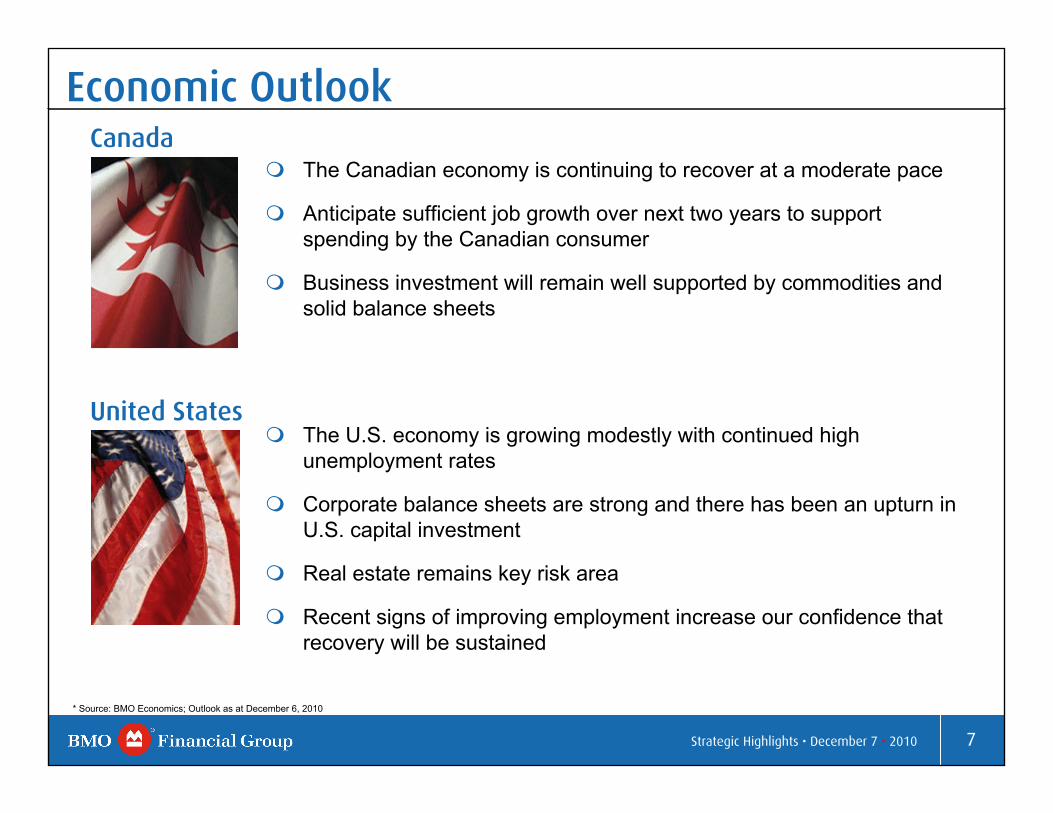
Economic Outlook
* Source: BMO Economics; Outlook as at December 6, 2010
Canada
United States
The Canadian economy is continuing to recover at a moderate pace
Anticipate sufficient job growth over next two years to support spending by the Canadian consumer
Business investment will remain well supported by commodities and solid balance sheets
The U.S. economy is growing modestly with continued high unemployment rates
Corporate balance sheets are strong and there has been an upturn in U.S. capital investment
Real estate remains key risk area
Recent signs of improving employment increase our confidence that recovery will be sustained
Strategic Highlights • December 7 • 2010

8Risk Review • December 7 • 2010
Russ RobertsonChief Financial OfficerBMO Financial Group
Financial Results Q4 10

9Risk Review • December 7 • 2010
Financial Highlights
P&C Canada continues to deliver strong performance with good revenue growth in the quarterPCG reports strong results with net income substantially higher than last yearBMO Capital Markets net income rises significantly from the third quarter reflecting an improvement in trading and investment banking activityTier 1 Capital Ratio remains strong with fourth quarter ROE of 15.1%Fiscal 2010 pre-provision, pre-tax earnings of $4.6 billion, up from $3.7 billion a year agoOverall trend of improvement in credit
Strong fourth quarter and fiscal year results
Net Income EPS Cash
EPS1 ROE Cash Productivity1
Cash Operating Leverage1
Total PCL
Tier 1 Capital Ratio
(Basel II)
Q4 10 $739MM $1.24 $1.26 15.1% 62.3% (5.7)% $253MM 13.45%
F2010 $2,810MM $4.75 $4.81 14.9% 61.9% 7.5% $1,049MM 13.45%
1 Non-GAAP measure, see slide 2 of the Q4 10 Investor Presentation and page 19 of the Fourth Quarter 2010 Earnings Release
Financial Highlights • December 7 • 2010

10Risk Review • December 7 • 2010
Revenues up 8% Y/Y and 11% Q/Q.
Net interest margin improved 16 basis points Y/Y driven by solidincreases in P&C Canada, BMO CM and P&C US. P&C Canada margin increase was driven by higher spreads in personal loans and deposits, as well as additional personal lending interest revenue. BMO CM margin increase was mainly due to lower funding costs.
Margin relatively flat Q/Q as improved loan and deposit spreads in P&C US, higher spreads in the brokerage businesses and higher net interest income in Corporate Services were largely offset by lower trading net interest income in BMO CM; solid increase in P&C Canada.
Y/Y NIR growth of 4.7% was mostly attributable to strong increases in P&C Canada and PCG. There was strong growth in card fees, largely due the to Diners Club business acquisition in the first quarter of 2010.
Q/Q NIR growth of 21% was driven by strong growth in PCG and BMO CM. Trading revenues were up considerably due to higher client activity in the current quarter and the favourable impact of credit spread movements this quarter, compared to the negative impact last quarter
U.S. dollar exchange rate decreased revenue growth by $36MM or 1.2% Y/Y and by $5MM or 0.2% Q/Q.
Revenue
1,442 1,532 1,522 1,571 1,610
1,547 1,493 1,527 1,3361,619
NII
NIR
Total Bank Revenue(C$MM)
3,025 3,049 2,9072,989
Solid increases in each of our operating groups
189188188185173
235232225
206 217
Q4 Q1 Q2 Q3 Q4
NIM NIM (excl. trading)
Net Interest Margin(bps)
09 10
3,229
Financial Highlights • December 7 • 2010

11Risk Review • December 7 • 2010
430 420 440 499 524
155 161 169 184 213147 147 150153 166145 171 163152 138
340 398 349 326382
562542 559 584
600
Q4 Q1 Q2 Q3 Q4
10
Non-Interest Expense
09
1,839 1,8301,898
1,779
Approximately 25% of the Y/Y expense growth was attributable to the Rockford and Diners Club business acquisitions, including integration costs.Employee costs increased Y/Y due in part to staffing related to business initiatives and to performance based compensation, in line with improved performance. Q/Q increases largely due to higher performance-based costs, in line with increased revenues.Investment spend increased Y/Y and Q/Q to support business growth.U.S. dollar exchange rate lowered expenses by $22MM or 1.2% Y/Y and by $3MM or 0.2% Q/Q.
Investing in our business
09 10
Cash Productivity Ratio1
(%)
Total Bank Non-Interest Expense(C$MM)
Computer Costs
Performance-Based Compensation
Benefits
Premises & Equip.
Salaries
Other2
2 Consists of amortization of intangible assets, communications, business and capital taxes, professional fees, travel and business development and other
2,023
Annual1 Non-GAAP measure, see slide 2 of the Q4 10 Investor Presentation and page 19 of the Fourth Quarter 2010 Earnings Release
Financial Highlights • December 7 • 2010
61.966.3
59.2 60.5 59.765.0 62.3
Q4 Q1 Q2 Q3 Q4 F09 F10

12Risk Review • December 7 • 2010
Capital & Risk Weighted Assets
Basel II Q4 09 Q1 10 Q2 10 Q3 10 Q4 10
Tier 1 Capital Ratio (%) 12.24 12.53 13.27 13.55 13.45
Total Capital Ratio (%) 14.87 14.82 15.69 16.10 15.91
Assets-to-Capital Multiple (x) 14.09 14.67 14.23 14.27 14.46
RWA ($B) 167.2 165.7 159.1 156.6 161.2
Total As At Assets ($B) 388.5 398.6 390.2 397.4 411.6
Common Equity Ratio (%)(1) 8.95 9.21 9.83 10.27 10.26
17.1 17.5 17.8 18.3 18.8
Q4 Q1 Q2 Q3 Q4
Tier 1 Capital ($B)
Common Shareholders' Equity ($B)
09
20.8 21.1 21.220.5
21.7
10
Basel II Tier 1 Capital & Common Shareholders’ Equity
Basel II capital ratios remain strong
1 Common equity ratio equals regulatory common equity less Basel II capital deductions divided by RWA. Sometimes this ratio is also referred to as the Tier 1 common ratio.
Financial Highlights • December 7 • 2010
13Risk Review • December 7 • 2010
02468
101214
Common Equity Ratio Tier 1 Ratio
2019 Basel III Minimum Requirements (Note 1)
BMO October 31, 2010 proforma - Fully AdoptingAnnounced 2019 Requirements
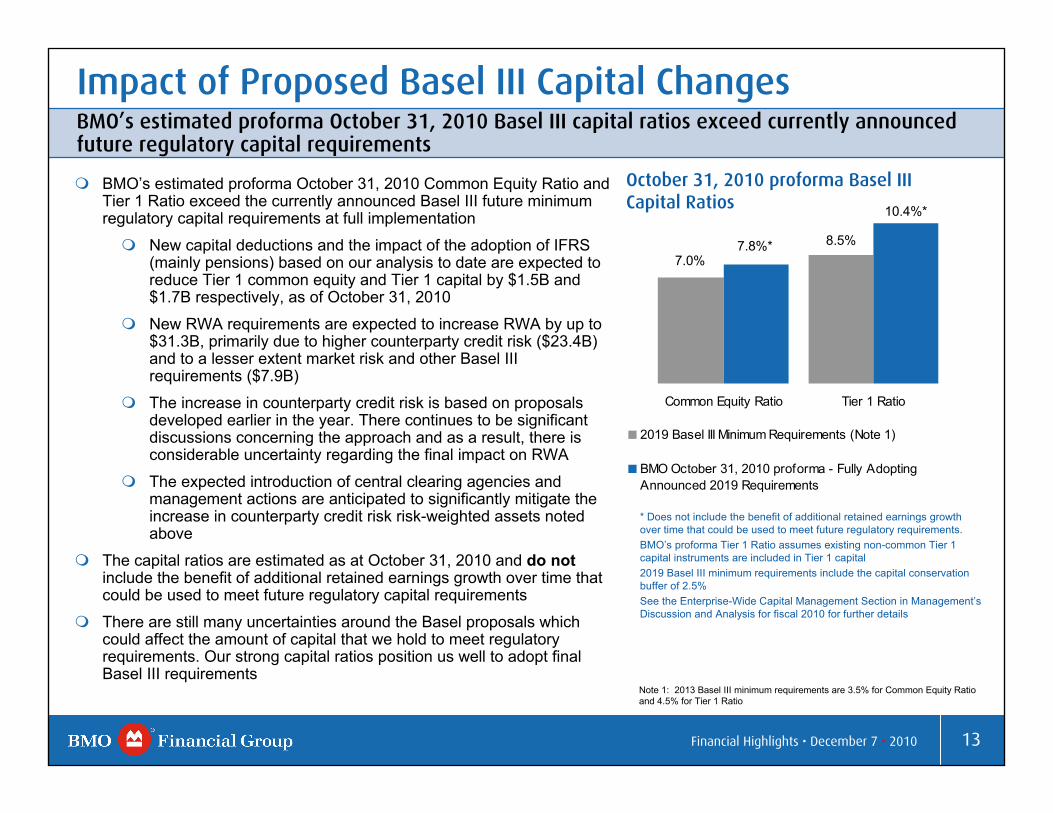
Impact of Proposed Basel III Capital Changes
October 31, 2010 proforma Basel III Capital Ratios
BMO’s estimated proforma October 31, 2010 Basel III capital ratios exceed currently announced future regulatory capital requirements
* Does not include the benefit of additional retained earnings growth over time that could be used to meet future regulatory requirements. BMO’s proforma Tier 1 Ratio assumes existing non-common Tier 1 capital instruments are included in Tier 1 capital 2019 Basel III minimum requirements include the capital conservation buffer of 2.5%See the Enterprise-Wide Capital Management Section in Management’s Discussion and Analysis for fiscal 2010 for further details
7.8%*
10.4%*
8.5%7.0%
Note 1: 2013 Basel III minimum requirements are 3.5% for Common Equity Ratio and 4.5% for Tier 1 Ratio
BMO’s estimated proforma October 31, 2010 Common Equity Ratio and Tier 1 Ratio exceed the currently announced Basel III future minimum regulatory capital requirements at full implementation
New capital deductions and the impact of the adoption of IFRS (mainly pensions) based on our analysis to date are expected to reduce Tier 1 common equity and Tier 1 capital by $1.5B and $1.7B respectively, as of October 31, 2010
New RWA requirements are expected to increase RWA by up to $31.3B, primarily due to higher counterparty credit risk ($23.4B) and to a lesser extent market risk and other Basel III requirements ($7.9B)
The increase in counterparty credit risk is based on proposals developed earlier in the year. There continues to be significantdiscussions concerning the approach and as a result, there is considerable uncertainty regarding the final impact on RWA
The expected introduction of central clearing agencies and management actions are anticipated to significantly mitigate theincrease in counterparty credit risk risk-weighted assets noted above
The capital ratios are estimated as at October 31, 2010 and do notinclude the benefit of additional retained earnings growth over time that could be used to meet future regulatory capital requirements
There are still many uncertainties around the Basel proposals which could affect the amount of capital that we hold to meet regulatory requirements. Our strong capital ratios position us well to adopt final Basel III requirements
Financial Highlights • December 7 • 2010
14Risk Review • December 7 • 2010
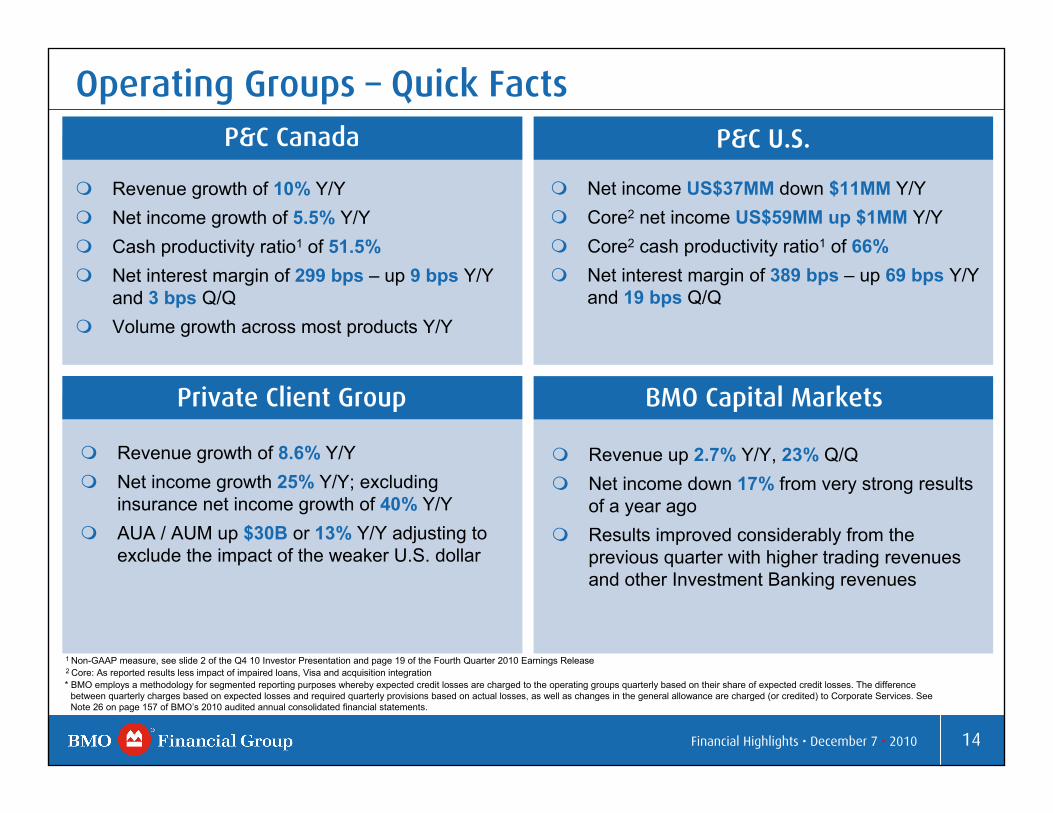
Revenue up 2.7% Y/Y, 23% Q/QNet income down 17% from very strong results of a year agoResults improved considerably from the previous quarter with higher trading revenues and other Investment Banking revenues
Net income US$37MM down $11MM Y/YCore2 net income US$59MM up $1MM Y/YCore2 cash productivity ratio1 of 66%Net interest margin of 389 bps – up 69 bps Y/Y and 19 bps Q/Q
Operating Groups – Quick FactsP&C Canada P&C U.S.
Revenue growth of 10% Y/YNet income growth of 5.5% Y/YCash productivity ratio1 of 51.5%Net interest margin of 299 bps – up 9 bps Y/Y and 3 bps Q/QVolume growth across most products Y/Y
Revenue growth of 8.6% Y/YNet income growth 25% Y/Y; excluding insurance net income growth of 40% Y/YAUA / AUM up $30B or 13% Y/Y adjusting to exclude the impact of the weaker U.S. dollar
2 Core: As reported results less impact of impaired loans, Visa and acquisition integration
Private Client Group BMO Capital Markets
* BMO employs a methodology for segmented reporting purposes whereby expected credit losses are charged to the operating groups quarterly based on their share of expected credit losses. The difference between quarterly charges based on expected losses and required quarterly provisions based on actual losses, as well as changes in the general allowance are charged (or credited) to Corporate Services. See Note 26 on page 157 of BMO’s 2010 audited annual consolidated financial statements.
1 Non-GAAP measure, see slide 2 of the Q4 10 Investor Presentation and page 19 of the Fourth Quarter 2010 Earnings Release
Financial Highlights • December 7 • 2010

15Risk Review • December 7 • 2010
Operating Group Performance
Q4 10 Revenue by Operating Group (C$MM)
P&C (Personal & Commercial)
57%
Total 3,326MM
P&C (Personal & Commercial)
57%
BMO CM (Investment Banking)
25%
PCG (Wealth
Management) 18%
* Corporate Services revenue $(97MM)
75% of revenues from retail businesses in Canada and the US (P&C and PCG)
Q4 10 Net Income by Operating Group (C$MM)
BMO CM (Investment Banking)
27%
PCG (Wealth
Management) 16%
* Corporate Services net loss $66MM
Total 805MM
* Operating segment results reported on an Expected Loss (EL) basis; see Note 26 on page 157 of BMO’s 2010 audited annual consolidated financial statements.
BMO CM 216
PCG131
P&C US 38
P&C Canada 420
Inv & Corp Banking and
Other335
Trading Products
499
PCG 593
Canada - Commercial
425
Canada - Personal &
Other734
P&C US 378
Canada - Cards 362
Financial Highlights • December 7 • 2010

16Risk Review • December 7 • 2010
290295
291296 299
Q4 Q1 Q2 Q3 Q4
10
Personal & Commercial Banking - Canada
09
Net Interest Margin(bps)
As Reported ($MM) Q4 09 Q1 10 Q2 10 Q3 10 Q4 10 Q/Q
B/(W)Y/Y
B/(W)
Revenue 1,383 1,411 1,408 1,490 1,521 2% 10%
PCL 102 120 121 129 132 (3)% (32)%
Expenses 706 709 720 763 786 (3)% (11)%
Provision for Taxes 177 179 172 172 183 (7)% (3)%
Net Income 398 403 395 426 420 (2)% 6%
Cash Productivity1 (%) 51.0 50.2 51.0 51.1 51.5
Continued strong financial performance
Continuing to deliver strong revenue growth of 10% and net income of $420MM.
Maintaining strong margin while volume growth continues.
Maintaining cash productivity1 in the low 50 per cent range throughout 2010.
Continuing to invest in branch network, customer contact centre and increasing our specialized sales force to better serve our customers.
* Operating segment results reported on an Expected Loss (EL) basis; see Note 26 on page 157 of BMO’s 2010 audited annual consolidated financial statements.
1 Non-GAAP measure, see slide 2 of the Q4 10 Investor Presentation and page 19 of the Fourth Quarter 2010 Earnings Release
Financial Highlights • December 7 • 2010

17Risk Review • December 7 • 2010
322 335 352 364 362
Q4 09 Q1 10 Q2 10 Q3 10 Q4 10
396 403 392420 425
665 673 664706 734
Revenue by Business ($MM)
“Personal” Includes Residential Mortgages, Personal Loans, Personal and Term Deposits, Mutual Funds and Insurance revenue sharing revenue
Personal & Commercial Banking - Canada
Personal ( $69MM or 10% Y/Y; $28MM or 4.0% Q/Q)
Y/Y increase driven by volume growth in personal lending products, higher spreads on personal loan and deposit products as well as additional personal lending interest revenue of $15MM.
Q/Q increase driven by volume growth in personal lending products and the additional interest revenue noted above, partially offset by lower mortgage refinancing fees.
Commercial ( $29MM or 7.8% Y/Y; $5MM or 1.6% Q/Q)
Y/Y increase driven by volume growth in loans and deposits.
Q/Q increase due to volume growth in loans and deposits.
Cards & Payment Service ( $40MM or 12% Y/Y; $2MM or 1.0% Q/Q)
Y/Y increase due to the addition of Diners Club and balance growth.
Q/Q revenue remained stable.
Financial Highlights • December 7 • 2010

18Risk Review • December 7 • 2010
Amounts in this section are in U.S. dollars.Y/Y revenue and operating expense increases primarily reflect contribution from the Rockford, Illinois-based bank transaction of $25MM and $23MM, respectively.
Results impacted by increase in costs of managing impaired loansand integration costs of $17MM ($11MM after-tax), related to our Rockford transaction.
Net interest margin improvement driven by an increase in loan spreads and deposit balance growth, partially offset by lower deposit income due to deposit spread compression.
389370
355336
320
Q4 Q1 Q2 Q3 Q4
10
Personal & Commercial Banking - U.S.
66.066.262.461.965.6Core1 Cash Productivity2 (%)
74.272.668.467.869.2Cash Productivity2 (%)
2%8%5954616358Core1 Net Income2
48
23
229
30
330
Q1 10
45
25
228
29
327
Q2 10
48
23
231
21
323
Q4 09As Reported (US$MM) Q3 10 Q4 10 Q/Q
B/(W)Y/Y
B/(W)
Revenue 345 365 5% 13%
PCL* 30 30 - (42)%
Expenses 257 277 (8)% (20)%
Provision for Taxes 20 21 7% 19%
Net Income 38 37 (2)% (21)%
09
Net Interest Margin(bps)
Core businesses are performing well; recent Rockford transaction successfully integrated
1 Core: As reported results less impact of impaired loans, Visa and acquisition integration
* Operating segment results reported on an Expected Loss (EL) basis; see Note 26 on page 157 of BMO’s 2010 audited annual consolidated financial statements.2 Non-GAAP measure, see slide 2 of the Q4 10 Investor Presentation and page 19 of the Fourth Quarter 2010 Earnings Release
Financial Highlights • December 7 • 2010

19Risk Review • December 7 • 2010
Private Client Group
As Reported ($MM) Q4 09 Q1 10 Q2 10 Q3 10 Q4 10 Q/Q
B/(W)Y/Y
B/(W)
Revenue 545 550 558 544 593 9% 9%
PCL 1 2 2 1 2 nm nm
Expenses 403 398 398 402 413 (3)% (2)%
Provision for Taxes 35 37 40 33 47 (38)% (34)%
Net Income 106 113 118 108 131 22% 25%
Cash Productivity1 (%) 74.0 72.0 71.2 73.5 69.5
139 149 153 153 160
99 101 101 99 104
Q4 Q1 Q2 Q3 Q4
09 10
AUA/AUM ($B)
AUA
AUM
Good growth from a year ago and the third quarter
238250 254 252 264
Net income grew a strong 22% Q/Q and 25% Y/Y, as we continue to see growth across most of our businesses
Net income excluding insurance grew a strong 40% Y/Y
Assets under management and assets under administration grew 13% over the prior year (in source currency)
Cash productivity1 of 69.5% improved 455 basis points from the prior year
* Operating segment results reported on an Expected Loss (EL) basis; see Note 26 on page 157 of BMO’s 2010 audited annual consolidated financial statements.
1 Non-GAAP measure, see slide 2 of the Q4 10 Investor Presentation and page 19 of the Fourth Quarter 2010 Earnings Release
Financial Highlights • December 7 • 2010
20Risk Review • December 7 • 2010
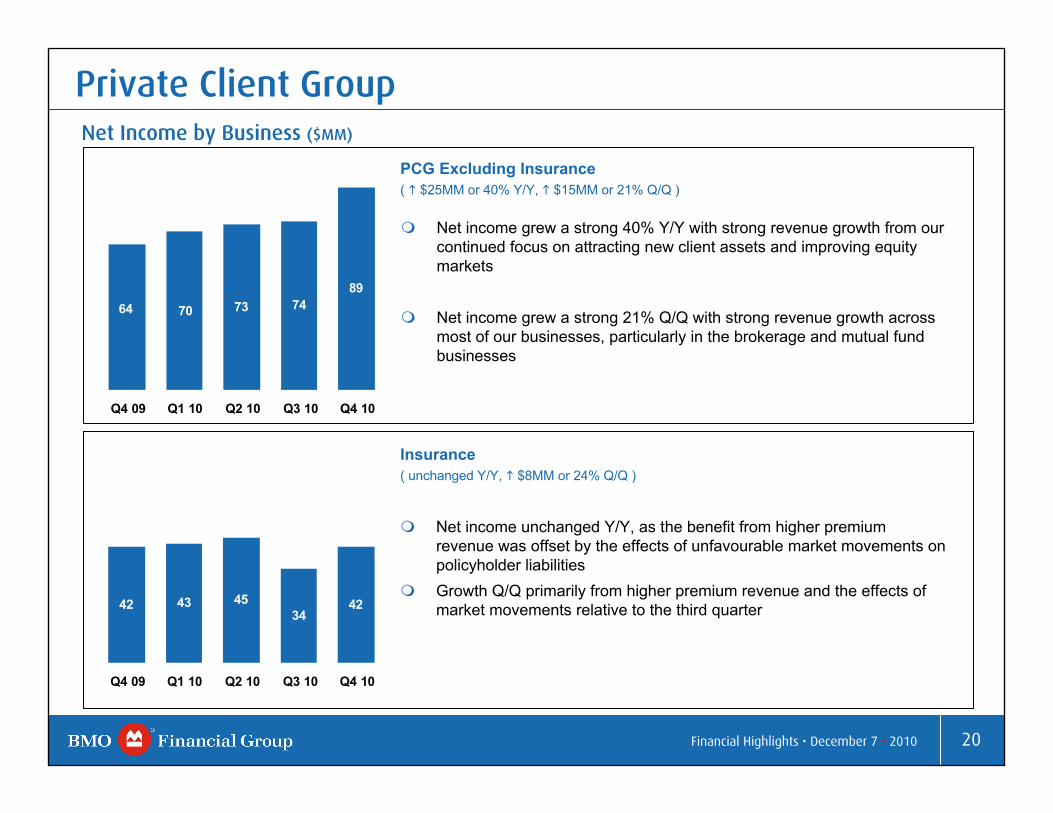
7370 746489
Q4 09 Q1 10 Q2 10 Q3 10 Q4 10
Net Income by Business ($MM)
Private Client Group
4234
454342
Q4 09 Q1 10 Q2 10 Q3 10 Q4 10
Insurance ( unchanged Y/Y, $8MM or 24% Q/Q )
PCG Excluding Insurance ( $25MM or 40% Y/Y, $15MM or 21% Q/Q )
Net income unchanged Y/Y, as the benefit from higher premium revenue was offset by the effects of unfavourable market movements on policyholder liabilitiesGrowth Q/Q primarily from higher premium revenue and the effects of market movements relative to the third quarter
Net income grew a strong 40% Y/Y with strong revenue growth from our continued focus on attracting new client assets and improving equity markets
Net income grew a strong 21% Q/Q with strong revenue growth across most of our businesses, particularly in the brokerage and mutual fund businesses
Financial Highlights • December 7 • 2010

21Risk Review • December 7 • 2010
BMO Capital Markets
2009 2010
Cash Return on Equity1
(%)
As Reported ($MM) Q4 09 Q1 10 Q2 10 Q3 10 Q4 10 Q/Q
B/(W)Y/Y
B/(W)
Revenue 814 844 920 681 834 23% 3%
PCL 33 65 67 66 66 0% (95)%
Expenses 404 470 468 421 463 (10)% (15)%
Provision for Taxes 117 95 125 64 89 (45)% 22%
Net Income 260 214 260 130 216 65% (17)%
Cash Productivity1 (%) 49.5 55.6 50.9 61.9 55.3
Full Year
Trading revenues have improved significantly Q/Q due to higher client activity in the current quarter and the favourable impact of credit spread movements this quarter compared to the negative impact last quarter.
Corporate banking revenues increased Q/Q as a result of higher lending fees, but were lower Y/Y due to reduced asset levels andlower lending fees.
Expenses have increased Q/Q as variable compensation costs were higher in line with revenue performance. Expenses have increased Y/Y with higher employee compensation costs reflecting strategichires in key sectors during the year. The remaining expense increase Q/Q and Y/Y was primarily due to costs related to a litigation settlement.
Results this quarter reflect an improvement in trading and investment banking activity from the third quarter.
* Operating segment results reported on an Expected Loss (EL) basis; see Note 26 on page 157 of BMO’s 2010 audited annual consolidated financial statements.
1 Non-GAAP measure, see slide 2 of the Q4 10 Investor Presentation and page 19 of the Fourth Quarter 2010 Earnings Release
Financial Highlights • December 7 • 2010
18.815.7
20.818.5
24.9
11.8
20.1
Q4 Q1 Q2 Q3 Q4 F2009 F2010

22Risk Review • December 7 • 2010
Revenue by Business ($MM)
BMO Capital Markets
335284303317320
Q4 09 Q1 10 Q2 10 Q3 10 Q4 10
Investment & Corporate Banking ( $15 MM or 5% Y/Y, $51MM or 18% Q/Q)
Trading Products ( $5MM or 1% Y/Y, $102MM or 26% Q/Q)
Y/Y higher revenue mainly due to strong M&A performance, reduced MTM losses on credit derivatives used to hedge the loan portfolio, and increased net investment securities gains. This was partially offset by lower corporate banking revenue due to reduced asset levels and lower lending fees. Q/Q higher revenue mainly due to strong M&A performance, and to a lesser extent increased lending fees, equity underwriting fees, and net investment securities gains.
499397
617527494
Q4 09 Q1 10 Q2 10 Q3 10 Q4 10
Y/Y higher revenue mainly due to increased net investment securities gains, and debt underwriting and commission fees, partially offset by lower trading revenue and lower revenues from our interest-rate-sensitive businesses.Q/Q significantly higher trading revenue due to higher client activity in the current quarter and the favourable impact of credit spread movements this quarter compared to the negative impact last quarter. Despite the strong growth, revenues in the current quarter were reduced by accounting adjustments in our equity trading business. In addition, there were increased net investment securities gains, partially offset by lower commission fees and lower revenues from our interest-rate-sensitive businesses.
Financial Highlights • December 7 • 2010

23Risk Review • December 7 • 2010
Corporate Services (Including Technology and Operations)
Lower PCL driving year-over-year improved bottom line
(9%)56%7547207082Non-interest revenue
23%(14)%(108)(95)(88)(134)(141)Net interest income before group teb1 offset
(45)%47%(64)(121)(105)(65)(44)Group teb1 offset
7%21%(172)(216)(193)(199)(185)Net interest income (teb)1
As Reported ($MM) Q4 09 Q1 10 Q2 10 Q3 10 Q4 10 Q/Q
B/(W)Y/Y
B/(W)
Revenue (103) (129) (173) (169) (97) 42% 5%
PCL – Specific 227 115 28 (13) 22 +(100)% 91%
– General -- -- -- -- -- --% --%
Expenses 16 20 9 44 74 (63)% +(100)%
Provision for Taxes (197) (159) (154) (184) (145) (21)% (26)%
Net Income (168) (124) (74) (35) (66) (89)% 61%
Y/Y reduction in provisions for credit losses charged to Corporate under BMO's expected loss provisioning methodology.
Y/Y expense growth driven by higher technology investment spending as well as higher performance-based compensation and professional fees.
• Operating segment results reported on an Expected Loss (EL) basis; see Note 26 on page 157 of BMO’s 2010 audited annual consolidated financial statements.1 Taxable equivalent basis is a non-GAAP measure, see Notes to Users: Taxable Equivalent Basis, in the Q4 10 Supplementary Financial Information package
Financial Highlights • December 7 • 2010

24Risk Review • December 7 • 2010
Businesses and governments ( $4.5B) Individuals ( $0.4B)Banks, used in trading activities ( $1.1B) The weaker U.S. dollar reduced balances by $0.6B
Consumer instalment & other personal ( $1.5B)Non-residential mortgages ( $0.1B)Residential mortgages ( $0.6B)Credit cards ( $0.04B)Businesses and governments ( $0.4B) Customers’ liability under acceptances & allowance for credit losses ( $0.2B)The weaker U.S. dollar decreased balances by $0.3B
19% 18% 16% 15% 14%
81% 82% 84% 85% 86%
43% 42% 41% 42% 42%
57% 58% 59% 58% 58%
Q4 Q1 Q2 Q3 Q4
Wholesale Banking Retail Banking09
Average Deposits (C$B)
241 235 240 244 248
10
Average Net Loans & Acceptances (C$B)
174 169 170 173
Balance Sheet
Average Deposits Average Deposits Average Deposits Average Deposits ( $3.8B Q/Q)
Average Net Loans & Acceptances Average Net Loans & Acceptances Average Net Loans & Acceptances Average Net Loans & Acceptances ( $2.8B Q/Q)
1 Corporate Services is included in Retail Banking’s average net loans and acceptances, and in Wholesale Banking’s average deposits
1 1
175
Financial Highlights • December 7 • 2010

25Risk Review • December 7 • 2010
Q4 10
December 7 2010
Tom FlynnExecutive Vice President & Chief Risk Officer
BMO Financial Group
Risk Review

26Risk Review • December 7 • 2010
Manufacturing7%
Financial11%
Other Commercial & Corporate
17%
Consumer Loans29%
Residential Mortgages14%
Services6%
Services5%
Consumer Loans31%
Other Commercial & Corporate
25%
Residential Mortgages30%
US19%
Other5%
Canada76%
1 Other C$9B not shown in Portfolio Segmentation & Line of Business graphs.2 Other Commercial & Corporate includes Portfolio Segments that are each <5% of the total.
P&C Commercial40%
BMO CM16%
P&C Consumer44%
Canada(C$135B)
US(C$35B)
By Line of BusinessBy SegmentBy Geography (C$179B)
Loan Portfolio – Well Diversified by Segment and Business
Canadian and US portfolios well diversified. Canadian portfolio 76% of loans, US portfolio 19% of loans, down from 23% a year ago.P&C banking business represents the majority of loans.
Retail portfolios are predominantly secured – 86% in Canada and 98% in the US.
1
2
2
Owner Occupied Commercial Mortgage
6%
CRE/Investor Owned Mortgages10%
Commercial Real Estate/Mortgages
9%
26Risk Review • December 7 • 2010
P&C Commercial29%
BMO CM7%
P&C Consumer64%
27Risk Review • December 7 • 2010
REITs/Operators21%
Q2 Acquired Portfolio17%
Builder Developer 15%
Auto29%
1st Mortgage34%
Home Equity33%
Other4%
Consumer(US$15.0B)
Services 14%
Manufacturing 14%
Oil and Gas8%
Financial Institutions28%
Q2 Acquired Portfolio5%
Other19%
Commercial Real Estate (CRE) /Investor Owned Mortgages
(US$3.3B)
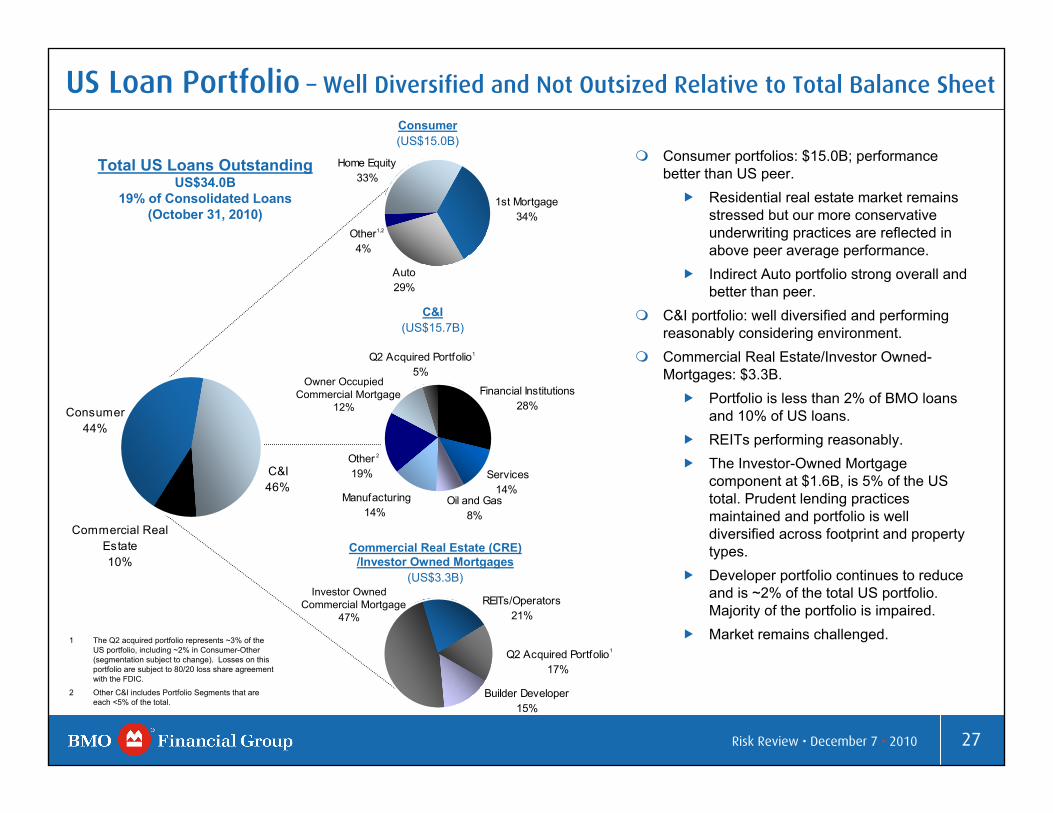
US Loan Portfolio – Well Diversified and Not Outsized Relative to Total Balance Sheet
Total US Loans OutstandingUS$34.0B
19% of Consolidated Loans(October 31, 2010)
C&I(US$15.7B)
Consumer portfolios: $15.0B; performance better than US peer.
Residential real estate market remains stressed but our more conservative underwriting practices are reflected in above peer average performance. Indirect Auto portfolio strong overall and better than peer.
C&I portfolio: well diversified and performing reasonably considering environment. Commercial Real Estate/Investor Owned-Mortgages: $3.3B.
Portfolio is less than 2% of BMO loans and 10% of US loans.REITs performing reasonably.The Investor-Owned Mortgage component at $1.6B, is 5% of the US total. Prudent lending practices maintained and portfolio is well diversified across footprint and property types. Developer portfolio continues to reduce and is ~2% of the total US portfolio. Majority of the portfolio is impaired. Market remains challenged.
Commercial Real Estate10%
Consumer44%
C&I46%
2
1 The Q2 acquired portfolio represents ~3% of the US portfolio, including ~2% in Consumer-Other (segmentation subject to change). Losses on this portfolio are subject to 80/20 loss share agreement with the FDIC.
2 Other C&I includes Portfolio Segments that are each <5% of the total.
1,2
1
1
Owner Occupied Commercial Mortgage
12%
Investor Owned Commercial Mortgage
47%

28Risk Review • December 7 • 2010
Impaired Loans & FormationsQ4 '10 formations were higher quarter over quarter at $461MM (Q3 '10: $242MM). Q4 '10 Canadian formations were $172MM (Q3 '10: $57MM). The Forest Products and Construction sectors were the largest contributors with remaining formations diversified by sector. Q4 '10 US formations of $289MM (Q3 '10: $185MM) with CRE/Investor Owned Mortgages the largest sector at 30%.Gross Impaired Loans (GIL) on a core basis of $2.9B versus $2.8B in Q3. GIL balances $3.2B (Q3 '10: $3.1B) including GILs from the Q2 US bank acquisition covered by FDIC loss share1 .
Canada & Other impaired balances account for 32%, US 68%. Largest segment in Canada being the Consumer portfolio. Largest segments in US relate to Commercial Real Estate.
1 Assets were recorded at market value. As part of the purchase agreement BMO is indemnified against 80% of the losses associated with this portfolio by the FDIC.
2 Other includes Portfolio Segments that are each <5% of the total.
GIL Formations(C$461MM)
Canada(C$172MM)
US(C$289MM)
CRE/Investor Owned Mortgages
30%
Owner Occupied Commercial Mortgage11%
Owner Occupied CommercialMortgage
6%806 712 694549
735
456 366242
461
Q4 Q1 Q2 Q3 Q4 Q1 Q2 Q3 Q4
Quarterly
2008 2009 2010
2
2
28Risk Review • December 7 • 2010
US63%
Canada37%
Other12%
Construction23%
Transportation9%
Consumer13%
Forest Products26%
Services6%
Retail5%
Consumer5%
Construction5%
Other16%
Services13%
Manufacturing15%
Retail5%
29Risk Review • December 7 • 2010
2008 2009 2010
Annual
Provision for Credit Losses
(45)(50)(53)Losses on Securitized Assets
6-20PCG
386-
386
8685
1
15684
72
17728
149
Q4 '091
2726Commercial – P&C Canada
253-
253
1613
3
13066
64
146
119
Q4 '10
(3)Capital Markets Canada & Other
(7)Capital Markets US
(10)Total Capital Markets
51Consumer – P&C US
52Commercial – P&C US
103Total P&C US
214Total PCL-Change in General Allowance
214Specific Provisions
171Total P&C Canada
145Consumer – P&C Canada
Q3 '10 Business Segment
(By Business Line Segment)
(C$ MM)
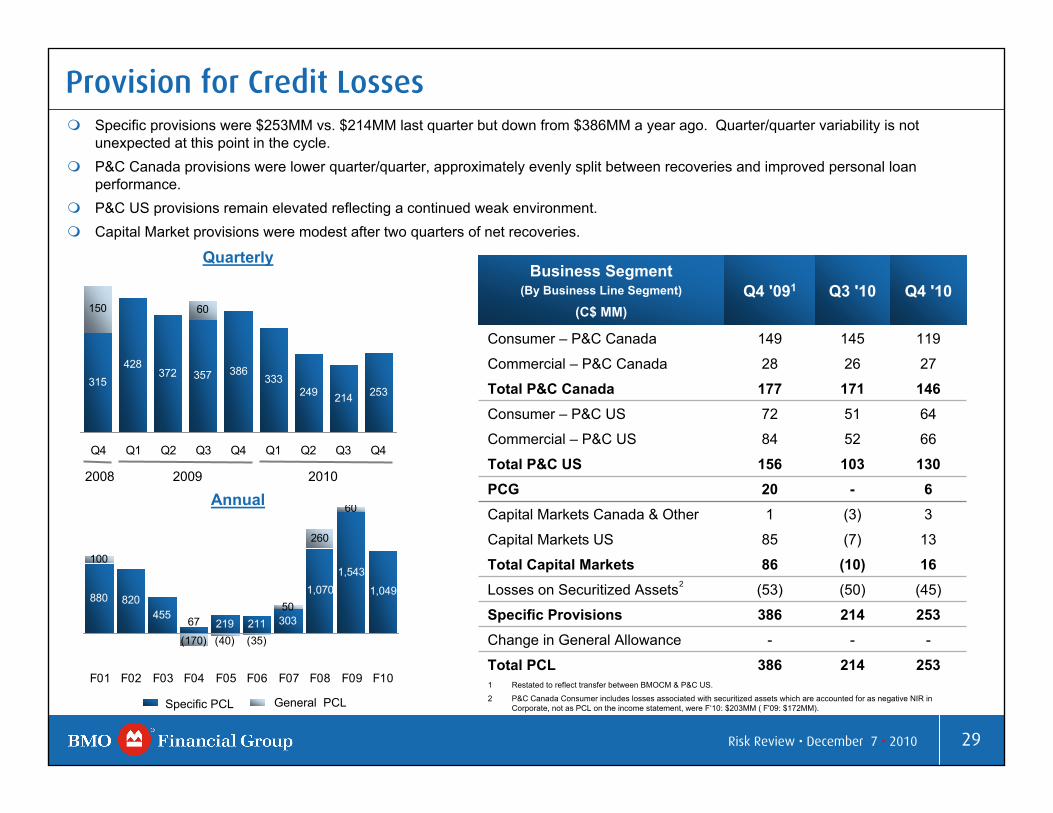
Specific provisions were $253MM vs. $214MM last quarter but down from $386MM a year ago. Quarter/quarter variability is not unexpected at this point in the cycle. P&C Canada provisions were lower quarter/quarter, approximately evenly split between recoveries and improved personal loan performance. P&C US provisions remain elevated reflecting a continued weak environment. Capital Market provisions were modest after two quarters of net recoveries.
315428
372 357 386333
249 214 253
60150
Q4 Q1 Q2 Q3 Q4 Q1 Q2 Q3 Q4
Quarterly
2
1 Restated to reflect transfer between BMOCM & P&C US.
2 P&C Canada Consumer includes losses associated with securitized assets which are accounted for as negative NIR in Corporate, not as PCL on the income statement, were F‘10: $203MM ( F'09: $172MM).
29Risk Review • December 7 • 2010
Specific PCL General PCL
880 820455
219 211 303
1,070 1,049
260
60
67
1,543100
(40) (35)
50
(170)
F01 F02 F03 F04 F05 F06 F07 F08 F09 F10
30Risk Review • December 7 • 2010
Transportation5%
Residential Mortgages5%
Consumer Loans28%
Construction18%Other
6%
Cards38%
US61%
Canada39%
US(C$156MM)
Canada (C$98MM)
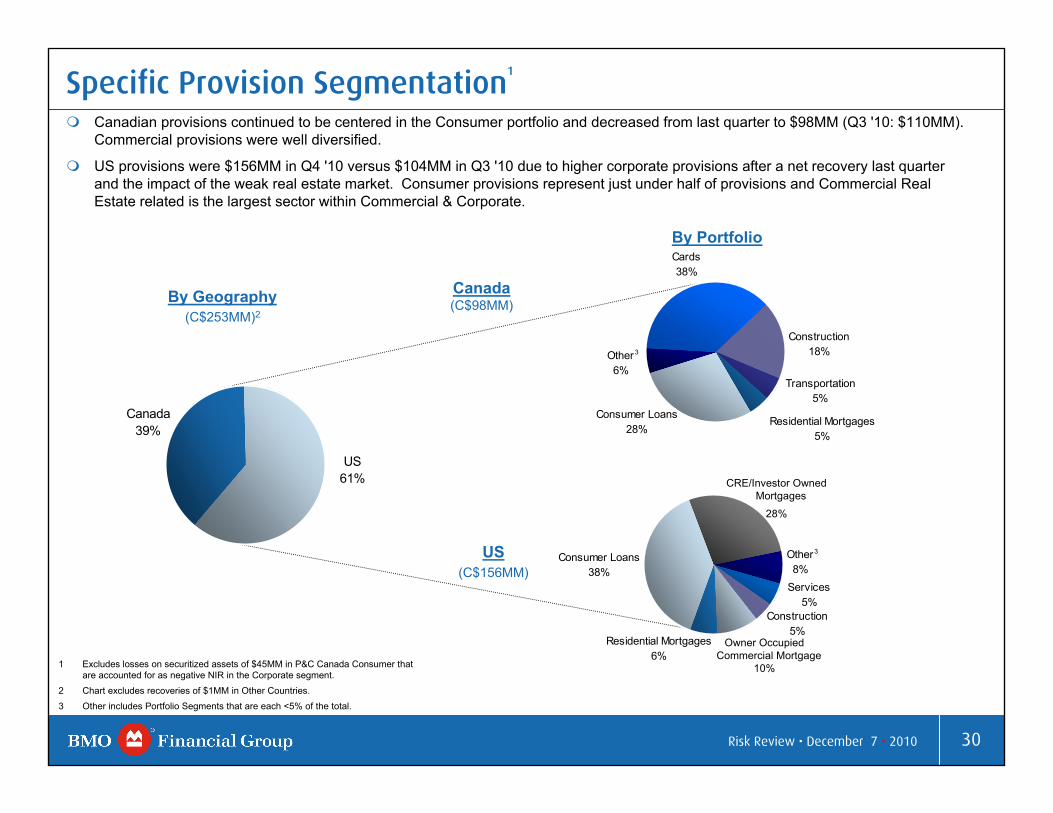
Specific Provision Segmentation1
By Portfolio
Canadian provisions continued to be centered in the Consumer portfolio and decreased from last quarter to $98MM (Q3 '10: $110MM). Commercial provisions were well diversified.
US provisions were $156MM in Q4 '10 versus $104MM in Q3 '10 due to higher corporate provisions after a net recovery last quarterand the impact of the weak real estate market. Consumer provisions represent just under half of provisions and Commercial Real Estate related is the largest sector within Commercial & Corporate.
1 Excludes losses on securitized assets of $45MM in P&C Canada Consumer that are accounted for as negative NIR in the Corporate segment.
2 Chart excludes recoveries of $1MM in Other Countries.3 Other includes Portfolio Segments that are each <5% of the total.
By Geography(C$253MM)2
3
CRE/Investor Owned Mortgages
28%
Owner Occupied Commercial Mortgage
10%
30Risk Review • December 7 • 2010
3
Construction5%
Consumer Loans38%
Other8%
Services5%
Residential Mortgages6%

31Risk Review • December 7 • 2010
APPENDIX
December 7 • 2010

32Risk Review • December 7 • 2010
P&C Canada – Market Share & Product Balances
10.210.210.210.110.2Total Personal Lending
Market Share (%)1 Q4 09 Q1 10 Q2 10 Q3 10 Q4 10
Personal Deposits1 12.3 12.2 11.9 11.9 11.8
Mutual Funds 13.3 13.5 13.5 13.5 13.4Commercial Loans $0 -$5MM2 19.9 19.8 19.9 20.2 20.3
64.964.363.663.964.1Residential Mortgages
Balances ($B)(Owned & Managed) Q4 09 Q1 10 Q2 10 Q3 10 Q4 10
Personal Loans 31.3 32.4 33.4 35.0 36.4
Total Personal Lending 95.4 96.3 97.0 99.3 101.3
Personal Deposits 67.2 66.7 65.9 66.7 66.6
Commercial Loans & Acceptances 34.3 34.1 35.3 36.2 36.7
Commercial Deposits 30.5 31.5 31.6 32.5 33.1
Cards (Retail & Corporate) 3 7.8 8.1 8.9 9.1 9.1
Pers
onal
Com
mer
cial
Pers
onal
Com
mer
cial
Sources: Mutual Funds – IFIC, Consumer Loans, Residential Mortgages & Personal Deposits – Bank of Canada1Personal share statistics are issued on a one-month lag basis. (Q4 10: Sept 2010)2Business loans (Banks) data is issued by CBA on a one calendar quarter lag basis (Q4 10: Jun 2010)
3Q1 10 includes 1 month and from Q2 10 onwards includes 3 months of Diners Club acquisition
Personalo Total Personal lending balances
increased Y/Y and Q/Q. Market share remained flat Y/Y and Q/Q.
o 90% of our total personal lending portfolio is secured.
o Mortgage balances increased Y/Y and Q/Q as we successfully replaced the run-off of our broker channel loans with our branch originated balances. Mortgage market share was 9.2%.
o Personal loan market share of 12.7% was up Y/Y and Q/Q. Homeowner ReadiLine growth drove personal loan growth of 16% Y/Y.
Commercialo We continue to rank second in
Canadian business lending market share.
o Increase in commercial deposit balances reflects the bank’s focus on meeting customer needs.
Cardso Cards balances increased Y/Y due
to the addition of Diners and volume growth.
December 7 • 2010

33Risk Review • December 7 • 2010
3.73.73.63.53.4Serviced Mortgages
Personal Products –Average Balances (US$B) Q4 09 Q1 10 Q2 10 Q3 10 Q4 10
Mortgages 4.9 4.6 4.4 4.2 4.1
Other Personal Loans 5.2 5.2 5.3 5.3 5.2
Indirect Auto 4.1 4.2 4.2 4.3 4.3
Deposits 14.7 14.6 14.6 15.9 16.0
10.710.09.78.98.3Commercial Deposits
Commercial Products –Average Balances (US$B)
Q4 09 Q1 10 Q2 10 Q3 10 Q4 10
Commercial Loans 12.3 11.8 11.5 11.7 12.1
P&C U.S. – Product Balances
Personal
Personal loan originations of $1.1B increased $0.1B or 8% Y/Y. Mortgage pipeline is at the highest level since May 2009. Decline in mortgage balances are primarily driven by amortization/run off of outstandings and new originations being sold in thesecondary market.Rockford, Illinois-based bank transaction contributed $0.3B of average loans and $1.6B of average deposits to Personal.Net new personal checking accounts of 4,400 in Q4’10 increased 3,900 Y/Y.Our serviced mortgage portfolio growth of $0.3B or 9% Y/Y reflects mortgages we originated and sold in the secondary market which we service on behalf of the investor.
Commercial
Excluding the Rockford, Illinois-based bank transaction’s $1.1B of average loans and $0.3B of average deposits, commercial loans declined, reflecting the impact of lower client loan utilization while deposits grew due to the benefit of our strategic sales effort.
December 7 • 2010

34Risk Review • December 7 • 2010
-90
-65
-40
-15
10
35
60
85
03-Aug-10 16-Aug-10 27-Aug-10 10-Sep-10 23-Sep-10 06-Oct-10 20-Oct-10
Trading & Underwriting Net Revenues vs. Market Value ExposureC
$ M
M (p
re-ta
x)
August 3, 2010 to October 29, 2010 (Presented on a Pre-Tax Basis)
Total market value exposureTotal market value exposure
excluding interest rate risk (AFS)
Daily Revenues Sep 30 Revenues$45.6MM
Oct 14 Revenues$24.4MM
The largest daily revenue gains for the quarter are as follows: September 20 – C$22.4MM: Reflects normal trading activity and credit valuation adjustments.September 30 – C$45.6MM: Reflects normal trading activity, fee income and valuation adjustments.October 14 – C$24.4MM: Reflects normal trading activity and credit valuation adjustments.
The largest daily loss for the quarter was October 29 – C$(13.5)MM which reflects normal trading activity and valuation and other adjustments.
Sep 20Revenues$22.4MM
Oct 29 Revenues$(13.5)MM
December 7 • 2010

35Risk Review • December 7 • 2010
Investor Relations Contact Information
VIKI LAZARISSenior Vice [email protected]
E-mail: [email protected]
www.bmo.com/investorrelations
Fax: 416.867.3367
TERRY [email protected]
ANDREW CHINSenior [email protected]