Embed Size (px)
Citation preview

Solutions for a changing world
Investor Presentation
Q1 2019
Solutions for a changing world

Solutions for a changing world
Safe Harbor Statement & Disclosure
This presentation includes forward-looking comments subject to important risks and uncertainties. It may also contain financial measures that are not in conformance with accounting principles generally accepted in the United States of America (GAAP).
Refer to Hyster-Yale’s reports filed on Forms 8-K (current), 10-Q (quarterly), and 10-K (annual) for information on factors that could cause actual results to differ materially from information in this presentation and for information reconciling financial measures to GAAP. Past performance may not be representative of future results.
Forward-looking Information noted in the following slides was effective as of the Company’s most recent earnings release and conference call (May 1, 2019), with the exception of information concerning newly enacted tariffs, which was effective as of May 17, 2019, the date this presentation was made available. Nothing in this presentation should be construed as reaffirming or disaffirming the outlook provided as of those dates.
This presentation is not an offer to sell or a solicitation of offers to buy any of Hyster-Yale’s securities.
2

Solutions for a changing world
Our Businesses
3
Our Attachment Business
Our Fuel Cell BusinessOur Core Lift Truck Business

Solutions for a changing world
Key Perspectives
Global market growthexpected to slow
Investments to expand HY’s product and solutions portfolio and geographic breadth and depth
Core lift truck programs aim to trigger organic growth through intensified industry and customer focus
Nuvera remains a venture business with developed technology; breakeven plan in place
Lift Truck business objective of 7% operating profit margin in the medium term through execution of key projects, with an added focus on progressive revenue growth and achieving ROTCE above 20%
Pricing raised to offset tariffs but cost/price differential lag
Stable Market Foundation with Strong Growth Drivers: Automation, Alternative Energy & the Rise of E-commerce
4
Supply chain challenges have delayed shipments, but are abating

Solutions for a changing world
Hyster-Yale at a GlanceHyster-Yale Materials Handling, Inc. (NYSE:HY) is a leading globally integrated, full-line lift truck manufacturer offering a broad array of solutions aimed at meeting the specific materials handling needs of its customers.
_____________________
Note: Throughout this investor presentation the results of the Sulligent, Alabama, facility have been included in the Bolzoni segment from 1/1/2017, and from 1/1/18, the results of Nuvera include product development funding from third-parties as revenue with the offsetting related costs in cost of sales.
(1) EBITDA and ROTCE are non-GAAP measures and should not be considered in isolation or as a substitute for GAAP measures. See non-GAAP explanations and the related reconciliations to GAAP measures in the Financial Appendix starting on page 32.
(2) As of 3/3/1/2019 all Sullligent, Alabama, employees are included in the Bolzoni employee total.
Key Metrics In millions (except employee data)
LTM3/31/19
Lift Truck Bolzoni Nuvera
Revenue $3,043.1 $351.3 $20.9
Operating Profit (loss) $51.7 $8.0 ($36.7)
Net Income (loss) $45.6 $4.2 ($26.7)
EBITDA(1) $98.8 $17.6 ($36.6)
ROTCE(1) (Net debt basis) 10.4% 2.9% n/m
Net Debt at end of period $220.1 $34.2 n/m
Approximate # of Employees (globally)(2) 6,200 1,400 200
LTM 3/31/19Sales by Segment
Separate lift truck, attachment and fuel cell segments
Americas62.8%
EMEA23.6%
JAPIC 7.9%
Bolzoni5.4%
Nuvera0.3%
5
$57.5
$72.4
$51.7
2.1%
2.9%
1.7%
0.0%
1.0%
2.0%
3.0%
4.0%
5.0%
6.0%
7.0%
$20
$45
$70
$95
$120
$145
2007 2016 LTM 2019
($ in millions)
7% LIFT TRUCK OPERATING PROFIT MARGIN TARGET

Solutions for a changing world
Reach Trucks
Forklifts
Internal Combustion
Engine
Lithium-Ion
Reach Stackers
Big
Trucks
Very Narrow Aisle Trucks
Full Lift Truck Product Line - Over 400 Different Truck Models Available
Electric Counterbalanced
Rider Trucks
Electric Narrow
Aisle TrucksElectric Hand Trucks
Internal
Combustion
Engine
(cushion tire)
Internal Combustion Engine
(pneumatic tire)
3-wheel Electric
4-wheel Electric
Pallet Trucks
Stackers
Order Pickers
Empty / Laden
CLASS 1 CLASS 2 CLASS 3 CLASS 4 CLASS 5
1.0T to 5.5T 1.5T to 6.0T 1.5T to 8.0T 1.0T to 7.0T 1.0T to 52.0T
Warehouse
Equipment
Electric
CB
Container Handlers
Internal Combustion Engine
Counterbalance
6
1.5T to 5.0T 1.0T to 2.0T 1.0T to 2.0T 1.5T to 45.0T
CLASS 1 CLASS 2 CLASS 3 CLASS 5
Diesel Forklift
4-wheel
Electric
Empty Container Handler
Reach Stacker
Rough Terrain Forklift
Very Narrow Aisle Truck
Warehouse Equipment
3-wheel Side LoaderReach Truck
Hys
ter®
, Yal
e® &
UTI
LEV
® >
30
0 m
od
els
HY
Max
imal
> 1
00
mo
del
s
Port Machinery
Stacker
Pallet Truck
Gas & LPG Forklift
ICE
OTHER

Solutions for a changing world
…with a Broad Range of Power Options, Attachments and Solutions
Push Pulls
Lifting Tables
Electric Counterbalanced
Rider Trucks
Electric Narrow Aisle Trucks
Electric Hand Trucks
Internal Combustion Engine (cushion tire)
Internal Combustion Engine (pneumatic tire)
CLASS 1, 2 & 3
Fuel Cell Engine
LPG & Bi-fuel
Diesel Tier 3 / Stage III
LPG & CNG Diesel Tier 4 / Stage IV/
Tier 5 - coming
Lithium-ion Battery
CLASS 4 & 5 ClampsMultipallets
Rotators
SideshiftersFork
Positioners
Forks
45,000+ assetsunder management
Power Options Attachments
Solutions
Lead-Acid
Battery
7

Solutions for a changing world
Class 1 Electric
17%
Class 2 Electric
9%
Class 3 Electric
37%Class 4 ICE
2%
Class 5 ICE35%
872 547 794 975 944 1,010 1,094 1,100 1,182 1,395 1,538 1,5280
300
600
900
1,200
1,500
2008 2009 2010 2011 2012 2013 2014 2015 2016 2017 2018 LTM 2019
Long-term CAGR (2004 – 2018) = 5.7%
_____________________
Source: ITA. Represents quarterly order intake.
Europe 34%
Americas 20%
China 30%
Japan 6%
Asia-Pacific
7%
Middle East & Africa3%
Global Industry Remains Strong, but Moderating
(units in thousands)
Global Lift Truck Industry Size
_____________________
Trend line represents 5.7% long-term CAGR Average Industry Size. Source: WITS. Represents annual order intake.
North America Retail Lift Truck at Trend Line
_____________________
Source: WITS. LTM 12/31/15 Orders Reports.
Lift Truck Industry – Unit Distribution by Class
_____________________
Source: WITS. LTM 3/31/19 Orders Reports.
ICE = Internal Combustion Engine
Total Industry = 1,528k Units
Class 4ICE4%Market Size - $
_____________________
Source: Internal Company estimates
Market Size - Units
Class 5ICE55%
Class 1Electric
20%
Class 2Electric
11%
Class 3Electric10%
Estimated Industry Revenue Mix
_____________________
Source: WITS. LTM 3/31/19 Orders Reports.
Global Lift Truck Industry Breakdown (Units)
Trend Upper Limit Lower Limit NA
-
10,000
20,000
30,000
40,000
50,000
60,000
70,000
80,000
Q1
72
Q1
74
Q1
76
Q1
78
Q1
80
Q1
82
Q1
84
Q1
86
Q1
88
Q1
90
Q1
92
Q1
94
Q1
96
Q1
98
Q1
00
Q1
02
Q1
04
Q1
06
Q1
08
Q1
10
Q1
12
Q1
14
Q1
16
Q1
18
8

Solutions for a changing world
Lift Truck Business Target Economics Goal and Gap to Target
Achieve 7% operating profit
margin target over the medium term
Achieve ROTCE> 20%
Target Economics gap closure can be achieved with unit volume…
Stronger Industry + Share Growth
= Volume Leverage
LTM 3/31/19 Gap to Target Economics
Actual Lift Truck Operating Profit Margin % 1.7%
Margin Variances – including impact of Tariffs 3.3%
Volume Variances*
Manufacturing variances/other 1.2%
Operating Expenses 0.8%
Total Volume Variances* 2.0%
Lift Truck Operating Profit Margin % Gap 5.3%
Lift Truck Operating Profit Margin % Target 7.0%
Impacts on current results • Price lag to offset material inflation and tariffs• Supplier challenges impacting shipments• Investment in strategic projects• Strength of dollar
9
*Expected to achieve with annual sales of 122,000 HY-produced lift truck units (mix dependent), excluding trucks manufactured by Hyster-Yale Maximal
Solutions for a changing world
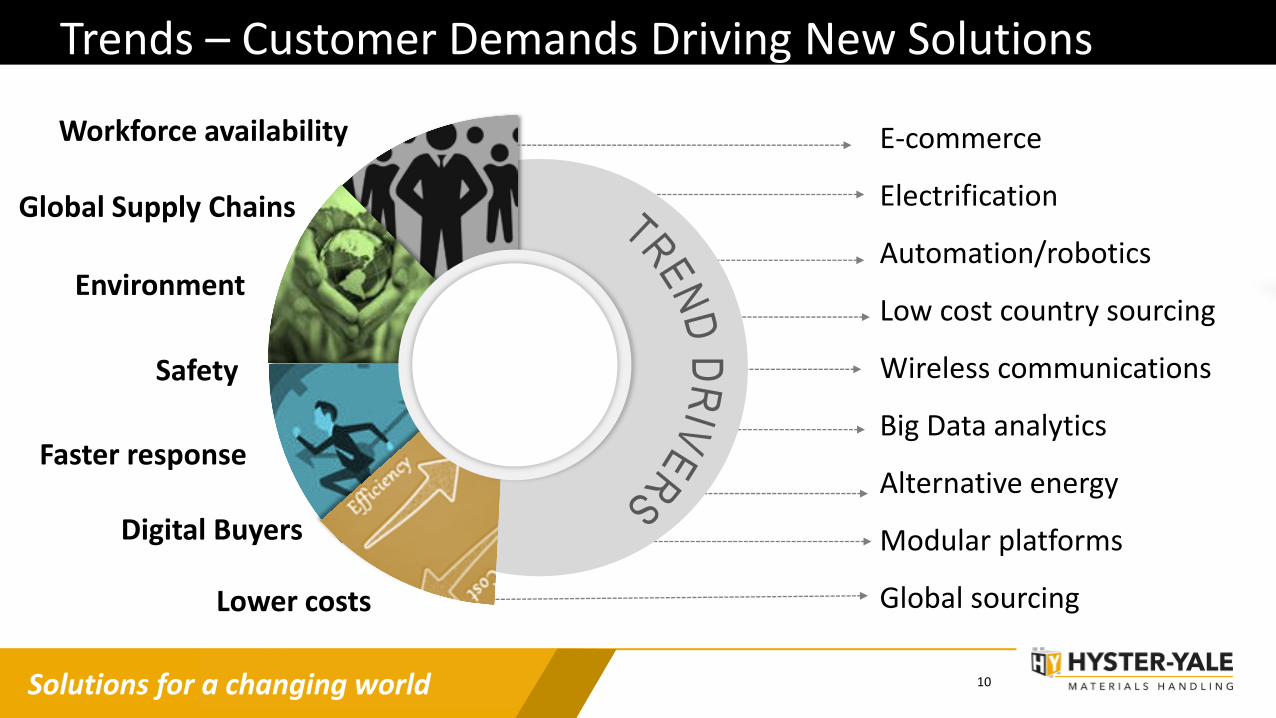
Global Supply Chains
Trends – Customer Demands Driving New Solutions
10
Workforce availability
Faster response
Lower costs
Environment
E-commerce
Electrification
Automation/robotics
Low cost country sourcing
Wireless communications
Big Data analytics
Alternative energy
Modular platforms
Global sourcing
Digital Buyers
Safety

Solutions for a changing world
Our Strategies address Changing Landscape and will Drive Our Economic Engine
Basic Business Areas
Geographic
and Product
Balance
Worldwide
Distribution
Strength to Drive
Market Share
Parts and Service
Volume
Large Lift Truck
Population in Service
Volume
Economies
of Scale
Design
Component commonality
Supply Chain
Manufacturing
Quality
Marketing
Parts
Infrastructure
Capital requirements
Be the Leader in Independent Distribution
Grow in Emerging Markets
Provide Lowest Cost of Ownership, while Enhancing Productivity for Customers
Be a Leader in Fuel Cells & their Applications
Be the Leader in the Delivery of Industry- & Customer-
Focused Solutions
Hyster-Yale’s economic engine is driven by increasing unit volume and economies of scale. Core strategic initiatives are designed to drive the economic engine by increasing market share...
Be the Leader in the Attachments
Business
A large lift truck population base drives parts and service volume resulting in enhanced profitability for Hyster-Yale and dealers
11

Solutions for a changing world 12
Operator 69%
Fuel11%
Service& Repair
11%
Lease 9%
Typical Truck Cost/Hour* Factors Impacting Cost of Ownership
*Typical truck cost/hour for 5,000lb North American applications
Productivity
Ergonomics/fatigue
Auto functions
Automated trucks
Operator
Energy usage
Alternative powertrains
ICE to ER
Mode control
Fuel
Cost/hour
Fleet Management
Extended Warranty
Telematics
Service & Repair
Fleet optimization
Price management
Cost control
Residuals
Lease
#1: Provide the Lowest Cost of Ownership, while Enhancing Productivity for Customers

Solutions for a changing world
Key Focus Areas for Low Cost of Ownership and Enhanced Productivity
New RS45Reachstacker
Segmentation – Right Product at Right Price
Leads to Lower Cost of Ownership
Constant power and refuel as quick as 3 minutes
No batteries or battery charging rooms
Environmentally clean
Fuel Cell-Powered Battery Box Replacements
Partner Collaboration
Telemetry SolutionsInternally
Developed Automation (IDA)
HY Automation with Dual-Mode Operation Lithium-Ion Solutions
• Modular designs• Increased component commonality• Ability to tailor to meet specific customer needs
at lowest cost
• Substantial expense and capital expenditures upfront with expected significant supply chain and manufacturing cost savings and efficiencies beginning in 2020
13
Next Generation Products Under Development
New EndRider
XT&MX
FT&VX
UT&UX

Solutions for a changing world 14
Top Accounts
Market Plan Action Items
Key Drivers
Scorecards
#2: Be the Leader in the Delivery of Industry- & Customer-Focused Solutions

Solutions for a changing world
Warehouse Counterbalanced
Source: 2018 ITA Market Size and Mix by Vertical and Segment
15
LOGISTICS & RENTALS
INDUSTRIALSRETAIL & DURABLE GOODS
FOOD & BEVERAGE
Applying dedicated industry-focused resources to target segments

Solutions for a changing world
North America account structure and HYG sales approach
16
Top Buyers
~ 200 Accounts
Industry Leaders~2,000+ Accounts
25% of Market
35% of Market Rest of the Market~200,000 Accounts
High Value
National Accounts Team
40% of Market
Dealer Sales Team
Market ShareHYG Sales Approach
Industry Sales Team
_____________________
Source: Internal Company estimates

Solutions for a changing world
#3: Be the Leader in the Attachments Business
A complete range of attachments to serve material handling industries in the area of forest products, food and beverage, white
goods, logistics, chemistry, automotive and many others…
Synergy Activities
• Growth of Attachment business in Americas
• Growth of Lift Truck business in Europe
• Insource Lift Truck business requirements
Stand-Alone Supplier
Preferred supplier to HYArms-length sales
Commercial confidentiality Key supplier partner
Purchasing leverageBroader market access
Part of Hyster-Yale
One of the worldwide leading manufacturers of
lift truck attachments, forks
and lift tables
17
Paper Roll Clamps Intelligent and
standard
Pulp & Waste Paper Bale
Clamps
Carton Clamps Intelligent and standardMulti Pallet
Handlers
Parallel Clamps
Push Pulls
Sideshifters and Fork positioners
Forks
Lifting Tables
SpecializedProducts
Rotators

Solutions for a changing world
2012 2013 2014 2015 2016 2017 2018
AUTOMOTIVE
Bolzoni Core Strategies for Growth
18
North America expansion
Industry focus
BEVERAGE WHITE GOODS 3PLs
PAPERGrowth in AGV segment
Enhance Strong OEM Relationships
Managed as separate business segment to maintain OEM Information integrity
of standard clampsExpansion of fork manufacturing capacity

Solutions for a changing world
#4: Be a Leader in fuel cells and their applications
Design of Fuel Cell Stacks and Engines
Manufacture of Fuel Cell Engines: strong focus on
integration / performance
Manufacture of Fuel Cell Stacks: strong focus on cost reduction and automation
Sales & Marketing to OEM’s and Partners
Reliability Growth Engineering: focus on
quality & increasing MTBF
Design of BBR and Integrated Solutions
Reliability Growth Engineering
Manufacture of BBR andIntegrated Solutions
Sales & Marketing Product Support in Field
High technology fuel cell company
Integrator of fuel cell engines into lift trucks
19

Solutions for a changing world
Non-Lift Truck Growth Opportunities
Heavy duty applicationsPort equipment Delivery vehicles Buses
China market entryMarket research Two agreements signed
Other opportunities in evaluation
Low-cost sourcing
20
Heavy duty applicationsPort equipment Delivery vehicles Buses

Solutions for a changing world
#5: Grow in Emerging Markets
MATURE MARKETS 820,000 EMERGING MARKETS 708,000
M A R K E T S I Z E S U B – T O T A L S
Indicative Map Only: Company’s estimate of market type
Emerging versus Mature Lift Truck Market Size (Last 12 months)
Top Global Manufacturers are increasing product depth
into utility and standard product line-up
Top
GLO
BA
LM
anu
fact
ure
rs
Top
CH
INESE
Man
ufactu
rersLift Truck Competition is Repositioning
Premium
Sub-Utility
Standard
Utility
Top Chinese Manufacturers are increasing quality and specification of utility & standard product line-up
WESTERN EUROPE418,955
NORTH AMERICA260,918
PACIFIC26,538
JAPAN91,707
MIDDLE EAST& AFRICA
36,902
INDIAN SUBCONTINENT
17,337
ASIA65,078
CHINA455,376
EASTERN EUROPE93,377
LATIN AMERICA20,047
BRAZIL19,081
MEXICO11,813
SOUTH AFRICA
9,197
21

Solutions for a changing world
Secular Shift in Product Mix
Market2018
_____________________
Source: WITS. Orders Reports.
ICE = Internal Combustion Engine
Utility = Company Estimates
DRIVERS:• Customer shift • Growth of warehousing and logistics• Environmental, health and safety• Evolving technologies• Growth in emerging markets
Class 1 Electric17% C1/2
Utility1%
Class 2 Electric10%
Class 3 Electric27%
C3 Utility0%
Class 4 ICE3%
Class 5 ICE
32%
C5 Utility10%
Previous Peak2007
Class 1 Electric14%
C1/2 Utility
3%
Class 2 Electric9%
Class 3 Electric30%
C3 Utility7%
Class 4 ICE2%
Class 5 ICE
18%
C5 Utility17%
22

Solutions for a changing world
Acquired a 75% Interest in Hyster-Yale Maximal Forklift [Zhejiang] Co., Ltd.
Best Value Best Fit Best Potential
• Management• Culture• Local market experience
• Production and design capability• Facilities and location• Brand and distribution network
• Utility Counterbalance forklifts• Big Trucks• Rough Terrain forklifts• Side Loader forklift
Organization ProductPeople
Rationalize Operations
Leverage Cost Advantage
Improve Operations
Enhance Development
Expand Products
Optimize Distribution
Near Term Synergy Plan
23

Solutions for a changing world
#6: Be the Leader in Independent Distribution
Enhancing performance Dealer Excellence programsDealer incentivesTerm-based contracts
1,000+ global dealer
locations
2,500+ application consultants
10,000+ service
technicians
Independent Exclusive Entrepreneurial Profitable Committed partner Dual-line or single
Strengthening the distribution footprint
Sales and Service territories Competitor conversionsIn-territory acquisitionsEnhanced digital customerexperience systems
24

Solutions for a changing world 25
Only Major Manufacturer Committed to Exclusive and Independent Distribution
HY
Strong value proposition attracts successful,
entrepreneurial dealers with long term outlook
Limits HY capital requirements, lowers cost structure anddrives high ROTCE
Key dealer criteria: To be customer obsessed with
intimate local knowledge
HY teams incentivized on retail sales performance, so aligned with dealer interests
High ROTCE achieved despite lower operating profit % than
peer group
High dealer ROI encourages increased investment,
propelling HY economic engine
Dealer supported with:
Great products High-quality marketing Direct sales or sales support
for large accounts Dealer Excellence programs Financial services Systems support
A True Partnership
Independent Dealer

Solutions for a changing world
Path to Execution of Strategic Initiatives
26
In total, Hyster-Yale projects maturing over the next 1 to 4 years are transformative and have the objective of driving revenue and profitability to target
New Utility Products New Standard Products New Premium Products HY Maximal Integration
BBR Range Expansion BBR Greenville Manufacture Enhanced India Production Integrated Telematics
Warehouse Range Expansion Big Truck Electrification Expanded Automation Offering
Bolzoni Premium and Standard Products Range Expansion
Increased Direct Selling Global Accounts Expansion
China Plants Consolidation Brazil Export Expansion
Industry Strategy Focus HY – Impact SellingHY – Flow Dealer Stocking
Program
Dealer Excellence Initiatives
Maximal Domestic China & Export Growth
Comprehensive Lithium-Ion Offering
Digital Initiatives – Sales & Service
Bolzoni North America Expansion
Nuvera to Breakeven Nuvera OEM & Partner Initiatives PowerTap® DispositionFuel Cell Range Extenders to
Heavy Duty Applications
Bolzoni Industry Focus Bolzoni Asia Customer Expansion

Solutions for a changing world
HY HY HY
Lift Truck(1) Bolzoni(1) Nuvera(1) Q1 2019 Q1 2018 Variance LTM 3/31/19Revenues $788.0 $91.8 $4.5 $834.8 $788.5 $46.3 $3,225.4
Gross Profit (Loss) $112.6 $15.6 ($1.8) $126.2 $132.1 ($5.9) $491.2
Operating Expenses ($101.8) ($14.4) ($6.6) ($122.8) ($112.9) ($9.9) ($468.2)
Operating Profit (Loss) $10.8 $1.2 ($8.4) $3.4 $19.2 ($15.8) $23.0
Net Income (Loss) $9.6 $0.3 ($6.1) $3.4 $14.9 ($11.5) $23.2
EBITDA(2)
$24.1 $4.3 ($8.2) $20.0 $34.4 ($14.4) $79.8
($ in millions)
Results for Q1 2019 Consolidated vs. Q1 2018
27
_____________________
(1) These entities are presented on a stand-alone basis, and as such, do not sum to the Consolidated financial information.
(2) EBITDA is a non-GAAP measure and should not be considered in isolation or as a substitute for GAAP measures. See non-GAAP explanations and the related reconciliations to GAAP measures in the Financial Appendix starting on page 32.
Q1 2019 Results • Revenue increase from price increases to offset material cost increases,
HY Maximal acquisition, higher parts revenue, and higher Nuvera and Bolzoni revenues, partly offset by unfavorable currency effect
• Decline in gross profit due to shift in mix to lower-margin products, higher manufacturing costs and unfavorable currency movements, partly offset by price increases, net of material cost inflation and higher parts volumes.
• Higher operating expenses due to increased SG&A expenses primarily related to increased employee-related costs for sales & marketing and development of new products, plus acquisition of HY Maximal.
2019 Outlook• Lift Truck: Investments in strategic programs to continue. FY operating profit expected to
increase over 2018. H1 2019 results lower than H1 2018 but improving in H2 as margins recover from the maturation of offsets to tariff-driven material cost inflation, and heavily discounted deals, and with anticipated mid-year resolution of supplier constraints. Company expects to retroactively recover certain tariffs paid on Chinese goods from recent exclusions granted, and has determined that the favorable impact of these exclusions is greater than the anticipated unfavorable effect of the most recently announced tariffs.
• Bolzoni: Results expected to improve in 2019, but are expected to be affected by additional costs associated with the restructuring of its Americas operations. Projects being aggressively pursued to expand market position, especially in North America, and to improve sales, marketing and product support capabilities.
• Nuvera: Results expected to improve moderately over 2019 with breakeven targeted for FY 2020.

Solutions for a changing world
Hyster-Yale Use of Cash Priorities
Return Cash to Stockholders
Investments in Adjacent or Complementary Businesses
Investments in Fuel Cell Business
Investments in Share Gain Programs
Investments in Lift Truck & Attachments BusinessesExpense and Capital Investments in Strategic initiatives to accelerate growth or enhance margins
Acquisitions of technologies and other forklift-related businesses
Investments to commercialize Nuvera’s fuel cell technology
2017 2018 2019
Annual Dividends (1) $19.8m $1.21/share
$20.4m $1.24/share
YTD $5.2m $1.24/share
2012 to 2014
Share Buyback $49.8m / 694,653 shares of Class A common stock
28

Solutions for a changing world
Valuation Approach Needs to Vary By Business
Lift Truck and Attachment Businesses Fuel Cell Business
• Board Oversight as Separate Businesses• Incentives Tied to Individual Businesses
Strong Operating Cash Generation
Market Leading Products and Position
Mature Cyclical Industry
Value using Traditional Valuation Model of EBITDA Multiple on a Net Debt Basis
Multiple should reflect ROIC levels and growth prospects
Developing / Technology Industry
Distinct Technology / Patents in Fuel Cell and Hydrogen Generation
Operating Cash Invested in New Product Commercialization / Ramp Up
Value as Venture Business with Developed Technology
29

Solutions for a changing world
by selling and producing
122,000*HY-factory
trucks
(excluding HY Maximal)
In Summary, a compelling investment scenario with many projects coming to completion over the next few years
Grow to approximately
$4 billion HY Lift Truck
segment revenue
irrespective of industry size and maintain ROTCE
>20%
to Fill existing assembly
line capacity
throughSignificant
share growth
Which leveragesTechnology
accelerators and business
acquisitions
Grow Bolzoni operating profit margin to 7%
Move Nuvera to breakeven then on toward profitability
Core lift truck business poised for strong revenue and income growth• Aggressive investments in share gain initiatives• New modular product platforms under development
Bolzoni business has significant upside• Additional products under review• Americas growth potential
Nuvera business currently having a significantnegative impact on HY earnings, but:
• Solid path for profitability established• Partners established in China, others in process
30
*Mix dependent

Solutions for a changing world
Financial Appendix

Solutions for a changing world
Non-GAAP Disclosure
EBITDA and return on total capital employed are not measurements under U.S. GAAP, shouldnot be considered in isolation or as a substitute for GAAP measures, and are not necessarilycomparable with similarly titled measures of other companies. Hyster-Yale defines each asthe following:
EBITDA is defined as income (loss) before asset impairment charges, income taxes andnoncontrolling interest income (loss) plus net interest expense and depreciation andamortization expense;
Return on Total Capital Employed (“ROTCE”) is defined as net income (loss), asreported, before interest expense, after tax, divided by average capital employed.Average capital employed is defined as average stockholders’ equity plus average debtless average cash.
Adjusted Cash Flow before Financing is defined as cash from operating activities lesscash from investing activities, excluding the approximately $80m impact of anunplanned systems-related acceleration of supplier payments in December 2016.
For reconciliations from GAAP measurements to non-GAAP measurements, see the followingpages.
32

Solutions for a changing world
Non-GAAP Reconciliation EBITDA
_____________________Note: EBITDA in this investor presentation is provided solely as a supplemental disclosure with respect to operating results. EBITDA does not represent net income (loss), as defined by U.S. GAAP and should not be considered as a substitute for net income or net loss, or as an indicator of operating performance. The Company
defines EBITDA as income (loss) before asset impairment charges, income taxes and noncontrolling interest income (loss) plus net interest expense and depreciation and amortization expense. EBITDA is not a measurement under U.S. GAAP and is not necessarily comparable with similarly titled measures of other companies.
($ in millions) Year Ended December 31 Qtr. Qtr.
Consolidated 2014 2015 2016 2017 2018 3/31/2018 3/31/2019 3/31/2019
Reconciliation of EBITDA
Net income attributable to stockholders $ 109.8 $ 74.7 $ 42.8 $ 48.6 $ 34.7 14.9$ 3.4$ 23.2$
Nuvera asset impairment - - - 4.9 - - - -
Noncontrolling interest income (loss) 0.4 0.4 (0.5) 0.3 (0.4) - (0.2) (0.6)
Income tax provision (benefit) 39.9 29.4 (4.0) 44.9 2.3 4.9 1.5 (1.1)
Interest expense 3.9 4.7 6.7 14.6 16.0 4.0 4.5 16.5
Interest income (1.1) (1.5) (2.0) (3.6) (2.4) (0.8) (0.4) (2.0)
Depreciation and amortization expense 29.7 28.9 39.1 42.8 44.0 11.4 11.2 43.8
EBITDA 182.6$ 136.6$ 82.1$ 152.5$ 94.2$ 34.4$ 20.0$ 79.8$
Trailing 12
Months
($ in millions) Year Ended December 31 Qtr. Qtr.
Lift Truck 2014 2015 2016 2017 2018 3/31/2018 3/31/2019 3/31/2019
Reconciliation of EBITDA
Net income attributable to stockholders $ 111.2 $ 89.3 $ 66.9 $ 71.8 $ 56.7 20.7$ 9.6$ 45.6$
Noncontrolling interest income (loss) 0.4 0.4 (0.5) (0.4) (0.9) (0.1) (0.4) (1.2)
Income tax provision 40.7 39.4 12.2 59.4 10.6 6.8 3.1 6.9
Interest expense 3.9 4.7 6.9 13.9 15.4 3.8 4.3 15.9
Interest income (1.1) (1.5) (3.0) (3.7) (2.6) (0.8) (0.4) (2.2)
Depreciation and amortization expense 29.6 27.3 28.1 29.6 33.5 7.6 7.9 33.8
EBITDA $ 184.7 $ 159.6 $ 110.6 $ 170.6 $ 112.7 $ 38.0 $ 24.1 $ 98.8
Trailing 12
Months
33

Solutions for a changing world
Non-GAAP Reconciliation EBITDA (continued)
_____________________
Note: EBITDA in this investor presentation is provided solely as a supplemental disclosure with respect to operating results. EBITDA does not represent net income (loss), as defined by U.S. GAAP and should not be considered as a substitute for net income or net loss, or as an indicator of operating performance. The Company
defines EBITDA as income (loss) before asset impairment charges, income taxes and noncontrolling interest income (loss) plus net interest expense and depreciation and amortization expense. EBITDA is not a measurement under U.S. GAAP and is not necessarily comparable with similarly titled measures of other companies.
($ in millions)
Qtr. Qtr.
Nuvera 2014 2015 2016 2017 2018 3/31/2018 3/31/2019 3/31/2019
Reconciliation of EBITDA
Net loss attributable to stockholders $ (1.4) $ (14.6) $ (23.8) $ (26.7) (27.9)$ (7.3)$ (6.1)$ $ (26.7)
Nuvera asset impairment - - - 4.9 - - - -
Income tax benefit (0.8) (10.0) (15.8) (15.3) (10.5) (2.7) (2.3) (10.1)
Interest expense - - - - 0.1 - - 0.1
Interest income - - - - - - - -
Depreciation and amortization expense 0.1 1.6 1.5 2.0 0.8 0.9 0.2 0.1
EBITDA (2.1)$ (23.0)$ (38.1)$ (35.1)$ (37.5)$ (9.1)$ (8.2)$ (36.6)$
Year Ended December 31
Trailing 12
Months
($ in millions) Qtr.
Bolzoni 2016 2017 2018 3/31/2018 3/31/2019 3/31/2019
Reconciliation of EBITDA
Net income (loss) attributable to stockholders $ (0.3) 3.9$ 5.8$ 1.9$ 0.3$ 4.2$
Noncontrolling interest income - 0.7 0.5 0.1 0.2 0.6
Income tax provision (benefit) (0.4) 1.0 2.1 0.5 0.5 2.1
Interest expense 0.8 0.8 0.8 0.2 0.2 0.8
Interest income - - - - - -
Depreciation and amortization expense 9.5 11.2 9.7 2.9 3.1 9.9
EBITDA 9.6$ 17.6$ 18.9$ 5.6$ 4.3$ 17.6$
Trailing 12
Months
9 Months Ended
December 31 Qtr.Year Ended December 31
34

Solutions for a changing world
Non-GAAP Reconciliation ROTCE
_____________________
Note: Return on capital employed is provided solely as a supplemental disclosure with respect to income generation because management believes it provides useful information with respect to earnings in a form that is comparable to the Company’s
cost of capital employed, which includes both equity and debt securities, net of cash.
(1) Lift Truck return on capital employed excludes continuing average investments of $129.4 million for Bolzoni and $100.7 million for Nuvera. Investment numbers are based on a 5-point average.
Reconciliation of Return on Total Capital Employed (ROTCE)
Consolidated Lift Truck(1) Nuvera Bolzoni
LTM 3/31/19
Average Stockholders' Equity (3/31/19, 12/31/18, 9/30/18, 6/30/18, and 3/31/18) $552.5 $631.5 $14.4 $130.7
Average Debt (3/31/19, 12/31/18, 9/30/18, 6/30/18, and 3/31/18) 292.8 252.9 (1.5) 46.0
Average Cash (3/31/19, 12/31/18, 9/30/18, 6/30/18, and 3/31/18) (128.4) (345.9) - (12.5)
Average capital employed $716.9 $538.5 $12.8 $164.2
Net income (loss) $23.2 $45.6 $(26.7) $4.2
Plus: Interest expense, net 14.5 13.7 0.1 0.8
Less: Income taxes on interest expense, net at 26% (3.8) (3.6) - (0.2)
Actual return on capital employed = actual net income (loss) before interest expense, net, after tax $33.9 $55.7 $(26.6) $4.8
Actual return on capital employed percentage 4.7% 10.4% n/m 2.9%
($ in millions)
35

Solutions for a changing world
Cash Flow before Financing Calculation
36
Consolidated
($ in millions) Year Ended December 31 Qtr.Trailing 12
Months
2014 2015 2016 2017 2018 3/31/2019 3/31/2019
Reconciliation of Cash Flow before Financing
Net cash provided by (used for) operating activities $100.0 $89.4 $(48.9) $164.7 $67.6 ($22.4) $16.7
Net cash used for investing activities (44.4) (31.3) (145.1) (47.3) (110.9) (8.0) (111.9)
Cash Flow before Financing $55.6 $58.1 $(194.0) $117.4 ($43.3) ($30.4) ($95.2)
Impact of accelerated supplier payments - - 80.0 (80.0) - - -
Adjusted Cash Flow before Financing $55.6 $58.1 $(114.0) $37.4 ($43.3) ($30.4) ($95.2)
Solutions for a changing world
Supplemental Information
Solutions for a changing world
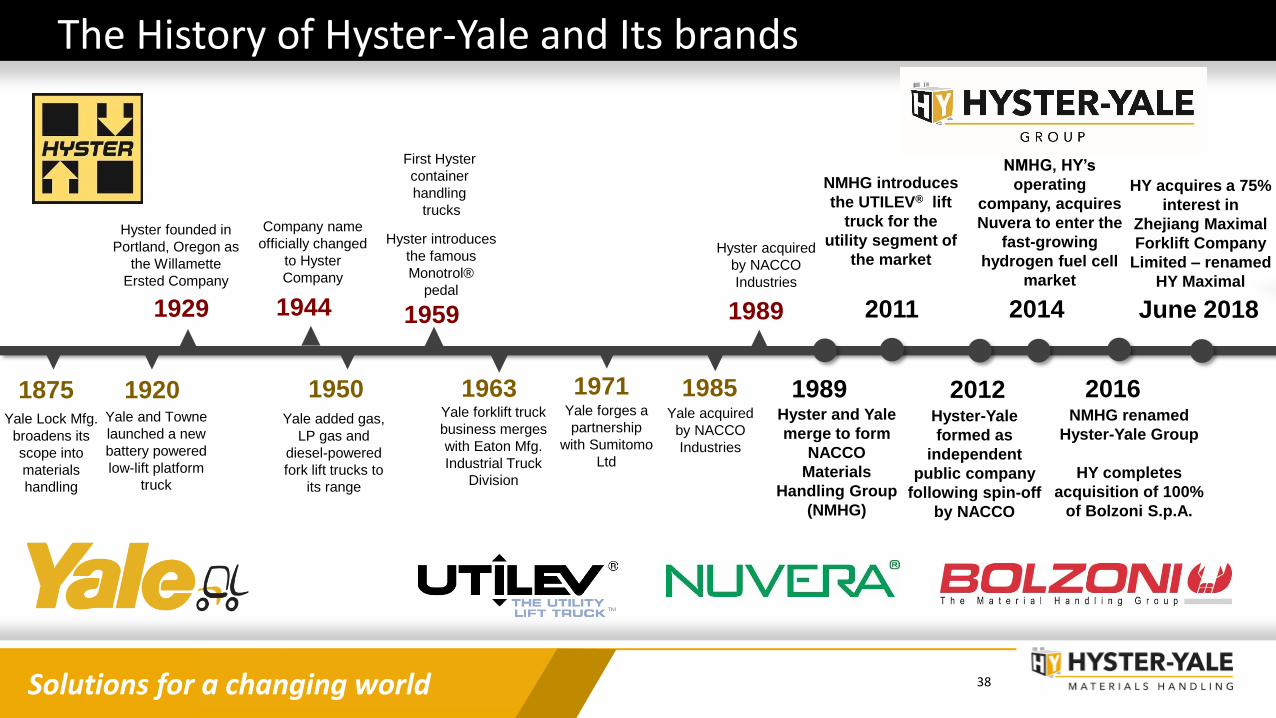
Hyster founded in
Portland, Oregon as
the Willamette
Ersted Company
1929 1944 1959
Company name
officially changed
to Hyster
Company
First Hyster
container
handling
trucks
1875 1920Yale Lock Mfg.
broadens its
scope into
materials
handling
Yale and Towne
launched a new
battery powered
low-lift platform
truck
1963Yale forklift truck
business merges
with Eaton Mfg.
Industrial Truck
Division
1950Yale added gas,
LP gas and
diesel-powered
fork lift trucks to
its range
Hyster introduces
the famous
Monotrol®
pedal
1971Yale forges a
partnership
with Sumitomo
Ltd
2011
NMHG introduces
the UTILEV® lift
truck for the
utility segment of
the market
20161985Yale acquired
by NACCO
Industries
1989
Hyster acquired
by NACCO
Industries
NMHG renamed
Hyster-Yale Group
HY completes
acquisition of 100%
of Bolzoni S.p.A.
The History of Hyster-Yale and Its brands
1989 2012Hyster-Yale
formed as
independent
public company
following spin-off
by NACCO
2014
NMHG, HY’s
operating
company, acquires
Nuvera to enter the
fast-growing
hydrogen fuel cell
market
Hyster and Yale
merge to form
NACCO
Materials
Handling Group
(NMHG)
June 2018
HY acquires a 75%
interest in
Zhejiang Maximal
Forklift Company
Limited – renamed
HY Maximal
38

Solutions for a changing world
Hyster-Yale’s Global Footprint
Ramos Arizpé, Mexico
Fabrication Manufacture
Sulligent, Alabama
Attachment and
Component Manufacture
Berea, Kentucky
Lift Truck Manufacture
Greenville, North Carolina
Division Headquarters; Lift Truck Manufacture;
Warehouse Development Center
Cleveland, Ohio
Corporate
Headquarters
Danville, Illinois
Parts Distribution Center
Charlotte, North Carolina
Experience Center
Barueri, Brazil
Brazil Marketing and
Administration Center
Itu, Brazil
Lift Truck Manufacture;
Parts Distribution Center
Craigavon, N. Ireland
Lift Truck Manufacture
Nijmegen, Netherlands
Lift Truck Manufacture; Big Truck Development
Center; Parts Distribution Center
Masate, Italy
Lift Truck Manufacture; European
Warehouse Development Center
Shanghai, China (JV)
Lift Truck Manufacture;
Parts Distribution; China
Marketing and
Administration Center
Obu, Japan (JV)
Lift Truck Manufacture;
Parts Distribution
Cavite, Philippines (JV)
Fabrication Manufacture
Irvine, Scotland
European Administration Center
Hanoi, Vietnam (JV)
Component Manufacture
Sydney, Australia
Division Headquarters;
Parts Distribution
Pune, India
Engineering, Supply Chain
and Marketing Center
Frimley, UK
Division Headquarters;
Engineering Concept Centre
Kuala Lumpur, Malaysia
Asia Support Office
Hefei, China
Supply Chain
Center
Fairview, Oregon
Counterbalanced
Development Center;
Administration Center
San Donato, Italy
European Offices; Research &
Development; Testing Facilities
Billerica, Massachusetts
Fuel Cell Business
Headquarters; Research
and Development;
Manufacturing and Sales
Homewood, Illinois
Attachment Manufacture
Piacenza, Italy
Bolzoni Headquarters; Attachment,
Lift Table and Fork Manufacture
Järvenpää, Finland
Attachment
Manufacture
Salzgitter, Germany
Attachment Manufacture
Wuxi, China
Attachment Manufacture
Hebei, China
Fork Manufacture
Pointe-Claire,
Canada
Commercial
Subsidiary
Prestons/Sydney, Australia
Commercial Subsidiary
Warrington, UK
Commercial Subsidiary
Montcarda/Reixac, Spain
Commercial Subsidiary
Forbach, France
Commercial Subsidiary
Prato, Italy
Attachment Manufacture
Lublin, Poland
Commercial Subsidiary
Moscow, Russia
Commercial
Subsidiary
Korschenbroich,
Germany
Commercial Subsidiary
Gävle, Sweden
Commercial
Subsidiary
Helmond, Netherlands
Commercial Subsidiary
Lift Truck Business locations
Fuel Cell Business (Nuvera) locations
Attachment Business (Bolzoni) locations
Global Headquarters
LEGEND:
Tyler, Texas
HY Telematics
Chessy, France
Commercial Offices
Neu-Isenburg, Germany
Commercial Offices
Weeze, Germany
Experience & Test Center
Hangzhou, China (JV)
Lift Truck Manufacture
(Maximal)
39

Solutions for a changing world
ICE Units49%
Electric Units28%
Bolzoni5%
Nuvera1%
Aftermarket13%
Service, Rental & Other
4%
Overview and Sources of Revenue
2018 Worldwide Sales by Product
_____________________(1) Company estimate.(2) Units sold by Hyster-Yale Maximal since acquisition on June 1, 2018.(3) Includes Big Truck sales that represent 12.9% of total sales.(4) Represents Hyster-Yale North American Lift Truck unit shipments by industry.
A leading global lift truck manufacturer in terms of units sold
2018 Retail Lift Truck Shipments by End Market (4)
#3(1)
Globally in 2018 Lift Truck Units and
Parts
Large installed lift truck base that drives parts
salesOver 840,000 units worldwide at
12/31/18
HY sales of ~ 103,000 lift truck units in LTM 3/31/19
~90,100 units sold – produced in HY plants~4,900 units sold (2)– produced by HY Maximal
~ 8,000 units sold – produced by JV or other third parties
Additional ~ 7,100 lifttruck units sold in
Japan in 2018Direct sales by JV partner
(3)
National Accounts 16%
IndependentDealers
84%
2018 Lift Truck Distribution Channel Mix
Food and Beverage
22%
Short-term Rental 13%
Logistics15%
Manufacturing13%
Consumer andBusiness Trades
13%
Durable Goods11%
Natural Resources & Materials
13%
40

Solutions for a changing world
Historical Consolidated Revenue
$2,057
$2,400$2,489
$2,720$2,824
$1,475
$1,802
$2,541 $2,469$2,666
$2,767$2,578 $2,570
$2,885
$3,174 $3,225
$0
$1,000
$2,000
$3,000
$4,000
2004 2005 2006 2007 2008 2009 2010 2011 2012 2013 2014 2015 2016 2017 2018 LTM 2019
($ in millions)
41

Solutions for a changing world
Class 1 Electric20%
Class 2 Electric9%
Class 3 Electric7%
Class 4 ICE12%
Class 5 ICE52%
Industry Units by Geography
Lift Truck Unit Class Shipments
Europe 34%
Americas 20%
China 30%
Japan 6%
Asia-Pacific7%
Middle East & Africa 3%
_____________________
Source: Company: LTM 3/31/19 Units Shipped
Note: Units sold direct by SN JV are not included
HY Lift Truck Units Sold by Geography
Americas 60%
EMEA 29%
Asia-Pacific/Japan
4%
China 7%
_____________________
Source: WITS. LTM 3/31/19 Orders Reports.
Class 1 Electric
17% Class 2 Electric
9%
Class 3 Electric
37%Class 4 ICE
2%
Class 5 ICE35%
_____________________
Source: WITS. LTM 3/31/19 Orders Reports.
ICE = Internal Combustion Engine
Class 1 Electric
19% Class 2 Electric
9%
Class 3 Electric
29%Class 4 ICE
8%
Class 5 ICE35%
_____________________
Source: Company: LTM 3/31/19 Units Shipped
Note: Units sold direct by SN JV are not included
ICE = Internal Combustion Engine
Industry Units by Class
HY Lift Truck Units by Class
Class 1 Electric20%
Class 2 Electric11%
Class 3 Electric10%
Class 4 ICE 4%
Class 5 ICE 55%
_____________________
Source: Internal Company estimates
Estimated Industry Revenue Mix
Industry Unit Revenue by Class
HY Lift Truck Unit Revenue by Class
_____________________
Source: Company LTM 3/31/19 Unit Revenues
42

Solutions for a changing world
Japan
Western Europe
Eastern Europe
BrazilNorthAmerica
Middle East & Africa
Latin America (excluding Brazil)
Asia (excluding China & Japan)
China
( 3 & 12 months rate of change trend)Global Lift Truck Market Rates of Change
_____________________
Source: WITS. Bookings Reports.
43

Solutions for a changing world
Lift Truck Market Size DataLift Truck Market Size Data
WITS Orders Basis (1) 2002 2003 2004 2005 2006 2007 2008 2009 2010 2011
Europe 265,896 278,024 312,455 327,173 380,557 445,583 411,107 222,883 299,387 368,286
North America 147,322 155,191 186,192 198,058 212,953 191,384 159,279 98,338 136,050 169,589
Total Americas 158,388 168,471 206,225 221,155 242,186 234,353 200,178 118,835 180,903 224,501
A/P, China and Japan (1a) 138,452 155,094 185,530 201,062 232,438 271,018 260,246 205,114 314,162 381,795
Global Market 562,736 601,589 704,210 749,390 855,181 950,954 871,531 546,832 794,452 974,582
2012 2013 2014 2015 2016 2017 2018 2019E
Europe 351,441 357,452 387,905 412,642 457,333 509,157 563,573 605,000
North America 181,191 200,939 219,444 235,128 240,836 266,543 276,904 280,000
Total Americas 229,565 252,930 267,546 277,315 280,827 315,395 328,349 335,000
A/P, China and Japan (1a) 363,399 399,395 438,510 409,923 443,938 570,443 646,057 642,000
Global Market 944,405 1,009,777 1,093,961 1,099,880 1,182,098 1,394,995 1,537,979 1,582,000
(1) In 2009, Hyster-Yale switched to tracking Industry data on a World Industrial Truck Statistics ("WITS") Orders Basis. WITS statistics began in 2002.
(1a) Beginning in 2014 includes India local productionIndustry forecast (light blue columns) – source: Derived from DRI-WEFA and Oxford Economic Forecasts
1992 1993 1994 1995 1996 1997 1998 1999 2000 2001
Europe (FEM/JIVA) (3) 150,250 121,922 135,318 152,667 174,953 176,294 187,902 219,615 227,697 274,681
North America (2) (3) 106,590 120,679 154,167 162,725 152,763 178,456 192,192 197,436 205,033 145,967
Total Americas (2) (3) 114,411 127,308 162,261 171,682 168,170 193,413 207,018 209,843 223,499 161,316
A/P, China and Japan (3) 134,635 123,913 119,733 135,050 148,135 148,441 111,848 104,781 122,354 123,780
2002 2003 2004 2005 2006 2007 2008 2009
Europe (FEM/JIVA) (3) 256,717 263,972 286,546 302,158 337,326 382,047 376,945 201,352
North America (2) (3) 144,529 151,911 182,450 194,475 207,919 185,726 149,863 95,562
Total Americas (2) (3) 156,702 166,328 203,552 218,908 238,141 229,509 192,134 115,752
A/P, China and Japan (3) 129,333 146,334 171,000 195,386 222,074 250,684 257,604 199,159
Non-WITS Prior Year Information:Lift truck market size history – source: Industrial Truck Association, Japan Industrials Vehicle Association ("JIVA"), European Federation of
Materials Handling ("FEM"), World Industrial Truck Association
(2) Total Americas numbers for 1992-2008 include North America Commercial, Government and Latin America. Prior years are
North America Commercial only.
(3) Industry information is based upon the reporting basis of each individual region, which varies according to the industry trade
groups in that region:
Americas - North America & Government - Retail bookings
Americas - Latin America - Factory bookings
Europe & Japan - Factory shipments
A/P & China - Factory bookings
44

Solutions for a changing world
Our Long-Term Philosophy
Long-term growth
Long-term shareholders
Shareholder protection
Senior management
incentivized as long-term
shareholders
Increase shareholder value
Return on Capital Employed and Market Share Increase focus
45
Solutions for a changing world
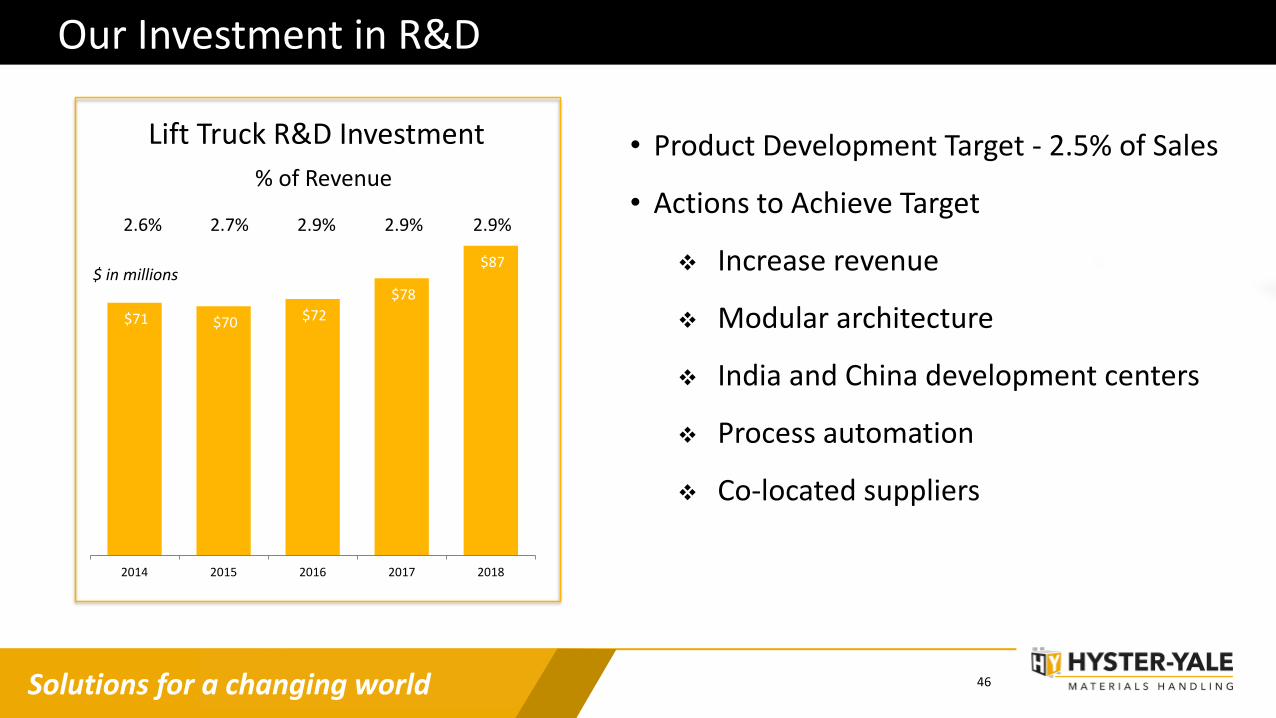
Our Investment in R&D
Lift Truck R&D Investment
$71 $70 $72
$78
$87
2014 2015 2016 2017 2018
2.6% 2.7% 2.9% 2.9% 2.9%
% of Revenue
$ in millions
• Product Development Target - 2.5% of Sales
• Actions to Achieve Target
Increase revenue
Modular architecture
India and China development centers
Process automation
Co-located suppliers
46

Solutions for a changing world
Building a Platform to Grow in Emerging Markets with Hyster-Yale Maximal Forklift [Zhejiang] Co., Ltd.
• Established in 2006 in Fuyang District / Founder: Mr. JinHong Lu• 600 employees and 1.4 million ft2 office and factory• Original Equipment Manufacturer with design, manufacture, sales and service operations• Full production capabilities including fabrication, weld, paint & assembly• Domestic and export sales, with globally respected product, brand and distribution
On June 1, 2018, invested $90 Million for 75% controlling interest • 25% ownership remains with seller and new company CEO• HY will pay up to an additional $10 Million after 3 years as
incentive to the seller• Established a China-based Emerging Market Development
Center to drive design for utility and standard products
Impact of Investment:• Contributed $65.3m in sales and generated $2.6m net loss since acquisition
(including purchase price accounting adjustments)
• Expand low-cost, global manufacturing capabilities
• Enhance access to competitive component sourcing
• Strengthen utility and standard product portfolio
• Enhance presence in China market and global utility and standard segments
• Increase core brand share, and global group unit volume
• Deliver accretive earnings in 2019 and contribute to Company’s achievement of 7% operating profit margin*
*Estimate does not include impact of $10M incentive payout or purchase price accounting adjustments recorded after acquisition.
47

Solutions for a changing world
Near Term Synergy Plan
• Consolidate existing China operations• Insource and expand manufacturing• Leverage low cost sourcing• Introduce HY expertise• Implement HY best practices
Rationalize Operations
Leverage Cost Advantage
Improve Operations
Enhance Development
Expand Products
Optimize Distribution
Emerging Market Development Center
Fuyang, China
HY Independent Global Distribution
• Maximize coverage • Maintain two channels to
target diverse markets• Optimize product line-up• Apply Hyster-Yale expertise to
enhance dealer performance
Maximal Global Distribution
OPERATIONS DEVELOPMENT DISTRIBUTION
Leverage local design expertise and regional supply base to deliver right specification at right price
Product Development for:• Emerging markets• Global utility and standard product
segments
48

Solutions for a changing world
2017 2018 2019 2020 2021 2022 2023
Projected Investment Return Update
49
Current estimate based on:• 2018 after tax performance, including purchase price accounting adjustments• 2019-2023 after-tax earnings with additional global synergies
Current Estimate
Investment Case
*Graphic does not include impact of the $10M incentive payout
Impact on Annual Global Hyster-Yale Earnings

Solutions for a changing world
Bolzoni Revenue by Product Line – LTM 3/31/19
Other Revenues
4%
Forks
13%
Lift Table
4%
Attachments
63%
$241.4M
50
(1) Q1 2019 includes cyclinders and transmissions produced in the Sulligent, Alabama plant
Cylinders and
Transmissions
16%(1)

Solutions for a changing world
Separation to maintain OEM information integrity
Managed as separate business segment
OEM 1 31.6%
OEM 2 28.5%
OEM 320.9%
OEM 415.4%
OEM 53.6%
2018 TOP 5 OEM CUSTOMERS
Bolzoni Strategy: Enhance Strong OEM Relationships
51
43%57%
Lift Truck Manufacturers – OEM
Lift Truck & Material Handling Dealers
2018 CUSTOMER MIX
EUROPE 63%
AMERICAS 31%
ASIA6%
2018 OEM SALES BY REGION
Sales outside of Italy = 87.3% of 2018 Global Sales

Solutions for a changing world
Bolzoni Strategy: Synergies with HY
Develop Bolzoni as global supplier of
attachments & forks to HY globally
Accelerate growth of attachment business
in North America
Leverage Bolzoni manufacturing
capacity
Achieve procurement and logistics cost
savings
Increase sales of HY forklift & Bolzoni attachments by creating
high-quality product package
GROWTHPromote through HY distribution system
52

Solutions for a changing world
Fuel Cell Solution Growth Opportunities
N. America
electric trucks soldper year
175,000+
25-50%Estimated up to
can benefit from fuel cell solutions
Global850,000+ electric trucks soldper year
6,087 8,255 9,053
11,715
16,518
21,838
25,400
-
5,000
10,000
15,000
20,000
25,000
30,000
2012 2013 2014 2015 2016 2017 2018
DOE reported North America (1)
Population of Fuel Cell Powered Lift Trucks in North America
Trend in population of fuel cell powered lift trucks in North America expected to continue
(1) Source: DOE Hydrogen and Fuel Cells Program Record. Record #18002. May 30, 2018(2) Plug Power public information ~25,000 units + ~400 Nuvera units
(2)
53
Company Estimate(2)

Solutions for a changing world
Integrators OEM’s
• Speed to Market• Close to customer• Quality Control• Control of IP
• Long term partnership• Custom design and development• IP Transfer/ sharing• Economies of scale
L3
Fuel Cell Hybrid Vehicle
L2
Fuel Cell Engine
L1
Fuel Cell Module
L0
Fuel Cell Stack
L3
Fuel Cell Hybrid Vehicle
L2
Fuel Cell Engine
L1
Fuel Cell Module
L0
Fuel Cell Stack
Business Development Approach
Nuvera
54

Solutions for a changing world
Expansion of Product Line
55
Demonstration in critical port application in California
Performance benefits• Metal plates – higher durability• High power density• Open flow field – improved fuel efficiency
Modular, easily integrated solution
2019 Heavy duty engine
Leverage experience from HY supply
Scale up manufacturing capability
Planned localization for China market (post-2019)
Shown: Hyster 1150HD CH ICE configuration

Solutions for a changing world
China Market Research and Engagement
Engaged China-based market research and segmentation study• Significant government incentives driving market interest• Several companies are early entrants, but market open to other partners• Nuvera technology is a strong fit at a competitive cost
Engaging with the Chinese Hydrogen Fuel Cell Industry and Businesses
China Central Government Roadmap
2020 2025 2030
Vehicles Deployed 5,000Public Transport
50,000Public Transport
Private Application
1 million Total Units
Hydrogen Fueling Stations 100 300 1,000
• Attended the Second China International Hydrogen & Fuel Cell 2017 Conference and Exhibition• Attended the 8th China International New Energy Vehicle 2018 Forum• Member International Hydrogen Fuel Cell Association (China)
56

Solutions for a changing world
A Solid Investment Option
HYSTER-YALE
Strong Balance Sheet
Cash Generation & Commitment to
Shareholder Return
Investment & Growth in Game Changing Technologies
Leading Products & Market Position
Strategies to Gain Share in all Segments & Markets
Customer Focused & Solutions Oriented
Strong Return on Capital
57