Embed Size (px)
Citation preview

Hizmete Özel / Confidential
Investor Presentation
October 2021

Hizmete Özel / Confidential
This presentation contains forward-looking statements that reflect the Company management’s current views with respect to certain future events. Although it is believed that the expectations reflected in these statements are reasonable, they may be affected by variables and changes in
underlying assumptions that could cause actual results to differ materially.
Neither Tüpraş nor any of its directors, managers or employees nor any other person shall have any liability whatsoever for any loss arising from use of this presentation.
www.tupras.com.trOct-21Investor Presentation 2
Disclaimer
Disclaimer
Hizmete Özel / Confidential
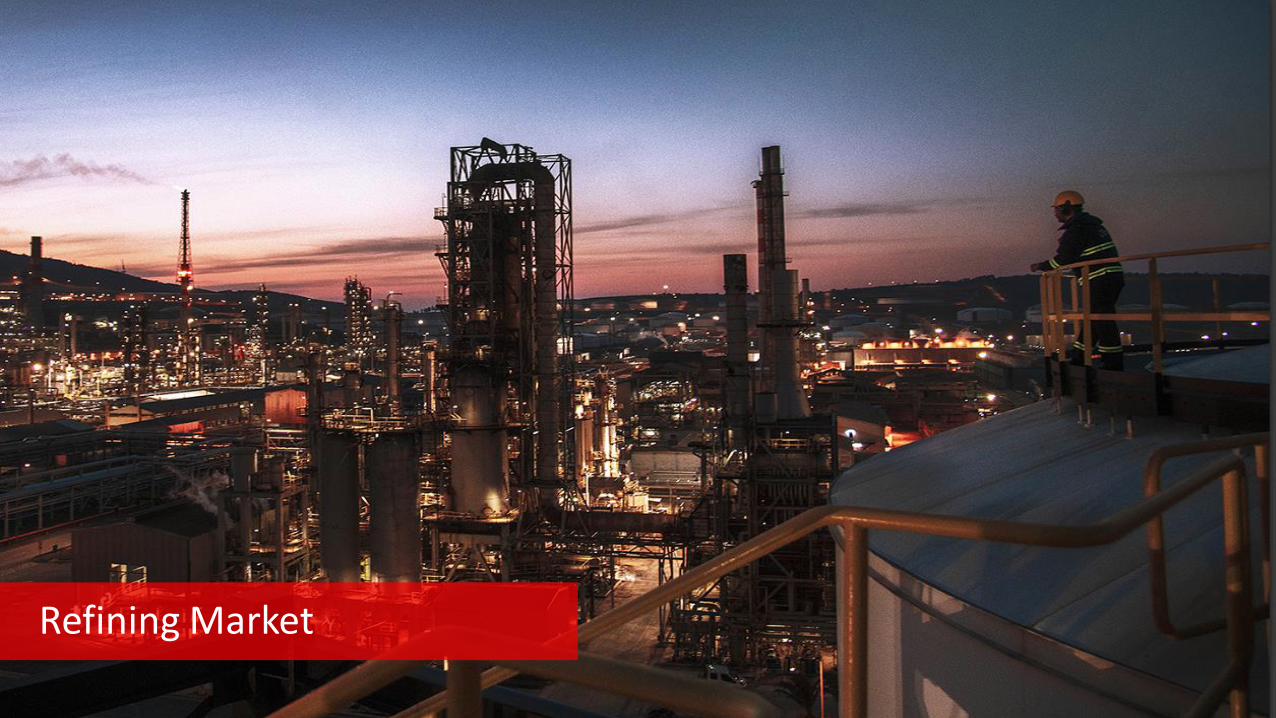
Refining Market

Hizmete Özel / Confidential
Brent Crude Prices
www.tupras.com.trOct-21Investor Presentation 4Refining Market
$/bbl
+ OPEC ++ production cut+ Impact of Iran & Venezuela sanctions+ Escalating regional tension+ Covid 19 vaccine discovery
- Concerns on global economic development
- Covid-19 related demand drop- Storage capacity fill up
data as of 30 September 2021
63.5
55.4
31.8
18.5
29.0
40.143.4
44.8
40.8 40.242.7
49.9
54.8
62.2
65.6 64.768.7
73.0
75.0
70.874.6
10
20
30
40
50
60
70
80
90
1 2 3 4 5 6 7 8 9 10 11 12
5yr range 5 yr ave 2020 2021
Year Average Brent Prices ($/bbl)
2016 43.7
2017 54.3
2018 71.0
2019 64.3
2020 41.7
Hizmete Özel / Confidential
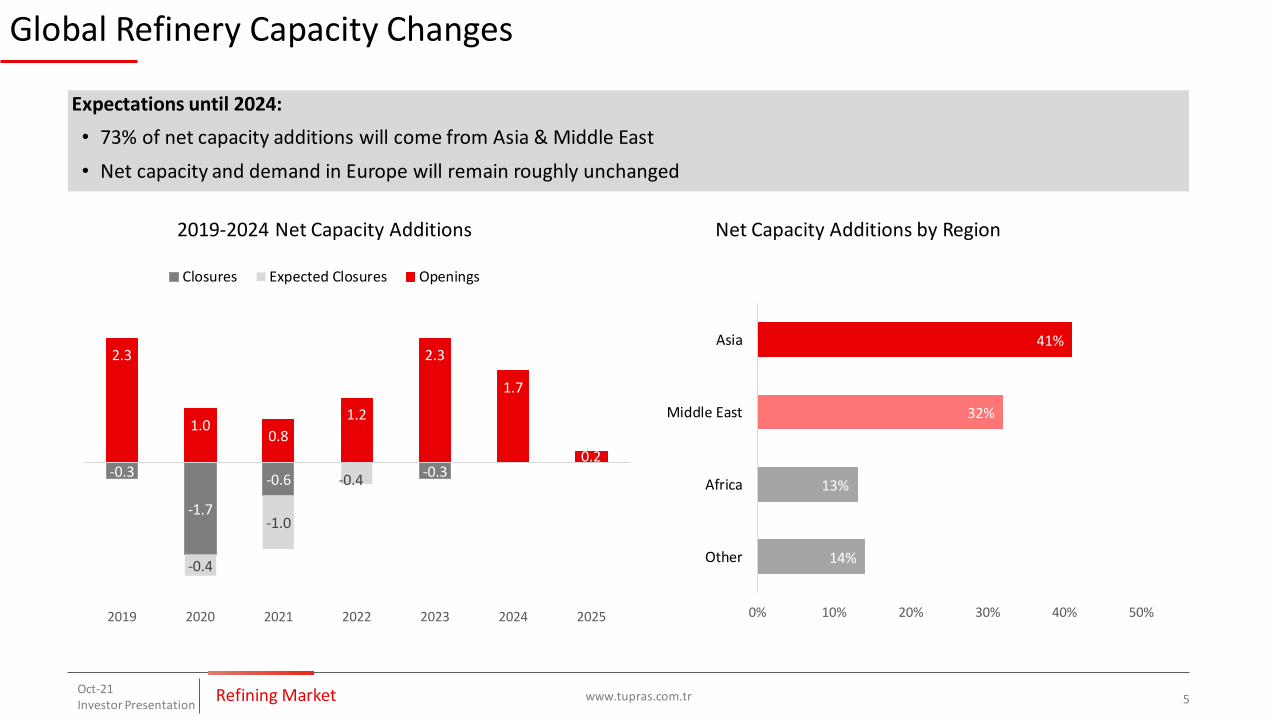
Global Refinery Capacity Changes
www.tupras.com.trOct-21Investor Presentation 5Refining Market
Expectations until 2024:
• 73% of net capacity additions will come from Asia & Middle East
• Net capacity and demand in Europe will remain roughly unchanged
14%
13%
32%
41%
0% 10% 20% 30% 40% 50%
Other
Africa
Middle East
Asia
Net Capacity Additions by Region
-0.3
-1.7
-0.6-0.3
-0.4
-1.0
-0.4
2.3
1.00.8
1.2
2.3
1.7
0.2
2019 2020 2021 2022 2023 2024 2025
2019-2024 Net Capacity Additions
Closures Expected Closures Openings

Hizmete Özel / Confidential
Middle Distillate Cracks
www.tupras.com.trOct-21Investor Presentation 6Refining Market
11.2
10.1
12.5
9.7
5.0
4.8
6.4
4.7
2.4
4.34.8
5.4
4.9 4.8
3.7 4.15.0
5.7
5.1
6.8
9.5
0
5
10
15
20
1 2 3 4 5 6 7 8 9 10 11 12
Diesel
5yr range 5 yr ave 2020 2021
$/bbl
10.4
7.9
5.8
-1.7
-3.9
-1.6 -0.6
-2.3 -3.3
0.5
2.2 3.1
3.0 1.8
0.9 1.9 2.3 2.7 2.5
4.1
6.6
-10
-5
0
5
10
15
20
1 2 3 4 5 6 7 8 9 10 11 12
Jet Fuel
5 yr range 5 yr ave 2020 2021
data as of 30 September 2021
Hizmete Özel / Confidential
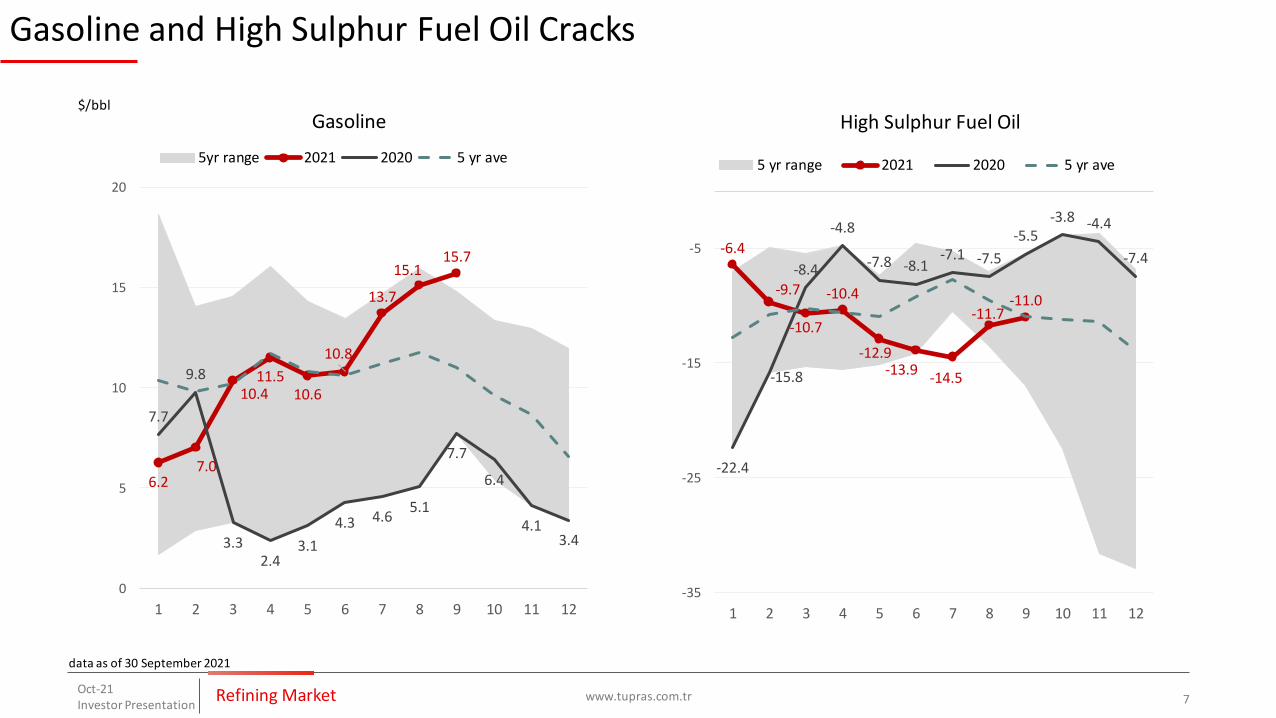
Gasoline and High Sulphur Fuel Oil Cracks
www.tupras.com.trOct-21Investor Presentation 7Refining Market
$/bbl
6.27.0
10.411.5
10.6
10.8
13.7
15.115.7
7.7
9.8
3.32.4
3.1
4.3 4.65.1
7.7
6.4
4.13.4
0
5
10
15
20
1 2 3 4 5 6 7 8 9 10 11 12
Gasoline
5yr range 2021 2020 5 yr ave
-6.4
-9.7
-10.7
-10.4
-12.9-13.9
-14.5
-11.7-11.0
-22.4
-15.8
-8.4
-4.8
-7.8 -8.1-7.1 -7.5
-5.5-3.8 -4.4
-7.4
-35
-25
-15
-5
1 2 3 4 5 6 7 8 9 10 11 12
High Sulphur Fuel Oil
5 yr range 2021 2020 5 yr ave
data as of 30 September 2021

Hizmete Özel / Confidential www.tupras.com.trOct-21Investor Presentation 8
Heavy Crude Price Differentials to Brent ($/bbl)
-12
-10
-8
-6
-4
-2
0
2
1 2 3 4 5 6 7 8 9 10 11 12 1 2 3 4 5 6 7 8 9 10 11 12 1 2 3 4 5 6 7 8 9 10 11 12 1 2 3 4 5 6 7 8 9 10 11 12
2018 2019 2020 2021
Arab Heavy
Basrah Heavy
Kirkuk
Ural
Average*
0
*Simple average of listed differentials
OPEC+ Cut Decision
Iran Sanctions
OPEC+disagreement
OPEC+ Cut Decision
Refining Market
Hizmete Özel / Confidential
Turkish Market

Hizmete Özel / Confidential
0.9 0.8
0.8 0.9
0.4 0.4
2.2 2.2
2020 2021
LPG
0.5 0.5
0.5 0.6
0.30.4
1.3
1.5
2020 2021
Gasoline
Turkish Market, 7M 2021
www.tupras.com.trOct-21Investor Presentation 10Turkish Market
¹Transit flight consumption included
5.6 5.6
5.3 6.3
2.62.5
13.514.4
2020 2021
Diesel
+18.4%
+0.6%
+258.5%
-36.2%
+40.4%
-5.0%
+9.6%
-7.9%
Q2 Q1July
0.90.6
0.2 0.7
0.2
0.41.3
1.7
2020 2021
Jet1
+7.6%
-3.3%
+28.7%
+131.1%

Hizmete Özel / Confidential
Turkey’s Net Import / Export Balance
www.tupras.com.trOct-21Investor Presentation 11Turkish Market
-3.4
2.8
-12.3
0.1
-3.1
3.2
-13.2
0.3
-3.2
2.4
-13.6
-0.4
-3.0
3.0
-8.8
0.3
-2.9
1.9
-5.9
0.4
-16 -12 -8 -4 0 4
LPG
Gasoline
Diesel
Jet
2020 2019 2018 2017 2016
ExportImportMillionTons
97%
87%
41%
Gasoline
Jet
Diesel
2020 12M
Tüpraş’ Market Share
Fuel Choice of Passenger Cars
LPG;40%
Gasoline; 20%
Diesel; 40%
LPG;40%
Gasoline; 20%
Diesel; 40%

Hizmete Özel / Confidential
Company Overview

Hizmete Özel / Confidential
Tüpraş Shareholder Structure
www.tupras.com.trOct-21Investor Presentation 13Company Overview
¹As of December 31st,2020
Foreign Ownership¹
48%
Domestic Ownership
52%
Free Float49%
Tüpraş is Turkey’s biggest industrial company and leading refiner.
Ditaş79.98%
Opet40%
Körfez Ulaştırma100%
Tüpraş Trading Ltd100%
Koç Holding77%
Aygaz20%
Opet3%
Energy Investments Inc. (SPV)51%

Hizmete Özel / Confidential
Tüpraş’ Refining Assets & Distribution Network
www.tupras.com.trOct-21Investor Presentation 14Company Overview
İzmit İzmir Kırıkkale Batman Total
Capacity (mn tons) 11.3 11.9 5.4 1.4 30
Nelson Complexity 14.5 7.66 6.32 1.83 9.5
Storage Capacity (mn m3) 3.0 2.5 1.3 0.3 7.0
Turkey’s petroleum product needs
Tüpraş;55%
Others; 45%
Turkey’s Storage Capacity
Tüpraş & Opet;57%
Others; 43%
İstanbul
Ankara
İzmir
Mersin
Baku
Kirkuk
OPET
Antalya Terminal19,392 m³
OPETMersin Terminal240,000 m³
OPETGiresun Terminal43,130 m³
OPETMarmara Terminal721,000 m³
İzmit
Kırıkkale
Batman
Crude Pipeline Terminal Refinery
Ceyhan
Railway
Iraq-Turkey Oil Pipeline
Baku-Tbilisi-Ceyhan Oil Pipeline
Integrated system optimization with high
complexity, procurement & logistics flexibility

Hizmete Özel / Confidential
Nelson Complexity of Refining Companies
www.tupras.com.trOct-21Investor Presentation 15Company Overview

Hizmete Özel / Confidential
Tüpraş Subsidiaries
www.tupras.com.trOct-21Investor Presentation 16Company Overview
OPET, Distribution, Tüpraş Share: 40%
• 1,789 stations as of 31 August 2021• As of July 2021 Market share: 17.4% in white products; 10.2% in black
products
DİTAŞ, Marine Transport, Tüpraş Share: 79.98%
• 3 Crude Oil Tanker: 479,765 DWT• 1 Crude Oil - Product Tanker: 51,532 DWT• 10 Product Tanker: 171,453 DWT“
Körfez Ulaştırma, Railway Transport, Tüpraş Share: 100%
• ~7% share in Turkish rail freight market• ~1.5 mn ton of product and semi-product carried in 2020.• Operates with 10 diesel locomotives and over 600 cistern wagons
Tüpraş Trading UK, Trading, Tüpraş Share: 100%
• Trading Office in London is important for wider integration with the global energy landscape by allowing to:
▪ Closely monitor international market opportunities▪ Support import and export operations▪ Create additional value from supply chain and sales activities

Hizmete Özel / Confidential
Operations

Hizmete Özel / Confidential
6371
76 79 81
5564
11
1414 7
14
3421
13
1010
102
310
2 2 312 12
3 3 1
2014 2015 2016 2017 2018 2019 2020
Middle East CIS Europe Africa America
Main Crude Suppliers in 2020
Crude Suppliers of Tüpraş
www.tupras.com.trOct-21Investor Presentation 18
In 2020, Tüpraş purchased 18 different types of crude from 11 countries with gravities ranging between 20-47 API.
Operations
Crude Oil Imports by Region (%)

Hizmete Özel / Confidential
Annual Product Yields
www.tupras.com.trOct-21Investor Presentation 19Operations
2019
White Product Yield (%) 79.0%
Production 28.1 mn tons
API 32.0
2020
White Product Yield (%) 81.5%
Production 23.4 mn tons
API 31.5
LPG4%
Gasoline20%
Naphtha1%
Jet17%
Diesel36%
Fuel Oil9%
Coke3%
Bitumen8%
Other2%
Light Distil.25%
Mid. Distil.53%
Black Prod.20%
Other white
2%
LPG3%
Gasoline21%
Naphtha1%
Jet12%
Diesel45%
Fuel Oil2%
Coke3%
Bitumen12%
Other1%
Light Distil.25%
Mid. Distil.57%
Black Prod.17%
Other White
1%

Hizmete Özel / Confidential
H1 Product Yields
www.tupras.com.tr 20Oct-21Investor Presentation
Operations
LPG3%
Gasoline20%
Naphtha2%
Jet12%
Diesel44%
Fuel Oil3%
Kok4%
Bitumen7%
Other5%
LPG Gasoline Naphtha Jet Diesel
Fuel Oil Kok Bitumen Other
Light Distil.25%
Mid. Distil.59%
Black Prod.14%
Other white
2%
H1 2021
White Product Yield (%) 83.0%
Production 11.1 mn tons
API 31.6
LPG3%
Gasoline19%
Naphtha1%
Jet14%
Diesel44%
Fuel Oil1%
Kok4%
Bitumen10%
Other4%
LPG Gasoline Naphtha Jet Diesel
Fuel Oil Kok Bitumen Other
Light Distil.25%
Mid. Distil.60%
Black Prod.13%
Other white
2%
H1 2020
White Product Yield (%) 82.0%
Production 10.9 mn tons
API 31.3

Hizmete Özel / Confidential10
1
87 91
75
64
80
78
57
86
7
9 7
6
5
9 6
9
6
108
96 98
82
69
8984
65
91
2017 2018 2019 2020 Q2 20 Q3 20 Q4 20 Q1 21 Q2 21
Crude Oil Semi Product Feedstock Total
Capacity Utilization1 (%)Quarterly Production (Mn tons)
Capacity Utilization and Quarterly Production Volume
www.tupras.com.trOct-21Investor Presentation
21
¹Capacity utilization calculation is based on 30 mn tons for Q1 2019 and onwards.
Operations
6.0
4.9
6.4
6.1
4.6
6.5
4
5
6
7
8
Q1 Q2 Q3 Q4
2017 2018 2019 2020 2021

Hizmete Özel / Confidential
Sales
www.tupras.com.trOct-21Investor Presentation
22
• Tüpraş generated 24.5 million tons of total sales in 2020.
Operations
24.8 25.7 25.622.4 19.8
5.5 5.8 4.26.8
4.7
30.3 31.5 29.8 29.2
24.5
2016 2017 2018 2019 2020
Exports
Domestic Sales
10.8 11.3 11.9 10.4 10.6
4.5 4.5 4.94.3 2.2
2.2 2.2 2.22.3
2.3
3.4 3.5 2.91.8
2.4
2016 2017 2018 2019 2020
Bitumen
Gasoline
Jet Fuel
Diesel
Total Sales
Domestic Sales of Key Products
Customer Groups 2020mn tons
mn tons
Sales to Distributors
2020
12.7 mn tons
Total Sales, 2020
24.5 mn tons
Distributors52%
Jet8%
Other12% Export
18%
Bitumen10%
POAŞ27%
OPET30%
SHELL20%
BP14%
OTHER9%

Hizmete Özel / Confidential
Product Sales in Q2 (Million Tons)
www.tupras.com.trOct-21Investor Presentation 23
Tüpraş generated 6.9 million tons of sales in Q2 2021. Mid-distillate sales were strong by resilient domestic
demand. Total product sales increased 30% y-o-y, almost reached to pre-pandemic 2019 levels.
Operations
6.6 6.7
5.5
4.15.1
1.40.7
1.6
1.2
1.8
8.1
7.47.1
5.3
6.9
Q2 2017 Q2 2018 Q2 2019 Q2 2020 Q2 2021
Total Product Sales
Domestic Product Sales International Sales
2.9 3.12.7
2.32.6
1.21.3
1.0
0.2
0.8
0.6
0.6
0.6
0.5
0.6
0.9
0.9
0.4
0.7
0.4
Q2 2017 Q2 2018 Q2 2019 Q2 2020 Q2 2021
Domestic Sales of Selected Products
Diesel Jet Fuel Gasoline Bitumen

Hizmete Özel / Confidential
Key FinancialsFinancials
Hizmete Özel / Confidential
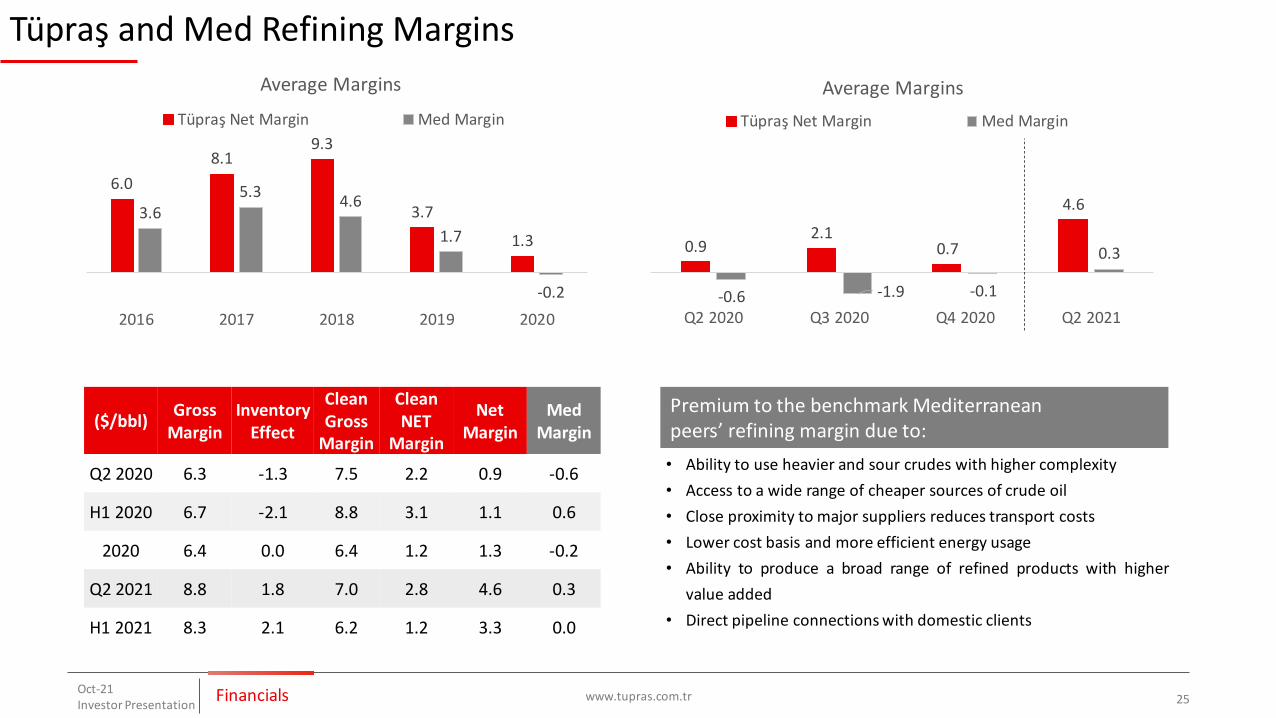
Tüpraş and Med Refining Margins
www.tupras.com.trOct-21Investor Presentation 25Financials
6.0
8.19.3
3.7
1.3
3.65.3
4.6
1.7
-0.2
2016 2017 2018 2019 2020
Average Margins
Tüpraş Net Margin Med Margin
($/bbl)Gross
MarginInventory
Effect
Clean Gross
Margin
Clean NET
Margin
Net Margin
Med Margin
Q2 2020 6.3 -1.3 7.5 2.2 0.9 -0.6
H1 2020 6.7 -2.1 8.8 3.1 1.1 0.6
2020 6.4 0.0 6.4 1.2 1.3 -0.2
Q2 2021 8.8 1.8 7.0 2.8 4.6 0.3
H1 2021 8.3 2.1 6.2 1.2 3.3 0.0
0.92.1
0.7
4.6
-0.6 -1.9 -0.1
0.3
Q2 2020 Q3 2020 Q4 2020 Q2 2021
Average Margins
Tüpraş Net Margin Med Margin
• Ability to use heavier and sour crudes with higher complexity
• Access to a wide range of cheaper sources of crude oil
• Close proximity to major suppliers reduces transport costs
• Lower cost basis and more efficient energy usage
• Ability to produce a broad range of refined products with higher
value added
• Direct pipeline connections with domestic clients
Premium to the benchmark Mediterranean peers’ refining margin due to:

Hizmete Özel / Confidential www.tupras.com.trOct-21Investor Presentation
26Financials
Income Statement (Million TL)
EBITDA realized as 2,512 mn TL in Q2 2021.
*On CMB reports. EBIT includes extra items such as FX impacts of trade receivables and payables. In our EBITDA calculation. FX related items are excluded from EBIT as customary in international practices.
Million TLQ2 Q2
%H1
2021H1
2020%
2021 2020Net Sales 33,688 9,280 263% 53,509 26,219 104%
COGS -30,724 -8,390 266% -49,018 -26,239 87%
Gross Profit 2,964 890 233% 4,491 -20 -
Operating Expenses -691 -520 33% -1,248 -977 28%
Income/Loss from other operations -325 -92 255% -1,910 -441 333%
Operating Profit 1,948 278 600% 1,334 -1,438 -
Income/Loss from equity investment 50 -57 - 60 -226 -
Operating Profit Before Fin. Income/Loss 1,999 221 804% 1,394 -1,663 -
Financial Income /Expense -702 -550 28% -1,058 -1,464 -28%
Profit Before Tax 1,297 -329 - 337 -3,127 -111%
Net Profit (excluding minority interest) 1,700 -185 - 939 -2,450 -
EBITDA *(mn. TL) 2,512 477 427% 3,681 -814 -
Inventory Gain/Loss (mn. TL) 1,407 -8 - 2,919 -2,024 -
EBITDA* (mn. TL) CCS 1,105 484 128% 763 1,210 -37%
Hizmete Özel / Confidential www.tupras.com.trOct-21Investor Presentation
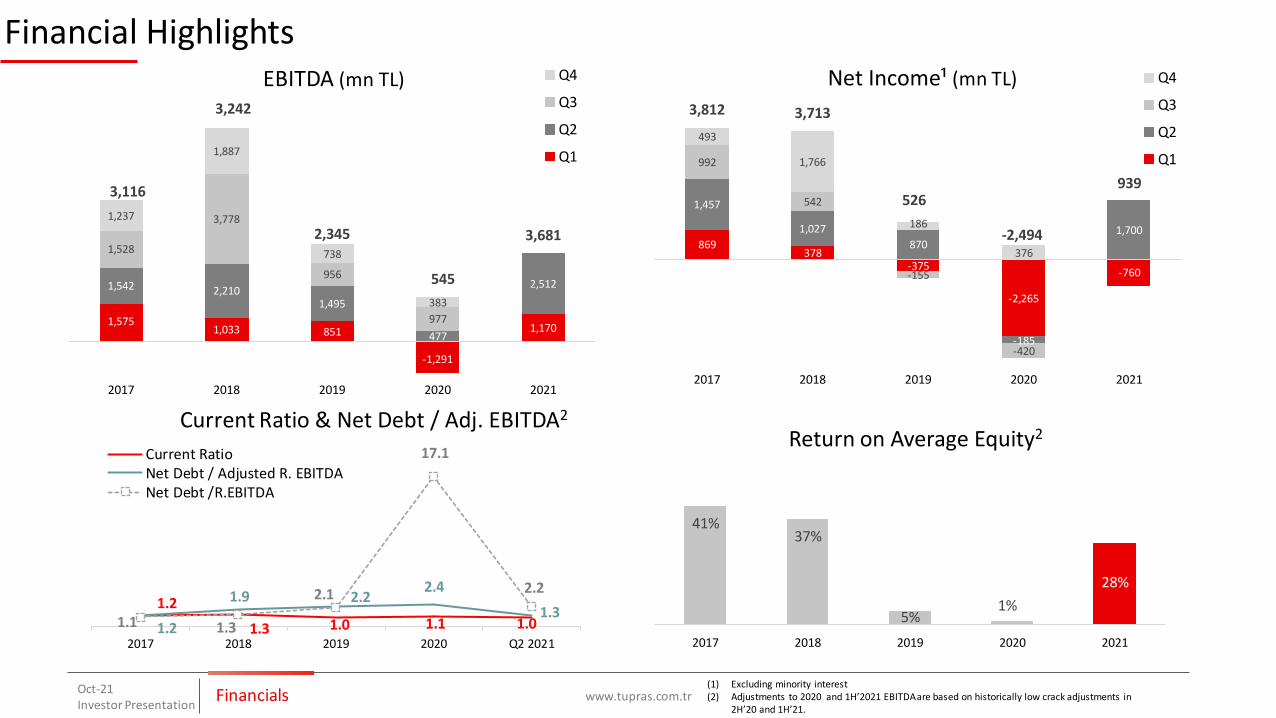
(1) Excluding minority interest(2) Adjustments to 2020 and 1H’2021 EBITDAare based on historically low crack adjustments in
2H’20 and 1H’21.Financials
Financial Highlights
1,5751,033 851
-1,291
1,170
1,542 2,2101,495
477
2,512
1,528
3,778
956
977
1,237
1,887
738
383
3,116
3,242
2,345
545
3,681
2017 2018 2019 2020 2021
EBITDA (mn TL) Q4
Q3
Q2
Q1
869378
-375
-2,265
-760
1,457
1,027
870
-185
1,700
992
542
-155
-420
493
1,766
186
376
3,812 3,713
526
-2,494
939
2017 2018 2019 2020 2021
Net Income¹ (mn TL) Q4
Q3
Q2
Q1
41%37%
5%1%
28%
2017 2018 2019 2020 2021
Return on Average Equity2
1.2
1.3 1.0 1.1 1.01.2
1.9 2.22.4
1.31.1 1.3
2.1
17.1
2.2
2017 2018 2019 2020 Q2 2021
Current Ratio & Net Debt / Adj. EBITDA2
Current RatioNet Debt / Adjusted R. EBITDANet Debt /R.EBITDA

Hizmete Özel / Confidential www.tupras.com.trOct-21Investor Presentation 28Financials
Balance Sheet Analysis
2.1
4.7
-3.6-2.0
-3.0
2.6
-4.7-5.4 -5.6
Dec-17 Dec-18 Dec-19 Mar-20 Jun-20 Sep-20 Dec-20 Mar-21 Jun-21
Working Capital Requirement (Billion TL)
6.2
12.0
8.4
12.211.0
17.8
9.4
12.511.3
1.72.3
1.41.9
1.6
2.3
1.3 1.5 1.30
1
2
3
4
5
6
0
5
10
15
20
Dec-17 Dec-18 Dec-19 Mar-20 Jun-20 Sep-20 Dec-20 Mar-21 Jun-21
Net DebtIn Billion TL In Billion $
12.3
9.8
1.7
6.5
0.1 0.3
1 year 1-2 years 2-3 years 3-4 years 4-5 years Over 5 years
Redemption Schedule (Billion TL)TL Hard Currency
bn TL bn $
Financial Management
• Ongoing strict working capital management continues to lower funding needs
• Improved operational profitability generation further helps delevering

Hizmete Özel / Confidential
Annual Profit Before Tax Bridge (2019-2020)
www.tupras.com.trOct-21Investor Presentation 29
2020 PBT was adversely affected from historically low crack margins, lower production and inventory losses due to Covid19
Financials

Hizmete Özel / Confidential www.tupras.com.trOct-21Investor Presentation 30Financials
Q2 Profit Before Tax Bridge (2021-2020)
Million TL
Despite much narrower differentials and elevated FX, Q2 2021 PBT performed strongly with inventory gains, increase in total sales volume, better crack margins and lower interest expenses.

Hizmete Özel / Confidential
2021 Expectations
www.tupras.com.trOct-21Investor Presentation 31
Med Complex Refining Margin 0.0 - 0.5 $/bbl
25-26 mt production, 26-27 mt sales and 85 - 90% capacity utilization
Tüpraş Net Refining Margin 2.5 - 3.5 $/bbl
• ~40% of capex for sustainability focused energy efficiency and environmental projects
Consolidated Capex ~200 million $
Hizmete Özel / Confidential www.tupras.com.trOct-21Investor Presentation 32Financials
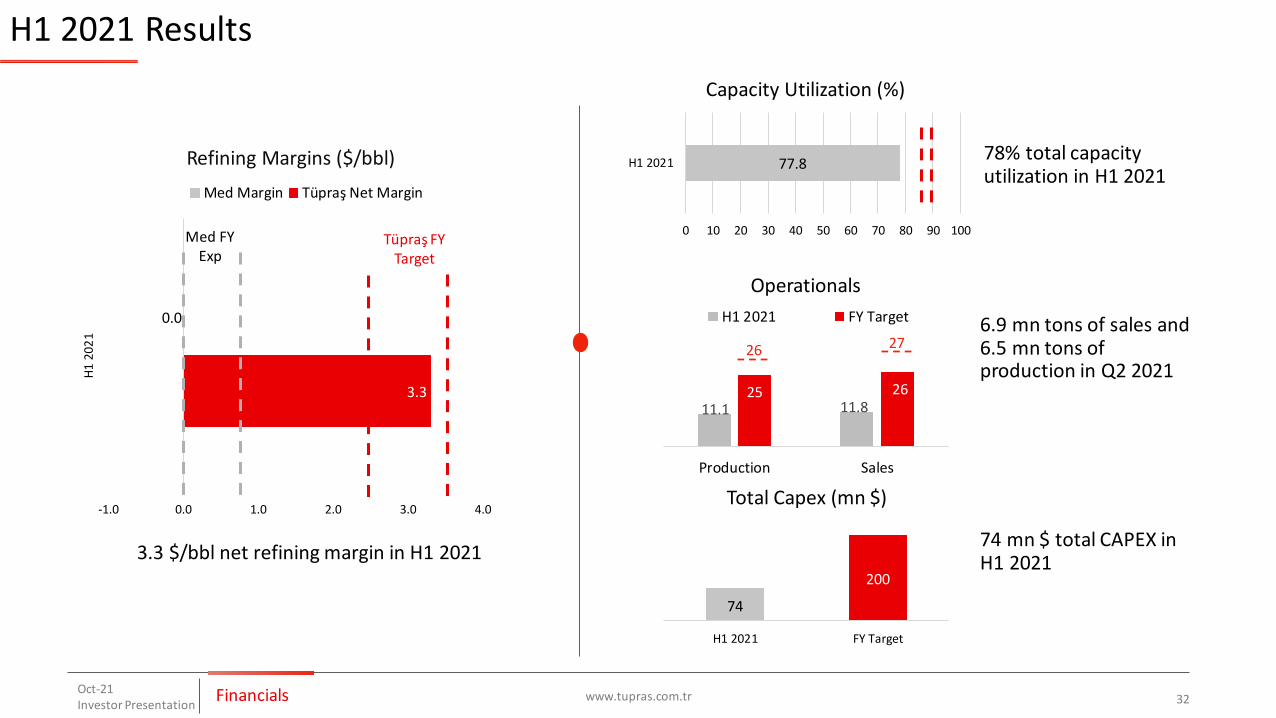
H1 2021 Results
3.3
0.0
-1.0 0.0 1.0 2.0 3.0 4.0
H1
202
1
Refining Margins ($/bbl)
Med Margin Tüpraş Net Margin
78% total capacity utilization in H1 2021
11.1 11.825 26
Production Sales
Operationals
H1 2021 FY Target
26 276.9 mn tons of sales and 6.5 mn tons of production in Q2 2021
74
200
H1 2021 FY Target
Total Capex (mn $)
74 mn $ total CAPEX in H1 2021
77.8
0 10 20 30 40 50 60 70 80 90 100
H1 2021
Capacity Utilization (%)
3.3 $/bbl net refining margin in H1 2021
Med FY Exp
Tüpraş FY Target

Hizmete Özel / Confidential
Investments (Million $)
www.tupras.com.trOct-21Investor Presentation 33
274343
484
219162
633
1,061
1,246
979
357291 301
165236
153 74
2006 2007 2008 2009 2010 2011 2012 2013 2014 2015 2016 2017 2018 2019 2020 H12021
Ongoing Projects
• Revamp of FCC
• Periodic Maintenance of
Vacuum & Lube Complex in
Izmir is postponed to 2022
• Periodic Maintenance of
Crude Unit is planned for Q4
• c6.9 bn USD investments since privatization
• Reached 9.5 Nelson Complexity
• Capability to process heavier and more sour crude
Avg. 296 Mn$
Avg. 980 Mn$
Avg. 250 Mn$
Financials
Hizmete Özel / Confidential
Proactive in liquidity risk management & targets/limits for financial ratios:• Net financial debt/EBITDA
• Net financial debt/Equity
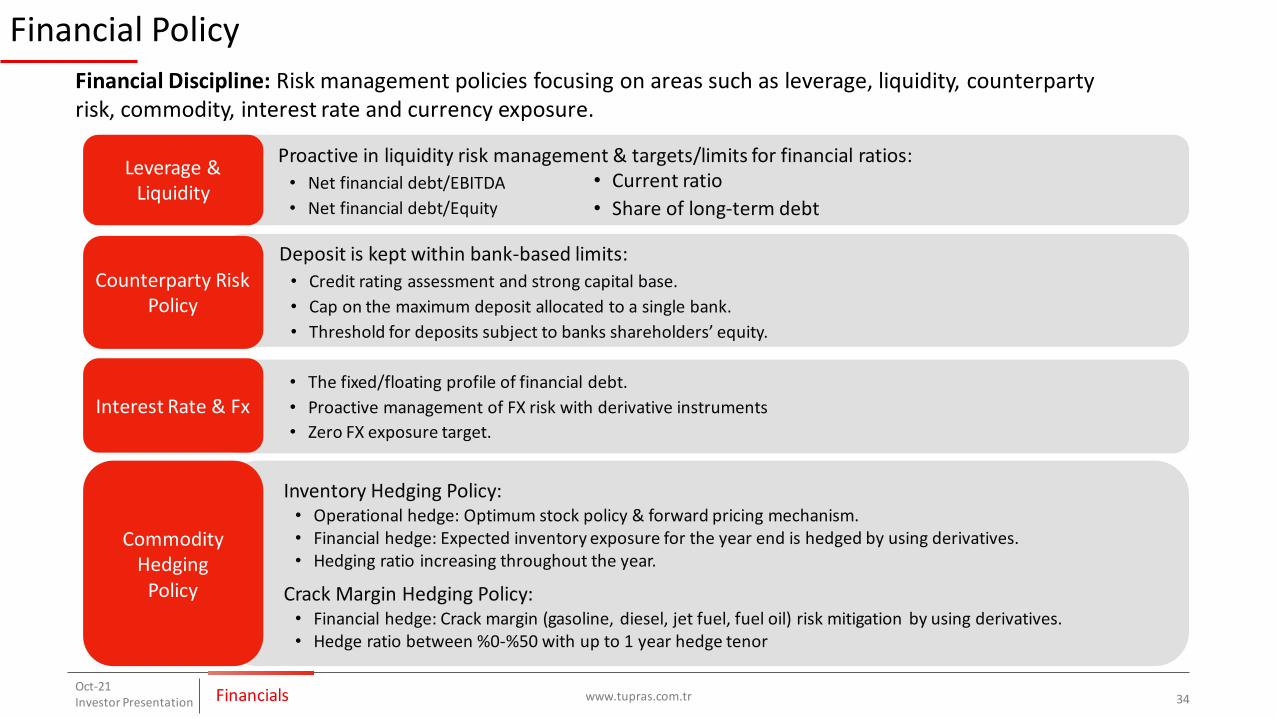
Financial Policy
www.tupras.com.trOct-21Investor Presentation 34
Financial Discipline: Risk management policies focusing on areas such as leverage, liquidity, counterparty risk, commodity, interest rate and currency exposure.
Leverage & Liquidity
• Current ratio
• Share of long-term debt
Deposit is kept within bank-based limits:• Credit rating assessment and strong capital base.
• Cap on the maximum deposit allocated to a single bank.
• Threshold for deposits subject to banks shareholders’ equity.
Counterparty Risk Policy
• The fixed/floating profile of financial debt.
• Proactive management of FX risk with derivative instruments
• Zero FX exposure target.
Interest Rate & Fx
Inventory Hedging Policy:• Operational hedge: Optimum stock policy & forward pricing mechanism.• Financial hedge: Expected inventory exposure for the year end is hedged by using derivatives.• Hedging ratio increasing throughout the year.
Crack Margin Hedging Policy:• Financial hedge: Crack margin (gasoline, diesel, jet fuel, fuel oil) risk mitigation by using derivatives.• Hedge ratio between %0-%50 with up to 1 year hedge tenor
CommodityHedging
Policy
Financials
Hizmete Özel / Confidential
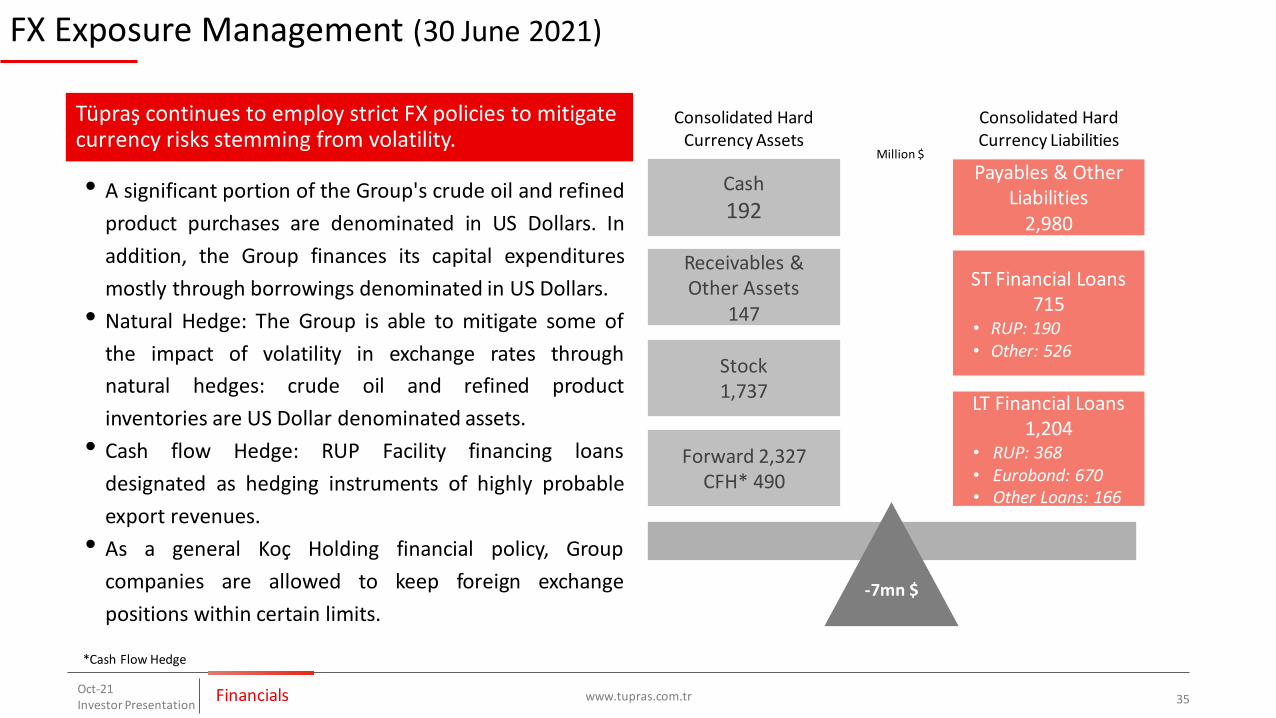
FX Exposure Management (30 June 2021)
www.tupras.com.trOct-21Investor Presentation 35
*Cash Flow Hedge
• A significant portion of the Group's crude oil and refined
product purchases are denominated in US Dollars. In
addition, the Group finances its capital expenditures
mostly through borrowings denominated in US Dollars.
• Natural Hedge: The Group is able to mitigate some of
the impact of volatility in exchange rates through
natural hedges: crude oil and refined product
inventories are US Dollar denominated assets.
• Cash flow Hedge: RUP Facility financing loans
designated as hedging instruments of highly probable
export revenues.
• As a general Koç Holding financial policy, Group
companies are allowed to keep foreign exchange
positions within certain limits.
Tüpraş continues to employ strict FX policies to mitigate currency risks stemming from volatility.
Financials
Cash
192
Forward 2,327CFH* 490
Stock1,737
Receivables & Other Assets
147
Payables & OtherLiabilities
2,980
ST Financial Loans715
• RUP: 190• Other: 526
LT Financial Loans1,204
• RUP: 368• Eurobond: 670• Other Loans: 166
Consolidated Hard Currency Assets
Consolidated Hard Currency Liabilities
Million $
-7mn $
Hizmete Özel / Confidential
Appendix

Hizmete Özel / Confidential
Tüpraş Balance Sheet (Million TL)
www.tupras.com.trOct-21Investor Presentation 37Appendix
30.06.2021 31.12.2020 Diff. Diff. (%)
Current Assets 43,653 30,663 12,990 42
Cash & C. Equivalents 19,365 19,825 -460 -2
Trade Receivables 6,005 1,736 4,269 246
Derivatives 420 380 40 10
Inventories 15,065 7,701 7,364 96
Pre-paid expenses 313 234 80 34
Other Current Assets 2,485 788 1697 215
Long Term Assets 31,386 30,505 881 3
Financial Assets & Subsidiaries 1,320 1,330 -10 -1
Tangible & Intangible Fixed Assets 22,388 22,137 251 1
Derivatives 92 88 4 4
Pre-paid expenses 101 135 -34 -25
Deferred Tax 5,736 5,002 734 15
Other Longterm Assets 1,750 1,813 -63 -3
Total Assets 75,039 61,169 13,870 23
Short Term Liabilities 43,796 28,341 15,455 55
Financial Loans 12,325 8,502 3,823 45
Trade Payables 26,621 14,137 12,484 88
Derivatives 310 763 -453 -59
Provisions 242 142 100 70
Other ST Liabilities 4,299 4,796 -497 -10
Long Term Liabilities 20,190 21,155 -965 -5
Financial Loans 18,308 20,743 -2,435 -12
Payables & Provisions 360 356 3 1
Derivatives 42 45 -4 -8
Other LT Liabilities 13 10 3 27
Total equity attributable to equity holders of the parent 12,282 11,446 836 7
Minority Interests 238 226 12 5
Total Liabilities & Equity 75,039 61,169 13,870 23

Hizmete Özel / Confidential
2021 Refinery Maintenance Schedule
www.tupras.com.trOct-21Investor Presentation 38
(*) This activity started in Q4 2020. Duration figure indicates the portion carried out in 2021
Appendix
Refinery Unit Starting Quarter Duration (weeks) Purpose Status
Batman Crude Oil & Vacuum Q1 7* Seasonal Done
İzmir
Crude Unit Q1 9
Revamp / OpportunityMaintenance
Done
CCR Q1 10 Done
FCC Q1 9 Done
Isomerization Q1 10 Done
Desulphurizer Q1 11 Done
Periodic MaintenanceVacuum Q4 6 Postponed (2022)
Periodic MaintenanceLube Complex Q4 6 Postponed (2022)
İzmit
Desulphurizer Q1 4 Periodic Maintenance Done
FCC Q1 30 Revamp Ongoing
Crude Unit Q4 2 Periodic Maintenance Planned
Kırıkkale

Hizmete Özel / Confidential
Foreign Currency Long Term
Tüpraş B+ (Negative) B2 (Negative)
Turkey BB- (Negative) B2 (Negative) B+ (Stable)
Koç Holding B2 (Negative) BB- (Stable)
Tüpraş - Ratings
www.tupras.com.trOct-21Investor Presentation 39
93.3
99.5
97.2
95.5
95.8
0 25 50 75 100
Board
Stakeholders
Transparency
Shareholders
Overall
Tüpraş BIST Corporate Governance Rating Score
Source: Bloomberg*
Analyst Recommendations
Credit Rating Scores
Source: SAHA Corporate Governance and Rating Services Inc. (October 2020)
65%
35%
0%
Buy
Hold
Sell
*data as of 30 September 2021
Appendix

Hizmete Özel / Confidential
4.1 4.1 4.1 4.23.9
0
1
2
3
4
5
2016 2017 2018 2019 2020
LPG
-0.6%
Turkish Consumption 2016-2020
www.tupras.com.trOct-21Investor Presentation 40
Source: Tüpraş and EMRA* Transit flight consumption included
22.324.2 23.6 22.5 22.7
0
14
28
2016 2017 2018 2019 2020
Diesel
-4.4%+8.3%+0.5%
MillionTons
-2.4%
4.4 4.55.0 5.3
2.4
0
4
8
2016 2017 2018 2019 2020
Jet Fuel*
-54.4%
+10.5%+2.6%
2.2 2.3 2.3 2.4 2.3
0
2
4
2016 2017 2018 2019 2020
Gasoline
-2.5%+3.0%+1.2%+3.1%
+6.5%
+1.6%+0.8% -7.4%
Appendix

Hizmete Özel / Confidential
Competition - STAR Refinery
www.tupras.com.tr 41Oct-21Investor Presentation
• Feasibility studies began in 2010 and construction kicked off in 2011
• Goldman Sachs has acquired a 13% stake in SOCAR Turkey for $1.3 billion.
• Total investment size 6.3 bn USD, with 3.3 bn USD credit agreement.
• Following the completion of construction late 2018, reached full capacity utilization in August 2019
Turkish Market Structure (mn tons)Timeline
Turkey Demand
Tüpraş STAR TotalTurkishMarket
Demand*Balance
LPG 1.1 0.3 1.4 4.2 -2.8
Petchem F. 0.2 2.6 2.8
Gasoline 6.1 6.1 2.4 3.7
Jet Fuel 5.2 1.6 6.8 5.3 1.5
Diesel 10.7 4.8 15.2 22.5 -7.3
Fuel Oil 1.8 1.8 0.3 1.5
Bitumen 3.1 3.1
Pet coke 0.8 0.7 1.5
Total ~30 ~10 ~40
Appendix
Source: EMRA

Hizmete Özel / Confidential
Competition - Regional Competition
www.tupras.com.tr 42Oct-21Investor Presentation
• Tüpraş competes with 71 refineries in the Mediterranean and Black Sea markets.• Mediterranean regional product balance is also affected from Middle East, North West Europe and Asia flows
17 Refineries ~1.8mbd
Mediterranean Black Sea
54 Refineries ~7.8mbd
Appendix

Hizmete Özel / Confidential
Dividend (TL)
www.tupras.com.trOct-21Investor Presentation 43
3.2 2.95.0 5.8 4.8 5.8
10.2
7.2
15.2 14.8
2.1
-10.0
2.5 3.0 3.9 3.91.6
6.5 6.2
13.615.2
0.0 0.0
77%
101%
79%
66%
33%
0%
64%
87%89%
102%
0% 0%
0%
40%
80%
120%
-11
-6
-1
4
9
14
19
2009 2010 2011 2012 2013 2014 2015 2016 2017 2018 2019 2020
EPS DPS Dividend Payout
Appendix

Hizmete Özel / Confidential
Tüpraş Production Flow and Yield Breakdown
www.tupras.com.trOct-21Investor Presentation 44
• Tüpraş has 30 million tons of production capacity
• Tüpraş operates 4 refineries with an integrated system optimization program
Appendix
Key Units# of
UnitsCapacity(m3/d)
CRUDE OIL 8 99,420
VACUUM DIST. 8 42,752
HYDROCRACKER 4 18,032
ISOMERATION 3 7,804
UNIFINER REFORMER
5 16,225
KERO/DIESEL (HDS)
9 37,265
FCC 2 4,650
COKER 1 9000
NAPHTASPLITTER
8
LPG MEROX 6
Flow Diagram
LPG MEROX
NAPHTHASPLITTER
ISOMER.
VACUUMDIST.
UNIFINERREFORMER
KERO/DIESEL (HDS)
FCC
HYDROCRACKER
COKER
Bitumen
Lube Oil
FCCGasolineHDS
BenzenSaturation
Multiple distillation
and production
units
Other, 3.8%
Bitumen & Fuel Oil, 19.9%
Lube Oil, 0.5%
Diesel,
33.9%
Jet Fueloil, 16.5%
GasolineNaphtha,
22.0%
LPG, 3.5%
Jet Fuel /Kerosene
Hizmete Özel / Confidential
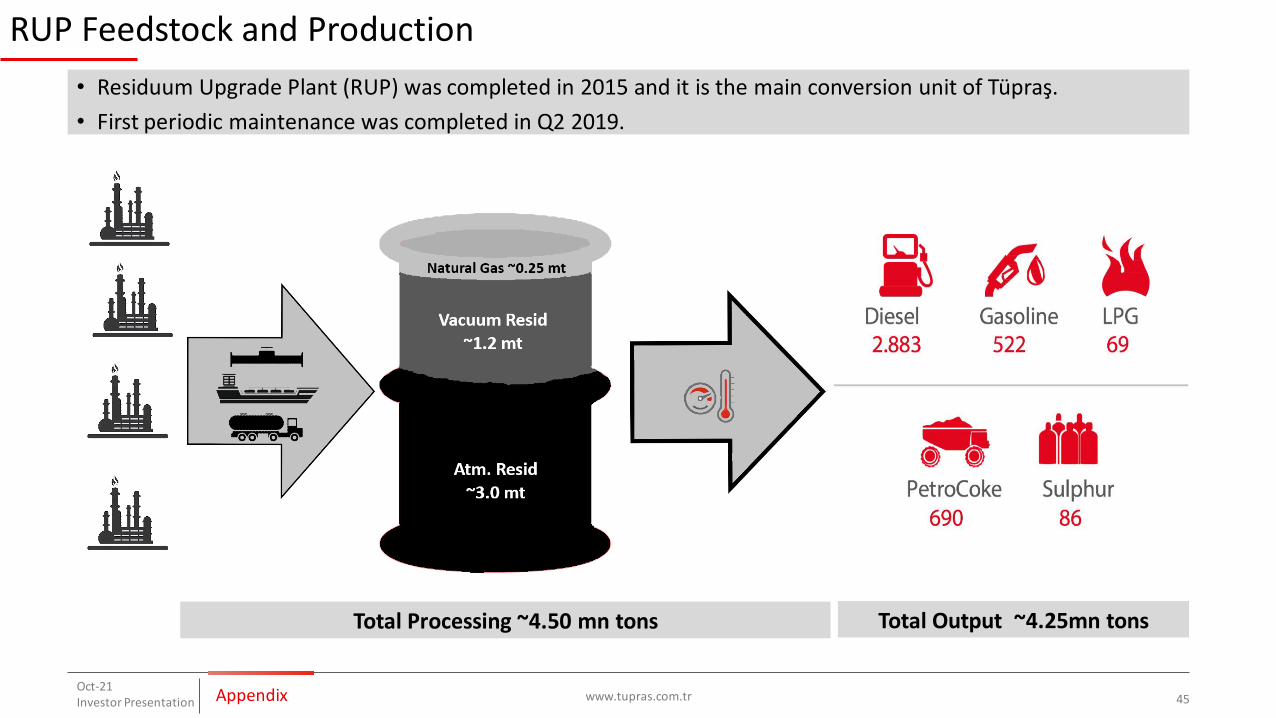
RUP Feedstock and Production
www.tupras.com.trOct-21Investor Presentation 45
• Residuum Upgrade Plant (RUP) was completed in 2015 and it is the main conversion unit of Tüpraş.
• First periodic maintenance was completed in Q2 2019.
Total Output ~4.25mn tonsTotal Processing ~4.50 mn tons
Appendix
Hizmete Özel / Confidential
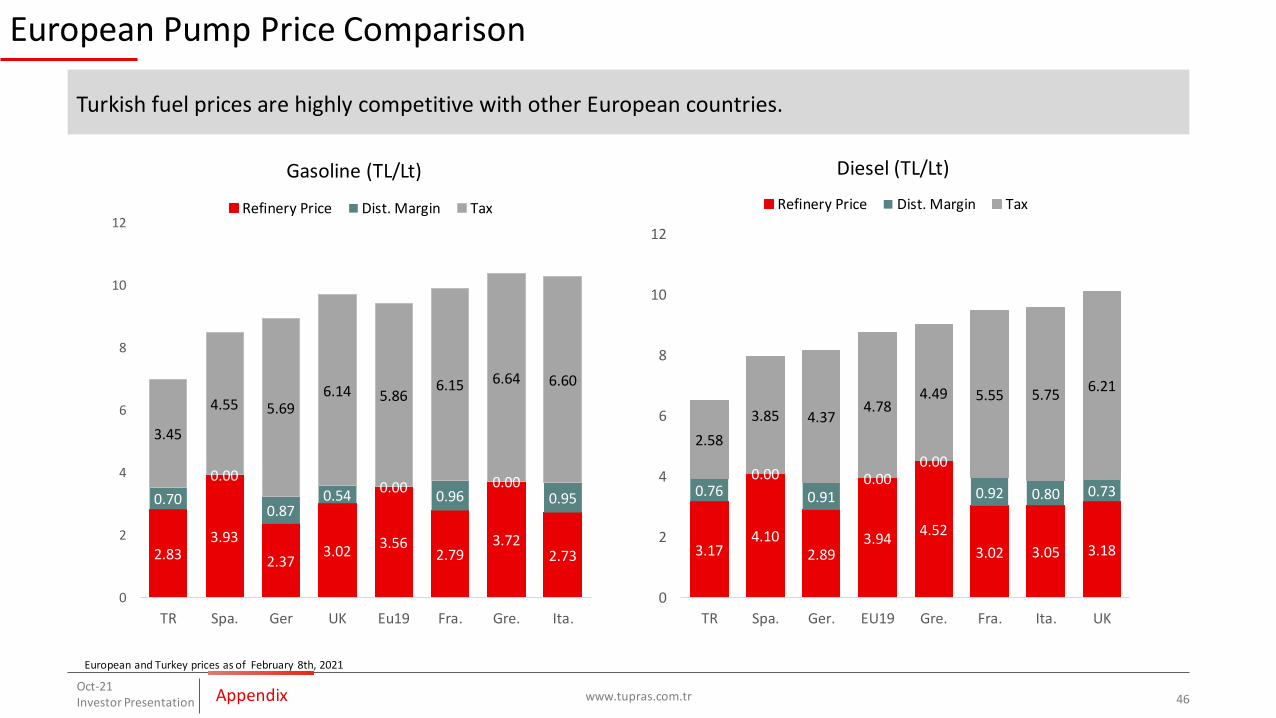
European Pump Price Comparison
www.tupras.com.trOct-21Investor Presentation 46
European and Turkey prices as of February 8th, 2021
Turkish fuel prices are highly competitive with other European countries.
Appendix
2.833.93
2.373.02
3.562.79
3.722.73
0.70
0.00
0.870.54
0.000.96
0.000.95
3.45
4.55 5.696.14 5.86
6.15 6.64 6.60
0
2
4
6
8
10
12
TR Spa. Ger UK Eu19 Fra. Gre. Ita.
Gasoline (TL/Lt)
Refinery Price Dist. Margin Tax
3.174.10
2.893.94
4.52
3.02 3.05 3.18
0.760.00
0.910.00
0.00
0.92 0.80 0.73
2.58
3.85 4.374.78
4.49 5.55 5.756.21
0
2
4
6
8
10
12
TR Spa. Ger. EU19 Gre. Fra. Ita. UK
Diesel (TL/Lt)
Refinery Price Dist. Margin Tax

Hizmete Özel / Confidential
Tüpraş’s Sustainability Efforts Over a Decade of Dedication
www.tupras.com.trOct-21Investor Presentation 47Appendix
Tüpraş kicked off its sustainability
program back in 2008 and
achieved many milestones in a
decade
~500energy efficiency
projects leading to
~35,000 TJ saving and
2.4 mt CO2 reduction
11.5%increase in solid waste recovery
20.7 points drop in Energy
Intensity
45.5% decrease in fresh
water usage
~209 MTL donations and sponsorships
76.5% increase in female
employee numbers
~1.2 mnworkhours dedicated to
OHS training
+1.3 points increase in Corporate
Governance rating
17% female representation in senior and mid-level
management
See our Sustainability Report for details
From our investment decisions to our
working methodology, we placed
sustainability at the forefront of our
operations, as a core management
aspect. Accordingly, we adopted the UN
Sustainable Development Goals (SDGs)
as a significant guidance mechanism
seeking creative solutions to global
challenges.

Hizmete Özel / Confidential
2020 Achievements
www.tupras.com.tr 48
• In the Industrial Energy Efficiency (SENVER) Project Competition, KırıkkaleRefinery won the 2nd place with its "Energy Optimization Studies" project, and İzmit Refinery received the Special Jury Award with its "Hydroprocess Units Operational Energy Optimization" project.
• İzmit Refinery won the WasteManagement Award at the “Sustainable Business Awards”.
• Achieved 63.6% water recycle ratio
• Achieved 58.8% solid waste recovery
Environmental Responsibility
• In the first days of the pandemic, we quickly coordinated with 60 volunteer teachers, using 3D printers in robotic coding classes, 10 thousand visor masks were produced for healthcare workers and delivered to Provincial Health Directorates. This project was deemed worthy of the "Possible Together" award at the TİSK Common Tomorrows Possible Together Competition in December 2020.
Social Support
• 9.58 Corporate Governance Rating
• 18% Female Representation at the Board, 25% representation is targeted in the next five years
• 20% Female Representation in Upper and Mid-Level Management.
Governance Excellence
AppendixOct-21Investor Presentation

Hizmete Özel / Confidential
LPG and Naphtha Cracks
www.tupras.com.trOct-21Investor Presentation 49
$/bbl
-11.4
-17.2-17.7
-19.6
-27.7
-29.2
-21.4
-13.7
-15.7
-21.7
-15.9
1.6
-5.4
-11.2
-18.0
-15.2
-17.9
-11.4
-7.5 -8.1
-13.7
-40
-30
-20
-10
0
10
1 2 3 4 5 6 7 8 9 10 11 12
LPG
5yr range 2021 2020 5 yr ave
-0.3
-2.1
-3.2-4.1 -4.2
-3.6
-1.0
0.3 0.2
-7.9
-6.4
-7.6
-9.3
-6.4
-3.6
-2.0
-3.5
-1.8
0.8
-2.4-2.8
-15
-10
-5
0
5
1 2 3 4 5 6 7 8 9 10 11 12
Naphtha
5yr range 2021 2020 5 yr ave
5 yr between 2016-2020
Appendix
data as of 30 September 2021
Hizmete Özel / Confidential
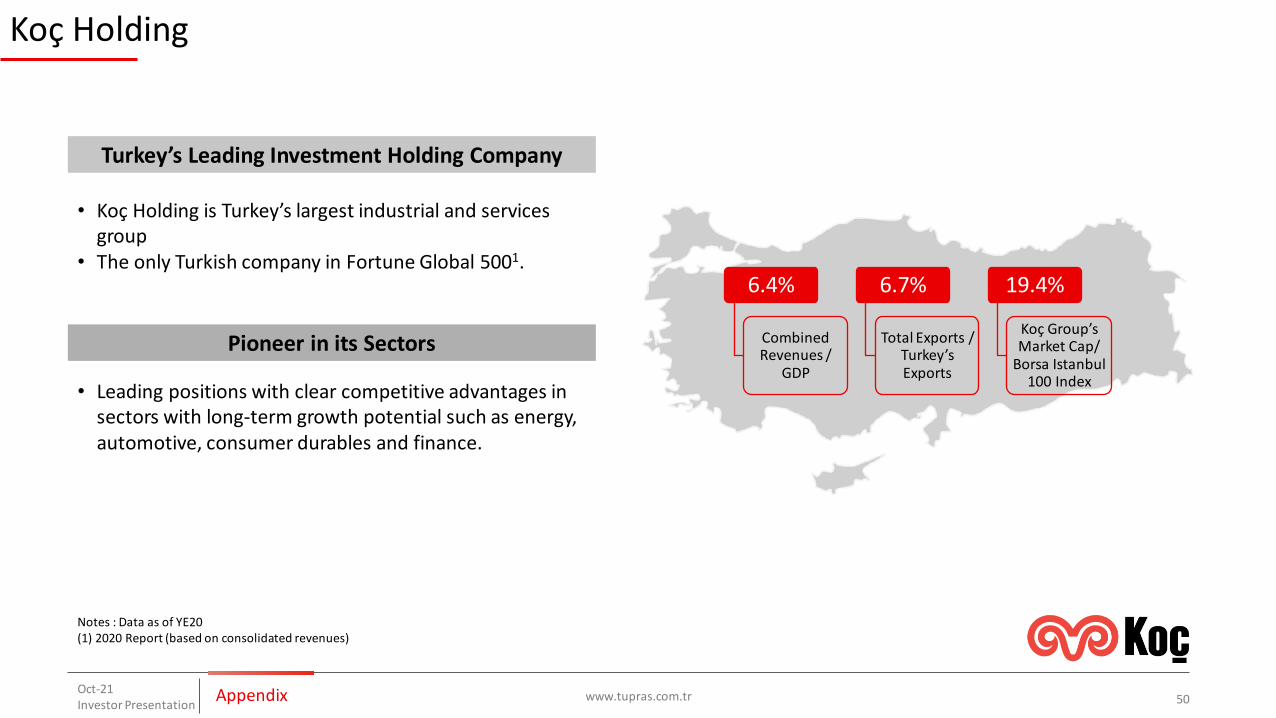
Koç Holding
www.tupras.com.tr 50
• Koç Holding is Turkey’s largest industrial and services group
• The only Turkish company in Fortune Global 5001.
Turkey’s Leading Investment Holding Company
• Leading positions with clear competitive advantages in sectors with long-term growth potential such as energy, automotive, consumer durables and finance.
Pioneer in its Sectors
6.4%
Combined Revenues /
GDP
6.7%
Total Exports / Turkey’s Exports
19.4%
Koç Group’sMarket Cap/
Borsa Istanbul100 Index
Notes : Data as of YE20(1) 2020 Report (based on consolidated revenues)
AppendixOct-21Investor Presentation

Hizmete Özel / Confidential
contact us: [email protected]
Investor Presentation
Latest Webcast
Sustainability Report