Embed Size (px)
Citation preview

Investor Presentation
November 2012

THIS DOCUMENT IS CONFIDENTIAL
This document has been prepared and issued by and is the sole responsibility of Ophir Energy plc (the “Company”) and its subsidiaries for selected recipients. It comprises the written
materials for a presentation to investors and/or industry professionals concerning the Company’s business activities. By attending this presentation and/or accepting a copy of this
document, you agree to be bound by the following conditions and will be taken to have represented, warranted and undertaken that you have agreed to the following conditions. This
presentation is strictly confidential and may not be copied, published, distributed or transmitted. If you do not accept these conditions, you should immediately destroy, delete or return
this document.
The document is being supplied to you solely for your information and for use at the Company’s presentation to investors and/or industry professionals concerning the Company’s
business activities. It is not an offer or invitation to subscribe for or purchase any securities and nothing contained herein shall form the basis of any contract or commitment
whatsoever. This presentation does not constitute or form part of any offer or invitation to sell or issue, or any solicitation of any offer to purchase or subscribe for, any shares in the
Company in any jurisdiction nor shall it or any part of it nor the fact of its distribution form the basis of, or be relied on in connection with, any contract commitment or investment
decision in relation thereto nor does it constitute a recommendation regarding the securities of the Company. This presentation is for informational purposes only and may not be used
for any other purposes.
The distribution of this presentation in jurisdictions other than the United Kingdom may be restricted by law and therefore persons into whose possession this presentation comes
should inform themselves about and observe such restrictions. Any failure to comply with these restrictions may constitute a violation of securities laws of any such jurisdictions.
This presentation and any materials distributed in connection with this presentation may include certain forward-looking statements, beliefs or opinions, including, without limitation,
statements with respect to the Company’s business, financial condition, results of operations, plans, objectives and estimates, including, among others, resource estimates. These
statements, which contain the words “anticipate”, “believe”, “intend”, “estimate”, “expect” and words of similar meaning, reflect the Directors’ beliefs and expectations and involve a
number of risks and uncertainties because they relate to events and depend on circumstances that will occur in the future. No representation is made that any of these statements or
forecasts will come to pass or that any forecast results will be achieved. There are a number of known and unknown risks, uncertainties and other factors that could cause actual
results, performance and developments of the Company or industry results to differ materially from those expressed or implied by such forward looking statements, therefore, undue
reliance should not be placed on forward looking statements. Past performance of the Company cannot be relied on as a guide to future performance. Forward-looking statements
speak only as at the date of this presentation and the Company expressly disclaims any obligations or undertaking to release any update of, or revisions to, any forward-looking
statements in this presentation, whether as a result of new information or future events. No statement in this presentation is intended to be a profit forecast or should be interpreted to
mean that future earnings per share of the Company will necessarily match or exceed its historical published earnings per share. As a result, you are cautioned not to place any undue
reliance on such forward-looking statements.
Certain data in this presentation was obtained from various external data sources, and the Company has not verified such data with independent sources. Accordingly, no
representation or warranty, express or implied, is made and no reliance should be placed, on the fairness, accuracy, correctness, completeness or reliability of that data, and such data
involves risks and uncertainties and is subject to change based on various factors.
No reliance may be placed for any purposes whatsoever on the information contained in this presentation or on its completeness. The Company and its members, directors, officers
and employees are under no obligation to update or keep current information contained in this presentation, to correct any inaccuracies which may become apparent, or to publicly
announce the result of any revision to the statements made herein except where they would be required to do so under applicable law, and any opinions expressed in them are subject
to change without notice, whether as a result of new information or future events. No representation or warranty, express or implied, is given by the Company or any of its subsidiaries
undertakings or affiliates or directors, officers or any other person as to the fairness, accuracy, correctness, completeness or reliability of the information or opinions contained in this
presentation, nor have they independently verified such information, and any reliance you place thereon will be at your sole risk. Without prejudice to the foregoing, no liability
whatsoever (in negligence or otherwise) for any loss howsoever arising, directly or indirectly, from any use of this presentation or its contents or otherwise arising in connection
therewith is accepted by any such person in relation to such information.
Disclaimer
1

Ophir Portfolio Highlights
2012 Exploration Record
Portfolio Progress
• 6 successes from 6 wells since last Capital Markets Day
• Net contingent (2C) resources increased 444% from 220mmboe1 to 1,197mmboe2
• Historical finding cost of $0.87/boe3 since Ophir’s inception • Finding costs over last 12 months are $0.25/boe3
• Tanzania: recent well results and new seismic coverage identifying new, game-changing prospectivity
• Block 1: first basin floor prospect estimated at 19 TCF2 gross recoverable, analysis continuing
• Block 7: 20+ TCF2 gross Mlinzi prospect identified on 2D seismic, to be imaged by new Upanga 3D
• Equatorial Guinea: increased gas resource now targeting full train of LNG
• Simpler fast track development now possible • Results of 2012 wells add support to upside from deeper liquids play
Acceleration of Business Model into 2013
• 2012: 9 seismic programmes ; 8 wells
• 2013: Planning 12-15 wells, targeting net risked prospective resource of 1.0 BBOE2
1. Ophir Energy management estimates as of October 2011 2. Ophir Energy management estimates as of October 2012 3. Ophir Energy calculated value as of October 2012
2

Ophir Business Model: Focussed on near–term ROI
SADR Somaliland
Gabon Pre-salt
Madagascar
Congo Pre-salt
AGC
Equatorial Guinea
3D seismic
1st Discovery
Appraisal
FID
First Production
Normalised Value Chain Progression
Va
lue
Exploration and appraisal:
High-risk high-reward, rapid value accretion in the exploration and appraisal phase
Pre-appraisal monetisation opportunities via farm outs
Commercialisation:
Increased capital
requirements
Pre-development debt
funding
Pre-development
monetisation opportunities
Start-up:
First production: project
de-risked
Conventional RBL debt
funding; cash flow positive
Tanzania Blocks 1,3,4
Tanzania E Pande, Block 7
Kenya
Monetisation opportunities
Monetisation opportunities
Ophir’s primary E&A Focus
Gabon Post Salt & Cretaceous
2013 Drilling Activity
3

Progress Since IPO
-
1,000
2,000
3,000
4,000
IPO Oct 2011 Current
BB
OE
Net Contingent Resource + Prospective Resource
1. RPS Resource Report referenced in Ophir Energy IPO Prospectus July 2011 2. Ophir Energy management estimates as of October 2011 3. Ophir Energy management estimates as of October 2012
-
1,000
2,000
3,000
4,000Net Contingent Resource + Prospective Resource
BB
OE
• 3 new deepwater blocks totalling 12,000 km2
• 9 seismic programs in 2012, over 13,000 km2
• 100% drilling success in 2012 : 6 from 6
• Net 2C resource increase from 220 to 1,197 BBOE3
• Net risked prospective resource increase from 1.7 to 2.5 BBOE3
0%
20%
40%
60%
80%
100%
Acreage Seismic
2011 CMD
2012 CMD
(km2) (km2)
96,941 109,119
19,017
32,398
220
1,197
1,766
2,534
1
Net Resources (BBOE) 2,3
2
+444%
+12%
+70%
+44%
3
2c Contingent Risked Prospective
4

Large African Deepwater Portfolio Acreage totalling >100,000 km2
Gabon • Mbeli - 50% • Ntsina - 50% • Manga - 100% • Gnonda - 100%
Tanzania • Blocks 1,3&4 - 40% • Block 7 - 80% • East Pande – 70%
Kenya • L15 - 90% • L9 - 90%
2
1. Subject to Rocksource and Noble’s withdrawal 2. FAR & Avana’s interests subject to Gov’t approval and entry to the JOA/meeting obligations
SADR • Daora - 50% • Haouza - 50% • Mahbes - 50% • Mijek - 50%
Somaliland • SL12/19 - 75%
AGC • Profond - 79.2%
1
SADR
AGC
Congo
Somaliland Equatorial
Guinea • R - 80%
Block R
Gnondo
Manga
Mbeli
Ntsina
Block 1
Block 3
Block 7
Block 4
East Pande
L-15
L-9
Tanzania
Kenya Gabon
EG
Congo • Marine IX - 48.5%
Madagascar • Marovoay - 80%
5

West Africa
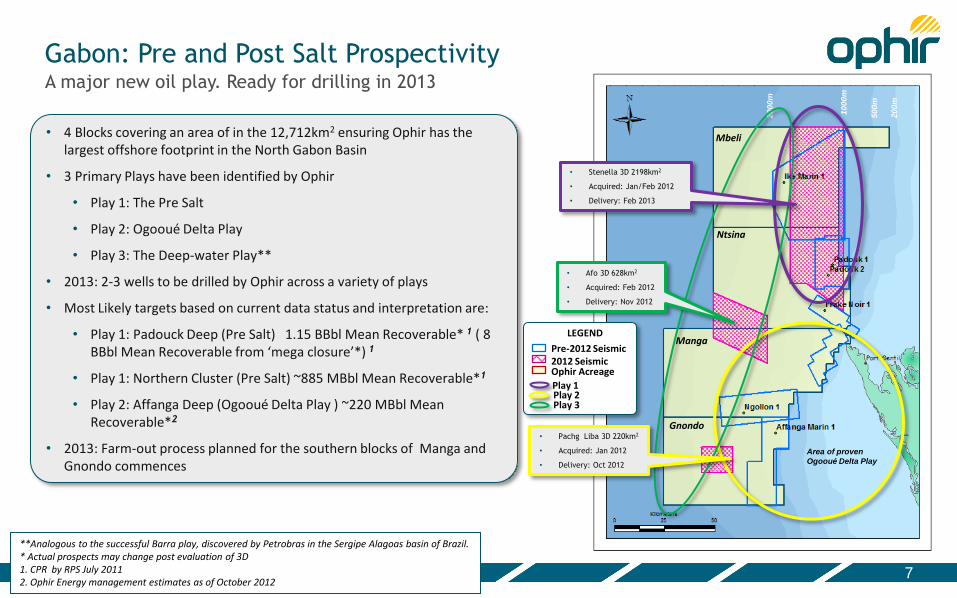
Gabon: Pre and Post Salt Prospectivity
Mbeli
Ntsina
Manga
Gnondo
A major new oil play. Ready for drilling in 2013
50
0m
10
00
m
20
00
m
20
0m
• Stenella 3D 2198km2
• Acquired: Jan/Feb 2012
• Delivery: Feb 2013
• Afo 3D 628km2
• Acquired: Feb 2012
• Delivery: Nov 2012
• Pachg Liba 3D 220km2
• Acquired: Jan 2012
• Delivery: Oct 2012
Area of proven
Ogooué Delta Play
LEGEND
Pre-2012 Seismic 2012 Seismic Ophir Acreage
Play 1 Play 2 Play 3
• 4 Blocks covering an area of in the 12,712km2 ensuring Ophir has the largest offshore footprint in the North Gabon Basin
• 3 Primary Plays have been identified by Ophir
• Play 1: The Pre Salt
• Play 2: Ogooué Delta Play
• Play 3: The Deep-water Play**
• 2013: 2-3 wells to be drilled by Ophir across a variety of plays
• Most Likely targets based on current data status and interpretation are:
• Play 1: Padouck Deep (Pre Salt) 1.15 BBbl Mean Recoverable* 1 ( 8 BBbl Mean Recoverable from ‘mega closure’*) 1
• Play 1: Northern Cluster (Pre Salt) ~885 MBbl Mean Recoverable*1
• Play 2: Affanga Deep (Ogooué Delta Play ) ~220 MBbl Mean Recoverable*2
• 2013: Farm-out process planned for the southern blocks of Manga and Gnondo commences
**Analogous to the successful Barra play, discovered by Petrobras in the Sergipe Alagoas basin of Brazil. * Actual prospects may change post evaluation of 3D 1. CPR by RPS July 2011 2. Ophir Energy management estimates as of October 2012
7

Twinned Basins Successful learnings from Petrobras on the conjugates
Congo Basin
Kwanza Basin
Brazil
Namibe Basin
Walvis Basin
Orange Basin
Luderitz Basin
Gabon Basin
Santos Basin
Espirito Santo Basin
Campos Basin
Sergipe Alagoas Basin
Lula
Whales Park
Barra
Reconcavo Basin
Almada-Camamu Basin
Jequitinhonha Basin
Douala Basin
Niger Delta
Pelotas Basin
Santos Basin
Espirito Santo Basin
Campos Basin
Sergipe Alagoas Basin
Reconcavo Basin
Almada-Camamu Basin
Jequitinhonha Basin
Congo Basin
Kwanza Basin
Namibe Basin
Gabon Basin
Lula
Whales Park
Barra
120 Mya Aptian 95 Mya C-T
LEGEND
Pre Salt Carbonate Reservoirs
Pre Salt Clastic Reservoirs
8

Gabon: Leveraging seismic technology Improved sub-salt imaging; The Stenella 3D
• Pre Salt exploration of the South Atlantic owes its success to advances in both seismic acquisition and processing developed within the sub salt play of the Gulf of Mexico
• In the northern blocks of Mbeli and Ntsina, Ophir with Petrobras have utilised techniques deployed in the Santos Basin for successful illumination of the stratigraphy below the salt
• The Stenella 3D1 is one of the first dual vessel surveys shot in Africa.
There are 2 stages to successful imaging below the salt:
1) Acquisition: The dual vessel method provides ultra long offsets, allowing greater illumination below the salt.
2) Processing: Use of the industry's most advanced depth processing techniques, and close cooperation with Petrobras ensures that a decade of knowledge from Brazil can be extrapolated to Gabon.
Tolo Xline 2103
Stenella Xline 12760
1998
2012
1The Stenella 3D was wholly expensed by Petrobras
9

Gabon, Play 1: Pre Salt Large Pre Salt Structures Confirmed with new Stenella 3D
Two pre-salt mega-closures have been mapped in Mbeli/Ntsina. Each mega-closure has a number of sub-culminations
• RPS has produced volume ranges for the following two models:
• The largest mega-closure filled to spill: ~8 BBbl Mean Recoverable1
• The largest sub-culmination filled to spill: ~1.150 BBbl Mean Recoverable1
• The new 3D will substantially improve our understanding of risk and will deliver drillable prospects in 2013
Mbeli
Ntsina
LEGEND
Pre-Salt Leads
Pre Salt Mega Traps Ophir Acreage
Padouck Mega Structure
Padouck Mega
Structure
~8 BBbl Mean
Recoverable*
A
A’
A A’
Northern Mega
Structure
~2 MBbl Mean
Recoverable*
1. CPR by RPS July 2011
Padouck Mega
Structure
~8 BBbl Mean
Recoverable1
10km Basement
Post Salt
Pre Salt
Salt
10

Equatorial Guinea: Approaching Commercialisation Potential for a single LNG train, added upside potential for deeper liquids
• Seven gas discoveries on-block
• Over 3 TCF1 of 2C contingent resource discovered
• 7 TCF1 of unrisked prospective resource - mix of low risk and high reward
• EGLNG-R likely to be supplied by Block R alone
• Potential to explore for oil at incremental cost
• 5-6 wells planned in 2013
• First gas in 2017/2018
1. Ophir Energy management estimates as of October 2012
Oil Discovery
Gas Discovery Prospect
Legend
2013 drill candidate
11

2012 Campaign Increases Block R 2C Resource to 3TCF
• Successful 2012 three-well drilling programme
• Results from 2012 drilling yet to be integrated into revised POS and volumes
• 2013 drilling to include mixture of exploration and appraisal targets
• Block R development planning underway
1. Ophir Energy management estimates as of October 2012
Bubble size is proportional to net risked resources
Bubble size is proportional to net risked resources
Contingent + Prospective Mean: 5.0 TCF1 P90: 4.1 TCF1 P10: 6.1 TCF1
Contingent Mean: 3 TCF1 Prospect Portfolio
Discoveries
Feedgas Requirement (TCF) LNG Train Output (MTPA)
3.81 3.51
4.31 4.01
4.91 4.51
5.41 5.01
12

Block R Gas in Context
Punta Europa 3.7Mtpa
liquefaction capacity
Zafiro Complex Mature oil production Significant gas flaring
Alba Area Gas and condensate
Production
Blocks O & I New oil
production with associated gas Undeveloped
gas/condensate Block R
13

EGLNG-R: A clearer path to the Asian market Post 2012 drilling programme: Dedicated LNG project from Block R now a viable option
Plan A: EG LNG-R Dedicated new train at Punta Europa
Plan B: EG LNG-2 Shared new train at Punta Europa
• Accelerated onshore development
• Fewer stakeholders = more control of pace by Ophir
• Feasibility study and concept selection studies underway
• More attractive to potential JV partners including LNG developers
• Optional future add-on of gas from other blocks
• Lower costs than greenfield LNG development projects (~65-70% less)
• Multiple stakeholders challenge pace of development
• Construction & initial ownership by Train 1 operator
• Shared feed gas from Block R and other sources
• Pipeline infrastructure controlled by 3G consortium
• MOU agreed with all stakeholders however project remains commercially complex
Plan C: EG FLNG Floating LNG Train
• Block R is ideal for Floating LNG (FLNG) with dry gas & calm seas
• Some technological and implementation hurdles remain
• Ophir assessing options of working with suitable technology partners
• Ophir is commissioning an FLNG study to ensure flexibility
14
0
5
10
15
Qat
arg
as-3
MLN
G T
iga
Tan
ggu
h
ELN
G 1
NW
Sh
elf
Yem
en
Mo
zam
biq
ueA
rea
IM
oza
mbi
que
Are
a IV P
eru
An
go
la
Tan
zan
ia
PN
G
Go
rgon
Pre
lud
e
QC
LNG
Sak
hal
in 2
AP
LNG
GLN
G
Co
st a
t Bo
rder
Po
int (
$/m
mB
tu)
FOB Shipping Regas
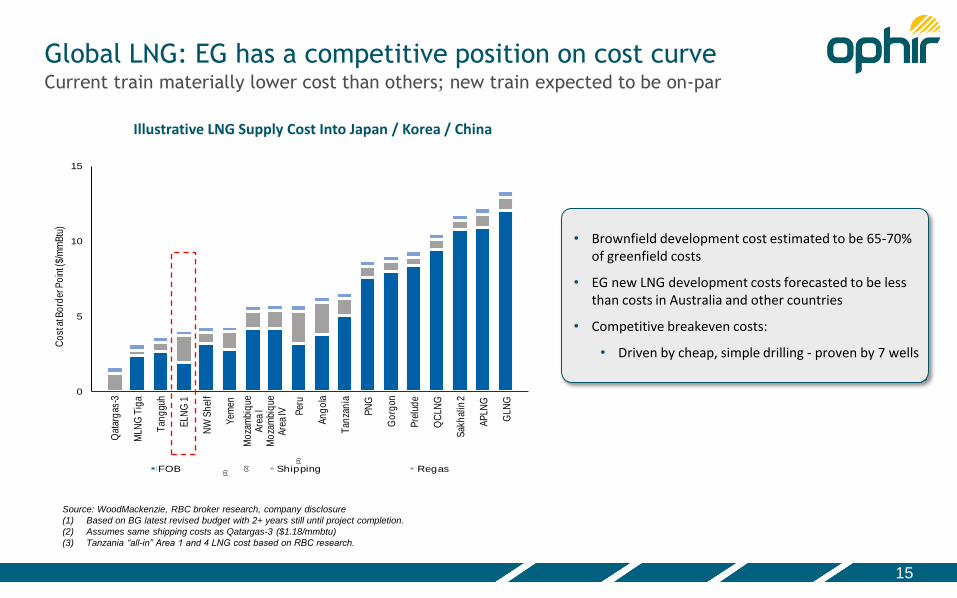
Global LNG: EG has a competitive position on cost curve Current train materially lower cost than others; new train expected to be on-par
Illustrative LNG Supply Cost Into Japan / Korea / China
Source: WoodMackenzie, RBC broker research, company disclosure
(1) Based on BG latest revised budget with 2+ years still until project completion.
(2) Assumes same shipping costs as Qatargas-3 ($1.18/mmbtu)
(3) Tanzania “all-in” Area 1 and 4 LNG cost based on RBC research.
(2) (2
)
(3)
• Brownfield development cost estimated to be 65-70% of greenfield costs
• EG new LNG development costs forecasted to be less than costs in Australia and other countries
• Competitive breakeven costs:
• Driven by cheap, simple drilling - proven by 7 wells
15
East Africa

East Africa: Largest Offshore Acreage Position
An Emerging Resource Play with multi-train LNG Potential
17
Top 20 Net Deepwater Licence Holders, Offshore East Africa
* Tanzania Blocks 9,10,11 and 12 are yet to be awarded to Shell
• To date 25 wells drilled Offshore East Africa, 6 by Ophir
• 84% Success Rate versus Industry Average of 33%
• 22.5-30 TCF discovered in Tanzania and 60 - 97 TCF in Mozambique
• Ophir has approx.15,000 sqkm of 3D seismic with a further 3,700 sqkm planned by the end of 2012
Block 4
Block 3
Block 1 East Pande
Block 7
L15
L9
Anadarko
Anadarko
Anadarko
Anadarko
Anadarko
Anadarko
Statoil Statoil
ENI
Petrobras
Petrobras
Petrobras
Shell
Shell
Shell
Shell
BG Group
BG Group
Apache
LEGEND
Pre-2012 Seismic
2012 Seismic Ophir Acreage
Kenya
Tanzania

Blocks 1,3,&4- 2013 Programme: Building on the successes of 2012 Adding value through high impact drilling combined with appraisal
1. Proved up minimum commercial resources for two-train LNG development
• 13.5 – 21 TCF1 in place resource discovered to date
• Significant additional inventory identified
2. Demonstrated the deeper potential of the Intraslope Channel Play
• Mzia & Papa successful contributing between 4.5 – 11 TCF1 to total discovered in-place resource
3. Demonstrated Block 1 outboard potential for the Mozambique-type basin play
• 2,500 km2 Outboard-Kusini 3D Seismic Survey acquired
• Initial mapping of fast-track volumes identified prospectivity (including a 20+ TCF1 prospect)
1. Complete appraisal and confirm resource underpinning initial LNG trains
• Jodari field appraisal, satellite exploration and DST
• Mzia field appraisal
2. Continue to explore the Mozambique basin floor play
1. Updating on Kusini 3D prospect mapping in 2013 Q1
2. Drilling Lead 1C in mid-2013
3. Acquiring Inboard 3D Seismic programme
1. Ophir Energy management estimates as of October 2012 18
Pre-2012 3D Seismic
2012 3D Seismic
Ophir Acreage
LEGEND
Ophir Acreage
2013 3D Seismic
Gas Discovery
Tertiary Lead/Prospect
Cretaceous Lead/Prospect
Mapping
underway

Recent Well Results: Continued Success >11 TCF1 GIIP discovered in 2012 (1.7 BBOE1), 13.5-21.5 TCF1 GIIP total discovered
Jodari-1
• Play-opening well – Rovuma Lower Tertiary
• LNG anchor-field discovery
• 4.5 TCF (4 to 6 TCF) GIIP1
• Exceptional reservoir characteristics to be confirmed by appraisal
Mzia-1
• Play opening well – Rovuma Upper Cretaceous
• 6 TCF (4 to 9 TCF) GIIP1
• Potential for 3+ TCF to be tested with next appraisal campaign
Papa-1
• Play-opening well – Lukuledi Upper Cretaceous
• 1 TCF (0.5 to 2TCF) GIIP1
• Valuable calibration point to guide future exploration
1. Ophir Energy management estimates as of October 2012 19
BG JV Blocks 1-3-4
Play Type Age Discovered Additional Inventory
Total
GIIP1 GIIP1 GIIP1
Play I: Intraslope Channel Play
Tertiary 9 TCF 29 TCF 38 TCF
Upper Cretaceous
4.5-12 TCF 21 TCF 25.5-33
TCF
Play II: Basin Floor Play
Tertiary -- 22+ TCF
(Miocene only) 22+ TCF

Jodari: Appraisal Campaign Proving the LNG anchor field
Campaign Objectives
• Reduce volume uncertainty – prove the upside
• Confirm reservoir parameters
• Collect gas samples
• Prove LNG development design
• Prove deliverability with a DST in Jodari-1
A three well appraisal campaign
• Jodari South-1 (and side-track)
• Jodari North-1
• Jodari-1 re-entry and DST
• Programme underway
N S
Tertiary
Cretaceous
Jodari-1
Discovery
K350
Jodari-S
Appraisal
Jodari-N
Exploration
North Main
South K490
Jodari-1 Re-entry
& DST
3.5TCF 1TCF
Gas Sand
Sand
Source: BG
Source: BG Group
20

Block 1: Outboard Targets interpreted on 3D Seismic
• Kusini Outboard 2,500 km2 3D Survey acquired in Q2 2012
• Basin floor fans interpreted in Block 1 on high-quality preliminary 3D seismic
• Initial interpretation of preliminary dataset indicates trapping geometries within very large sand-prone bodies
• Fully processed dataset expected back in Q1 2013 will allow interpretation of deeper (older) formations and investigation for hydrocarbon indicators
Mozambique
Tanzania
LEGEND
Pre-2012 Seismic 2012 Seismic Ophir Acreage
Block 1
Fugro’s MV Geo Coral Vessel
20+TCF target identified by initial mapping of 3D
Prosperidade/Mamba Complex
Linguado Prospect
Atum & Golfinho Complex
New Ophir-BG 3D Seismic Survey
Coral Gas Field
21

Arbitrary Line
Miocene
Paleocene to Oligocene
Miocene Channel
Miocene Channel + Fan Complex
Miocene Channel and Fan Complex
Stacked Potential
A
B
A B
22

Ophir Operated Tanzania Licences Overview
East Pande: (Ophir 70%, RAKGas 30%)
Block 7: (Ophir 80%, Mubadala 20%)
• Ca. 80km East of Dar Es Salam
• Covers an area of 8,475km2
• Water depths: 200m – 3,000m
• Multiple play types at several stratigraphic intervals
• 21.5 TCF/12.1 BBBL gross mean in place resource identified (unrisked)1
• Mlinzi Prospect = 20+ TCF
• Ca. 55km North West of Mtwara (Port facilities) in the Mandawa Sub-Basin
• Water depths: 0m – 2,100m
• Covers an area of 7,500km
• Multiple play types
• 15 TCF/2566 MMBBL gross mean in place resource identified (unrisked)1
East Pande
Block 7
Tanzania
23
Pre-2012 Seismic
2012 Seismic Ophir Acreage
LEGEND
Ophir Acreage
1. Ophir Energy management estimates as of October 2012

Kenya: Enviable footprint in a rapidly emerging play The industry migrates north in 2012/2013
LEGEND
Other Operators 2012 Seismic
Ophir 2012 Seismic Ophir Acreage
L15
L9
Kenya
0 30 60Kilometers
L-22 - Total Recent licence
L21/L23/L24 - ENI Recent licence
L27/L28 - Camac Recent licence
L25/L26 - Statoil Licence negotiations L7/ L11A/L11B Anadarko
3D Seismic
L10A/L10B - BG 2D Seismic 2011
3D Seismic 2011/12
L6 – Far 3D Seismic 2012
L8 – Apache 3D Seismic 2012 Well: Mbawa-1
Tanzania
Somalia
L21
L23
L24
L25 L26
L27
L28
L5
L7
L10B L11B
L8
L6
L11A
L12
L22
• Aggressive acreage acquisition: The majors compete for ‘Land Grabs’ as the Kenyan Government announces the opening of new deep-water acreage
• 9 3D Seismic Surveys acquired in the offshore Lamu in the last 18mths
• 1st offshore Discovery in Mbawa-1
• 3 operators plan to drill in 2013: Ophir, BG and Anadarko
Mbawa 1
24
Tundaua oil seep
Kofia-1: Oil Shows
Maridaadi 1 Oil Inclusions

Kenya: Unlocking potential through aggressive data acquisition 2 Basins, 2 Blocks, 2 3D Surveys in 2012
LEGEND
2012 Seismic Ophir Acreage
L15: 2331km2
L9: 5111km2
Kenya
L15-Ndoto 3D Survey 832km2
L8/L9– Nanna 3D Survey 560km2
L9– Nala Survey 1536km2
• 2 3D seismic surveys acquired between September- November 2012.
• Block L-15 Ndoto 3D Survey, designed to target 2 Plays:
• 1) The Western Edge of the Lamu Toe Thrust • 2) Tertiary and Cretaceous Fault Blocks of the Davy Walu
High
• Block L-9: Nala 3D Survey, designed to test 3 targets:
• 1) The southern extent of the Mbawa Inversion zone • 2) Mbawa West , en-echelon anticline play • 3) The Simba Graben, onlap play
• Both surveys have been designed to test a variety of new and
emerging plays offshore Kenya
25

East African Gas: Beyond expectations An untapped resource with potential to capture Global LNG markets
Mozambique North LNG: • 60-100 TCF in place • Anadarko, ENI
Tanzania South LNG: • 20-30 TCF in place • Ophir, BG, Statoil, Exxon
Tanzania North LNG: • Significant resource potential • Ophir, Petrobras, Shell
Kenya LNG: • Mbawa proof of concept • Ophir, Anadarko, Apache,
Eni, Total
Global LNG: A Dynamic Market
• East Africa well located to supply new & growing markets in India and Asia
• Uncontracted demand forecast suggests that there is scope for multiple East African LNG developments
• East African LNG predicted to have a price advantage vs US, CDN and Australian greenfield projects
• Tanzanian government motivated to fast-track initial multi-train LNG development
• Ophir-BG Group JV already has LNG commercial framework in place
• Potential for two hubs in Tanzania:
• North (Block 7 located offshore Dar es Salaam) • South (Blocks 1-4 located offshore Mtwara)
Domestic Options for Offshore Gas
• Gas exports will provide revenue for domestic development creating a new market longer term: Industry, Petrochemicals and Power Generation
• Opportunity for pipeline export to neighbouring states to support heavy oil production
LEGEND
Prospective LNG Hub
Ophir Acreage
Licensed Acreage
26

Tanzania: Commercialising Gas
27
Upstream Mid-stream (pipelines)
Mid-stream (liquefaction)
Marketing
Control and stakeholder alignment along value chain
• Innovative early commercial agreements: provide control and accelerate development
• Farm out and collaboration with best-in-class LNG operator
• Commercial certainty and bankability will attract mid-stream partners and gas customers
• BG Operator (60%)
• Ophir Energy (40%)
• LNG export either with BG or independently
• DMO for 5% after threshold volume at equivalent pricing
~13.5 - 21 TCF in place* discovered to date in Ophir-BG JV acreage
• Monetisation opportunities: Future partner to provide mid-stream capital
• Debt funding
First Gas Targeted by 2020
*Based on internal Ophir Energy estimates as of September 2012
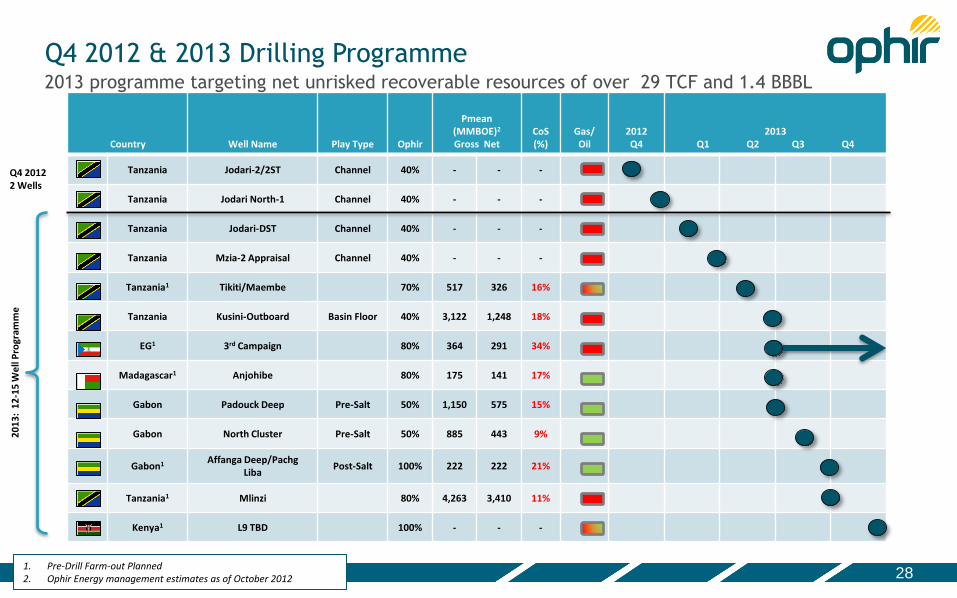
Q4 2012 & 2013 Drilling Programme
1. Pre-Drill Farm-out Planned 2. Ophir Energy management estimates as of October 2012
Country Well Name Play Type Ophir
Pmean (MMBOE)2
Gross Net CoS (%)
Gas/ Oil
2012 Q4
2013 Q1 Q2 Q3 Q4
Tanzania Jodari-2/2ST Channel 40% - - -
Tanzania Jodari North-1 Channel 40% - - -
Tanzania Jodari-DST Channel 40% - - -
Tanzania Mzia-2 Appraisal Channel 40% - - -
Tanzania1 Tikiti/Maembe 70% 517 326 16%
Tanzania Kusini-Outboard Basin Floor 40% 3,122 1,248 18%
EG1 3rd Campaign 80% 364 291 34%
Madagascar1 Anjohibe 80% 175 141 17%
Gabon Padouck Deep Pre-Salt 50% 1,150 575 15%
Gabon North Cluster Pre-Salt 50% 885 443 9%
Gabon1 Affanga Deep/Pachg Liba
Post-Salt 100% 222 222 21%
Tanzania1 Mlinzi 80% 4,263 3,410 11%
Kenya1 L9 TBD 100% - - -
2013 programme targeting net unrisked recoverable resources of over 29 TCF and 1.4 BBBL
Q4 2012 2 Wells
20
13
: 1
2-1
5 W
ell
Pro
gram
me
28