Embed Size (px)
Citation preview

INVESTOR PRESENTATION June 2018
2
Disclaimer
Please note that FAB pro forma consolidated financials at 31 March 2018 serve as the main basis of reference for our
Management Discussion & Analysis Report (MDA) and Investor Relations presentation.
Comparative figures have been reclassified where appropriate to conform to the presentation and accounting policies
adopted in the pro forma condensed consolidated interim financial statements.
FAB’s interim reviewed consolidated financial statements as at 31 March 2018 are prepared on the basis that FGB/NBAD merger was
declared effective on 1st April 2017 with FGB being the accounting acquirer as per IFRS 3. Therefore, these financials reflect
consolidation of NBAD since 1st April 2017 only, while prior period comparative financial information relates to FGB.
For further information, please refer to the Business Combination note of the reviewed consolidated interim financial statements.
The information contained herein has been prepared by First Abu Dhabi Bank P.J.S.C (“FAB”). FAB relies on information obtained from
sources believed to be reliable but does not guarantee its accuracy or completeness.
This presentation has been prepared for information purposes only and is not and does not form part of any offer for sale or solicitation
of any offer to subscribe for or purchase or sell any securities nor shall it or any part of it form the basis of or be relied on in connection
with any contract or commitment whatsoever.
Some of the information in this presentation may contain projections or other forward-looking statements regarding future events or the
future financial performance of FAB. These forward-looking statements include all matters that are not historical facts. The inclusion of
such forward-looking information shall not be regarded as a representation by FAB or any other person that the objectives or plans of
FAB will be achieved. FAB undertakes no obligation to publicly update or publicly revise any forward-looking statement, whether as a
result of new information, future events or otherwise.
Note: Rounding differences may appear throughout the presentation

3
Introducing FAB
The merger of two successful banks has
created a new entity with the financial
strength, expanded expertise and
global network to drive growth in the
UAE’s economy and the Middle East,
while also opening up international
growth opportunities to become the
financial powerhouse of the region.
This is
our story

4
FAB at a glance
Credit ratings
19 Countries presence
(ex UAE)
89 Branches/ Cash offices
in UAE
584 ATMs/CDMs
• FAB is the result of the historic merger between two
iconic Abu Dhabi based franchises (FGB and NBAD)
• Largest UAE bank and 2nd largest in MENA by total
assets (AED 678 Bn) and market capitalisation
(AED 128 Bn)
• Offers extensive range of products and services via
market-leading Corporate and Investment Banking
(CIB), Personal Banking (PB) franchises and
subsidiaries
• Domestic network: 89 branches and 584 ATMs/CDMs
across all 7 emirates
• Global presence: 19 countries (excluding UAE)
Overview
• Affirmation of credit ratings by Moody’s, S&P, and Fitch
post merger completion on 3rd April 2017 was a
powerful testament to the strong rationale for the
merger as it enhanced the combined bank’s business
position and credit profile
• FAB has the strongest combined credit ratings of any
bank in MENA at Aa3/AA-/ AA-1
All figures as on 31 March 2018
1 - Moody’s/S&P/Fitch
Europe &
Americas (E&A)
LT Aa3 AA- AA-
ST P-1 A-1+ F1+
Outlook Stable Stable Stable
France
UK
Switzerland
USA
Brazil
Asia Pacific
(APAC)
China/Hong Kong
India
Malaysia
Singapore
South Korea
Middle East &
Africa (MEA)
UAE
Bahrain
Egypt
Jordan
Kuwait
Lebanon
Libya
Oman
Qatar
Sudan

5
FAB Share Profile
• Listed on Abu Dhabi Securities Exchange (ADX)
• Symbol: FAB
• Number of shares issued: 10,898 million1
• Market cap2: AED 128 Bn (USD 34.7 Bn)
• Foreign Ownership Limit: 25%
1 - Includes 38 Mn Treasury shares
2 - As of 31 March 2018
3 - Ownership structure as of 31 March 2018, based on shares outstanding (net of treasury shares)
4 - A law was issued by the President of UAE and Ruler of Abu Dhabi, on 21 Mar 2018, merging ADIC under the umbrella of Mubadala Investment Company
Abu Dhabi Securities Market Index ADSMI 38.6%
Bloomberg GCC 200 financial Index BGCCFINL 4.5%
Bloomberg EMEA Banks Index BEUBANK 2.0%
Index Weightings2
Strong shareholding structure3
Overview
ADIC 33.5%
Mubadala 3.7%
Other UAE companies and
individuals 51.9%
GCC (ex-UAE) 1.3%
Foreign (ex-GCC) 9.6%
4 4
6
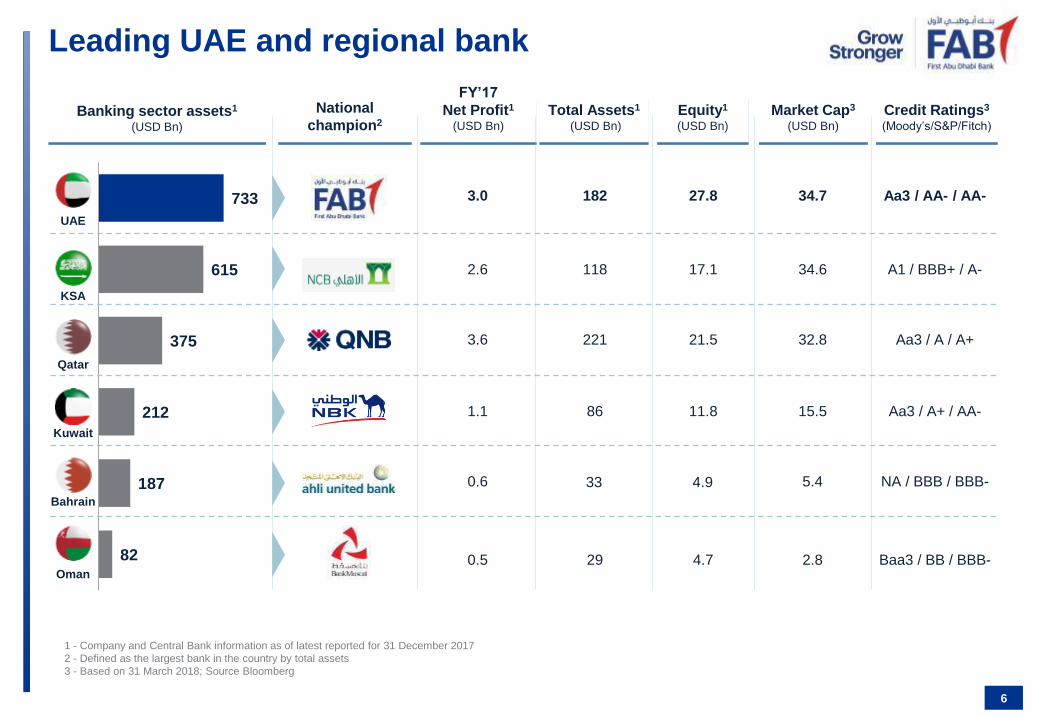
Leading UAE and regional bank
1 - Company and Central Bank information as of latest reported for 31 December 2017
2 - Defined as the largest bank in the country by total assets
3 - Based on 31 March 2018; Source Bloomberg
733
615
375
212
187
82
UAE
Qatar
KSA
Kuwait
Oman
Bahrain
Banking sector assets1 (USD Bn)
National
champion2
3.0
2.6
3.6
1.1
0.6
0.5
FY’17
Net Profit1 (USD Bn)
182
118
221
86
29
27.8
17.1
21.5
11.8
4.7
Total Assets1
(USD Bn)
Equity1 (USD Bn)
Market Cap3 (USD Bn)
34.7
34.6
32.8
15.5
5.4
2.8
Credit Ratings3 (Moody’s/S&P/Fitch)
Aa3 / AA- / AA-
A1 / BBB+ / A-
Aa3 / A / A+
Aa3 / A+ / AA-
NA / BBB / BBB-
Baa3 / BB / BBB-
33 4.9

7
Prominent Board and robust governance
H.H. Sheikh Tahnoon Bin Zayed Al Nahyan – Chairman National Security Advisor Chairman of Royal Group
H.E. Khaldoon Khalifa Al Mubarak
Board Member
CEO and MD of Mubadala Investment Company
Chairman of the Executive Affairs Authority of the Government of
Abu Dhabi
H.E. Sheikh Mohammed Bin
Saif Bin Mohammed Al
Nahyan
Board Member
Chairman of Abu Dhabi National
Insurance Company (ADNIC)
Chairman of
Risk Management Committee of
ADNIC
H.E. Sheikh Ahmed
Mohammed Sultan Al Dhaheri
Board Member
Chairman of Bin
Suroor Engineering
Vice Chairman of Abu Dhabi
National Hotels Company
H.E. Mohammed Thani Al-Romaithi
Board Member
Chairman of the Federation of
UAE Chambers of Commerce and Industry
Board Member of Al Etihad Credit
Bureau
H.E. Mohamed Saif Al Suwaidi
Board Member
Director General of Abu Dhabi
Fund for Development
Board Member of DP world and
Agthia
H.E. Nasser Ahmed
Alsowaidi
Vice Chairman of the Board
Chairman of
ETECH
H.E. Jassim Mohammed Al
Siddiqi
Board Member
CEO and MD of Abu Dhabi
Financial Group (ADFG)
Chairman of Shuaa and
Eshraq Properties
H.E. Khalifa Sultan Al Suwaidi
Board Member
Executive Director at the
Abu Dhabi Investment
Council (ADIC)
Board Member of UNB, ADIC and Barakah
One
Remuneration & Nomination
Committee Risk Committee Audit Committee
Board Management
Committee
Board of Directors
4 Board Committees
8
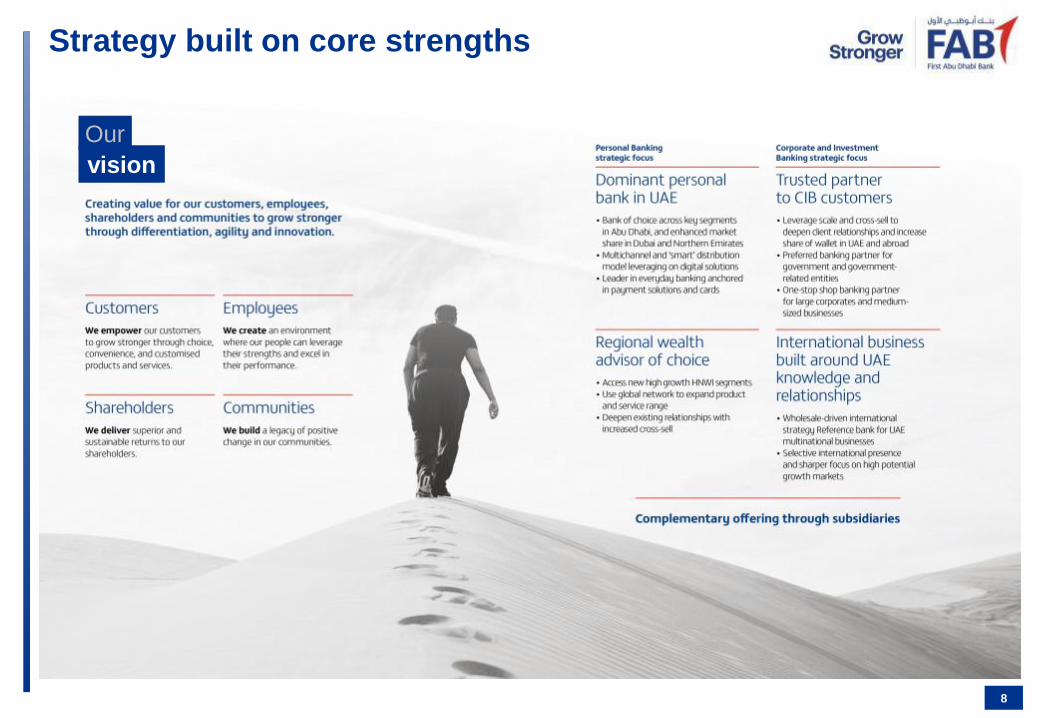
Strategy built on core strengths
Our
vision

9
Business Segments
Covers corporate and
institutional clients through
dedicated client segments
Offers Credit facilities, Global
Transaction Services,
Corporate Finance, Islamic
Finance and Global Markets
products to both UAE and
international clients
Targets retail, affluent, private
banking and SME customer
segments
Product offerings range from
day-to-day banking products
such as current accounts,
deposits, credit cards and loans
to more sophisticated
investment solutions and
business banking products and
services
Wide range of diverse
distribution and sales channels,
including mobile and internet
banking, branches and direct
sales agents
Manages National Housing
Loan program for Abu Dhabi
government
Complementary offerings
provided across real estate and
property management,
brokerage and Islamic finance
Centralised enablement
functions: HR, operations,
finance, strategy, investor
relations, risk management,
credit management, corporate
communications, legal &
compliance, internal audit,
procurement, treasury
operations, integration
management office and
administrative support
CORPORATE &
INVESTMENT BANKING PERSONAL BANKING SUBSIDIARIES HEAD OFFICE
51% 37% 3% 9%
Segment
Coverage and
offering
% Q1’18
Group
revenue

Key financials at a glance Balance sheet & Income Statement - Based on Pro forma Financial Information
TOTAL ASSETS (AED Bn) LOANS & ADVANCES (AED Bn) CUSTOMER DEPOSITS (AED Bn)
TANGIBLE EQUITY (AED Bn) OPERATING INCOME (AED Mn) NET PROFIT (AED Mn)
10
345.2 321.3 328.3 330.5 338.2
Mar'17 Jun'17 Sep'17 Dec'17 Mar'18
393.9 377.3 378.9 395.8 404.0
Mar'17 Jun'17 Sep'17 Dec'17 Mar'18
68.0 70.7 73.3 71.1 63.1
Mar'17 Jun'17 Sep'17 Dec'17 Mar'18
5,188 4,686 4,611
5,049 4,871
Q1'17 Q2'17 Q3'17 Q4'17 Q1'18
2,926
2,562 2,605 2,822
2,998
Q1'17 Q2'17 Q3'17 Q4'17 Q1'18
660.4 624.6 644.1 669.0 677.8
Mar'17 Jun'17 Sep'17 Dec'17 Mar'18

Key financials at a glance Ratios - Based on Pro forma Financial Information
NIM – YTD (%) NPL RATIO1 (%) PROVISION COVERAGE1 (%) COST TO INCOME RATIO-YTD (%) (EX-INTEGRATION COSTS)
ROTE (%) RORWA (%) NON-INT INC / REVENUES (%) CET1 & CAR2 (%)
11
2.45 2.47 2.50 2.48 2.49
Q1'17 H1'17 9M'17 FY'17 Q1'18
2.6 3.2 3.0 3.1 3.1
Mar'17 Jun'17 Sep'17 Dec'17 Mar'18
122 112 109 120 127
Mar'17 Jun'17 Sep'17 Dec'17 Mar'18
27.2 27.5 27.6 27.7 25.8
Q1'17 H1'17 9M'17 FY'17 Q1'18
37 31 30
33 33
Q1'17 Q2'17 Q3'17 Q4'17 Q1'18
13.9 14.7 14.9 14.5 12.4
17.2 18.2 18.4 17.8 15.6
Mar'17 Jun'17 Sep'17 Dec'17 Mar'18
CET1 CAR
16.1 14.7 14.2 14.6
17.2
Q1'17 H1'17 9M'17 FY'17 Q1'18
2.4 2.3 2.2 2.3 2.4
Q1'17 H1'17 9M'17 FY'17 Q1'18
1 Q1’18 ratios are based on IFRS9 accounting; ratios for prior periods are based on IAS39 accounting
2 CET1 ratio as per UAE CB’s Basel III framework (without considering the transitional arrangements for 2017); ratios prior to Dec’17 are based on Basel II framework

12
Integration progress has exceeded expectations All planned milestones successfully delivered in 2017
2017 2018 Q1 2019
Finalisation of organisational structure and operating model
Harmonisation of Group policies and risk framework
CIB product and pricing harmonisation completed
Subsidiaries: Integration of real estate and property
management businesses completed, integration of islamic
finance subsidiaries on track; brokerage business
rebranded (FAB Securities)
Network optimisation
UAE network and channel external re-brand completed; in
progress across international locations
“Purchase Price Allocation” exercise is substantially
complete
o IT system integration on track; to be completed by the end of
2018 (adequate planning, resourcing and tight risk
management)
o PBG product and pricing harmonisation
o Strategic review/ implementation of international value
proposition
o Ongoing network optimisation (UAE + international)
o Further process refinements/simplification and automation
Culture and change management

NBAD 3,002
NBAD 3,459
NBAD 3,696
NBAD 4,083
NBAD 3,897
FGB 1,446
FGB 1,766
FGB 1,856
FGB 1,947 FGB
1,848
FAB
4,448
5,225
5,552
6,030 5,745
5,274
27.9% 29.3%
28.6% 30.2%
28.3% CI ratio 27.0%
2012 2013 2014 2015 2016 2017
-5%
13
Integration progress has exceeded expectations Merger benefits evident since 2016
G&A expenses BAU1
Cost reduction
= AED 756Mn
In AED Mn
1 Excluding integration/ merger transaction-related costs and amortisation of intangibles (merger-related)
-8%
1

14
Integration progress has exceeded expectations Synergy financials1
Run-rate cost synergy target increased
Integration costs on track
• Synergies significantly ahead of target in 2017
• IT system integration by the end of 2018 to
unlock substantial merger benefits in addition to
other initiatives (incl. process simplification,
automation, and network optimisation - UAE and
international)
• 2020 full annual run-rate raised by 50% to
AED ~1.5Bn
~250Mn ~500Mn
~1Bn
~1.5Bn
2017 guidance 2017 actual 2020 initial target 2020 revisedtarget
385Mn 463Mn
330Mn 307Mn
2017 guidance 2017 actual 2018 est 2019 est
Initial phasing
Revised phasing
• Higher integration costs vs 2017 guidance reflect
acceleration of integration plan; estimated
phasing revised accordingly
• On track with one-time integration cost target of
AED 1.1Bn, to be fully absorbed by 2019
2017 2018 2019
35% 35% 30%
42% 30% 28%
Initial phasing
Revised phasing
2017 2018 2019 2020
25% 65% 85% 100%
33% 55% 85% 100%
In AED
In AED
1.1Bn
1 Revised estimates and phasing as communicated post FY’17 results in Jan’18

15
Laying the right foundation for long term
sustainable growth
1 Growth-oriented culture Increased market share and share of wallet
2 Successful execution of
integration plan Full realisation of run rate synergies
3 One Bank, One brand,
One team Infrastructure integration
People integration
4 Sustainable cost
leadership ~25% Cost-to-Income ratio
5 Strong internal capital
generation capacity 16-17% RoTE1
>13.5% min. CET1
How we will measure our success by 2020

2nd largest economy in GCC USD 412 Bn 2018f Nominal GDP3
6th largest oil reserves ~95 Bn boe1
On path to strong recovery
Diversified and competitive
economy
16
UAE Economic Overview
Economic Structure
and Performance3 2017e 2018f 2019f
Real GDP Growth (% change) 0.5 2.0 3.0
Nominal GDP (USD Bn) 377 412 428
Inflation (CPI, % change) 2.0 4.2 2.5
General govt revenue (% GDP) 30.3 29.6 29.2
General govt expenditure (% GDP) 32.1 31.0 30.0
Fiscal balance (% GDP) (1.8) (1.4) (0.8)
Gross Debt (% GDP) 19.5 19.0 19.3
Diversified Economy2
1 - OPEC; boe (barrel of oil equivalent) (December 2016) 2 - Federal Competitiveness and Statistics Authority, 2016 Nominal GDP
3 - IMF World Economic Outlook, April 2018 4 - WAM
5 - Others include Agriculture, Utilities, Transportation, Communication, Government and Other activities
Construction and Real Estate
17%
Mining and quarrying
17%
Manufacturing 10%
Trade, Restaurants &
Hotels 15%
Finance 10%
Others5 31%
748
412
184
135
83
38
Saudi Arabia
UAE
Qatar
Kuwait
Oman
Bahrain
2018f Nominal GDP3 (USD Bn)
UAE federation established in 1971
Comprising 7 Emirates
Estimated population3 (2016): 9.9 Mn
UAE
83%
non-oil sector contribution
to nominal GDP2
17th
most competitive
economy (WEF 2017/2018)
Real GDP Growth3
0.5% 2.0% 2017e 2018f
Increase in 2018
Federal Budget4
+5.6%
55.1
45.0
50.0
55.0
60.0
Apr-17 Jun-17 Aug-17 Oct-17 Dec-17 Feb-18 Apr-18
-0.5
0.0
0.5
1.0
1.5
2.0
2.5
0.0
0.5
1.0
1.5
2.0
2.5
Jan-17 Apr-17 Jul-17 Oct-17 Jan-18 Apr-18
LIBOR 3M EIBOR 3M E-L Spread (RHS)
17
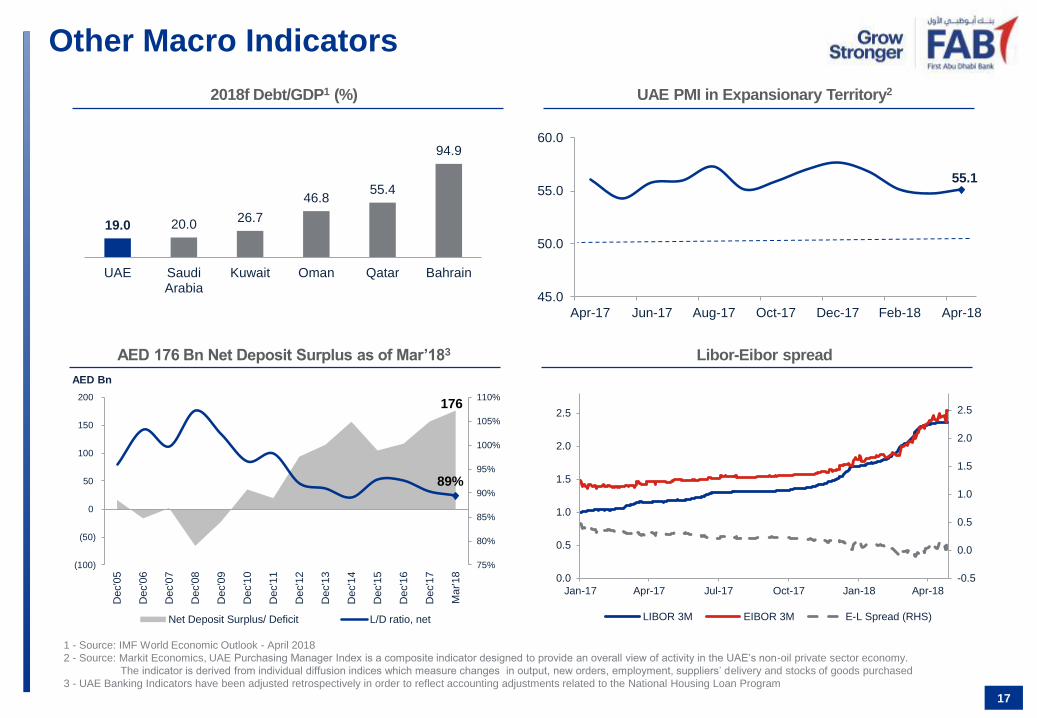
Other Macro Indicators
2018f Debt/GDP1 (%) UAE PMI in Expansionary Territory2
AED 176 Bn Net Deposit Surplus as of Mar’183 Libor-Eibor spread
1 - Source: IMF World Economic Outlook - April 2018
2 - Source: Markit Economics, UAE Purchasing Manager Index is a composite indicator designed to provide an overall view of activity in the UAE’s non-oil private sector economy.
The indicator is derived from individual diffusion indices which measure changes in output, new orders, employment, suppliers’ delivery and stocks of goods purchased
3 - UAE Banking Indicators have been adjusted retrospectively in order to reflect accounting adjustments related to the National Housing Loan Program
19.0 20.0 26.7
46.8 55.4
94.9
UAE SaudiArabia
Kuwait Oman Qatar Bahrain
176
89%
75%
80%
85%
90%
95%
100%
105%
110%
(100)
(50)
0
50
100
150
200
Dec'0
5
Dec'0
6
Dec'0
7
Dec'0
8
Dec'0
9
Dec'1
0
Dec'1
1
Dec'1
2
Dec'1
3
Dec'1
4
Dec'1
5
Dec'1
6
Dec'1
7
Ma
r'18
AED Bn
Net Deposit Surplus/ Deficit L/D ratio, net
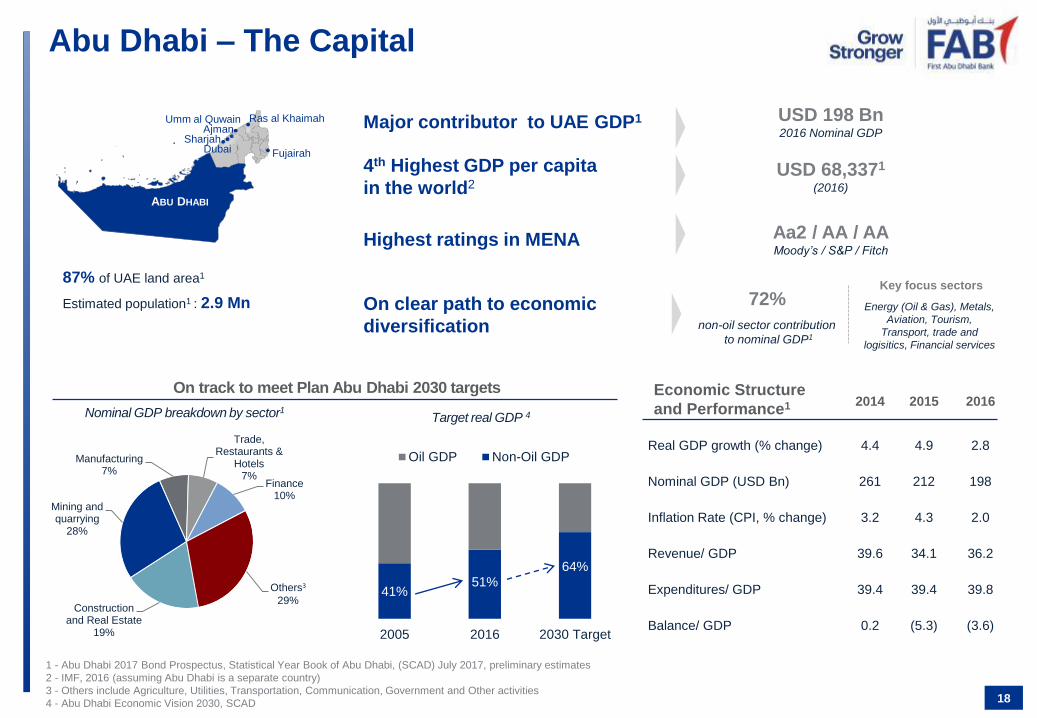
Major contributor to UAE GDP1 USD 198 Bn 2016 Nominal GDP
4th Highest GDP per capita
in the world2 USD 68,3371
(2016)
Highest ratings in MENA Aa2 / AA / AA Moody’s / S&P / Fitch
On clear path to economic
diversification
18
Abu Dhabi – The Capital
Ajman
ABU DHABI
Umm al Quwain Ras al Khaimah
Fujairah
Ajman
Dubai Sharjah
non-oil sector contribution
to nominal GDP1
87% of UAE land area1
Estimated population1 : 2.9 Mn
1 - Abu Dhabi 2017 Bond Prospectus, Statistical Year Book of Abu Dhabi, (SCAD) July 2017, preliminary estimates
2 - IMF, 2016 (assuming Abu Dhabi is a separate country)
3 - Others include Agriculture, Utilities, Transportation, Communication, Government and Other activities
4 - Abu Dhabi Economic Vision 2030, SCAD
Economic Structure
and Performance1 2014 2015 2016
Real GDP growth (% change) 4.4 4.9 2.8
Nominal GDP (USD Bn) 261 212 198
Inflation Rate (CPI, % change) 3.2 4.3 2.0
Revenue/ GDP 39.6 34.1 36.2
Expenditures/ GDP 39.4 39.4 39.8
Balance/ GDP 0.2 (5.3) (3.6)
On track to meet Plan Abu Dhabi 2030 targets
Construction and Real Estate
19%
Mining and quarrying
28%
Manufacturing 7%
Trade, Restaurants &
Hotels 7%
Finance 10%
Others3
29%
Nominal GDP breakdown by sector1
41% 51%
64%
2005 2016 2030 Target
Oil GDP Non-Oil GDP
Target real GDP 4
72%
non-oil sector contribution
to nominal GDP1
Key focus sectors
Energy (Oil & Gas), Metals,
Aviation, Tourism,
Transport, trade and
logisitics, Financial services

1,563 1,627 1,662
+25 +23 +20 +3 +21 +9 +7
-7 -0.4 -2
1,554 1,581 1,608
+3 +31 +7 +6 +15 +2 +8
-13 -0.4 -4
De
c'1
6
Go
vern
men
t
Pub
licS
ecto
r/G
RE
s
Priva
te S
ecto
r
NB
FI
No
n-R
esid
en
ts
De
c'1
7
Go
vern
men
t
Pub
licS
ecto
r/G
RE
s
Priva
te S
ecto
r
NB
FI
No
n-R
esid
en
ts
Mar'18
19
Sound and highly capitalised banking sector
Figures in AED Bn Mar’18 YTD YoY
Total Assets, net2 2,597 0.5% 3.5%
Loans and Advances, net2 1,486 1.1% 1.3%
Customer Deposits 1,662 2.2% 3.8%
LDR2 89% -100bps -300bps
Lending to Stable Resources Ratio3 84.2% -30bps -20bps
CAR (Basel III) 17.5% -60bps -90bps4
CET1 (Basel III) 13.9% -70bps na
UAE banking sector comprises 22 local and 27 foreign banks
Latest regulatory developments:
• UAE CB introduced in May 2015 a glide path on Liquidity Coverage Ratio
(LCR) in the context of gradual migration to Basel III regulatory
framework. The minimum for the current year is 90%
• UAE CB Basel III capital guidelines effective from 1st Feb 2017 with min.
CET 1 set at 7.0%; full implementation by 2019
• IFRS9 implemented across UAE banking sector effective 1 Jan 2018
• VAT @5% implemented in UAE effective 1 Jan 2018
1 - Source: UAE Central Bank, UAE Banking Indicators
2 - Total advances (net lending + net financial guarantees & stand-by LC+ Interbank placements
more than 3 months)/ sum of (net free capital funds + total other stable resources)
3 - Mar’17 as per Basel II framework
Key Highlights UAE Banking Sector Key Indicators2
Movements in Customer Deposits and Gross Credit by Sector2 (AED Bn)
Cu
sto
mer
Dep
os
its
G
ross C
red
it
+2.2% +4.1%
+1.7% +1.7%
Dec’17 Mar’18 Dec’16
Loans and deposits growth trend1
8.0% 7.7%
6.0%
1.7%
11.1%
3.5%
6.2%
4.1%
2014 2015 2016 2017
Gross credit growth Deposits growth

20
Q1’18 Key Performance Highlights
• 2018 off to a solid start
• Improved profitability and returns both sequentially and yoy
• Healthy business momentum supports operating performance
• Integration journey and key strategic initiatives firmly on track
• Synergy momentum continues - IT integration to be completed by year-end 2018
• Good progress ahead of KSA entry
• Robust asset quality metrics
• Reflect healthy portfolio, successful risk-asset optimisation and IFRS9 implementation
• Healthy fundamentals underpinned by strong liquidity and capital ratios
• L/D ratio at 84%
• CET1 ratio comfortably in excess of regulatory requirements
• On track to meet/exceed 2018 financial guidance

In AED Mn Q1’18 Q4’17 QoQ % Q1’17 YoY %
Revenues 4,871 5,049 (4) 5,188 (6)
Operating expenses (1,326) (1,616) (18) (1,516) (13)
BAU1 costs (1,212) (1,280) (5) (1,412) (14)
Integration costs (70) (198) (65) (104) (32)
Amortisation of intangibles
(merger-related) (44) (138) - - -
Impairment charges, net (439) (562) (22) (641) (31)
Net profit 2,998 2,822 6 2,926 2
EPS (AED) 1.06 1.00 6 1.04 2
21
2018 off to a solid start … Financial highlights
Q1’18 P&L summary
Key ratios
• Operating income down qoq and yoy primarily due to
material extraordinary revenue items realised in prior
periods (investment and property-related) which were
not repeated. Excluding these items, operating
performance has improved on the back of a healthy
business momentum
• Continued synergy realisation and cost discipline drive
notable reduction in BAU1 costs
• Impairment charges significantly reduced on the back of
risk-assets optimisation, tighter risk appetite and IFRS9
implementation
• Net Profit improves both sequentially and yoy
• Remarkable improvement in operating efficiency;
C/I ratio at industry-leading level
• Robust asset quality metrics post IFRS9 transition
• Strong liquidity profile remains competitive strength
• Net improvement in RoTE post FY’17 dividends, IFRS9
• CET1 comfortably in excess of regulatory requirement
1 BAU – Business as usual
2 CET1 ratio as per UAE CB’s Basel III framework (without considering the transitional arrangements for 2017 for Q4’17); Q1’17 as per Basel II framework
% Q1’18 Q4’17 QoQ
(bps) Q1’17
YoY
(bps)
C/I ratio (ex-integ costs) 25.8 28.1 (230) 27.2 (143)
CoR (bps) 49 66 (17) 73 (24)
NPL ratio 3.1 3.1 4 2.6 51
Provision coverage 127 120 714 122 545
L/D ratio 83.7 83.5 23 87.6 (392)
RoTE 17.2 15.0 218 16.1 108
CET1 ratio2 12.4 14.5 (210) 13.9 (150)
Q1'17 Q2'17 Q3'17 Q4'17 Q1'18
22
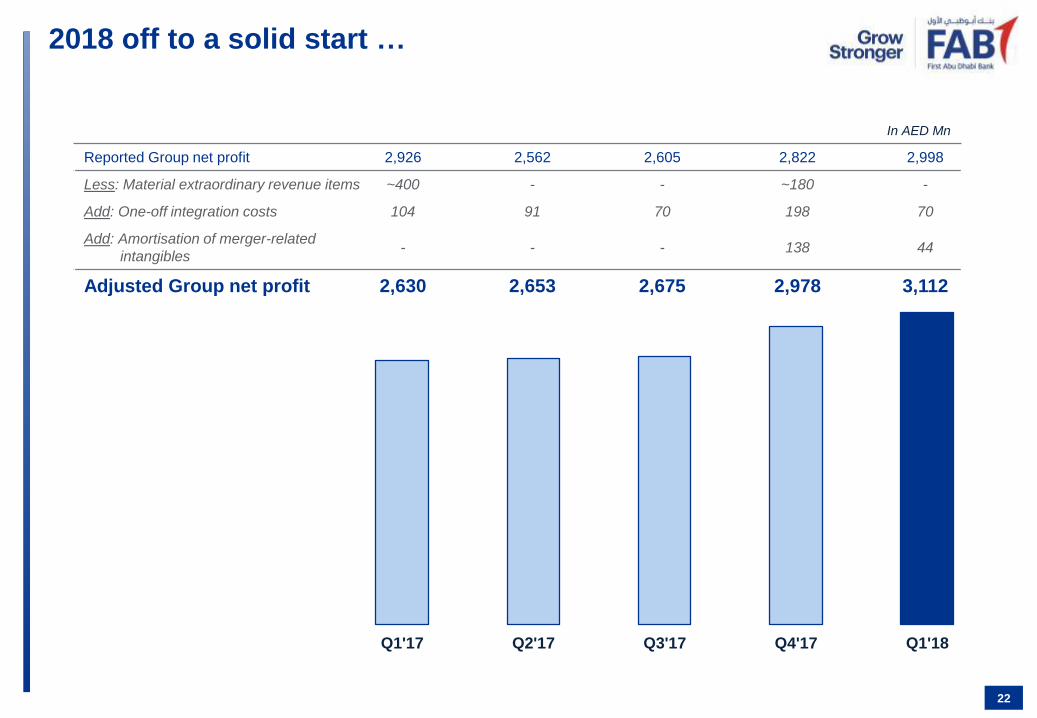
2018 off to a solid start …
Reported Group net profit 2,926 2,562 2,605 2,822 2,998
Less: Material extraordinary revenue items ~400 - - ~180 -
Add: One-off integration costs 104 91 70 198 70
Add: Amortisation of merger-related
intangibles - - - 138 44
Adjusted Group net profit 2,630 2,653 2,675 2,978 3,112
In AED Mn

23
Integration & strategy updates
IT systems integration on track to be completed by the end of 2018
Strategic review of international operations and execution well underway
KSA: both CMA and SAMA licenses obtained
UAE network rationalisation and rebranding activities continue:
• Branch & cash offices network reduced from 103 as of Dec’17 to 89 as of Mar’18
• Rebranding of FAB properties and FAB Egypt
• Integration of Islamic finance subsidiaries in progress
PPA (purchase price allocation) exercise complete
• No change to total amount of goodwill or intangibles recognised as of Dec-end’17

24
Capital position remains robust Even after PPA, FY’17 dividends, and IFRS9
CET11 ratio progression
14.5%
12.4% >13.0% >13.5%
0.62% 0.03% 1.57%
0.63% 0.55%
CET1Dec'17
FY'17Dividends
IFRS9impact
RWAimpact
Capitalgeneration
Othermovements
CET1Mar'18
2018e 2020e
9% 10%
1 CET1 ratio as per UAE CB’s Basel III framework (without considering the transitional arrangements for 2017)
2 AT1 (additional Tier 1) + Tier 2 capital requirement – Min 3.5%; any shortfall in same to be met by CET1; Countercyclical buffer requirement (0 – 2.5%) as advised by UAECB, is nil in 2017
14.5% 12.4%
2.2% 2.1%
1.2% 1.1%
CAR 17.8% CAR
15.6%
Dec'17 Mar'18
Tier II
AT1
CET1
Strong capital ratios (Basel III)1
• Robust capital position with Basel III
CET11 ratio at 12.4%, comfortably in
excess of regulatory requirements
• Impact of IFRS9 on 1 Jan 2018 was
AED 3.1Bn (3.0% of Dec’17
shareholders’ equity and 63bps of
Dec’17 CET1) in line with estimates
• Strong internal capital generation
capacity expected to support CET1
build-up as per management guidance
10% 11%
(wef 2019)
Minimum UAE CB Basel III requirement
RWAs & Return on RWAs
Management guidance
484.3 472.0 483.1 485.3 504.561
2.42% 2.30% 2.24% 2.26% 2.42%
Mar'17 Jun'17 Sep'17 Dec'17 Mar'18
RWAs RoRWA
16.1% 14.7% 14.2% 14.6%
17.2%
Q1'17 H1'17 9M'17 FY'17 Q1'18
Return on Tangible Equity (RoTE)

25
NII outlook remains positive
2.45
2.49
2.55
2.42
2.49 2.47 2.50
2.48
Quarterly YTD
4.32
4.40
4.53
4.38
4.55
4.36 4.42
4.41
0.74 0.74 0.78
0.81
0.92
0.74 0.76 0.77
Q1'17 Q2'17 Q3'17 Q4'17 Q1'18
• Group NIM: +4bps yoy and +7bps qoq, reflect margin expansion on
the back of rate hikes
• Net Interest Income (NII) marginally up yoy as positive impact of rate
hikes and volume growth, were partly offset by risk-asset
optimisation, tighter risk appetite in PBG and competitive pricing in
CIB
• Expected benefits from future rate hikes and healthy pipeline for
remainder of 2018 support positive outlook for NII growth
Note: All percentage figures are annualised
Key highlights
Net in
tere
st
marg
in (
%)
Perf
orm
ing
loan y
ield
s (
%)
Cost of custo
mer
deposits
(%
) 3,256 3,244 3,244 3,363 3,268
Q1'17 Q2'17 Q3'17 Q4'17 Q1'18
+0.4%
Net interest income (AED Mn)
-3%

1,933 1,442
1,367 1,686 1,603
40% 60% 58% 55% 58%
57% 37% 36% 28%
41%
3%
3% 6% 17% 1%
Q1'17 Q2'17 Q3'17 Q4'17 Q1'18
Other income Net FX & Investment income
Net fees and commission income
• Non-interest income came in lower yoy and qoq mainly due to
material extraordinary revenue items realised in prior periods
(investment and property-related) which were not repeated
26
Non-interest income supported by strong growth in
fees and commissions
Non-interest income (AED Mn)
Fees & commissions, net (AED Mn)
782 860
788
932 934
Q1'17 Q2'17 Q3'17 Q4'17 Q1'18
+19%
+0.1% QoQ % YoY %
Loan-related 483 (5) 25
Trade-related 283 8 19
Others 168 4 7
• Fees and commissions (net) grew 19% yoy driven by higher
syndication fees reflecting a strong performance in Loan Capital
Markets. Trade-related income also improved sequentially and yoy
on the back of higher LCs and LGs reflecting a pick-up in trade

Remarkable improvement in operating efficiency
27
• Operating expenses BAU reduced 14% yoy, reflecting continued
discipline on cost management and realisation of substantial
synergies
• Headline operating expenses were lower 13% yoy and 18% qoq
• C/I ratio (ex-integration costs1) stands at industry-leading level of
25.8%, improving from 27.2% in Q1’17 and 28.1% in Q4’17
• Cost synergies realised since Dec-end’16 reached ~AED 640Mn
against a 2020 target of ~AED 1.5Bn
• One-off Integration costs in line with guidance
Key highlights Cost-income ratio (ex-integration) (%)
1 Excluding integration costs
1,412 1,308 1,274 1,280 1,212
104 91 70 198
70
138
44
1,516 1,399 1,344
1,616
1,326
Q1'17 Q2'17 Q3'17 Q4'17 Q1'18
Amortisation of intangibles(merger-related)
Integration costs Operating expenses (BAU)
Operating expenses trend (AED Mn)
27.2
27.9 27.6
28.1
25.8 27.5 27.6 27.7
Q1'17 Q2'17 Q3'17 Q4'17 Q1'18
Qtr (%) YTD (%)

28
CoR benefits from tighter risk appetite and IFRS9
implementation
• Impairment charges (net) down 31% yoy and 22% qoq mainly
reflecting tighter risk appetite in PBG and IFRS9 implementation
• NPL ratio at 3.1% in line with Dec-end’17
• Portfolio is adequately provisioned with coverage at 127%
• Cost of risk improved significantly to 49bps in Q1’18, reflecting a
healthy portfolio and the impact of IFRS9 implementation
* CoR is annualised
Key highlights1 Impairment charges, net (AED Mn) & CoR*1
Provision coverage & NPL ratio (%)1
122 112 109 120 127
2.6
3.2 3.0 3.1 3.1
Mar'17 Jun'17 Sep'17 Dec'17 Mar'18
Provision coverage (L&A) NPL Ratio (%)
640 620 562 562 427
1
12
641 620 562 562
439
73 72 67 66
49
Q1'17 Q2'17 Q3'17 Q4'17 Q1'18
Net Impairment chrgs (L&A) Net impairment chrgs (Others)
Cost of Risk (bps) (L&A)
1 As Q1’18 ratios are based on IFRS9 accounting and ratios for prior periods are based on IAS39 accounting, they may not be fully comparable
- Gross loans and advances and NPLs are net of interest in suspense
NPLs and ECL Provisions for L&A1
AED Bn Q1’18 FY’17 Q1’17
NPLs 11.0 10.6 9.3
Provisions 13.5 12.7 11.4
Stage 1 & 2 6.7 8.1 7.2
Stage 3 6.8 4.6 4.2
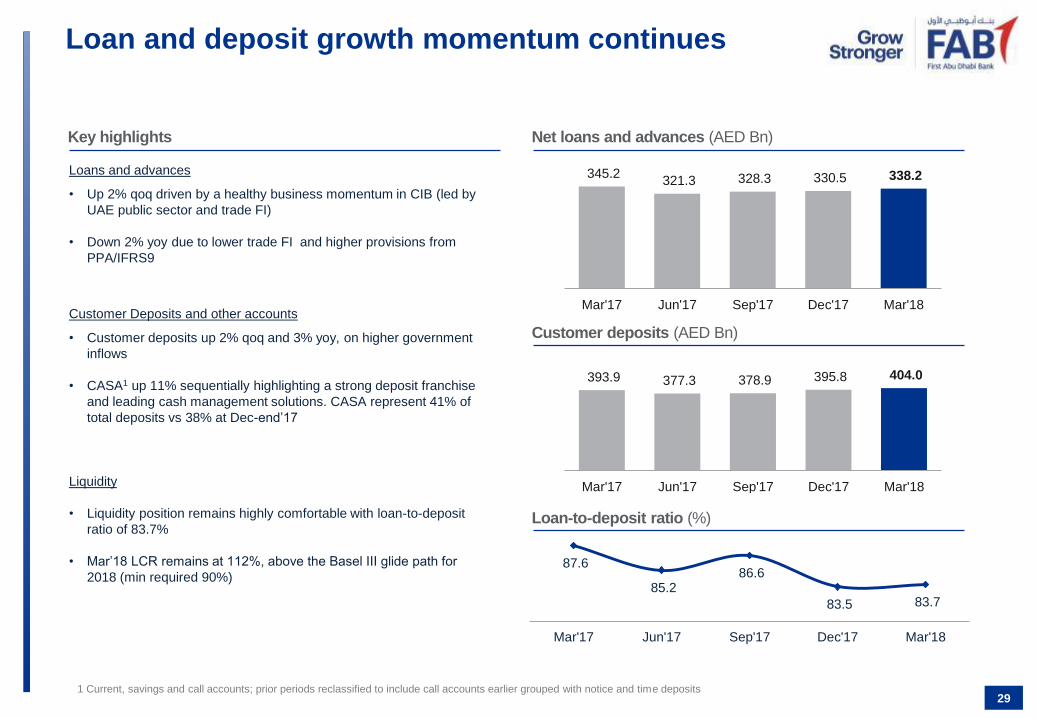
87.6
85.2 86.6
83.5 83.7
Mar'17 Jun'17 Sep'17 Dec'17 Mar'18
29
Loan and deposit growth momentum continues
Loans and advances
• Up 2% qoq driven by a healthy business momentum in CIB (led by
UAE public sector and trade FI)
• Down 2% yoy due to lower trade FI and higher provisions from
PPA/IFRS9
Customer Deposits and other accounts
• Customer deposits up 2% qoq and 3% yoy, on higher government
inflows
• CASA1 up 11% sequentially highlighting a strong deposit franchise
and leading cash management solutions. CASA represent 41% of
total deposits vs 38% at Dec-end’17
Liquidity
• Liquidity position remains highly comfortable with loan-to-deposit
ratio of 83.7%
• Mar’18 LCR remains at 112%, above the Basel III glide path for
2018 (min required 90%)
1 Current, savings and call accounts; prior periods reclassified to include call accounts earlier grouped with notice and time deposits
Net loans and advances (AED Bn)
Loan-to-deposit ratio (%)
Customer deposits (AED Bn)
Key highlights
345.2 321.3 328.3 330.5 338.2
Mar'17 Jun'17 Sep'17 Dec'17 Mar'18
393.9 377.3 378.9 395.8 404.0
Mar'17 Jun'17 Sep'17 Dec'17 Mar'18
30
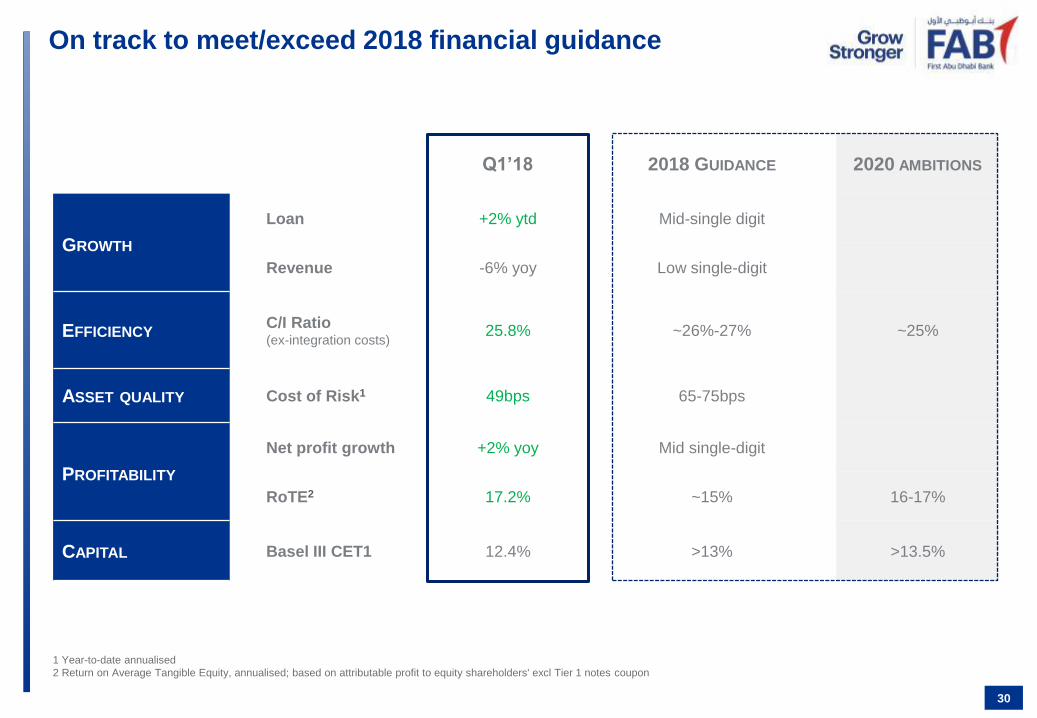
On track to meet/exceed 2018 financial guidance
1 Year-to-date annualised
2 Return on Average Tangible Equity, annualised; based on attributable profit to equity shareholders' excl Tier 1 notes coupon
Q1’18 2018 GUIDANCE 2020 AMBITIONS
GROWTH
Loan +2% ytd Mid-single digit
Revenue -6% yoy Low single-digit
EFFICIENCY C/I Ratio (ex-integration costs)
25.8% ~26%-27% ~25%
ASSET QUALITY Cost of Risk1 49bps 65-75bps
PROFITABILITY
Net profit growth +2% yoy Mid single-digit
RoTE2 17.2% ~15% 16-17%
CAPITAL Basel III CET1 12.4% >13% >13.5%

31
Appendix

32
Q1’18 Summary Financials
Income Statement - Summary (AED Mn) Note Q1'18 Q4'17 QoQ % Q1'17 YoY %
Net interest Income 3,268 3,363 (3) 3,256 0
Fees & commissions, net 934 932 0 782 19
FX and investment income, net 656 464 41 1,097 (40)
Other non-interest income 13 289 (95) 53 (76)
Total Operating Income 4,871 5,049 (4) 5,188 (6)
Operating expenses (1,326) (1,616) (18) (1,516) (13)
Incl: Integration costs (70) (198) (65) (104) (32)
Amortisation of intangibles (merger-related) (44) (138) (68) - -
Impairment charges, net (439) (562) (22) (641) (31)
Non Controlling Interests and Taxes (108) (48) 126 (106) 2
Net Profit 2,998 2,822 6 2,926 2
Basic Earning per Share (AED) a 1.06 1.00 6 1.04 2
a) Basic EPS based on attributable profits to equity shareholders' excluding Tier-1 notes coupon (Q1'18: AED 120 Mn) and outstanding shares

33
Q1’18 Summary Financials
Balance Sheet - Summary (AED Bn) Note Mar'18 Dec'17 QoQ % Mar'17 YoY %
Loans and advances 338 330 2 345 (2)
Customer deposits 404 396 2 394 3
CASA (deposits) b 166 150 11 150 11
Total Assets 678 669 1 660 3
Equity (incl Tier-1 capital notes) 94 102 (8) 94 (0)
Tangible Equity c 63 71 (11) 68 (7)
b) CASA deposits include current, savings and call accounts; periods prior to Mar-2018 have been reclassified to include call accounts
c) Tangible equity is shareholders' equity net of Tier-1 capital notes, goodwill & intangibles
d) As Q1’18 ratios are based on IFRS9 accounting and ratios for prior periods are based on IAS39 accounting, they may not be fully comparable
e) Return on Average Tangible Equity, annualised; based on attributable profit to equity shareholders' excl coupon on Tier-1 capital notes
f) As per UAE Central Bank's Basel III framework; Q4'17 figure is without considering the transitional arrangements for 2017-end; Q1'17 ratio is based on UAE CB's Basel II framework
Rounding differences may appear in above table
Key Ratios (%) Note Q1'18 Q4'17 QoQ
(bps) Q1'17
YoY
(bps)
Net Interest Margin 2.49 2.42 7 2.45 4
Cost-Income ratio (ex-integration costs) 25.8 28.1 (230) 27.2 (143)
Cost of Risk (bps) d 49 66 (17) 73 (24)
Non-performing loans ratio d 3.1 3.1 4 2.6 51
Provision coverage d 127 120 714 122 545
Loans-to-deposits ratio 84 83 23 88 (392)
Return on Tangible Equity (RoTE) e 17.2 15.0 218 16.1 108
Return on Risk-weighted Assets (RoRWA) 2.4 2.3 10 2.4 0
CET1 ratio f 12.4 14.5 (210) 13.9 (150)
Capital Adequacy ratio f 15.6 17.8 (220) 17.2 (159)

Agriculture 0.1%
Energy 7%
Manufacturing 6% Construction
4%
Real Estate 25%
Trading 7%
Transport and communication
7% Banks
7%
Other financial institutions 8%
Services 8%
Government 1%
Personal - Loans & Credit
Cards 17%
Personal - Retail Mortgage
4%
Cash & CB Balances
20%
DFB and Reverse Repos
5%
Loans and Advances
50%
Investments 16%
Others 9%
1% 1% 16% 17%
56% 55%
21% 20%
6% 7%
Dec'17 Mar'18
Banking Sector
Personal/Retail Sector
Corporate/PrivateSector
Public Sector
Government Sector
UAE 80%
GCC 3%
Asia 5%
Europe 9%
MENA 2%
America 1%
Overdrafts 4%
Term Loans 77%
Trade related loans 8%
Personal Loans 8%
Credit Cards 2%
Vehicle financing loans 0.3%
34
Asset & Loan Mix
AED 353.5Bn
Mar’18
AED 338.2Bn
Mar’18
AED 677.8Bn
Mar’18
AED 353.5Bn
Mar’18
353.5 345.1
1 Based on booking centre
Asset Mix Gross loans by counterparty (AED Bn)
Gross loans by economic sector Net loans by geography¹ Gross loans by product
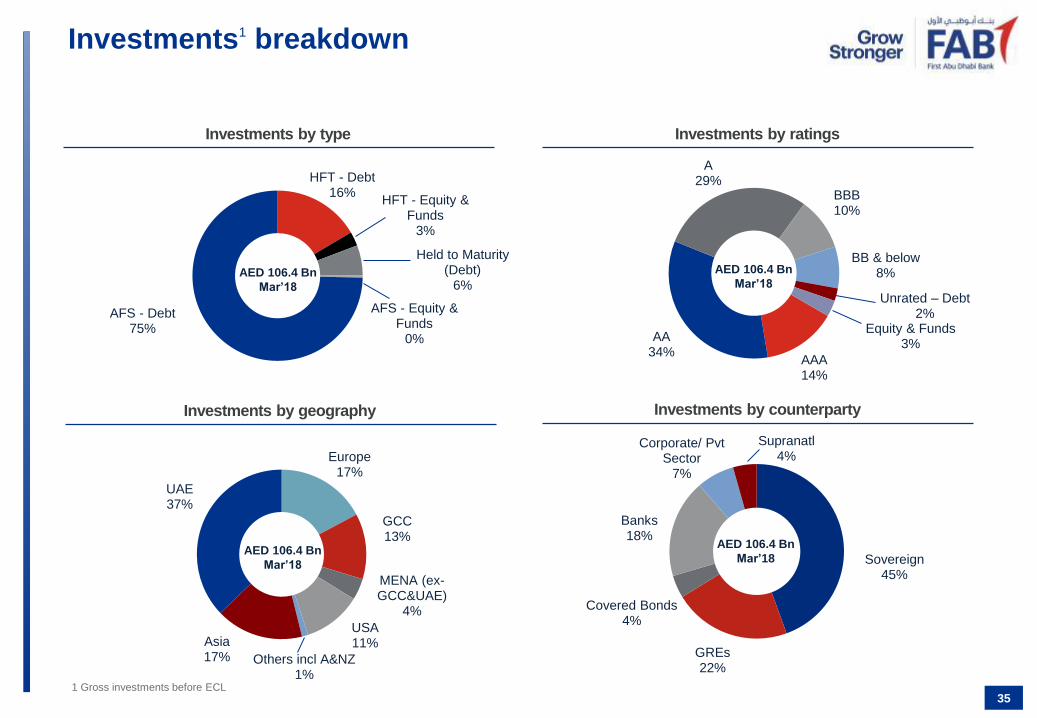
HFT - Debt 16%
HFT - Equity & Funds
3%
Held to Maturity (Debt)
6%
AFS - Equity & Funds
0%
AFS - Debt 75%
Sovereign 45%
GREs 22%
Covered Bonds 4%
Banks 18%
Corporate/ Pvt Sector
7%
Supranatl 4% Europe
17%
GCC 13%
MENA (ex-GCC&UAE)
4%
USA 11%
Others incl A&NZ 1%
Asia 17%
UAE 37%
AAA 14%
AA 34%
A 29%
BBB 10%
BB & below 8%
Unrated – Debt 2%
Equity & Funds 3%
35
Investments1 breakdown
AED 106.4 Bn
Mar’18
AED 106.4 Bn
Mar’18
AED 106.4 Bn
Mar’18 AED 106.4 Bn
Mar’18
Investments by type Investments by ratings
Investments by geography Investments by counterparty
1 Gross investments before ECL

Due to Banks & Repos 11%
Commercial Paper 4%
Customer Deposits 69%
Term Borrowings & Sub Debt
8%
Others 8%
36
Liability mix and Wholesale Funding
Wholesale Funding (AED Bn) Mar’18
Syndicated loan 7.3
Medium Term Notes/Bonds 34.3
Sukuk 2.4
Subordinated debt 0.4
Total 44.4
AED 583.6 Bn
Mar’18
7,333
2,720
7,694
7,346 960
3,290
12,283
2,385
2018 2019 2020 2021 2022 2023 &Beyond
Syndicated Loan MTN/MTB Sukuk
Liabilities mix
Wholesale funding maturity profile (AED Mn)
• 30yr non-call 5yr USD610m Formosa @ 4.70% IRR
• 5yr USD 650 Mn Sukuk @ 3.625% coupon
• 3yr CNH 900 Mn Dim Sum Formosa @ 4.80% coupon
• 3-10yr USD 128 Mn Private Placements
Issuances
In Q1’18
Maturities
In Q1’18
• 5yr AUD 300 Mn Kangaroo bonds @ 5.0% coupon
• 5yr USD 500 Mn Convertible bonds @ 1.0% coupon
• 2-3yr USD 36 Mn equivalent Private Placements
*Debt at final maturity date rather than next call date
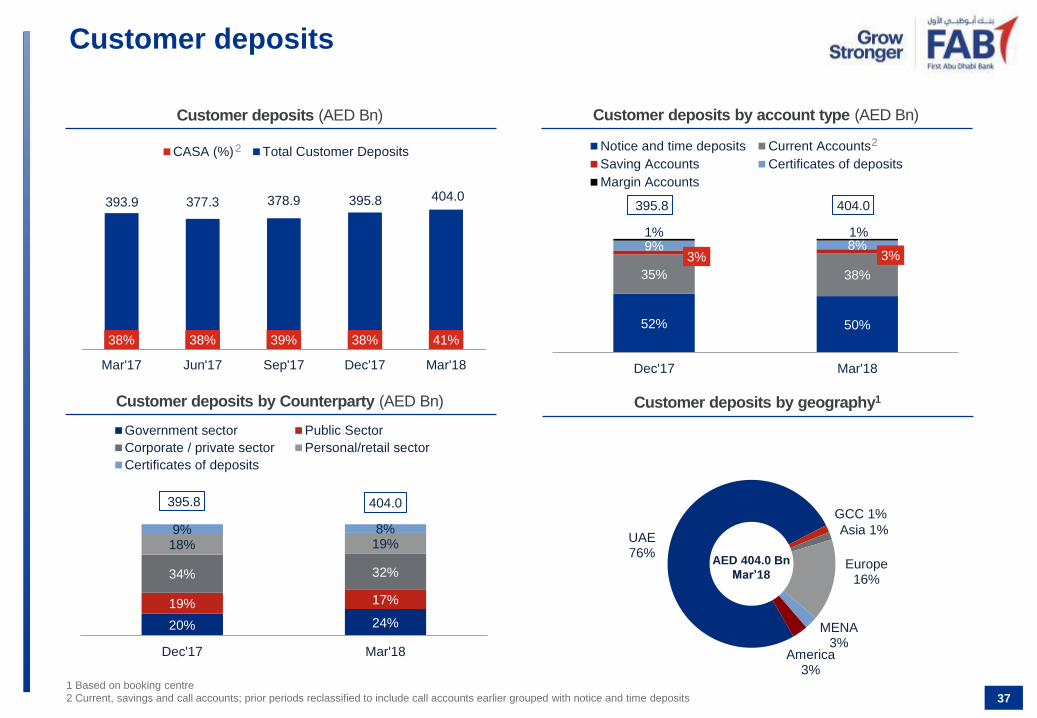
20% 24%
19% 17%
34% 32%
18% 19% 9% 8%
395.8 404.0
Dec'17 Mar'18
Government sector Public Sector
Corporate / private sector Personal/retail sector
Certificates of deposits
52% 50%
35% 38%
3% 3% 9% 8% 1% 1%
395.8 404.0
Dec'17 Mar'18
Notice and time deposits Current Accounts
Saving Accounts Certificates of deposits
Margin Accounts
UAE 76%
GCC 1%
Asia 1%
Europe 16%
MENA 3%
America 3%
37
Customer deposits
AED 404.0 Bn
Mar’18
38% 38% 39% 38% 41%
393.9 377.3 378.9 395.8 404.0
Mar'17 Jun'17 Sep'17 Dec'17 Mar'18
CASA (%) Total Customer Deposits
1 Based on booking centre
2 Current, savings and call accounts; prior periods reclassified to include call accounts earlier grouped with notice and time deposits
Customer deposits (AED Bn) Customer deposits by account type (AED Bn)
Customer deposits by Counterparty (AED Bn) Customer deposits by geography1
2 2

Intangible assets
= AED 2.6Bn
38
PPA completed as of 31 March 2018
38
NBAD Net Asset Value as of March 31 2017
AED Bn Pre PPA PPA impact Post PPA
Loans and advances 210.7 (2.9) 207.8
Other Assets 225.3 (1.9) 223.4
Total assets 436.0 (4.8) 431.2
Total liabilities 397.2 0.3 397.5
NBAD net asset value (pre-intangibles) 38.8 (5.1) 33.7
Intangibles identified - 2.6 2.6
NBAD net asset value 36.3
• As per IFRS 3 and Business Combination guidelines, the Bank is
required to complete a “Purchase Price Allocation” exercise in order
to determine the goodwill arising from the merger
• All acquired assets and assumed liabilities of NBAD should be
recorded at fair value
Impact
Concept
of PPA
• Fair value adjustments impact net asset value and goodwill
calculation
• Intangible assets identified as a result of PPA to be amortised
through P&L
Accounting treatment Post-PPA
• To be amortised over 12 yrs
• Year 1 impact of AED 138Mn
recorded in Q4’17 (nine-
month impact)
• Estimated impact on P&L for
2018 ~AED 185Mn
• No amortisation
• To be annually tested for
impairment
Goodwill
= AED 17.3Bn
Purchase Price Consideration (a) 53.6
NBAD Net Asset Value (b) 36.3
Goodwill (a)-(b) 17.3
Intangibles 2.6
Goodwill & Intangibles 19.9
Goodwill calculation (AED Bn)
39
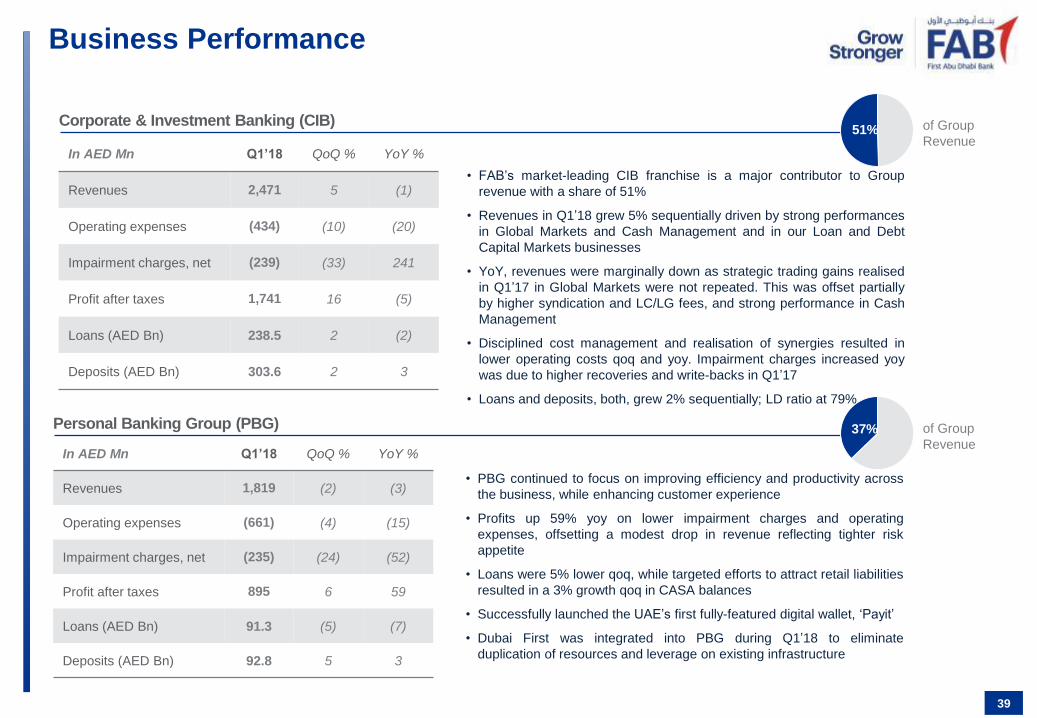
Business Performance
51% Corporate & Investment Banking (CIB)
37% Personal Banking Group (PBG)
of Group
Revenue
of Group
Revenue
• FAB’s market-leading CIB franchise is a major contributor to Group
revenue with a share of 51%
• Revenues in Q1’18 grew 5% sequentially driven by strong performances
in Global Markets and Cash Management and in our Loan and Debt
Capital Markets businesses
• YoY, revenues were marginally down as strategic trading gains realised
in Q1’17 in Global Markets were not repeated. This was offset partially
by higher syndication and LC/LG fees, and strong performance in Cash
Management
• Disciplined cost management and realisation of synergies resulted in
lower operating costs qoq and yoy. Impairment charges increased yoy
was due to higher recoveries and write-backs in Q1’17
• Loans and deposits, both, grew 2% sequentially; LD ratio at 79%
• PBG continued to focus on improving efficiency and productivity across
the business, while enhancing customer experience
• Profits up 59% yoy on lower impairment charges and operating
expenses, offsetting a modest drop in revenue reflecting tighter risk
appetite
• Loans were 5% lower qoq, while targeted efforts to attract retail liabilities
resulted in a 3% growth qoq in CASA balances
• Successfully launched the UAE’s first fully-featured digital wallet, ‘Payit’
• Dubai First was integrated into PBG during Q1’18 to eliminate
duplication of resources and leverage on existing infrastructure
In AED Mn Q1’18 QoQ % YoY %
Revenues 2,471 5 (1)
Operating expenses (434) (10) (20)
Impairment charges, net (239) (33) 241
Profit after taxes 1,741 16 (5)
Loans (AED Bn) 238.5 2 (2)
Deposits (AED Bn) 303.6 2 3
In AED Mn Q1’18 QoQ % YoY %
Revenues 1,819 (2) (3)
Operating expenses (661) (4) (15)
Impairment charges, net (235) (24) (52)
Profit after taxes 895 6 59
Loans (AED Bn) 91.3 (5) (7)
Deposits (AED Bn) 92.8 5 3
40
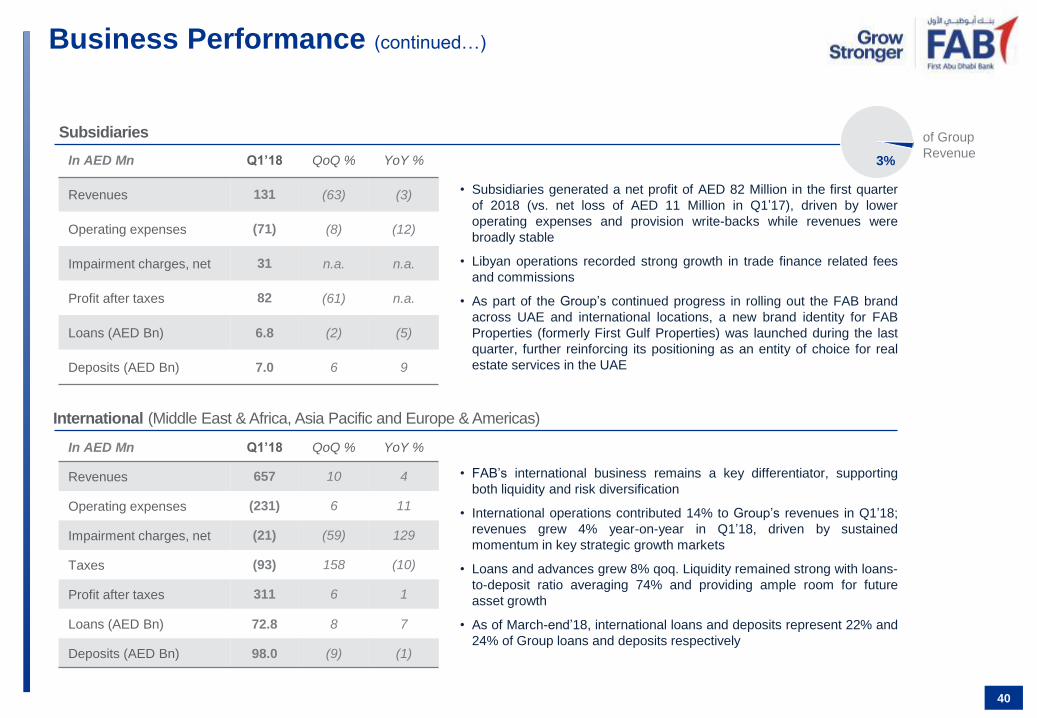
Business Performance (continued…)
3%
Subsidiaries
International (Middle East & Africa, Asia Pacific and Europe & Americas)
of Group
Revenue
• Subsidiaries generated a net profit of AED 82 Million in the first quarter
of 2018 (vs. net loss of AED 11 Million in Q1’17), driven by lower
operating expenses and provision write-backs while revenues were
broadly stable
• Libyan operations recorded strong growth in trade finance related fees
and commissions
• As part of the Group’s continued progress in rolling out the FAB brand
across UAE and international locations, a new brand identity for FAB
Properties (formerly First Gulf Properties) was launched during the last
quarter, further reinforcing its positioning as an entity of choice for real
estate services in the UAE
• FAB’s international business remains a key differentiator, supporting
both liquidity and risk diversification
• International operations contributed 14% to Group’s revenues in Q1’18;
revenues grew 4% year-on-year in Q1’18, driven by sustained
momentum in key strategic growth markets
• Loans and advances grew 8% qoq. Liquidity remained strong with loans-
to-deposit ratio averaging 74% and providing ample room for future
asset growth
• As of March-end’18, international loans and deposits represent 22% and
24% of Group loans and deposits respectively
In AED Mn Q1’18 QoQ % YoY %
Revenues 131 (63) (3)
Operating expenses (71) (8) (12)
Impairment charges, net 31 n.a. n.a.
Profit after taxes 82 (61) n.a.
Loans (AED Bn) 6.8 (2) (5)
Deposits (AED Bn) 7.0 6 9
In AED Mn Q1’18 QoQ % YoY %
Revenues 657 10 4
Operating expenses (231) 6 11
Impairment charges, net (21) (59) 129
Taxes (93) 158 (10)
Profit after taxes 311 6 1
Loans (AED Bn) 72.8 8 7
Deposits (AED Bn) 98.0 (9) (1)

41
Our commitment to sustainability
Signatory to the Equator Principles
• The global best practice in environmental and social risk management for major capital projects
First UAE bank signatory to United Nations Global Compact (UNGC)
principles
• since Dec 2017
Top ranking in the S&P/Hawkamah ESG Pan Arab Index - 2017
• Amongst the top 10 organisations - the index provides a measure of total organisational
performance by linking stock market success to ESG indicators
GHG emissions disclosure to CDP
• The bank continues to report and disclose its GHG emissions to CDP (formerly the Carbon
Disclosure Project) and its GHG emissions data is externally verified against the ISO 14064-3
standard for greenhouse gas emissions
First bank in MENA to issue a Green Bond
• The bank successfully launched a Green Bond in 2017 - net proceeds of which are being used to
finance, in whole or in part, environmentally sustainable eligible projects such as clean
transportation schemes, energy efficient real estate and renewable energy projects
Signatory of the Dubai Declaration on Sustainable Finance
• Signed in 2017 by financial institutions in the United Arab Emirates.

Executed Landmark Transactions in Q1 2018
DCM LCM
42
KCA Deutag
USD 400 million
Senior Secured
9.625% due 2023
Joint Bookrunner
March 2018
Emirates Airlines
USD 600 million
Amortizing Sukuk
4.500% due 2028
Joint Bookrunner
March 2018
Majid Al Futtaim
USD 400 million
Reset Subordinated
Notes 6.375% Perpetual
NC8 year
Joint Bookrunner
March 2018
Majid Al Futtaim
USD 400 million
Reset Subordinated
Notes 6.375% Perpetual
NC8 year
Joint Bookrunner
March 2018
Bank Muscat
USD 500 million
Senior Unsecured Notes
4.875% due 2023
Joint Bookrunner
March 2018
Union National Bank
USD 500 million
Senior Unsecured Notes
4.000% due 2023
Joint Bookrunner &
Joint Lead Manager
March 2018
ICBC DIFC Branch
USD 1.4 billion
Senior Unsecured dual
tranche Floating Rates
Notes due 2021 and 2023
Joint Bookrunner
March 2018
The Arab Republic of
Egypt
USD 4 billion
Senior Unsecured
5.577% due 2023
6.588% due 2028
7.903% due 2048
Joint Bookrunner
February 2018
VakifBank
USD 650 million
Senior Unsecured
5.750% due 2023
Joint Bookrunner
January 2018
Dubai Islamic Bank
USD 1 billion
Senior Sukuk
3.625% due 2023
Joint Bookrunner
January 2018
Tata Steel
USD 1.3 billion
Senior Unsecured
4.450% due 2023
5.450% due 2028
Joint Bookrunner
January 2018
Emirates NBD
USD 83.75 million
Floating Rate Notes
Due 2025
Sole Arranger
February 2018
Saudi Electricity
USD 2.6 billion
Term Loan Facility
Bookrunner, Mandated
Lead Arranger &
Facility Agent
January 2018
Al Hamra Real Estate
Development
AED 1.15 billion
Term Loan Facility
Mandated Lead
Arranger & Facility
Agent
March 2018
Aercap
USD 950 million
Revolving Credit
Facility
Bookrunner
March 2018
Burgan Bank
USD 350 million
Term Loan Facility
Bookrunner & Mandated
Lead Arranger
March 2018
AK Bank
USD 605 million
& EUR 483 million
Term Loan Facility
Bookrunner & Mandated
Lead Arranger
March 2018
Huawei Technologies
USD 1.2 billion
Term Loan & Revolving
Credit Facilities
Mandated Lead
Arranger
March 2018
Ping An Leasing
USD 300 million
Term Loan & Revolving
Credit Facilities
Mandated Lead
Arranger
January 2018
Turk Eximbank
EUR 481 million
& USD 76 million
Term Loan Facility
Mandated Lead
Arranger
March 2018
Tata Motors
USD 850 million
Term Loan Facility
Bookrunner
January 2018
ChemChina
USD 5.5 billion
Term Loan Facility
Bookrunner
March 2018
Axis Bank
USD 550 million
Term Loan Facility
Bookrunner
& Facility Agent
March 2018
OUE Hospitality Trust
SGD 726 million
Term Loan &
Revolving Credit
Facility
Lender
March 2018
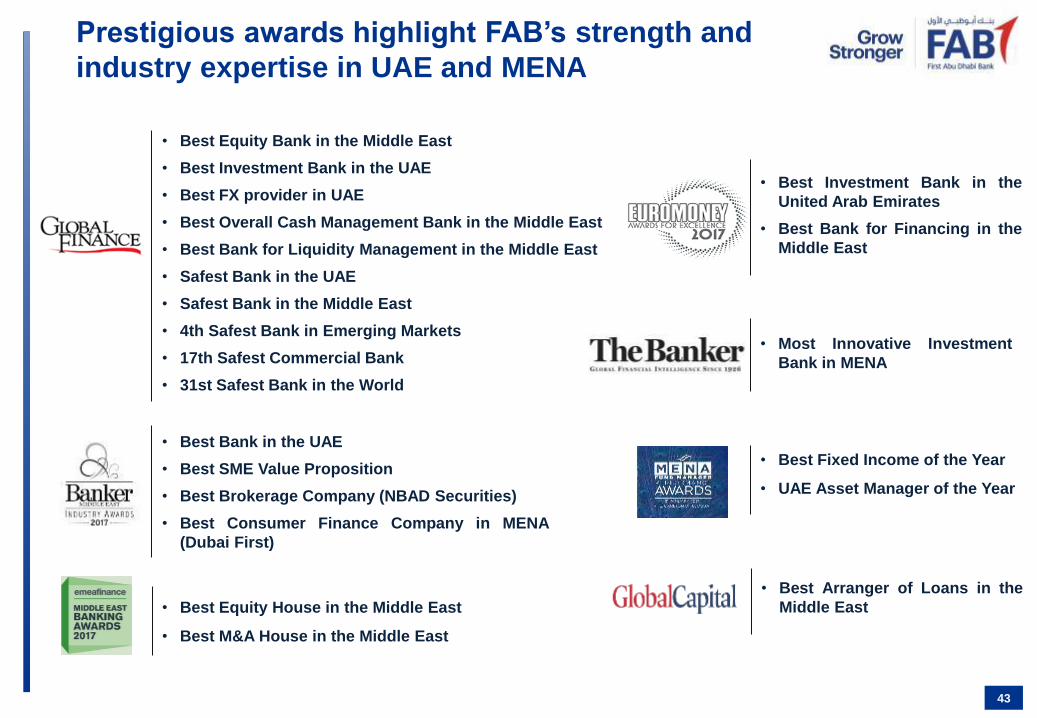
• Best Equity Bank in the Middle East
• Best Investment Bank in the UAE
• Best FX provider in UAE
• Best Overall Cash Management Bank in the Middle East
• Best Bank for Liquidity Management in the Middle East
• Safest Bank in the UAE
• Safest Bank in the Middle East
• 4th Safest Bank in Emerging Markets
• 17th Safest Commercial Bank
• 31st Safest Bank in the World
Prestigious awards highlight FAB’s strength and
industry expertise in UAE and MENA
• Best Bank in the UAE
• Best SME Value Proposition
• Best Brokerage Company (NBAD Securities)
• Best Consumer Finance Company in MENA
(Dubai First)
• Best Investment Bank in the
United Arab Emirates
• Best Bank for Financing in the
Middle East
• Best Fixed Income of the Year
• UAE Asset Manager of the Year
• Most Innovative Investment
Bank in MENA
43
• Best Arranger of Loans in the
Middle East • Best Equity House in the Middle East
• Best M&A House in the Middle East

Prestigious awards highlight FAB’s strength and
industry expertise in UAE and MENA
- Best Trade & Supply Chain
Finance Solution - Most Outstanding Islamic
Banking Window
- Best Seamless Government
Experience
- UAE Asset Manager of the
Year
- Best Trade Finance Bank in
MENA
- Sukuk House of the Year - UAE
- Best Islamic Deal of the Year
- Digital Leader Award -
Government
- Best Islamic Structured Trade
Finance Deal of the Year
44

THANK YOU!
For more information, please visit
www.bankfab.com
or contact FAB Investor Relations team
You can also download FAB’s Investor Relations App
from App Store / Google Play to access latest
corporate updates, FAB pro forma financial information
and FGB/NBAD archives
Scan to download