Embed Size (px)
Citation preview

INVESTOR PRESENTATION
May 8, 2014

22
Forward Looking Statements
This presentation contains forward-looking statements, which involve numerous risks and uncertainties. Included are statements relating to opening of new clinics, availability of personnel and reimbursement environment. The forward-looking statements are based on the Company’s current views and assumptions and the Company’s actual results could differ materially from those anticipated as a result of certain risks, uncertainties, and factors, which include, but are not limited to: general economic, business, and regulatory conditions; competition; reimbursement conditions; federal and state regulation; acquisitions; clinic closures, availability, terms, and use of capital; availability and cost of skilled physical and occupational therapists; and weather.
2

Investment Highlights
• 485 outpatient physical and occupational therapy clinics across 43 states
• 3rd largest owner/operator of clinics• Only publicly-traded, pure play provider
Proven Business Model
Solid Financial Position
• Diversified payor mix, only 22% of revs from Medicare• Strong cash flow and balance sheet
• Driven by organic growth and acquisitions• Approximately 60% of clinics are de novo start-ups• Partner with experienced physical therapists
3
Attractive Market Dynamics
• US rehab market > $15B in annual revenue• Highly fragmented; No company with >6% market share• Favorable demographics – aging and active population
Established Company

National Footprint
4

Growth Strategy
Drive organic growth through de novo PT/OT clinic openings, utilize true partnership model
Maximize profits of existing facilities by growing patient volume; realize efficiencies through higher clinical productivity
Augment organic growth through strategic acquisitions
5

Large and Growing Market Opportunity
• $15B+ U.S. rehab market with 3-4% projected annual growth
• Favorable demographics – physically active, aging and obese population segments
• Healthcare delivery shifting towards lower cost, high quality outpatient providers
“Demand for physical therapy is projected to be one of the fastest growing sectors in the U.S. economy through 2016.”
- Wall Street Journal, July 14, 2009“Jobs in healthcare support…are projected to experience even faster growth. The increased demand in this area stems largely from an aging population…occupations that will likely grow in importance are physical therapists, physical therapist assistants…”
− Report from Executive Office of the President’s Council of Economic Advisors, July 2009
6

Competitive Landscape
• Highly fragmented U.S. outpatient rehab market with ~16,000 clinics
• No company with >6% market share
• USPh ranks third nationally– Select Medical 1,017 Clinics
– Physiotherapy Associates 590 Clinics
– USPh 485 Clinics
7

Focused Business Model
• Specialize in trauma, sports, work-related and pre and post surgical cases
• Partner with experienced physical therapists – Drive volume via referrals
– Augment sales with marketing reps
• Historical focus on organic growth via lower cost de novo (start-up) clinics
• Strategic acquisitions structured like de novos as partnerships with significant ownership retained by founders
8

USPH Partnership Advantages
Accounting HR Real Estate Construction Purchasing Marketing Compliance Legal IT
Less Administrative
Burden No Personal Financial Risk Unlimited Earnings Potential Full Benefit Package Ongoing Guidance within
Semi-Autonomous Work Environment
More Resources
9

10
10
Video Placeholder

New Clinics / Brands 2013
11

Acquisition Strategy
• Completed 17 clinic group acquisitions since 2005
• Range in size from 3 to 52 clinics
• Acquisition criteria: Owner therapists continue to operate clinics
and retain significant equity interest
Immediately accretive to earnings
Further de novo growth opportunities
12
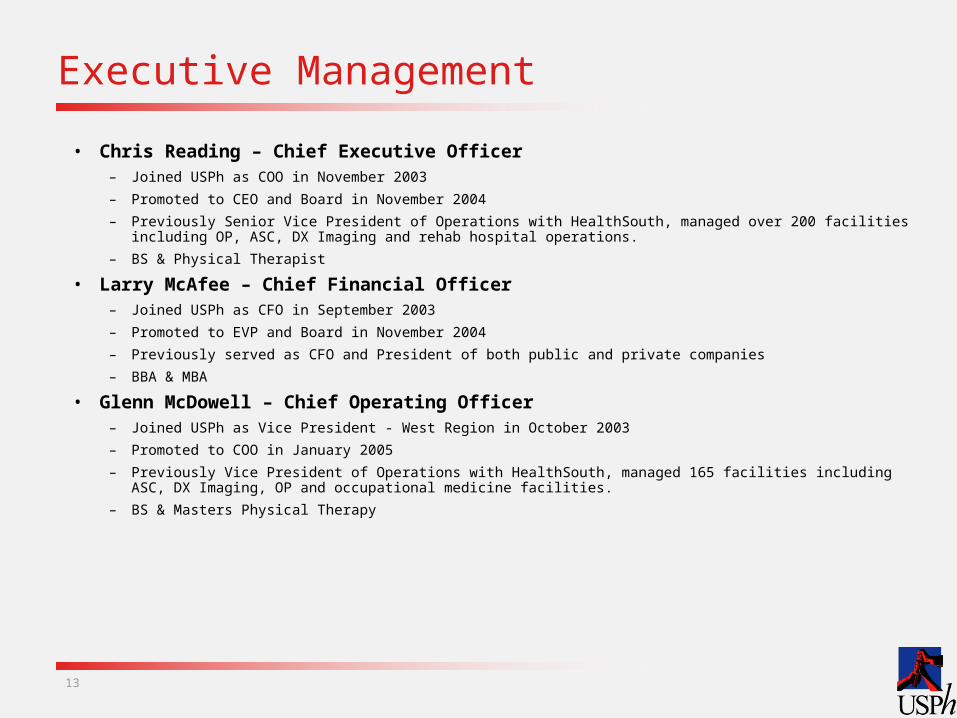
Executive Management
• Chris Reading – Chief Executive Officer– Joined USPh as COO in November 2003
– Promoted to CEO and Board in November 2004
– Previously Senior Vice President of Operations with HealthSouth, managed over 200 facilities including OP, ASC, DX Imaging and rehab hospital operations.
– BS & Physical Therapist
• Larry McAfee – Chief Financial Officer– Joined USPh as CFO in September 2003
– Promoted to EVP and Board in November 2004
– Previously served as CFO and President of both public and private companies
– BBA & MBA
• Glenn McDowell – Chief Operating Officer– Joined USPh as Vice President - West Region in October 2003
– Promoted to COO in January 2005
– Previously Vice President of Operations with HealthSouth, managed 165 facilities including ASC, DX Imaging, OP and occupational medicine facilities.
– BS & Masters Physical Therapy
13

Diversified Payor Mix
14
51%
23%
20%
6%
Percentage of 2014 Net Patient Revenue (Through March 31, 2014)
Private Insurance &Managed Care
Medicare & Medicaid
Workers Comp
Other

Strong Cash Flow and Balance Sheet
• Both de novo clinics and acquisitions financed primarily through free cash flow
• USPH adjusted trailing twelve months March 2014 EBITDA(1) of $39.6 million
(1) Adjusted EBITDA is defined as earnings before interest, taxes, depreciation, amortization, gain on purchase price settlement and equity compensation expense.
15

Dividend
• In 2011 initiated quarterly dividend
• Increased dividend in 2012 and 2013
• Paid special dividend in December 2012
• Increased dividend in March 2014 by 20%
• Dividends do not impact ability to continue to grow internally through de novo clinic development and externally through acquisitions
• Dividend seen as additional way to increase returns to shareholders as Company is under leveraged and has excellent net free cash flow
16

Average Annual Rate of Return to Shareholders – 20.1% Per Year
17
* Current Management Team joined Company in Fall of 2003.
Total Cumulative Return through December 31, 2013 including dividends is $24.53.Total Cumulative Return Percentage is 200.9%.Average Annual Return 20.1%.Market Cap Increase during time period from $154.7 million to $426.8 million.
.
$0.00
$5.00
$10.00
$15.00
$20.00
$25.00
$30.00
$35.00
$40.00
12/31/201312/31/201212/30/201112/31/201012/31/200912/31/200812/31/200712/29/200612/30/200512/31/20049/30/2003*
Increase in Stock Value
Price

Revenue
Gross Margin
Operating Income
Net Income
EPS
Adjusted EBITDA
First Quarter Results*
18
$ 69.8 M
$ 16.6 M
$ 9.5 M
$ 4.2 M
$ .35
$ 9.5 M
Q1 2013
$ 62.8 M
$ 14.8 M
$ 8.4 M
$ 3.9 M
$ .32
$ 8.5 M
11.2%
Q1 2014
12.1%
12.8%
9.8%
9.1%
12.7%
* From continuing operations

Summary
19
Only publicly-traded, pure play operator of rehab clinics
Proven business model, driven by organic growth and acquisitions
Significant scale with national footprint
Large and growing market/favorable demographics
Strong cash flow and balance sheet

Reconciliation of Non-GAAP Financial Measures – Adjusted EBITDA
Adjusted EBITDA is defined as earnings before interest, taxes, depreciation, amortization and equity compensation expense.
20
From Continuing Operations
Trailing Twelve Months Ended
March 31(amounts in 000’s)
2014 2013
Net revenues $ 271,069 $ 250,636
Net Income attributable to U.S. Physical Therapy 17,869 17,627
Depreciation & amortization 5,560 5,233
Interest, net (income) / expense 650 524
Non-controlling interests 8,648 8,089
Equity/stock option expense 2,839 2,194
Provision for income taxes 12,682 10,836
Adjusted EBITDA before noncontrolling interests 48,248 44,503
Noncontrolling interests (8,648) (8,089)
Adjusted EBITDA $ 39,600 $ 36,414

Reconciliation of Non-GAAP Financial Measures – Adjusted EBITDA
Adjusted EBITDA is defined as earnings before interest, taxes, depreciation, amortization and equity compensation expense.
21
From Continued Operations
Three Months Ended March 31, 2014(amounts in 000’s)
2014 2013
Net revenues $ 69,767 $ 62,756
Net Income attributable to U.S. Physical Therapy 4,228 3,851
Depreciation & amortization 1,387 1,352
Interest, net (income) / expense 252 133
Non-controlling interests 2,095 1,958
Equity/grant expense 735 639
Provision for income taxes 2,939 2,493
Adjusted EBITDA before non-controlling interests 11,636 10,426
Noncontrolling interests (2,095) (1,958)
Adjusted EBITDA $ 9,541 $ 8,468 12.7%

NYSE: USPH