Embed Size (px)
Citation preview

2
THIS DOCUMENT IS STRICTLY CONFIDENTIAL AND IS BEING PROVIDED TO YOU SOLELY FOR YOUR INFORMATION BY AMGADVANCED METALLURGICAL GROUP N.V. (THE “COMPANY”) AND MAY NOT BE REPRODUCED IN ANY FORM OR FURTHERDISTRIBUTED TO ANY OTHER PERSON OR PUBLISHED, IN WHOLE OR IN PART, FOR ANY PURPOSE. FAILURE TO COMPLY WITHTHIS RESTRICTION MAY CONSTITUTE A VIOLATION OF APPLICABLE SECURITIES LAWS.
This presentation does not constitute or form part of, and should not be construed as, an offer to sell or issue or the solicitation of an offer to buy or acquiresecurities of the Company or any of its subsidiaries nor should it or any part of it, nor the fact of its distribution, form the basis of, or be relied on in connectionwith, any contract or commitment whatsoever.
This presentation has been prepared by, and is the sole responsibility of, the Company. This document, any presentation made in conjunction herewith and anyaccompanying materials are for information only and are not a prospectus, offering circular or admission document. This presentation does not form a part of,and should not be construed as, an offer, invitation or solicitation to subscribe for or purchase, or dispose of any of the securities of the companies mentionedin this presentation. These materials do not constitute an offer of securities for sale in the United States or an invitation or an offer to the public or form ofapplication to subscribe for securities. Neither this presentation nor anything contained herein shall form the basis of, or be relied on in connection with, any
offer or commitment whatsoever. The information contained in this presentation has not been independently verified. No representation or warranty, expressor implied, is made as to, and no reliance should be placed on, the fairness, accuracy or completeness of the information or the opinions contained herein. TheCompany and its advisors are under no obligation to update or keep current the information contained in this presentation. To the extent allowed by law, noneof the Company or its affiliates, advisors or representatives accept any liability whatsoever (in negligence or otherwise) for any loss howsoever arising from anyuse of this presentation or its contents or otherwise arising in connection with the presentation.
Certain statements in this presentation constitute forward-looking statements, including statements regarding the Company's financial position, business strategy,plans and objectives of management for future operations. These statements, which contain the words "believe,” “expect,” “anticipate,” “intends,” “estimate,”“forecast,” “project,” “will,” “may,” “should” and similar expressions, reflect the beliefs and expectations of the management board of directors of the
Company and are subject to risks and uncertainties that may cause actual results to differ materially. These risks and uncertainties include, among other factors,the achievement of the anticipated levels of profitability, growth, cost and synergy of the Company’s recent acquisitions, the timely development and acceptanceof new products, the impact of competitive pricing, the ability to obtain necessary regulatory approvals, and the impact of general business and global economicconditions. These and other factors could adversely affect the outcome and financial effects of the plans and events described herein.
Neither the Company, nor any of its respective agents, employees or advisors intend or have any duty or obligation to supplement, amend, update or revise anyof the forward-looking statements contained in this presentation.
The information and opinions contained in this document are provided as at the date of this presentation and are subject to change without notice.
This document has not been approved by any competent regulatory or supervisory authority.
Cautionary Note

3
AMG Advanced Metallurgical Group N.V.
Listed: NYSE-Euronext Amsterdam: AMG
Founded: 2006
Revenues: $990.5M Full Year 2010
Employees: 2,600
Facilities: Netherlands, Germany, UK, USA, Brazil, France,
Turkey, Canada, Czech Republic, China, Mexico,
Belgium, Poland, India, Sri Lanka
Market cap: €345.2M
Shares outstanding: 27.5M
52 week range: €6.25–€13.74
Recent share price: €12.55 (March 15, 2011)
Sustainable Metals Technology Products:
High purity raw materials, metals and complex metal products
Vacuum furnaces used to produce high purity metals

4
■ Serve growing end markets with high value-added specialty metal
products and engineering solutions, related to CO2 reduction and
conservation of natural resources
■ Execute through a combination of:■ Vertical integration
■ Industry consolidation
■ Continuous investment in productivity and technology
■ Serve the end markets of:■ Responsible energy production and use
■ Emerging market infrastructure
■ Aerospace and light weight materials
■ Specialty metals and chemicals
Strategic Focus

5
Advanced Materials
High-value alloys
Essential raw materials
Engineering Systems
Capital equipment for high purity
materials
Products & Markets
InfrastructureAerospaceEnergySpecialty Metals &
Chemicals
6
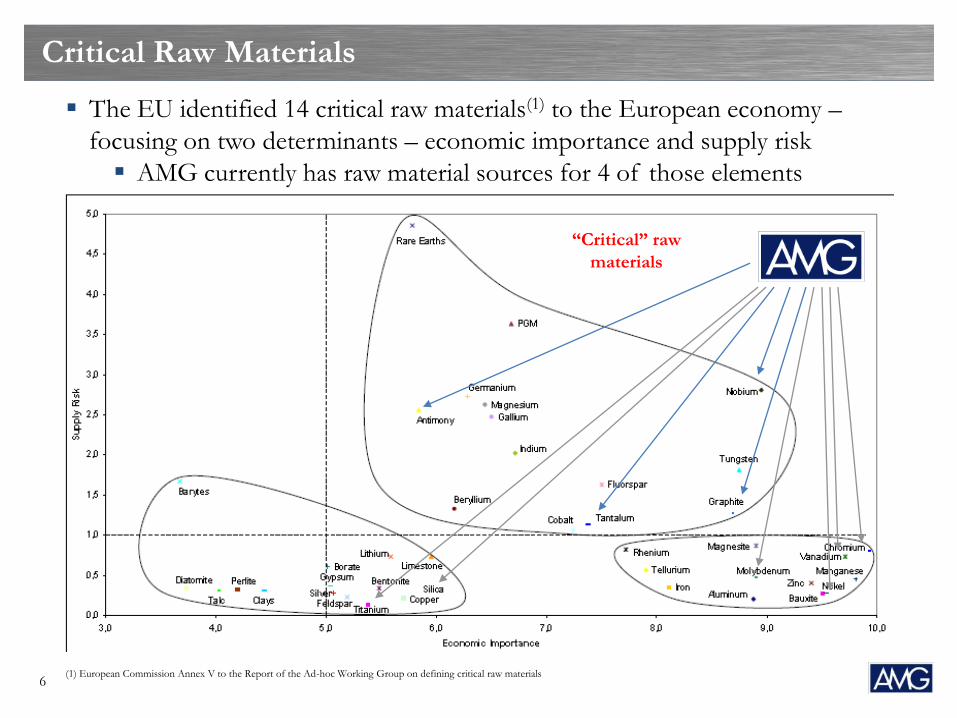
The EU identified 14 critical raw materials(1) to the European economy –
focusing on two determinants – economic importance and supply risk
AMG currently has raw material sources for 4 of those elements
Critical Raw Materials
“Critical” raw
materials
(1) European Commission Annex V to the Report of the Ad-hoc Working Group on defining critical raw materials

7
Critical Raw Materials – AMG’s activities
1
HHydrogen
1.0
3
LiLithium
6.9
11
NaSodium
23.0
19
KPotassium
39.1
37
RbRubidium
85.5
55
CsCaesium
132.9
87
FrFrancium
223.0
88
RaRadium
226.0
4
BeBeryllium
9.0
20
CaCalcium40.1
38
SrStrontium
87.6
56
BaBarium
137.4
39
YYitrium
88.9
57-71
89-103
21
ScScandium
45.0
22
TiTitanium
47.9
40
ZrZirconium
91.2
72
HfHafnium
178.5
104
RfRutherfordlium
261
23
VVanadium
50.9
41
NbNiobium
92.9
73
TaTantalum
181.0
105
DbDubnium
262
24
CrChromium
52.0
42
MoMolybdenum
95.9
74
WTungsten
183.9
106
SgSeaborgium
263
25
MnManganese
54.9
43
TcTechnetium
99
75
ReRhenium
186.2
107
BhBohrium
264
26
FeIron
55.9
44
RuRuthenium
101.0
76
OsOsmium
190.2
108
HsHassium
265
27
CoCobalt
58.9
45
RhRhodium
102.9
77
IrIridium
192.2
109
MtMeitnerium
266
28
NiNickel
58.7
46
PdPalladium
106.4
78
PtPlatinum
195.1
110
DsDarmstadtium
269
29
CuCopper
63.5
47
AgSilver
107.9
79
AuGold
197.0
111
RgRoentgenium
272
30
ZnZinc
65.4
48
CdCadmium
112.4
80
HgMercury
200.6
112
UumUnunbium
277
5
BBoron
10.8
13
AlAluminum
27.0
31
GaGallium
69.7
49
InIndium
114.8
81
TlThallium
204.4
113
UutUnuntrium
284
6
CCarbon
12.0
14
SiSilicon
28.1
32
GeGermanium
72.6
50
SnTin
118.7
82
PbLead
207.2
114
UuqUnunquadium
289
7
NNitrogen
14.0
15
PPhosphorus
31.0
33
AsArsenic
74.9
51
SbAntimony
121.8
83
BiBismuth
209.0
115
UupUnunpentium
288
8
OOxygen
16.0
16
SSulfur
32.1
34
SeSelenium
79.0
52
TeTellurium
127.6
84
PoPolonium
210.0
116
UuhUnunhexium
292
9
FFluorine
19.0
17
ClChlorine
35.5
35
BrBromine
79.9
53
IIodine
126.9
85
AtAstatine
210.0
2
HeHelium
4.0
10
NeNeon
20.2
18
ArArgon
40.0
36
KrKrypton
83.8
54
XeXenon
131.3
86
RnRadon
222.0
57
LaLanthanum
138.9
89
AcActinium
132.9
90
ThThorium
232.0
58
CeCerium
140.1
59
PrPraseodymium
140.9
91
PaProtactinium
231.0
60
NdNeodymium
144.2
92
UUranium
238.0
61
PmPromethium
147.0
93
NpNeptunium
237.0
62
SmSamarium
150.4
94
PuPlutonium
242.0
62
EuEuropium
152.0
95
AmAmericium
243.0
64
GdGadolinium
157.3
96
CmCurium
247.0
65
TbTerbium
158.9
97
BkBerkelium
247.0
66
DyDysprosium
162.5
98
CfCalifornium
251.0
67
HoHolmium
164.9
99
EsEinsteinium
254.0
68
ErErbium
167.3
100
FmFermium
253.0
69
TmThallium
168.9
101
MdMendelevium
256.0
70
YbYtterbium
173.0
102
NoNobelium
254.0
71
LuLutetium
175.0
103
LrLawrencium
257.0
12
MgMagnesium
24.3
AMG manufactures products with these elements
AMG has development projects with these elements

8
Graphite
Primary producers of selected critical raw materials
Critical Raw Materials
Antimony Graphite
Lithium Magnesium
Silicon Titanium
Vanadium
Tantalum
Niobium
Chromium
Vanadium
Tantalum
Tantalum
Titanium Vanadium
Chromium Magnesium
Titanium
MagnesiumTitanium
Lithium
Tantalum
Antimony
Graphite
Chromium
Magnesium
AMG raw material
mines
9
■ Acquired aluminum master alloy producer KB Alloys, LLC for
$23.5 million
■ Signed agreements to supply tantalum concentrate production
through the end of 2012
■ Acquired intellectual property and manufacturing assets related to
the “Mono2™” suite of solar casting technologies
■ Acquired an additional 8.5% of Graphit Kropfmühl’s common
shares
Recent Developments

10
Advanced Materials - Market, Products and Customers
Products
Aerospace
Specialty alloys for titanium
Coatings for wear
resistance
Infrastructure - FeV
Ferro-vanadium
Ferro-nickel molybdenum
Specialty Metals
Competitors Reading Alloys Inc.
Evraz Group S.A.
(Stratcor)
Evraz Group S.A. (Highveld
Steel & Vanadium)
Eramet S.A. (Gulf Chemical
& Metallurgical Corporation)
Evraz Group S.A. (Stratcor)
Xstrata plc
Chengde Vanadium &
Titanium Stock Co. Ltd.
KBM Affilips B.V.
Sunxing Chemical and
Metallurgical Materials Co
Delachaux S.A.
Campine S.A.
Chemtura Corporation
Sample Customers
Chromium Metals
Tantalum
Antimony
Aluminium master alloys

11
Advanced Materials - Specialty metals pricing
$0
$5
$10
$15
$20
$25
$30
$35
$40
$45
2007 2008 2009 2010 2011
Pri
ce /
Po
un
d –
V,
Mo
, N
i
Ferro Vanadium Molybdenum Nickel
AMG IPO
Increase from 2009 lows:
FeV: 67%
Mo: 123%
Ni: 173%
Prices are still below pre-crisis levels;
correlated to demand for North American carbon and stainless steel

12
Engineering Systems – Market, Products and Customers
Energy - Solar
Solar silicon melting and
crystallisation systems-
DSS furnaces
Mono2™ technology
Aerospace
Vacuum Melting and Re-
melting Systems
Precision Casting and
Coating Systems
Heat Treatment with high
pressure gas quenching
Energy - Nuclear
Vacuum Sintering
Systems for nuclear fuel
Development project for
the safe storage of
nuclear waste
Competitors GT Solar International,
Inc.
PVA TePla AG
Chinese producers
Inteco Specialty Melting
Technologies GmbH
Consarc Corporation
Aichelin GmbH
No significant competition
Sample Customers
Products
(1) Market shares are an AMG management estimate.

13
Graphit Kropfmühl – Market, Products and Customers
Energy - Solar
Silicon metal for
polycrystalline for solar
cells
Specialty Metals & Chemicals
Natural graphite for
insulation, transportation
and industrial uses
Silicon metal for aluminium
and silicones
Competitors Bluestar Silicone Materials Ltd.
Globe Specialty Metals Inc.
Grupo FerroAtlantica, S.L.
Timminco Limited
Dow Corning Corporation
Wacker Chemie AG
Asbury Graphite Mills, Inc.
SGL Carbon SE
Qingdao Graphite Company, Ltd
Sample Customers
Products

14
Financial Overview

15
End Markets – by the Numbers
2010 Gross Margin by
End Market
2010 Revenue by End
Market
Energy - Solar & Nuclear 21%
Aerospace 26%
Infrastructure -Recycling 16%
Specialty Metals &
Chemicals 36%
Energy - Solar & Nuclear 26%
Aerospace 30%
Infrastructure -Recycling 19%
Specialty Metals &
Chemicals 24%

16
Revenue by Geography
AMG generated less than 3% of 2010 revenue from Japan
2010 Revenue
AMG
2010 Revenue
AMD
2010 Revenue
ESD
2010 Revenue
GK

17
Financial Highlights 2010
2010 Revenue $990.5 2010 Gross Profit $178.6
in millions

18
$12.4
$22.0$23.9
$18.8 $20.2
Q4 09 Q1 10 Q2 10 Q3 10 Q4 10
Financial Highlights
$231.4 $235.8 $243.5 $240.4
$270.7
Q4 09 Q1 10 Q2 10 Q3 10 Q4 10
(in millions)
(in millions)
Q4 Revenue: $270.7 million
Up 17% from Q4 2009
Q4 EBITDA: $20.2 million
Up 62% from Q4 2009
Q4 EPS: $0.10 (1)
Up from $0.03 in Q4 2009 (1)
YTD Revenue: $990.5 million
Up 14% from YTD 2009
YTD EBITDA: $84.9 million
Up 23% from YTD 2009
YTD EPS: $0.52 (1)
Up from ($0.39) YTD 2009 (1)
HighlightsRevenue
EBITDA
(1) Excluding the equity losses from AMG’s 42.5% ownership in Timminco Limited

19
Advanced Materials
Financial Summary Highlights
( in millions)
$5.3 $8.5$14.2 $9.4 $7.7
$95.9
$140.5
$152.0 $154.9$168.9
Q4 09 Q1 10 Q2 10 Q3 10 Q4 10
Revenue EBITDA ■ Infrastructure - ferrovanadium
■ Reference prices increased 21% v. Q4
2009
■ Volumes improved 30% v. Q4 2009
■ Ferronickel-molybdenum demand
increased 51% v. Q4 2009
■ Aerospace – master alloys prices improved 20%
v. Q4 2009; volumes improved 203%
■ CAPEX
■ Expansion of ferrovanadium operations
and solar thin film coatings facility
- - - - -
$5.0
$3.3$4.2
$5.6$7.3
Q4 09 Q1 10 Q2 10 Q3 10 Q4 10
CAPEX

20
Engineering Systems
Financial Summary Highlights
( in millions)
- - - - -$5.9
$12.1 $8.0 $7.4 $10.0
$73.8 $65.3
$59.5
$53.2
$67.7
Q4 09 Q1 10 Q2 10 Q3 10 Q4 10
Revenue EBITDA
- - - - -
$3.0
$0.8 $1.3$0.8
$4.9
Q4 09 Q1 10 Q2 10 Q3 10 Q4 10
CAPEX
Q4 revenue decreased 8% v. Q4 2009
Solar silicon DSS furnace revenues
decreased 44% in Q4 2010 v. Q4 2009
Q4 EBITDA increased 69% v. Q4 2009
December 31, 2010 Backlog improved to
$183.3 million from $147.1 million at
September 30, 2010
Order intake $107.6 million in Q4 2010
1.59x book to bill ratio
Diversified backlog - solar, aerospace
and transportation

21
Graphit Kropfmühl
Financial Summary Highlights
( in millions)
- - - - -$1.2 $1.5 $1.7 $2.0 $2.5
$33.3
$29.9$32.1 $32.4
$34.2
Q4 09 Q1 10 Q2 10 Q3 10 Q4 10
Revenue EBITDA
- - - - -
$0.8$1.0
$1.3
$0.7
$1.7
Q4 09 Q1 10 Q2 10 Q3 10 Q4 10
CAPEX
Q4 revenue increased 3% v. Q4 2009
Decrease in silicon metal revenues due to
lower contract prices
Silicon metal down 3%
Natural graphite up 16%
Q4 EBITDA increased 105% v. Q4 2009
Lower revenues and higher costs in
silicon metal
Silicon metal up $0.9 million
Natural graphite up $0.4 million
CAPEX for graphite milling expansion

22
Capital Base
■ Cash: $89.3 million
■ Total debt: $237.1 million
■ Net debt: $147.8 million
■ Revolver availability: $47.8 million
■ Total liquidity $137.1 million
Note: Cash includes short term investments
$117.0
$98.9
$84.6$90.2
$89.3
$203.8 $203.0 $204.3
$234.8 $237.1
Q4 09 Q1 10 Q2 10 Q3 10 Q4 10
Cash Debt
( in millions)
Cash and Debt – December 31, 2010 Summary

23
Outlook
■ Advanced Materials
■ Rising prices and demand for many products
■ Revenue and earnings growth driven by antimony, tantalum and aluminum alloys
■ Engineering Systems
■ Backlog is increasing; renewed interest in solar silicon furnaces
■ Order intake driven by titanium, solar and specialty steel markets
■ Graphit Kropfmühl
■ AMG owns 88% of GK
■ Silicon metal pricing is improving; demand for natural graphite is increasing
■ Timminco
■ AMG owns 42.5% of Timminco; not consolidated

24
Appendix

25
Consolidated Balance Sheet
in thousands
December 31, 2010 December 31, 2009
Fixed Assets 228,612 211,022
Goodwill and Intangibles 27,002 28,253
Other Non-current Assets 80,714 78,209
Inventories 207,204 193,378
Receivables 175,421 147,787
Other Current Assets 46,811 35,313
Cash 89,311 117,016
TOTAL ASSETS 855,075 810,978
TOTAL EQUITY 233,965 228,423
Long-term Debt 187,813 168,319
Pension Liabilities 88,372 91,358
Other Long-term Liabilities 52,900 51,249
Current Debt 49,276 35,477
Accounts Payable 102,253 69,791
Advance Payments 49,597 54,764
Accruals 43,287 46,179
Other Current Liabilities 47,612 65,418
TOTAL LIABILITIES 621,110 582,555
TOTAL LIABILITIES AND EQUITY 855,075 810,978

26
Consolidated Income Statement
in thousands
Q4 2010 Q4 2009
Revenue 270,731 231,388
Cost of sales 221,349 185,034
Gross profit 49,382 46,354
Selling, general and admin. 36,765 42,605
Asset impairment and restructuring 1,019 3,805
Environmental 5,658 (164)
Other income (383) (1,732)
Operating profit 6,323 1,840
Net finance costs 2,042 4,162
Share of income (loss) of associates 7,569 (29,273)
Profit (loss) before income taxes 11,850 (31,595)
Income tax benefit (110) (2,436)
Profit (loss) for the year from continuing operations 11,960 (29,159)
Profit after tax for the year from discontinued operations - 202
Profit (loss) for the year 11,960 (28,957)
Attributable to:
Shareholders of the Company 12,481 (30,227)
Non-controlling interest (521) 1,270

27
Consolidated Cash Flows
in thousands
Twelve months ended
December 31, 2010
Twelve months ended
December 31, 2009
Cash Flows from Operations (1,623) (2,091)
Capital Expenditures (32,973) (25,532)
Other Investing Activities (29,599) (64,649)
Cash Flows from Investing Activities (62,572) (90,181)
Cash Flows from Financing Activities 42,352 62,638
Net decrease in cash (21,843) (29,634)
Beginning Cash 117,016 143,473
Effects of exchange rates on cash (5,862) 3,177
Ending Cash 89,311 117,016