Embed Size (px)
DESCRIPTION
Citation preview

255
255
255
0
77
148
215
38
19
113
120
125
185
191
194
227
230
232
136
154
199
208
213
233
0
0
0
118
175
55
255
223
79
255
154
5 1
SEMPERIT GROUP
INVESTOR PRESENTATION
FY 2013
27 March 2014

255
255
255
0
77
148
215
38
19
113
120
125
185
191
194
227
230
232
136
154
199
208
213
233
0
0
0
118
175
55
255
223
79
255
154
5
Key Highlights
Operational Development
Financial Performance
Outlook
Agenda
2 Investor Presentation I 27 March 2014 I Investor Relations
255
255
255
0
77
148
215
38
19
113
120
125
185
191
194
227
230
232
136
154
199
208
213
233
0
0
0
118
175
55
255
223
79
255
154
5
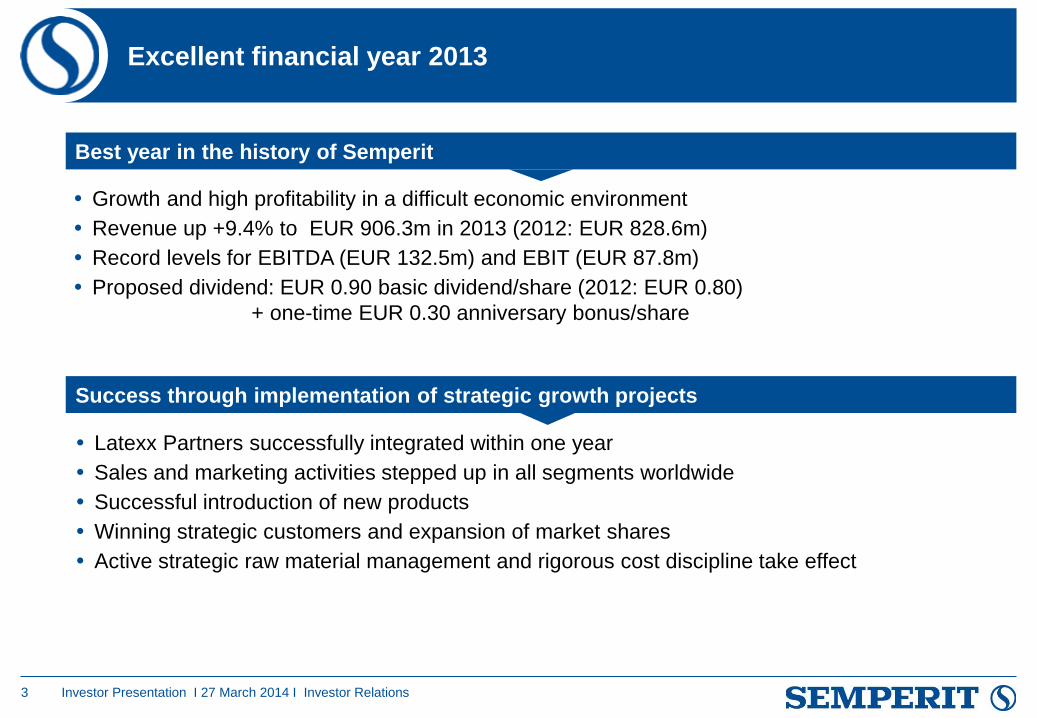
Excellent financial year 2013
3
Growth and high profitability in a difficult economic environment
Revenue up +9.4% to EUR 906.3m in 2013 (2012: EUR 828.6m)
Record levels for EBITDA (EUR 132.5m) and EBIT (EUR 87.8m)
Proposed dividend: EUR 0.90 basic dividend/share (2012: EUR 0.80)
+ one-time EUR 0.30 anniversary bonus/share
Best year in the history of Semperit
Latexx Partners successfully integrated within one year
Sales and marketing activities stepped up in all segments worldwide
Successful introduction of new products
Winning strategic customers and expansion of market shares
Active strategic raw material management and rigorous cost discipline take effect
Success through implementation of strategic growth projects
Investor Presentation I 27 March 2014 I Investor Relations
255
255
255
0
77
148
215
38
19
113
120
125
185
191
194
227
230
232
136
154
199
208
213
233
0
0
0
118
175
55
255
223
79
255
154
5
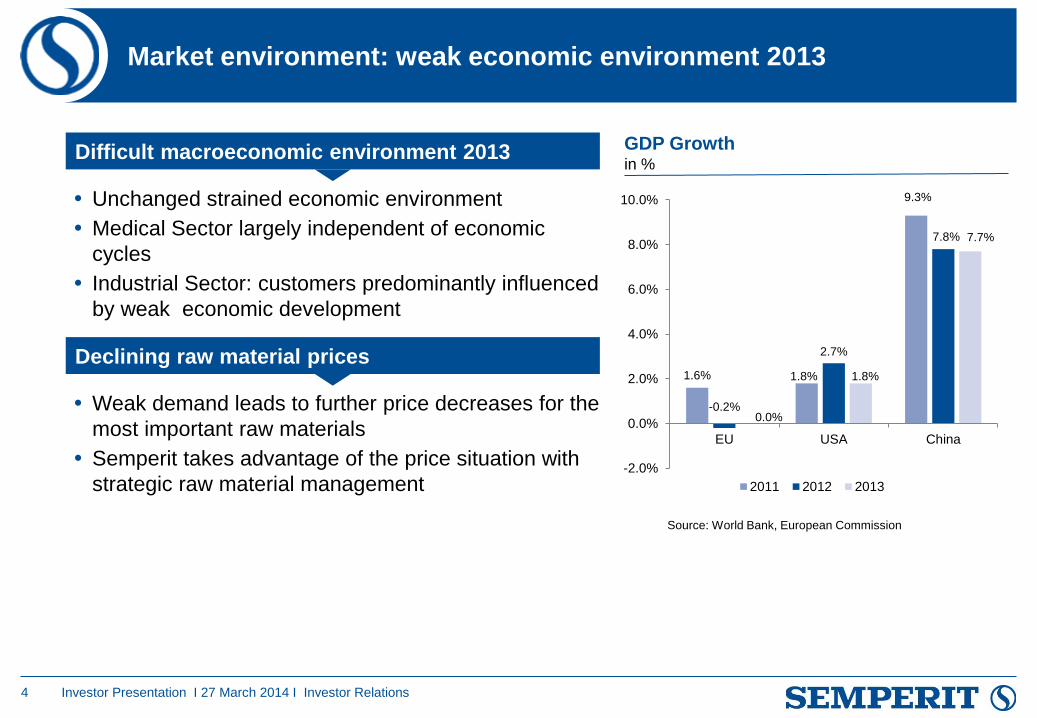
Market environment: weak economic environment 2013
4
Unchanged strained economic environment
Medical Sector largely independent of economic
cycles
Industrial Sector: customers predominantly influenced
by weak economic development
Difficult macroeconomic environment 2013
Weak demand leads to further price decreases for the
most important raw materials
Semperit takes advantage of the price situation with
strategic raw material management
Declining raw material prices
Investor Presentation I 27 March 2014 I Investor Relations
GDP Growth in %
1.6% 1.8%
9.3%
-0.2%
2.7%
7.8%
0.0%
1.8%
7.7%
-2.0%
0.0%
2.0%
4.0%
6.0%
8.0%
10.0%
EU USA China
2011 2012 2013
Source: World Bank, European Commission

255
255
255
0
77
148
215
38
19
113
120
125
185
191
194
227
230
232
136
154
199
208
213
233
0
0
0
118
175
55
255
223
79
255
154
5
Key Highlights
Operational Development
Financial Performance
Outlook
Agenda
5 Investor Presentation I 27 March 2014 I Investor Relations

255
255
255
0
77
148
215
38
19
113
120
125
185
191
194
227
230
232
136
154
199
208
213
233
0
0
0
118
175
55
255
223
79
255
154
5
Population increase to
9.6 billion people by 2050 (2013: 7.2 billion).1)
Growing prosperity in emerging markets.
Improved hygiene standards in the
emerging markets.
Increasing life expectancy and shift in age
pyramid in industrialised nations.
Medical Sector:
Megatrends as long-term growth drivers
6
Growth market healthcare
1) UNO
Consumption of examination gloves
per capita and year in units
150 - 160
60 - 70
25 - 30 10 - 20
USA Europe Latin America Asia
Source: Semperit
Investor Presentation I 27 March 2014 I Investor Relations

255
255
255
0
77
148
215
38
19
113
120
125
185
191
194
227
230
232
136
154
199
208
213
233
0
0
0
118
175
55
255
223
79
255
154
5
Sempermed 2013:
Global Growth
7
Successful integration of Latexx Partners enables growth
Sempermed headquarters in Singapore has proven successful
Sempermed grows faster than the market
Capacity utilisation of production facilities above 80%
Examination gloves with strong demand in Europe and the USA
Strong development of application areas industrial and
consumer goods
Business Development
Investor Presentation I 27 March 2014 I Investor Relations
255
255
255
0
77
148
215
38
19
113
120
125
185
191
194
227
230
232
136
154
199
208
213
233
0
0
0
118
175
55
255
223
79
255
154
5
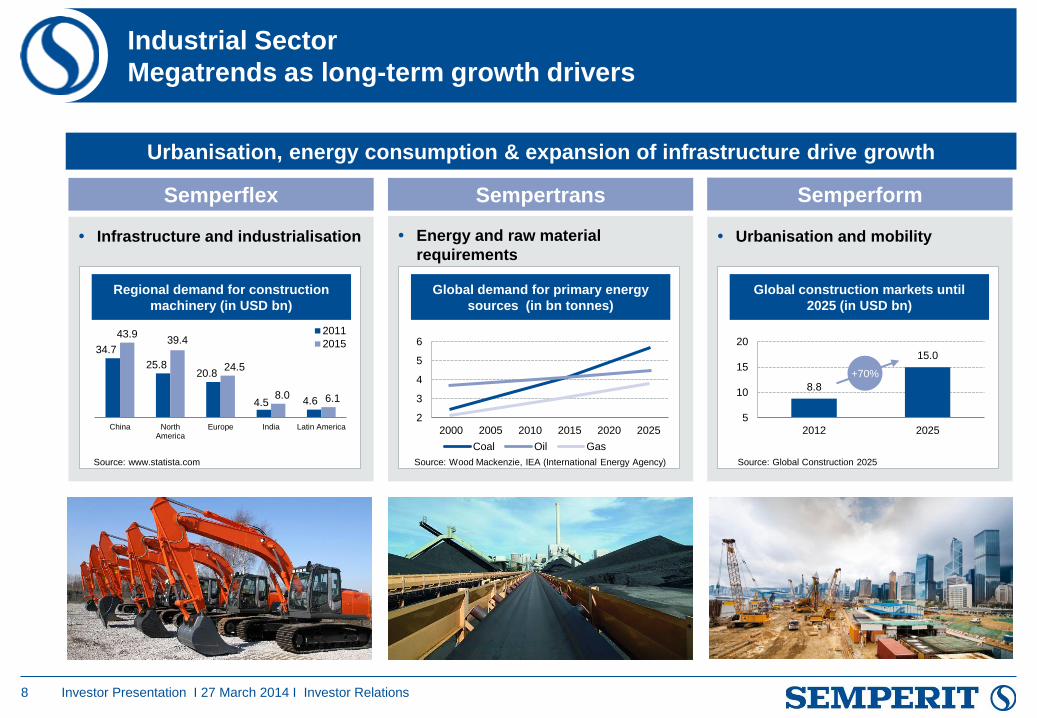
Industrial Sector
Megatrends as long-term growth drivers
8
Urbanisation, energy consumption & expansion of infrastructure drive growth
Energy and raw material
requirements
Semperflex Semperform Sempertrans
Infrastructure and industrialisation Urbanisation and mobility
2
3
4
5
6
2000 2005 2010 2015 2020 2025
Coal Oil Gas
Regional demand for construction
machinery (in USD bn)
Global construction markets until
2025 (in USD bn)
Global demand for primary energy
sources (in bn tonnes)
8.8
15.0
5
10
15
20
2012 2025
Source: www.statista.com Source: Wood Mackenzie, IEA (International Energy Agency) Source: Global Construction 2025
+70%
34.7
25.8 20.8
4.5 4.6
43.9 39.4
24.5
8.0 6.1
China NorthAmerica
Europe India Latin America
2011
2015
Investor Presentation I 27 March 2014 I Investor Relations

255
255
255
0
77
148
215
38
19
113
120
125
185
191
194
227
230
232
136
154
199
208
213
233
0
0
0
118
175
55
255
223
79
255
154
5
Semperflex 2013:
Market share gains in Europe and Asia
9
Growth despite weak economy
Increased internationalisation and sales campaign successful
Optimal use of market consolidation to win new customers
Hydraulic hoses: strong business in Europe and recovery in
the USA
Industrial hoses: expansion of the leading market position in
Europe and first strategic steps in the USA and Asia
Business Development
Investor Presentation I 27 March 2014 I Investor Relations

255
255
255
0
77
148
215
38
19
113
120
125
185
191
194
227
230
232
136
154
199
208
213
233
0
0
0
118
175
55
255
223
79
255
154
5
Sempertrans 2013:
New strategy and the right products prove successful
10
Very good development confirms sustainable turnaround
Internationalisation with increased sales activities in South
America, Asia and Africa continued
Major contracts for a new energy-saving conveyor belt with
German energy company RWE and in Poland
Very good capacity utilisation and start of capacity expansion
in Bełchatów/Poland
Business Development
Investor Presentation I 27 March 2014 I Investor Relations
255
255
255
0
77
148
215
38
19
113
120
125
185
191
194
227
230
232
136
154
199
208
213
233
0
0
0
118
175
55
255
223
79
255
154
5
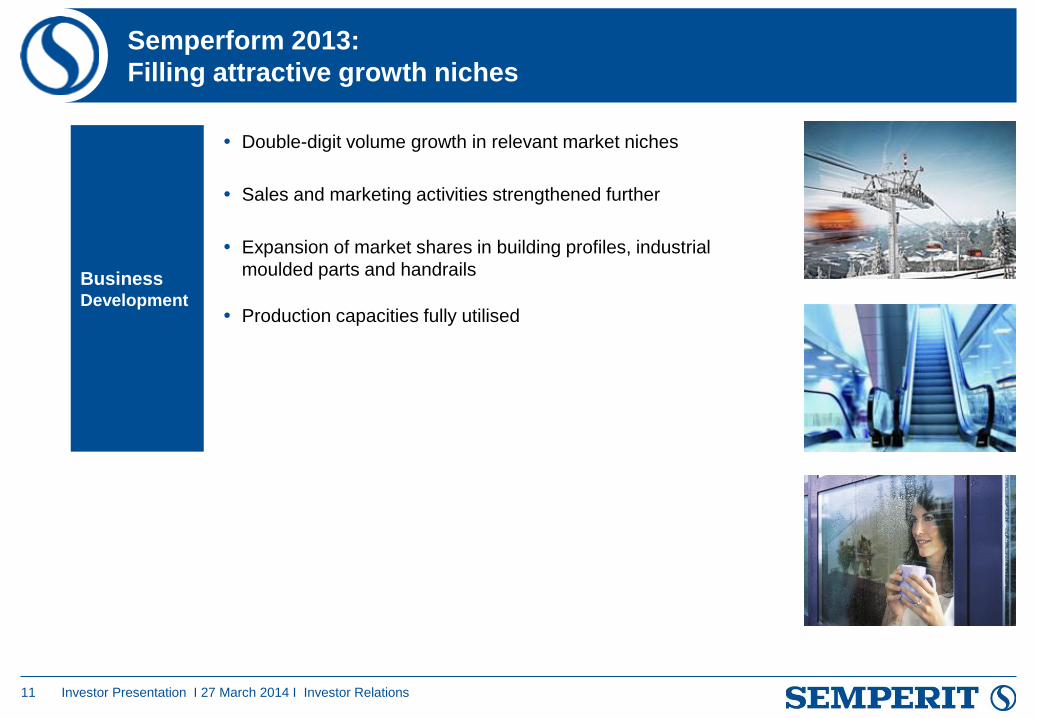
Semperform 2013:
Filling attractive growth niches
11
Double-digit volume growth in relevant market niches
Sales and marketing activities strengthened further
Expansion of market shares in building profiles, industrial
moulded parts and handrails
Production capacities fully utilised
Business Development
Investor Presentation I 27 March 2014 I Investor Relations

255
255
255
0
77
148
215
38
19
113
120
125
185
191
194
227
230
232
136
154
199
208
213
233
0
0
0
118
175
55
255
223
79
255
154
5
Key Highlights
Operational Development
Financial Performance
Outlook
Agenda
12 Investor Presentation I 27 March 2014 I Investor Relations
255
255
255
0
77
148
215
38
19
113
120
125
185
191
194
227
230
232
136
154
199
208
213
233
0
0
0
118
175
55
255
223
79
255
154
5
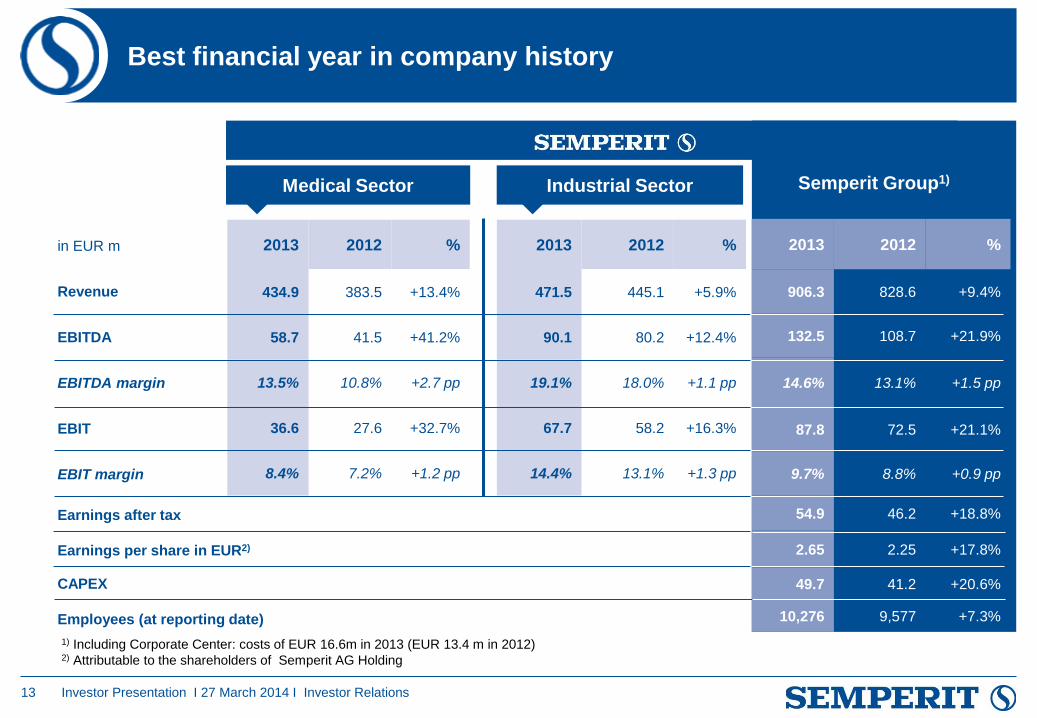
Best financial year in company history
13
2013 2012 %
434.9 383.5 +13.4%
58.7 41.5 +41.2%
13.5% 10.8% +2.7 pp
36.6 27.6 +32.7%
8.4% 7.2% +1.2 pp
in EUR m
Revenue
EBITDA
EBITDA margin
EBIT
EBIT margin
Earnings after tax
Earnings per share in EUR2)
CAPEX
Employees (at reporting date)
Medical Sector Industrial Sector
2013 2012 %
471.5 445.1 +5.9%
90.1 80.2 +12.4%
19.1% 18.0% +1.1 pp
67.7 58.2 +16.3%
14.4% 13.1% +1.3 pp
2013 2012 %
906.3 828.6 +9.4%
132.5 108.7 +21.9%
14.6% 13.1% +1.5 pp
87.8 72.5 +21.1%
9.7% 8.8% +0.9 pp
54.9 46.2 +18.8%
2.65 2.25 +17.8%
49.7 41.2 +20.6%
10,276 9,577 +7.3%
Semperit Group1)
1) Including Corporate Center: costs of EUR 16.6m in 2013 (EUR 13.4 m in 2012) 2) Attributable to the shareholders of Semperit AG Holding
Investor Presentation I 27 March 2014 I Investor Relations
255
255
255
0
77
148
215
38
19
113
120
125
185
191
194
227
230
232
136
154
199
208
213
233
0
0
0
118
175
55
255
223
79
255
154
5
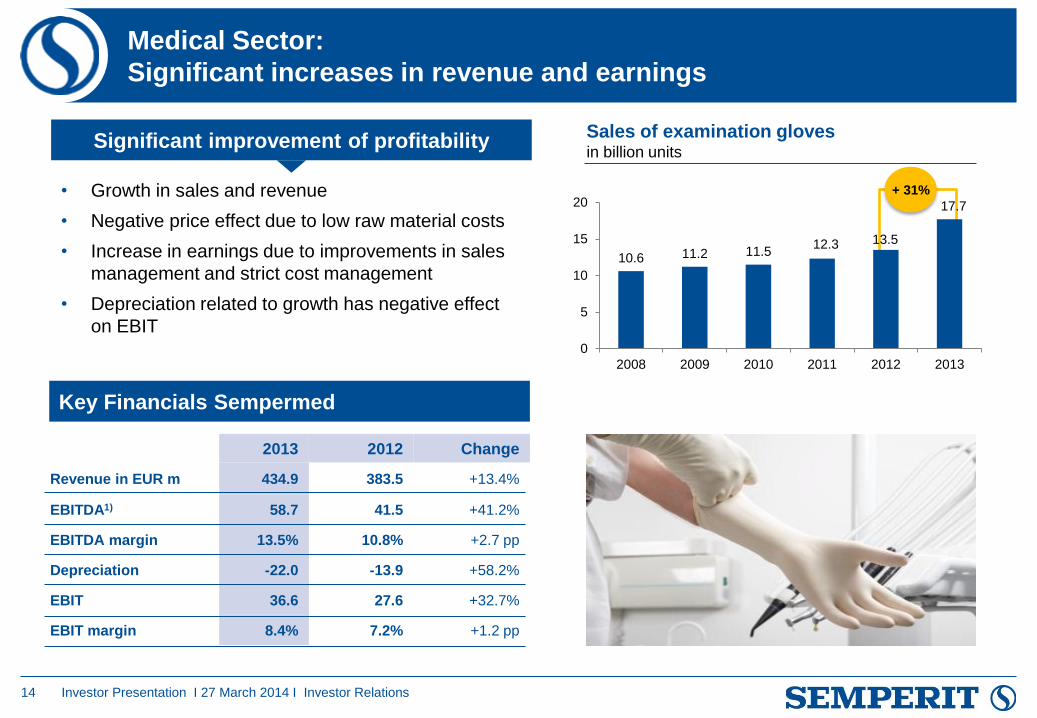
Medical Sector:
Significant increases in revenue and earnings
14
2013 2012 Change
Revenue in EUR m 434.9 383.5 +13.4%
EBITDA1) 58.7 41.5 +41.2%
EBITDA margin 13.5% 10.8% +2.7 pp
Depreciation -22.0 -13.9 +58.2%
EBIT 36.6 27.6 +32.7%
EBIT margin 8.4% 7.2% +1.2 pp
Significant improvement of profitability
• Growth in sales and revenue
• Negative price effect due to low raw material costs
• Increase in earnings due to improvements in sales
management and strict cost management
• Depreciation related to growth has negative effect
on EBIT
Key Financials Sempermed
Investor Presentation I 27 March 2014 I Investor Relations
Sales of examination gloves in billion units
+ 31%
10.6 11.2 11.5 12.3 13.5
17.7
0
5
10
15
20
2008 2009 2010 2011 2012 2013
255
255
255
0
77
148
215
38
19
113
120
125
185
191
194
227
230
232
136
154
199
208
213
233
0
0
0
118
175
55
255
223
79
255
154
5
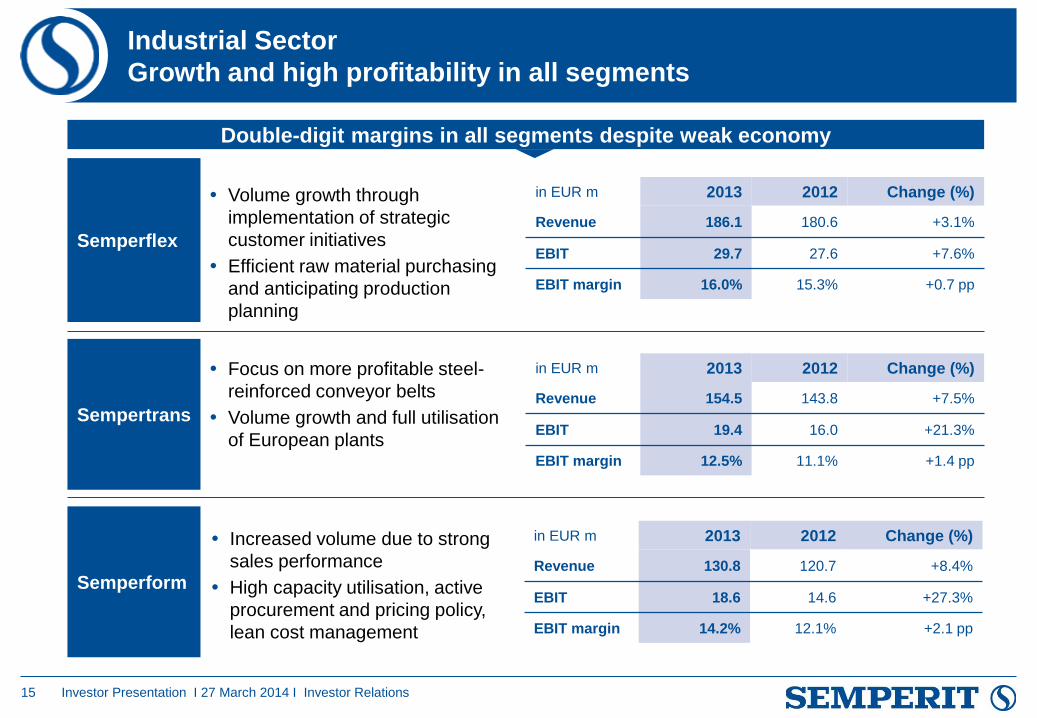
Industrial Sector
Growth and high profitability in all segments
15
Semperflex
Sempertrans
Semperform
Volume growth through
implementation of strategic
customer initiatives
Efficient raw material purchasing
and anticipating production
planning
Focus on more profitable steel-
reinforced conveyor belts
Volume growth and full utilisation
of European plants
Increased volume due to strong
sales performance
High capacity utilisation, active
procurement and pricing policy,
lean cost management
in EUR m 2013 2012 Change (%)
Revenue 186.1 180.6 +3.1%
EBIT 29.7 27.6 +7.6%
EBIT margin 16.0% 15.3% +0.7 pp
Double-digit margins in all segments despite weak economy
in EUR m 2013 2012 Change (%)
Revenue 154.5 143.8 +7.5%
EBIT 19.4 16.0 +21.3%
EBIT margin 12.5% 11.1% +1.4 pp
in EUR m 2013 2012 Change (%)
Revenue 130.8 120.7 +8.4%
EBIT 18.6 14.6 +27.3%
EBIT margin 14.2% 12.1% +2.1 pp
Investor Presentation I 27 March 2014 I Investor Relations

255
255
255
0
77
148
215
38
19
113
120
125
185
191
194
227
230
232
136
154
199
208
213
233
0
0
0
118
175
55
255
223
79
255
154
5
Excellent cash position and high internal financing capability
16
Cash flow in EUR m
Cash flow from operating activities up 29% to
EUR 137.2m
Cash flow from investing activities at EUR -47.8m after
EUR -151.6m in 2012
(Acquisition of Latexx Partners in 2012)
Cash flow from financing activities amounting to
EUR -32.4m (2012: EUR 80.7m) was characterised by:
Issue of Corporate Schuldschein loan
Repayment of credit lines
Dividend payments
Increase in shareholding in Latexx Partners from
85% to 98%
Cash and cash equivalents rise by 37% to EUR 182.6m
(2012: EUR 133.3m).
Highlights 2013
Investor Presentation I 27 March 2014 I Investor Relations
133.3
-7.7
182.6
Currency effects
Other Items -10.7
Latexx Partners -19.5
CAPEX
Dividend -16.5
Repayment of credits -108,4
Corp. Schuldschein loan +124,6
-49,6
Working capital +21.0
Cash flow from results +116,2
Cash and cash
equivalents 1.1.2013
Cash and cash
equivalents 31.12.2013
+116.2
-108.4
+124.6
-49.6
255
255
255
0
77
148
215
38
19
113
120
125
185
191
194
227
230
232
136
154
199
208
213
233
0
0
0
118
175
55
255
223
79
255
154
5
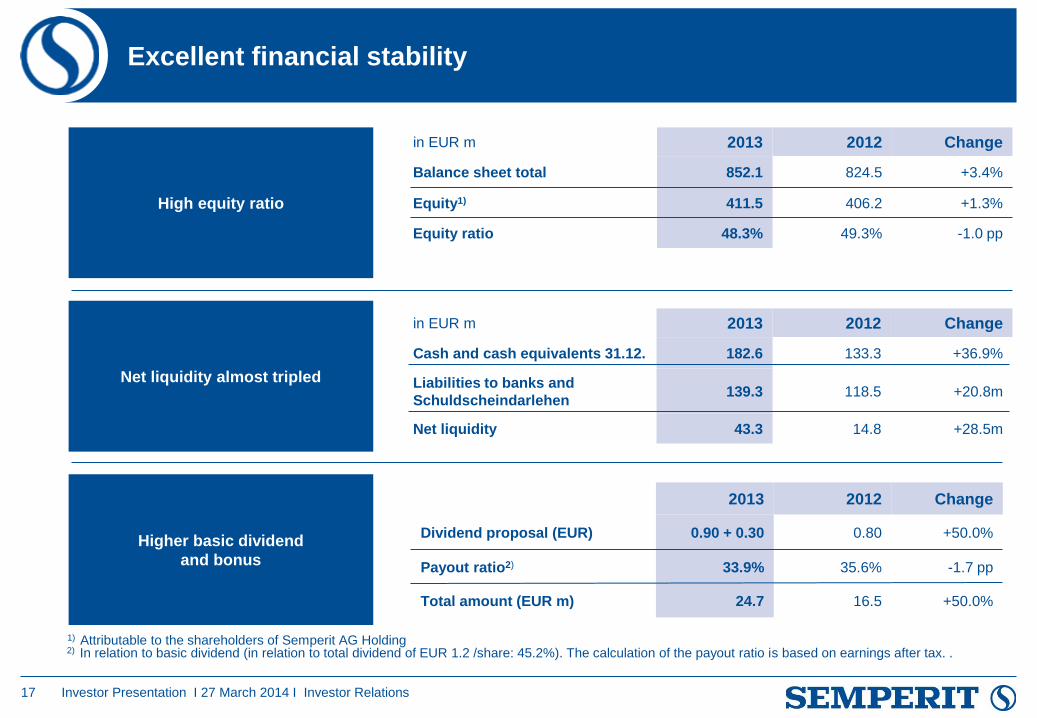
Excellent financial stability
17
in EUR m 2013 2012 Change
Balance sheet total 852.1 824.5 +3.4%
Equity1) 411.5 406.2 +1.3%
Equity ratio 48.3% 49.3% -1.0 pp
in EUR m 2013 2012 Change
Cash and cash equivalents 31.12. 182.6 133.3 +36.9%
Liabilities to banks and
Schuldscheindarlehen 139.3 118.5 +20.8m
Net liquidity 43.3 14.8 +28.5m
2013 2012 Change
Dividend proposal (EUR) 0.90 + 0.30 0.80 +50.0%
Payout ratio2) 33.9% 35.6% -1.7 pp
Total amount (EUR m) 24.7 16.5 +50.0%
High equity ratio
Net liquidity almost tripled
Higher basic dividend
and bonus
1) Attributable to the shareholders of Semperit AG Holding 2) In relation to basic dividend (in relation to total dividend of EUR 1.2 /share: 45.2%). The calculation of the payout ratio is based on earnings after tax. .
Investor Presentation I 27 March 2014 I Investor Relations
255
255
255
0
77
148
215
38
19
113
120
125
185
191
194
227
230
232
136
154
199
208
213
233
0
0
0
118
175
55
255
223
79
255
154
5
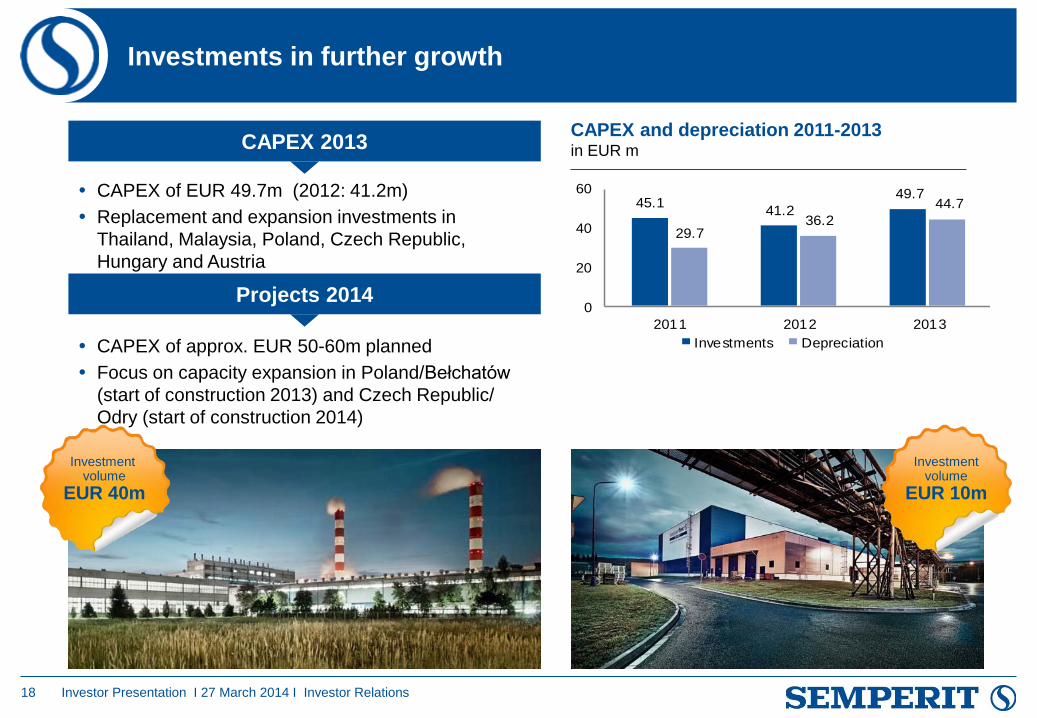
Investments in further growth
18
CAPEX 2013
Projects 2014
CAPEX of approx. EUR 50-60m planned
Focus on capacity expansion in Poland/Bełchatów
(start of construction 2013) and Czech Republic/
Odry (start of construction 2014)
CAPEX of EUR 49.7m (2012: 41.2m)
Replacement and expansion investments in
Thailand, Malaysia, Poland, Czech Republic,
Hungary and Austria
Investment volume
EUR 40m
Investment volume
EUR 10m
Investor Presentation I 27 March 2014 I Investor Relations
CAPEX and depreciation 2011-2013 in EUR m
45.141.2
49.7
29.736.2
44.7
0
20
40
60
2011 2012 2013
Investments Depreciation

255
255
255
0
77
148
215
38
19
113
120
125
185
191
194
227
230
232
136
154
199
208
213
233
0
0
0
118
175
55
255
223
79
255
154
5
Performance of the Semperit share
19
Semperit share vs. ATX 2013 in EUR m
Key figures Semperit share
26
28
30
32
34
36
38
40
Jan Feb March April May June July Aug Sep Oct Nov Dec 2013
ATX
+6.1%
Semperit
+14.8%
Key figures 2013 2012
Share price at 31.12. in EUR 36.00 31.36
Lowest price in EUR 26.86 26.65
Highest price in EUR 38.22 33.90
Market capitalisation at 31.12. in EUR m 740.6 645.2
Price/earnings ratio 13.6 13.9
Earnings per share in EUR 2.65 2.25
Dividend per share in EUR 0.90 0.80
Dividend payout ratio basic dividend 33.9% 35.6%
Anniversary bonus in EUR 0.30 –
Dividend payout ratio
incl. anniversary bonus 45.2% 35.6%
Investor Presentation I 27 March 2014 I Investor Relations

255
255
255
0
77
148
215
38
19
113
120
125
185
191
194
227
230
232
136
154
199
208
213
233
0
0
0
118
175
55
255
223
79
255
154
5
Key Highlights
Operational Development
Financial Performance
Outlook
Agenda
20 Investor Presentation I 27 March 2014 I Investor Relations
255
255
255
0
77
148
215
38
19
113
120
125
185
191
194
227
230
232
136
154
199
208
213
233
0
0
0
118
175
55
255
223
79
255
154
5
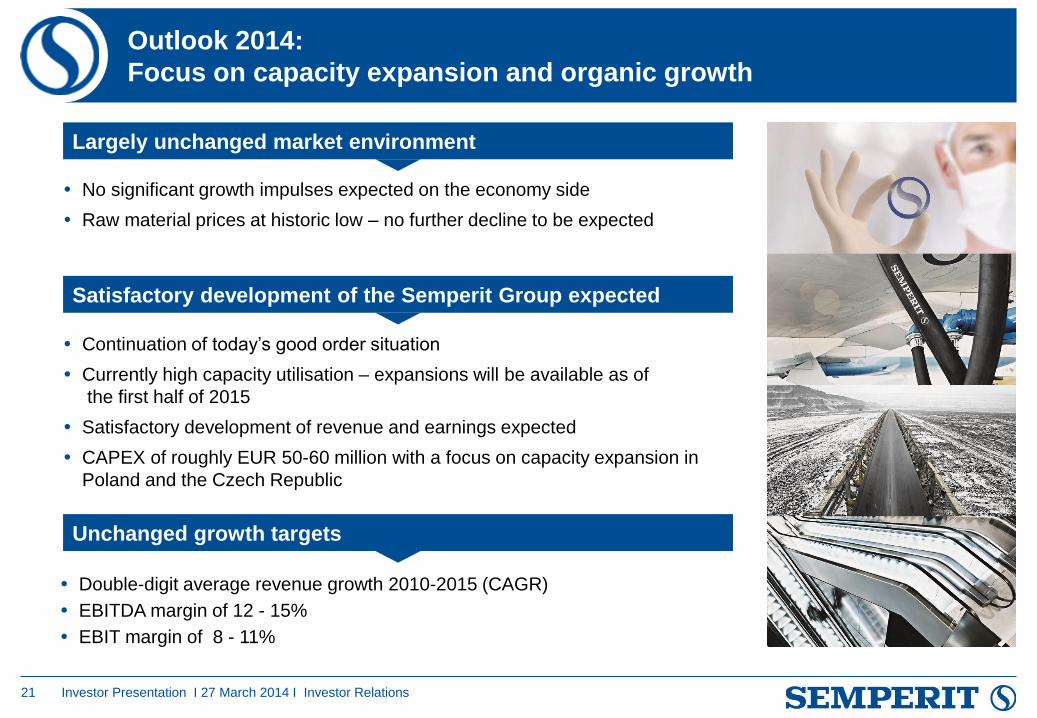
Outlook 2014:
Focus on capacity expansion and organic growth
21
Satisfactory development of the Semperit Group expected
Unchanged growth targets
Continuation of today’s good order situation
Currently high capacity utilisation – expansions will be available as of
the first half of 2015
Satisfactory development of revenue and earnings expected
CAPEX of roughly EUR 50-60 million with a focus on capacity expansion in
Poland and the Czech Republic
No significant growth impulses expected on the economy side
Raw material prices at historic low – no further decline to be expected
Double-digit average revenue growth 2010-2015 (CAGR)
EBITDA margin of 12 - 15%
EBIT margin of 8 - 11%
Largely unchanged market environment
Investor Presentation I 27 March 2014 I Investor Relations
255
255
255
0
77
148
215
38
19
113
120
125
185
191
194
227
230
232
136
154
199
208
213
233
0
0
0
118
175
55
255
223
79
255
154
5 22
SEMPERIT GROUP
INVESTOR PRESENTATION
FY 2013
27 March 2014

255
255
255
0
77
148
215
38
19
113
120
125
185
191
194
227
230
232
136
154
199
208
213
233
0
0
0
118
175
55
255
223
79
255
154
5
Contact and Financial Calendar
23 Investor Presentation I 27 March 2014 I Investor Relations
Investor Relations
+43 1 79777 - 210
www.semperitgroup.com/en/ir
Modecenterstrasse 22
1031 Vienna, Austria
Financial calendar 2014 of Semperit
29 April 2014 Annual general meeting, Vienna
6 May 2014 Ex-dividend day
8 May 2014 Dividend payment day
20 May 2014 Report on Q1 2014
19 August 2014 Report on H1 2014
18 November 2014 Report on Q1-3 2014
Disclaimer
The information provided in this presentation does not constitute an offer for the sale of securities nor an
invitation to submit an offer to purchase shares of Semperit AG Holding, but exclusively serves information
purposes.
The forecasts, plans and forward-looking statements contained in this report are based on the knowledge
and information available and the assessments made at the time that this report was prepared. As is true of
all forward-looking statements, these statements are subject to risk and uncertainties. As a result, the
actual events may deviate significantly from these expectations. No liability whatsoever is assumed for the
accuracy of projections or for the achievement of planned targets or for any other forward-looking
statements.

255
255
255
0
77
148
215
38
19
113
120
125
185
191
194
227
230
232
136
154
199
208
213
233
0
0
0
118
175
55
255
223
79
255
154
5
Key Highlights
Operational Development
Financial Performance
Outlook
Agenda
24
Appendix
Investor Presentation I 27 March 2014 I Investor Relations

255
255
255
0
77
148
215
38
19
113
120
125
185
191
194
227
230
232
136
154
199
208
213
233
0
0
0
118
175
55
255
223
79
255
154
5
Income Statement
25
Underproportional increase in material costs
due to active raw material management and
lower raw material prices
Increase in personnel expenses due to higher
number of employees (esp. Latexx Partners)
Higher other operating expenses due to higher
maintenance costs, outgoing freight and
strategic projects
Higher depreciation due to growth (new
capacities in Surat Thani, Latexx Partners)
Tax rate rises from 16.7% to 18.7%
Higher basic dividend (EUR 0.90/share) + one-
time anniversary bonus (EUR 0.30/share) result
in a payout ratio of 45.2%
in EUR m 2013 2012 Change
Revenue 906.3 828.6 +9.4%
Changes in inventories 9.4 --1.9 -
Own work capitalised 1.0 1.6 -39.3%
Other operating income 24.4 32.8 -25.6%
Material costs -510.7 -501.0 +1.9%
Personnel expenses -152.8 -127.4 +19.9%
Other operating expenses -145.8 -124.1 +17.4%
EBITDA 132.5 108.7 +21.9%
Depreciation and amortisation -44.7 -36.2 +23.6%
EBIT 87.8 72.5 +21.1%
Financial result -16.9 -14.0 +20.1%
EBT 70.9 58.5 +21.3%
Income taxes -16.0 -12.2 +30.9%
Earnings after tax 54.9 46.2 +18.8%
EPS (EUR) 2.65 2.25 +17.8%
DPS (EUR) 1.20 0.80 +50.0%
Key figures income statement 2013 vs. 2012 Highlights 2013

255
255
255
0
77
148
215
38
19
113
120
125
185
191
194
227
230
232
136
154
199
208
213
233
0
0
0
118
175
55
255
223
79
255
154
5
Solid balance sheet structure
26
in EUR m 2013 2012 Change
Assets 372.7 391.1 -4.7%
Inventories 148.4 142.5 +4.2%
Trade receivables
111.2 120.2 -7.4%
Other assets incl.
deferred taxes 219.7 170.8 +28.7%
Total assets 852.1 824.5 +3.4%
in EUR m 2013 2012 Change
Equity 414.2 428.0 -3.2%
Liabilities from redeemable non-
controlling interests 102.4 110.1 -7.0%
Provisions incl. social capital 73.7 64.8 +13.6%
Corporate Schuldschein loan 125.8 0.0 -
Liabilities incl. deferred taxes 136.1 221.6 -38.6%
Equity & Liabilities 852.1 824.5 +3.4%
Highlights 2013 Balance sheet indicators 2013 vs. 2012
Balance sheet total increases primarily due to
higher cash and cash equivalents
(EUR 182.6m)
Property, plant and equipment declines by 4.2%
to EUR 256.6m due to depreciation and
currency effects
Trade working capital declines from
EUR 212.1m to EUR 186.6m
Equity EUR 411.5m (excl. non-controlling
interests)
Liabilities increased by EUR 41.5m to
EUR 438m, especially due to the Corporate
Schuldschein loans.
Investor Presentation I 27 March 2014 I Investor Relations


![Investor Presentation Q4 FY 2016 [Company Update]](https://img.dokumen.tips/doc/110x75/577c7fb51a28abe054a5bb0b/investor-presentation-q4-fy-2016-company-update.jpg)