Embed Size (px)
Citation preview

Confidential
Investor PresentationFY 2011FY 2011
Depa LimitedDubai, UAE

Disclaimer
This material contains certain statements that are “forward-looking” includingThis material contains certain statements that are forward looking includingmanagement’s expectations and analysis. These statements are based onmanagement’s current expectations and are naturally subject to uncertainty andchanges in circumstances. Actual results may vary materially from the expectationsg y y y pcontained herein and readers and listeners are cautioned not to place unduereliance on any forward-looking comments. Depa Ltd undertakes no obligation toupdate or alter its forward-looking statements, whether as a result of newinformation, future events, or otherwise.
2

Contents
▶ Depa Introduction
2011 O i▶ 2011 Overview
▶ Backlog
▶ Financials
▶ Outlook
3

Depa Introduction
4

Depa is focused on building top-quality interiors for a wide range of market segmentsComplete And Diversified Interior Applications
Luxury hotels Apartment bldgs Malls & ShopsAirports/Metros Offices Yachts Theming/Museums
Completed projects Current projects
Depa Depa DecoLindner Depa Vedder & Pino Meroni
Dubai Metro – Green LineD b i UAE
Marina Bay SandsSi
PPM ConradDubai UAE
Mumbai International AirportMumbai India
Business ParkAl Kh b S di A bi
Deco DepaDepa
Dubai, UAEAED 223.6M
Jul 2009 – Dec 2011
Museum of Islamic Arts
SingaporeAED 326.6M
July 2008 – Aug 2010
Dubai, UAEAED 263.4M
Due: June 2012
KAPSRC
Mumbai, IndiaAED 113M
Due: Dec 2012
Burj KhalifaAl Salam Rotana
Al Khobar, Saudi ArabiaAED 48.3M
Apr 2010– Dec 2011
Blue Diamond Hotel
F S Nil Pl Hermitage
Doha, QatarAED 212M
Jul 2005—May 2007
F i E i B k Fl T
Riyadh, Saudi ArabiaAED 377.9M
Due: Oct 2012
Doha City Centre
Dubai, UAEAED 678.3M
Jul 2006 - Dec 2009
Khartoum, SudanAED 151.3M
Apr 2005 – May 2007
Luanda, AngolaAED 181.9M
Due: Dec 2012
Four Seasons Nile PlazaCairo, EgyptAED 71.6M
Apr 2002—Oct 2004
HermitageRendsburg, Germany
AED 59.4 MMay 2009 – Feb 2011
Ferrari ExperienceAbu Dhabi, UAE
AED 166.6MJun 2009—Dec 2010
Baku Flame TowerBaku, Azerbaijan
AED 121.3MDue: June 2012
Doha City CentreDoha, QatarAED 245.6M
Due: Dec 2012
5
Mazagan VillaEl Jadida, Morocco
AED 168.1MJan 2009 – Dec 2011
Ritz Carlton MilleniaSingapore
AED 96.3MJun 2010 – Sept 2011
Fraser SuitsSingapore
AED 63.3MDue: Jun 2012
Refit MY LunaBarcelona, Spain
AED 106.8MDue: June 2013
SheratonManama, Bahrain
AED 70MMay 1999 – Mar 2000

Over 373 stores from high end to high street in the last six yearsDeco: A Leader In Retail Fit-out
Marks & Spencer Potterybarn
6Valentino Louis Vuitton
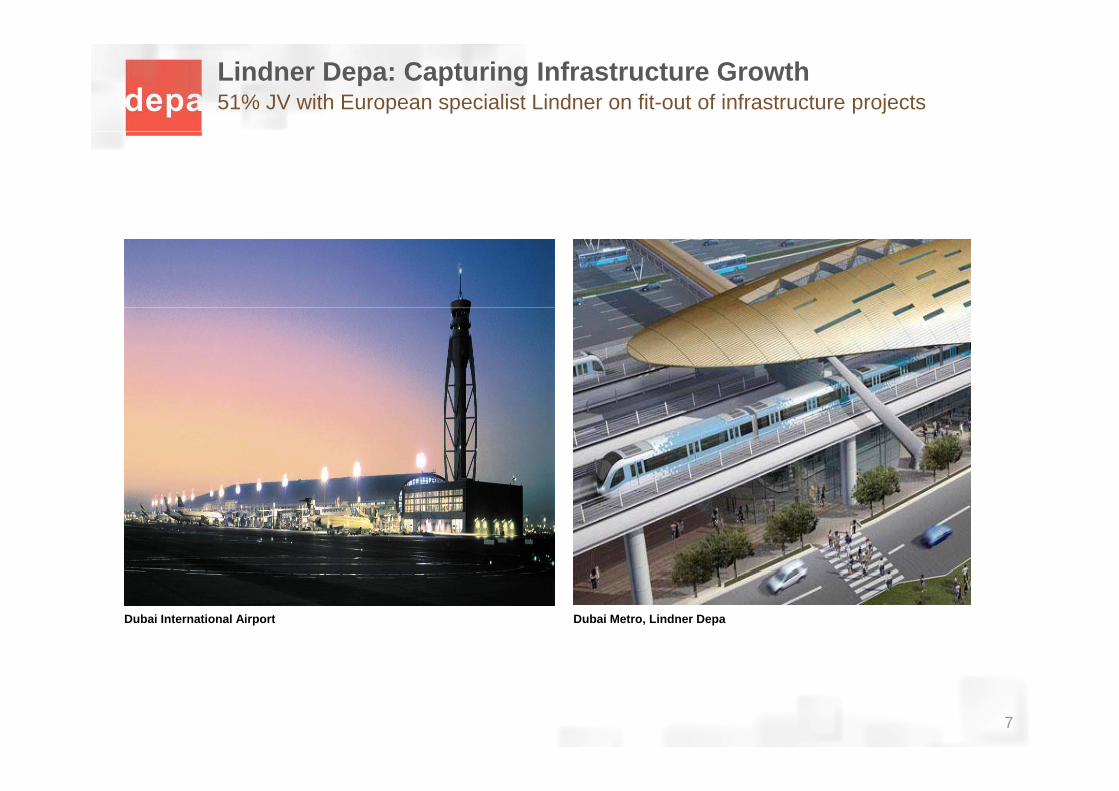
51% JV with European specialist Lindner on fit-out of infrastructure projectsLindner Depa: Capturing Infrastructure Growth
Dubai Metro, Lindner DepaDubai International Airport
7

Depa: Capturing Health Care GrowthInvolved in a growing market
Qatar Robotic Surgery Center
8
Cleveland Clinic, Abu Dhabi
Dubai Mall Medical Center

Vedder And Pino Meroni: Leader In Luxury Yacht Fit-OutOver 55 yachts fit out over the last six years – a testament to our workmanship
9Project Eclipse – World’s most expensive yacht

2011 Overview
10

Positive net profit after difficult 2010; record backlog2011 Overview
Revenue
• 2011 was a stabilization year for the Company’s revenues• AED 1,736 million of revenues as compare with AED 1,814 million in 2010• 2011 revenues were impacted by delay in project starts following Arab Spring• 2011 revenues were impacted by delay in project starts following Arab Spring
Net Profit
• 2011 net profits were impacted by G&A increase as a result of delayed project starts
• Net profit was also impacted by provisions taken due to Arcapita bankruptcy (March 20th, 2012)
Backlog and Revenue (AED Million)
B kl
• The Company’s backlog reached a record high of AED 3.8 billion• Only a minority of the backlog is constituted of UAE projects
Backlog
11
• Even without the Doha Airport, the backlog would remain at a record high

Maintain net cash position of AED 70 million2011 Overview
100
174 Cash Generation (AED Million)
Cash Generation
‐43
47 38 • Cash flow from operations was positive, with AED 38 million in positive cash generated in 2011
• Positive net cash position of AED 70 million
Growth Markets
‐43FY07 FY08 FY09 FY10 FY11
• Singapore continuing growth with the W Hotel and Fraser Suits• India continuing growth with Mumbai International Airport• New factory in China now in operation
Completed
• Business Park• Mazagan Villa• Dubai Metro – Green Line
• Novotel Platinum• Medical Research Unit• Khadem Al Qubaisi Villa
Projects
12
• Abu Dhabi Stock Exchange• Hermitage
• Welcome Pavillion• Ritz Carlton Millenia

Backlogg
13

Backlog diversification has increased, with significant growth in GCC market Backlog
• All projects are in the advanced stageof construction .
• Depa continues to have healthycontracted backlog which stood atalmost AED 4 billionalmost AED 4 billion.
• Backlog consists of 283 projectswhere we are already working on sitey gand does not include projects wherewe have yet to begin interior works.
K j t t 88% f• Key projects represent 88% of ourbacklog value and are worth AED 3.5billion.
• The remaining 12% of backlogconsists of 240 projects with anaverage value of AED 2.02 million per
14
project.

Increased international backlog exposure and reduced regional exposureBacklog: Geographical Distribution
AED 100 - 150 M
<AED 100 M
Estimated Backlog
Bahrain>AED 150 M
BahrainQatar
DDS: ThailandMalaysia
Singapore
Parker: ChinaKoreaZurichLondonMiami
EUROPE & AFRICA GCC & LEVANT ASIA
Morocco Hospital
IPC Headquarters
Traders Hotel
On-going /Recent Projects
Blue Diamond Hotel, Angola
EUROPE & AFRICA
Topaz Project Zone
Cairo Festival City
KAPSRC
King Saudi University
PPM Conrad Hotel
GCC & LEVANT
The Boulevard Twin Tower Hotel
Mumbai Int’l Airport
Baku Flame Tower
Asia Square Tower
ASIA
Lanson PlaceFraser Suite
15Various news releases
Chester Market Ramada HotelCleveland ClinicRitz Carlton Hotel Grand Hyatt Hotel
OCBC OfficeW HotelAccommodation Tower

Significant reduction in UAE Backlog Geographical Distribution
• Efforts to diversity are successful, illustrated by UAE representing less than 6% of backlog.
16
Efforts to diversity are successful, illustrated by UAE representing less than 6% of backlog.
• GCC portion of backlog grows significantly due to new contract wins.

GCC backlog growingBacklog: Geographical Distribution
GCC Backlog
Asia Backlog
17

Hospitality remains a key market sector, but infrastructure takes a leadBacklog: Sector Distribution
Sector Backlog
18

Financial
19

Balance Sheet remains strong despite difficult yearFinancials: Overview
Ratio AnalysisAED Million Actual
FY 2009Actual FY 2010
Actual FY 2011
Revenue 2,689 1,814 1,736
Contract Profit 430 114 289
C t t P fit M i 16% 6% 17%Contract Profit Margin 16% 6% 17%
G&A (192) (279) (167)
% of Revenue (7%) (15%) (10%)
lions
)
Receivables Aging
Amortization & Impairments (32) (67) (45)
Profit / (Loss) from Associates 23 55 (2)
Other Income (Net of Other Costs) 20 25 13
AE
D (m
il
Days
Days Receivable and PayableFinance (Costs) / Income (Net) 19 (4) (13)
Income Tax (Expense) / Benefit 16 (49) (16)
Net Profit / (Loss) before NCI 284 (206) 59
Days
( ) ( )
Net Profit / (Loss) Margin before NCI 11% (11%) 3)%
Net Profit / (Loss) after NCI 234 (198) 54
Net Profit / (Loss) Margin
20Audited financials
Net Profit / (Loss) Margin after NCI 9% (11%) 3%

Institutional Investors accounts for approximately 58% of total shareholdingsFinancials: Shareholder Structure
FY 2011 FY 2011I t TGeographical Split Investor Type
21Source: Deutsche Bank

Financial: Selected Balance Sheet Figure
Actual Actual ActualAED Million ActualFY 2009
ActualFY 2010
ActualFY 2011
Cash in Hand 543 450 332
Unbilled Revenue 910 474 642
Total Current Assets 2,272 1,801 1,825
Total Assets 3 372 3 038 3 030Total Assets 3,372 3,038 3,030
Total Bank Debt 220 331 262
Total Current Liabilities 1,261 1,091 1,155
Total Liabilities 1,398 1,327 1,286
Total Equity 1,974 1,711 1,744
Working Capital 1,011 710 670
Liquidity Ratio 1.80 1.65 1.58
0 11 0 19 0 1Total Debt to Equity Ratio 0.11 0.19 0.15
22

Financial: Selected Cash Figures
AED Million Actual Actual ActualAED Million FY 2009 FY 2010 FY 2011
Net Cash (used in) / generated from Operating Activities 100 174 38
N t C h ( d i ) / t d f I ti A ti iti (132) (206) (53)Net Cash (used in) / generated from Investing Activities (132) (206) (53)
Net Cash (used in) / generated from Financing Activities (281) (10) (70)
Total Cash Balance ( * ) 543 450 332Total Cash Balance ( ) 543 450 332
Total Bank Debt (220) (331) (262)
Total Net Cash 323 119 70
AR days (excluding Unbilled Revenue) 51 91 90
AR days (including Unbilled Revenue) 171 235 223
AP days 54 55 59
CAPEX 32 47 71
( * ) Cash balance includes short-term fixed deposits, i.e. 117M 66M 38M
23

Financial: Geographic Segmentation Trend (FY 2010 – FY2011)
RFY 2010
Revenue
Regional Office FY 2011 FY 2010
604 33%
304
310 17%
Regional Office FY 2011 FY 2010
Dubai 599 604
Abu Dhabi 340 596
596 33%
304 17%
Asia 440 304
Europe 357 310 FY 2011
Total 1,736 1,814
AED Million 599 34%
357 21%
340 20%
440 25%
24
Dubai Abu Dhabi Asia Europe

Financials: Activity Segmentation Trend (FY 2010 – FY 2010)
FY 2010
Revenue 424 23%
21 1%
Activity Segment FY 2011 FY 2010
Contracting 1,208 1,369
1,369 76%
Manufacturing 504 424
Procurement 24 21 FY 2011
Total 1,736 1,814
AED Million504 29%
24 1%
1,208 70%
25Contracting Manufacturing Procurement

Outlook
26

Outlook
• Strong growth prospects from GCC markets
• Infrastructure and medical center projects beginning to come into backlog
• Asian markets also providing growth opportunities
27