Embed Size (px)
Citation preview

May 2021
Q1 2021
Investor Presentation
Disclaimer
The material in this presentation is general background information about Emirates NBD's activities current at the date of the presentation. It is information given in
summary form and does not purport to be complete. It is not intended to be relied upon as advice to investors or potential investors and does not take in to account
the investment objectives, financial situation or needs of any particular investor. These should be considered, with or without professional advice when deciding if an
investment is appropriate.
The information contained here in has been prepared by Emirates NBD. Some of the information relied on by Emirates NBD is obtained from sources believed to be
reliable but does not guarantee its accuracy or completeness.
Forward Looking Statements
It is possible that this presentation could or may contain forward-looking statements that are based on current expectations or beliefs, as well as assumptions about
future events. These forward-looking statements can be identified by the fact that they do not relate only to historical or current facts. Forward-looking statements
often use words such as anticipate, target, expect, estimate, intend, plan, goal, believe, will, may, should, would, could or other words of similar meaning. Undue
reliance should not be placed on any such statements because, by their very nature, they are subject to known and unknown risks and uncertainties and can be
affected by other factors that could cause actual results, and the Group’s plans and objectives, to differ materially from those expressed or implied in the forward-
looking statements.
There are several factors which could cause actual results to differ materially from those expressed or implied in forward looking statements. Among the factors that
could cause actual results to differ materially from those described in the forward-looking statements are changes in the global, political, economic, business,
competitive, market and regulatory forces, future exchange and interest rates, changes in tax rates and future business combinations or dispositions.
Emirates NBD undertakes no obligation to revise or update any forward-looking statement contained within this presentation, regardless of whether those statements
are affected as a result of new information, future events or otherwise.
Important Information

1. Emirates NBD Profile2. Financial & Operating Performance3. Economic Environment4. Divisional Performance

Emirates NBD at a Glance
AED 695 BnTotal Assets
AED 472 BnGross Customer Loans
AED 459 BnTotal Customer Deposits
13Countries
907Branches
17+ million Customers
2nd
Largest in the UAE
3rd
Largest in GCC
~20%Market Share in UAE
(Assets, Loans, Deposits)
56%Government of Dubai
Shareholding
AED 76 BnMarket
Capitalization*
*Market cap as at 22-Apr-21
Emirates NBD is a leading bank in the MENAT RegionKey Highlights as of March 2021
Emirates NBD Profile
40% FOL11.65% foreign owners
as at 27-Apr-2021
4

Emirates NBD
Emirates NBD Rep. Offices
DenizBank
Market share in the UAE*
➢ Assets 17.9%; Loans 22.0%; Deposits 20.2%
➢ Largest financial institution in Dubai, 3rd
largest in the GCC
➢ Leading retail banking franchise with a
branch network of 900+ branches throughout the
MENAT region with operations in 13 countries
➢ Leader in digital banking: 6th best Finance
app worldwide by FinTech Magazine with
expanding customer acquisition
➢ 55.8% indirectly owned by the Government of
Dubai through ICD
➢ Credit ratings
Rated A3 / A+ by Moody’s / Fitch
* Emirates NBD as at 31-Mar-21 excluding DenizBank
Emirates NBD at a glance
Turkey
KSA
London
Singapore
Jakarta
Beijing
UAEMumbai
Germany
1
1
1
667
Egypt
9
693
1
109
Bahrain
Austria
1
1
17
1
Moscow
Emirates NBD Profile
Emirates NBD’s International Presence
5
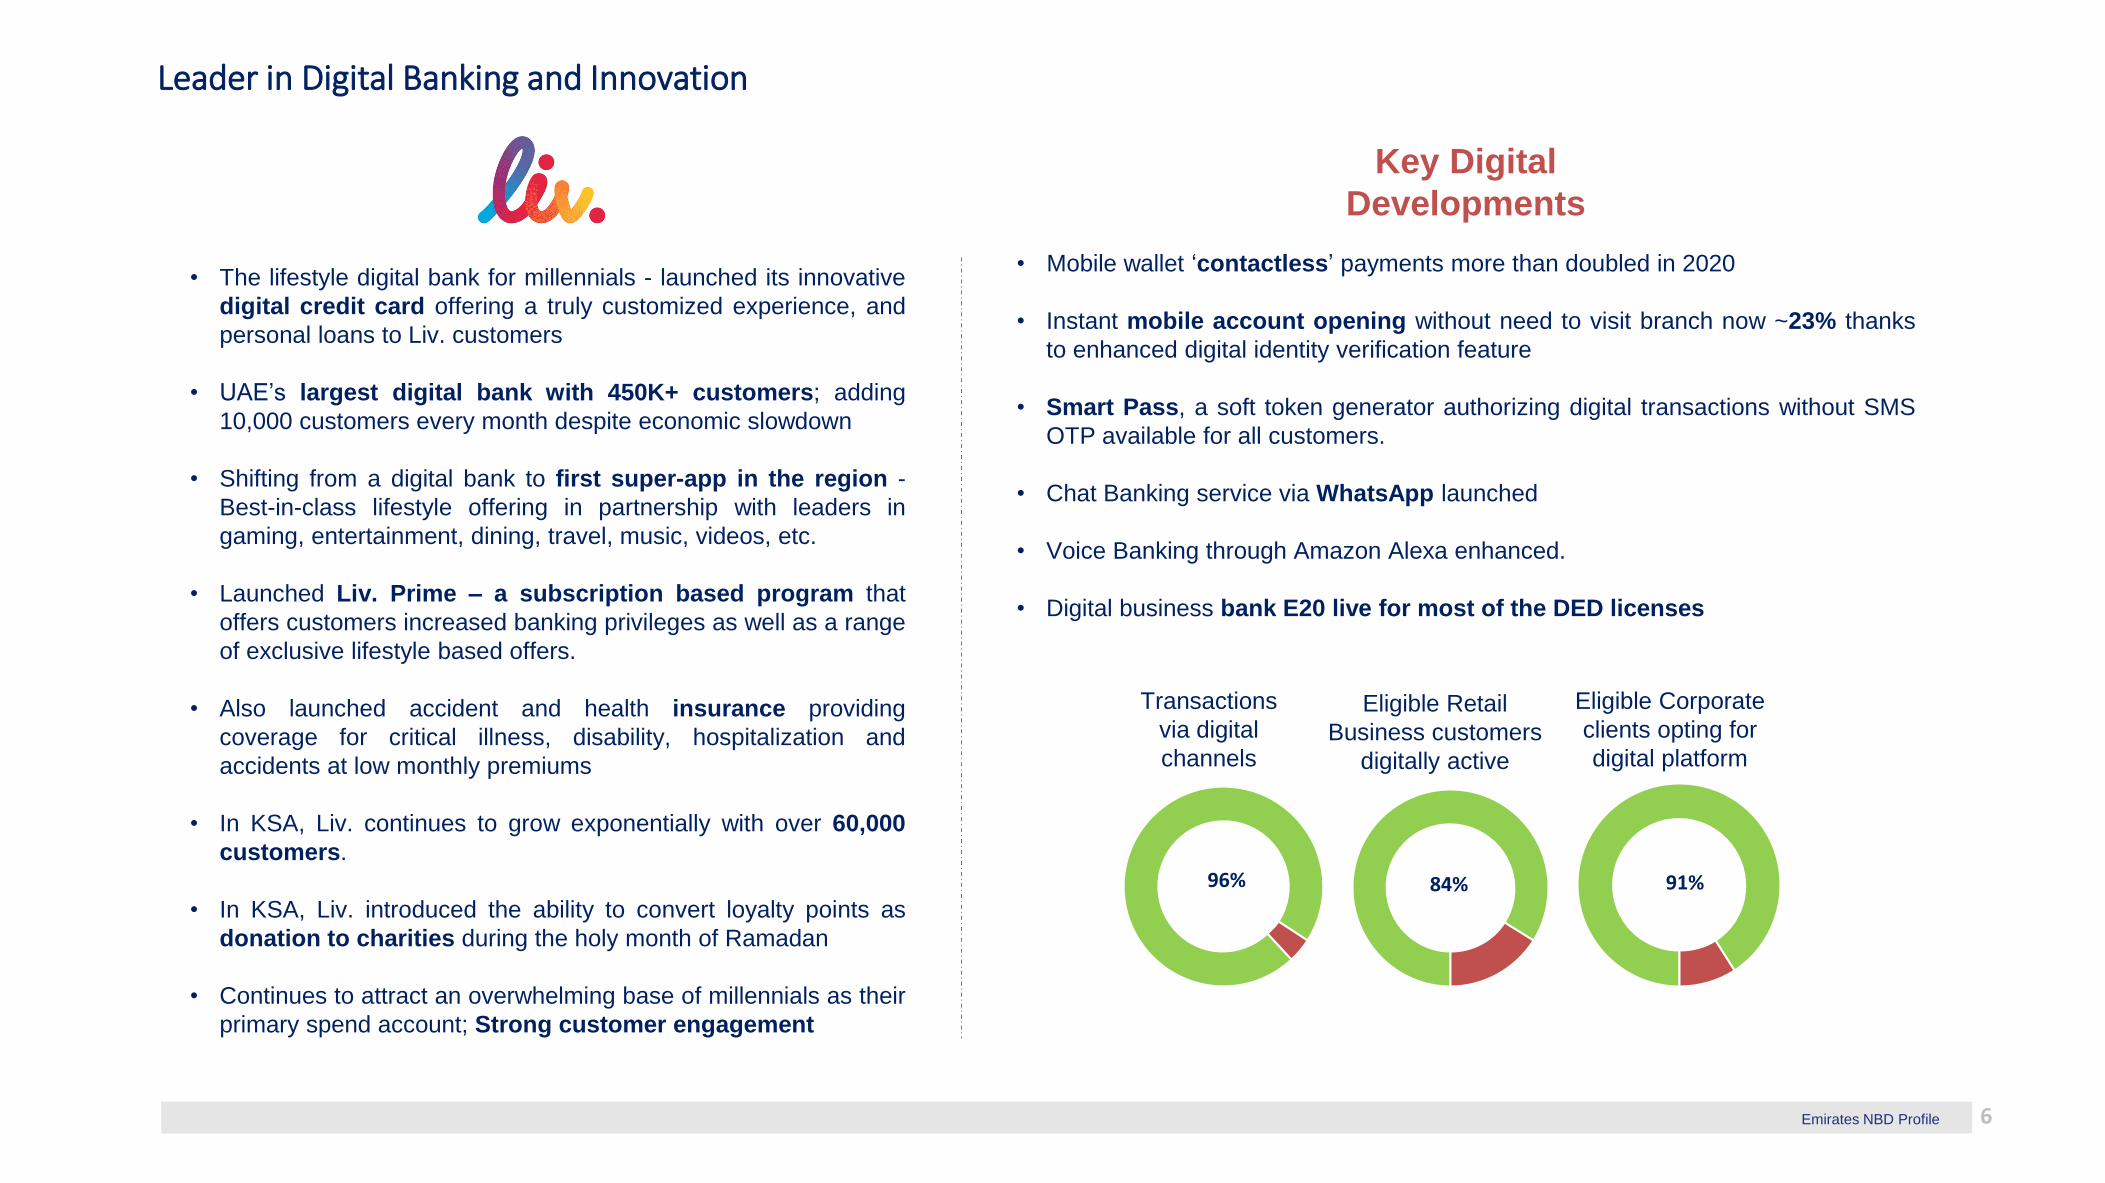
• Mobile wallet ‘contactless’ payments more than doubled in 2020
• Instant mobile account opening without need to visit branch now ~23% thanks
to enhanced digital identity verification feature
• Smart Pass, a soft token generator authorizing digital transactions without SMS
OTP available for all customers.
• Chat Banking service via WhatsApp launched
• Voice Banking through Amazon Alexa enhanced.
• Digital business bank E20 live for most of the DED licenses
• The lifestyle digital bank for millennials - launched its innovative
digital credit card offering a truly customized experience, and
personal loans to Liv. customers
• UAE’s largest digital bank with 450K+ customers; adding
10,000 customers every month despite economic slowdown
• Shifting from a digital bank to first super-app in the region -
Best-in-class lifestyle offering in partnership with leaders in
gaming, entertainment, dining, travel, music, videos, etc.
• Launched Liv. Prime – a subscription based program that
offers customers increased banking privileges as well as a range
of exclusive lifestyle based offers.
• Also launched accident and health insurance providing
coverage for critical illness, disability, hospitalization and
accidents at low monthly premiums
• In KSA, Liv. continues to grow exponentially with over 60,000
customers.
• In KSA, Liv. introduced the ability to convert loyalty points as
donation to charities during the holy month of Ramadan
• Continues to attract an overwhelming base of millennials as their
primary spend account; Strong customer engagement
Emirates NBD Profile
Key Digital
Developments
96%
Transactions
via digital
channels
84%
Eligible Corporate
clients opting for
digital platform
Eligible Retail
Business customers
digitally active
91%
Leader in Digital Banking and Innovation
Emirates NBD Profile 6

Go Paperless program: in Feb 2020 we launched our sustainability program aligned
with the Dubai Paperless Strategy.
Green & Social Banking choices:
First bank from the Gulf region to issue an ESG-linked syndicated loan
Social investment
Customer support during the Pandemic
78+ initiatives
28 million pages saved
700 MT CO2 footprint reduction3,500 trees savedAED 3.6 million saved
Green Home Loans
Green Auto Loans RTA Credit card by EI
Paperless accounts (LIV. & E-Savings)
Environmentally and socially responsible lending & investment:
➢ Increased digitization has reduced paper flow
➢ Lending to agriculture up 170% since Dec-19; Education up 8%
➢ Focus on clean energy, food security, vertical farming, mass transit services and
infrastructure
➢ EmCap successfully closed Islamic Development Bank’s first ever USD Sustainability
Sukuk
➢ 1500+ staff trained on Disability Etiquette and Sign Language
➢ 47 Branches made disability friendly with 20 additional disability friendly branch elements
➢ 18 disability friendly branches equipped with assistive technology
➢ Placed 70 individuals with disabilities in full-time jobs
➢ 36 Partners from government and private sector have hired through this program
➢ 56 inclusion workshops conducted since 2018
In 2020, we contributed over AED 90 million in financial to the local community
➢ Interest and principal deferral support to over 110,000 customers in the UAE.
➢ Many other customers have benefited through waiver of fees and other support, both
within the UAE and in the other geographies in which we operate.
Health & Wellness 58.9
Humanitarian 9.3
International Support8.5
Islamic Contributions 6.5
Women Empowerment4.1Community Development
1.8
People with Disabilities1.2
Financial Literacy0.2
ESG Performance
7
Key Environmental developments
Key Social developments
Emirates NBD Profile

Stable Shareholder Base and Diversified Business Model
• A flagship bank for the Government of Dubai and the UAE
• Strong and supportive shareholder base from the Government of Dubai via Investment
Corporation of Dubai
• International presence in Asia, Europe and MENAT across 13 countries. DenizBank
acquisition further enhanced geographic profile
• Well diversified and balanced asset composition between corporate, consumer and
Islamic banking
• Foreign ownership limit raised to 40% from 20% in July 2020 with foreign ownership at
11.65% at 27-Apr-2021
Split of ownership – Anchored by the Government of Dubai Highlights
Equity Analysts CoverageBalanced asset composition
Investment Corporation of
Dubai56%
Capital Assets5%
Others39%
Ownership structure as at 31 Mar 2021
CIB45%
DenizBank18%
GMT18%
Islamic Banking10%
RBWM9%
% by segment as at 31 Mar 2021Buy Hold Sell
Recommendation 8 3 1
In AED
Target Price 14.0
Price at 27-April-2021 12.2
EPS 31-March-2021 0.34
8Emirates NBD Profile
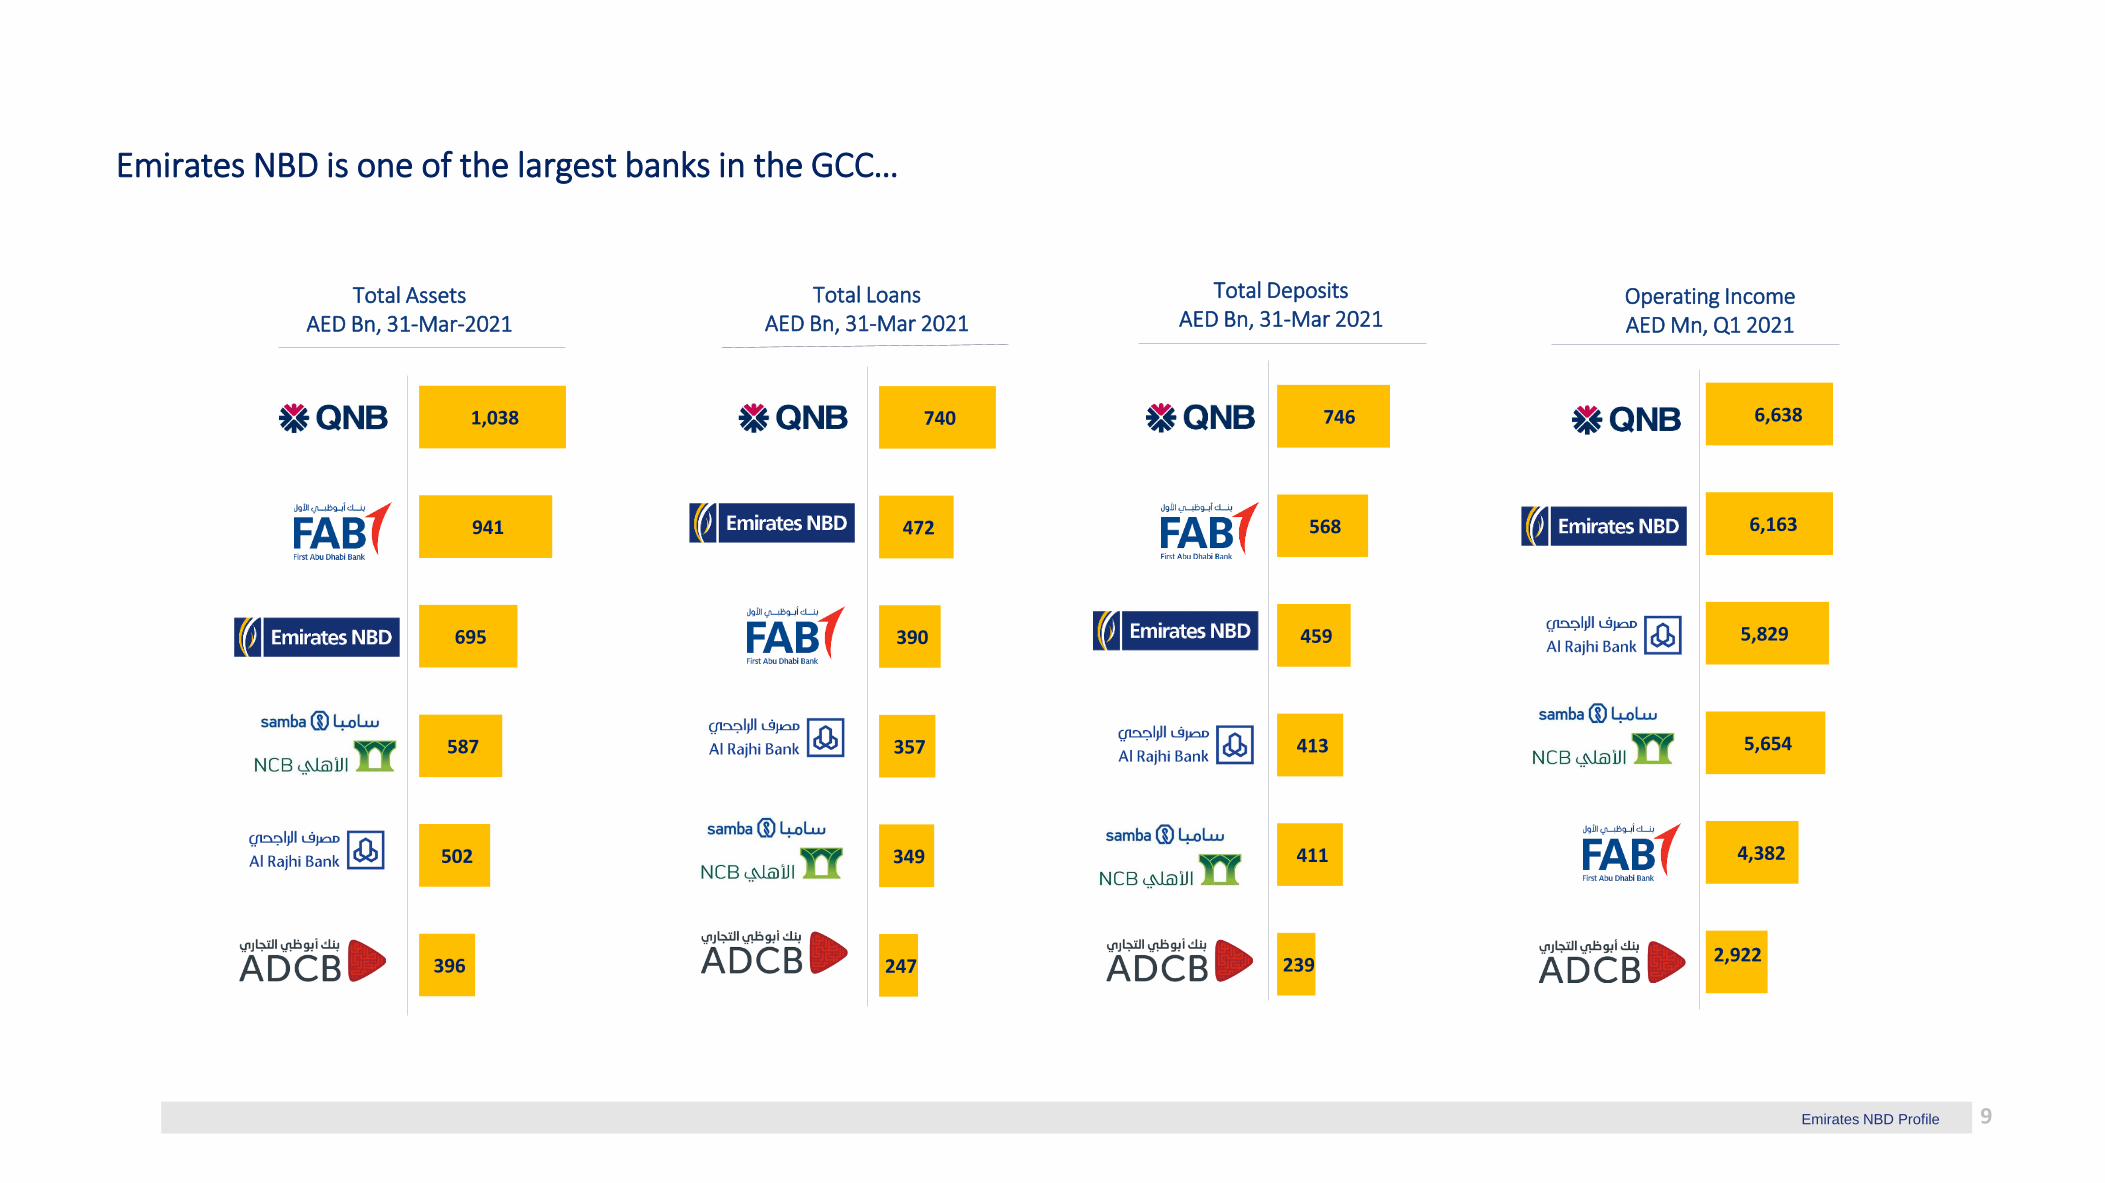
Total AssetsAED Bn, 31-Mar-2021
Total LoansAED Bn, 31-Mar 2021
Total DepositsAED Bn, 31-Mar 2021
Operating IncomeAED Mn, Q1 2021
Emirates NBD is one of the largest banks in the GCC…
1,038
941
695
587
502
396
746
568
459
413
411
239
6,638
6,163
5,829
5,654
4,382
2,922
740
472
390
357
349
247
Emirates NBD Profile 9
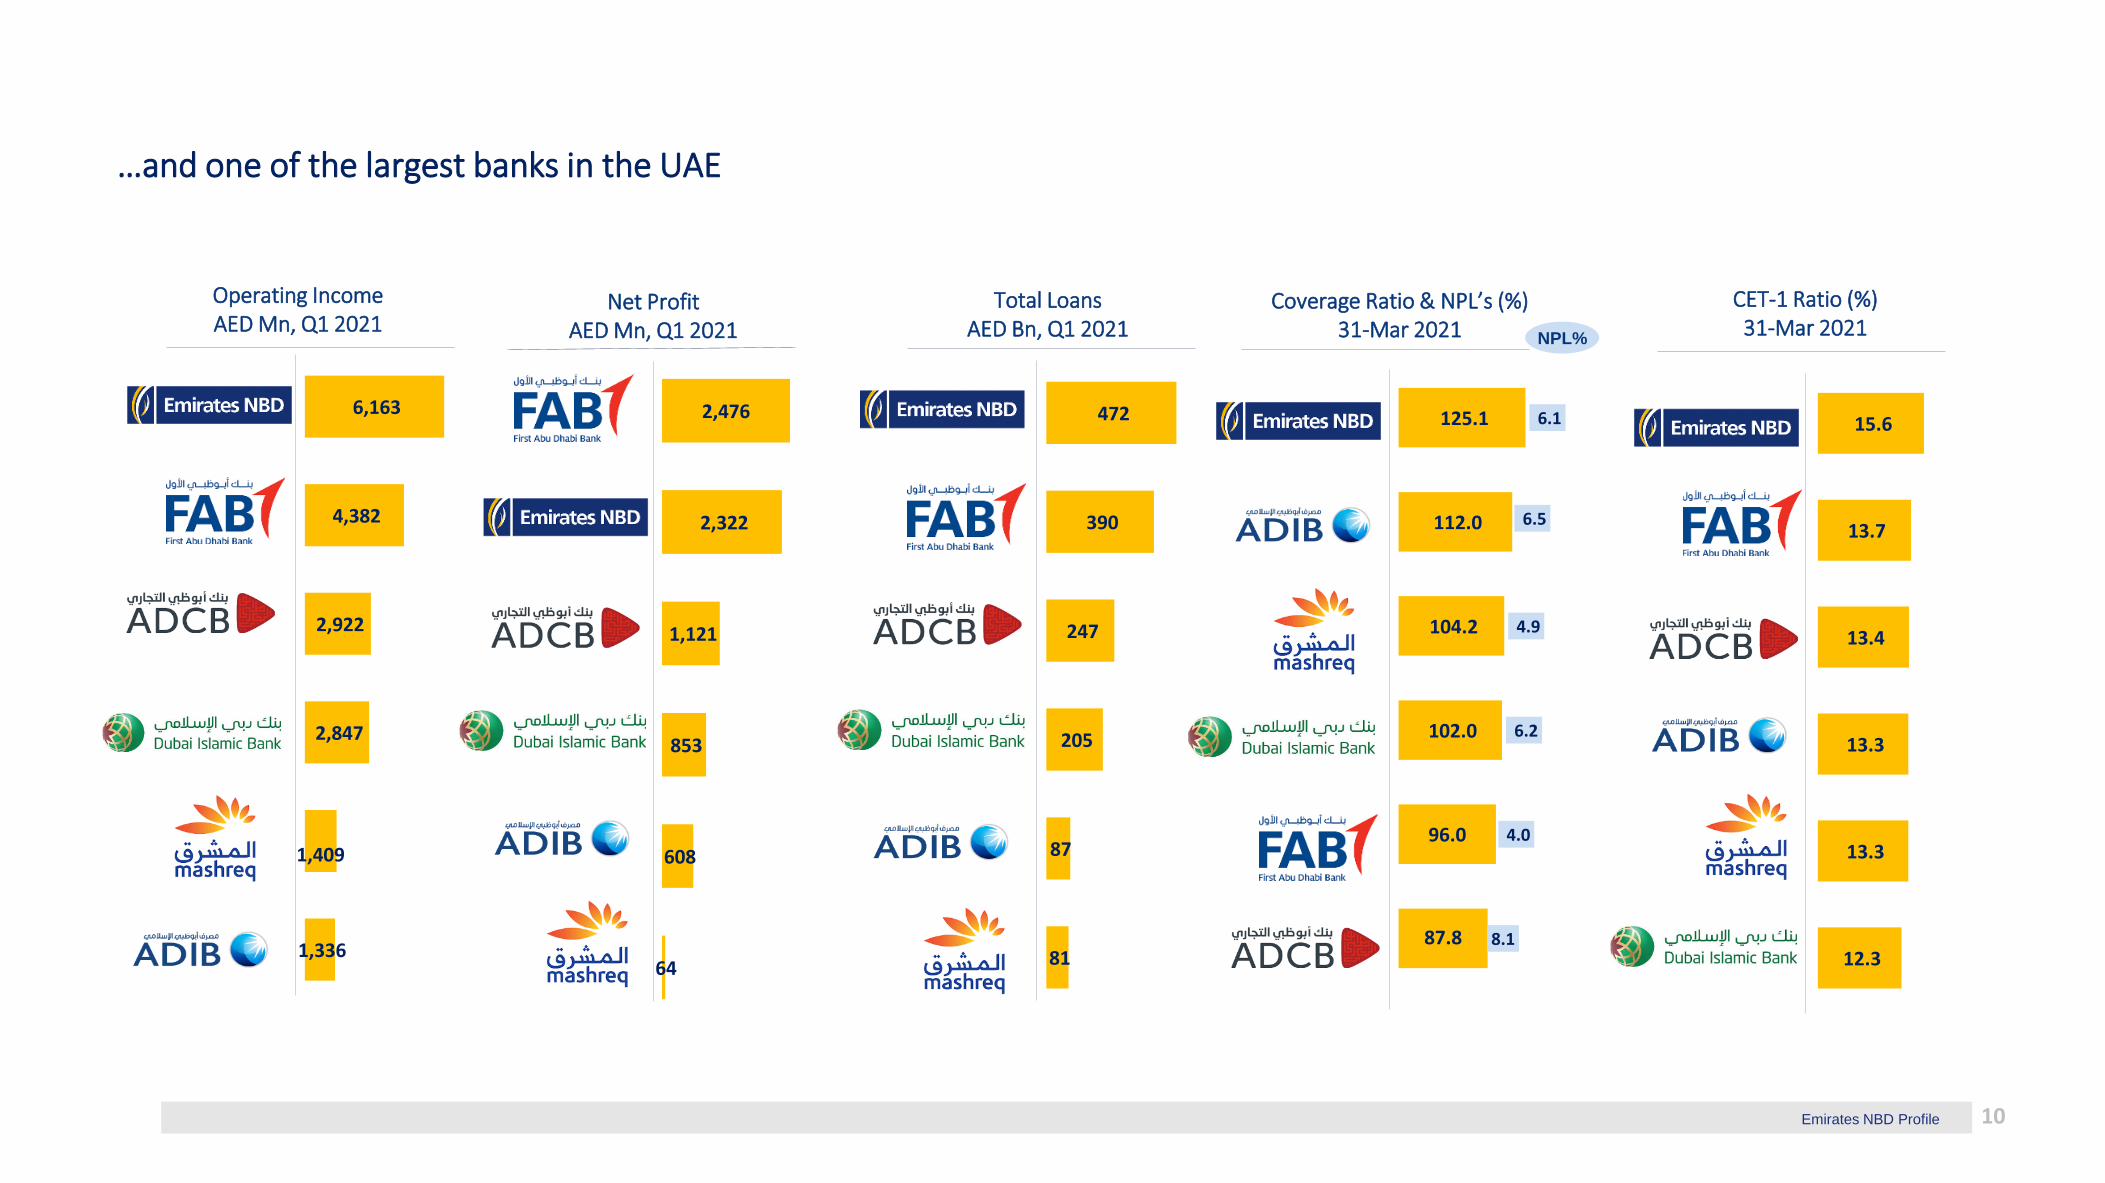
Operating IncomeAED Mn, Q1 2021
Net ProfitAED Mn, Q1 2021
Total LoansAED Bn, Q1 2021
Coverage Ratio & NPL’s (%) 31-Mar 2021
CET-1 Ratio (%)31-Mar 2021
…and one of the largest banks in the UAE
15.6
13.7
13.4
13.3
13.3
12.3
2,476
2,322
1,121
853
608
64
6,163
4,382
2,922
2,847
1,409
1,336
472
390
247
205
87
81
125.1
112.0
104.2
102.0
96.0
87.8
6.1
6.5
4.9
6.2
4.0
8.1
NPL%
Emirates NBD Profile 10

9.7 9.9 10.2
11.8
14.415.2 14.7
15.4
17.4
22.423.2
6.2
2.3 2.5 2.63.3
5.1
7.1 7.28.3
10.0
14.5
7.0
2.3
2010 2011 2012 2013 2014 2015 2016 2017 2018 2019 2020 Q1 2021
Operating Revenue (AED Bn) Net Profit (AED Bn)
Consistently profitable due to diversified and resilient business model
Return on Average Tangible EquityExcl. NI gain for 2019
Strong track record of profitability
12.9%9.3% 8.8% 15.7% 19.7% 18.0% 20.3%9.1% 18.8%10.5% 16.5% 9.5%
Emirates NBD Profile 11
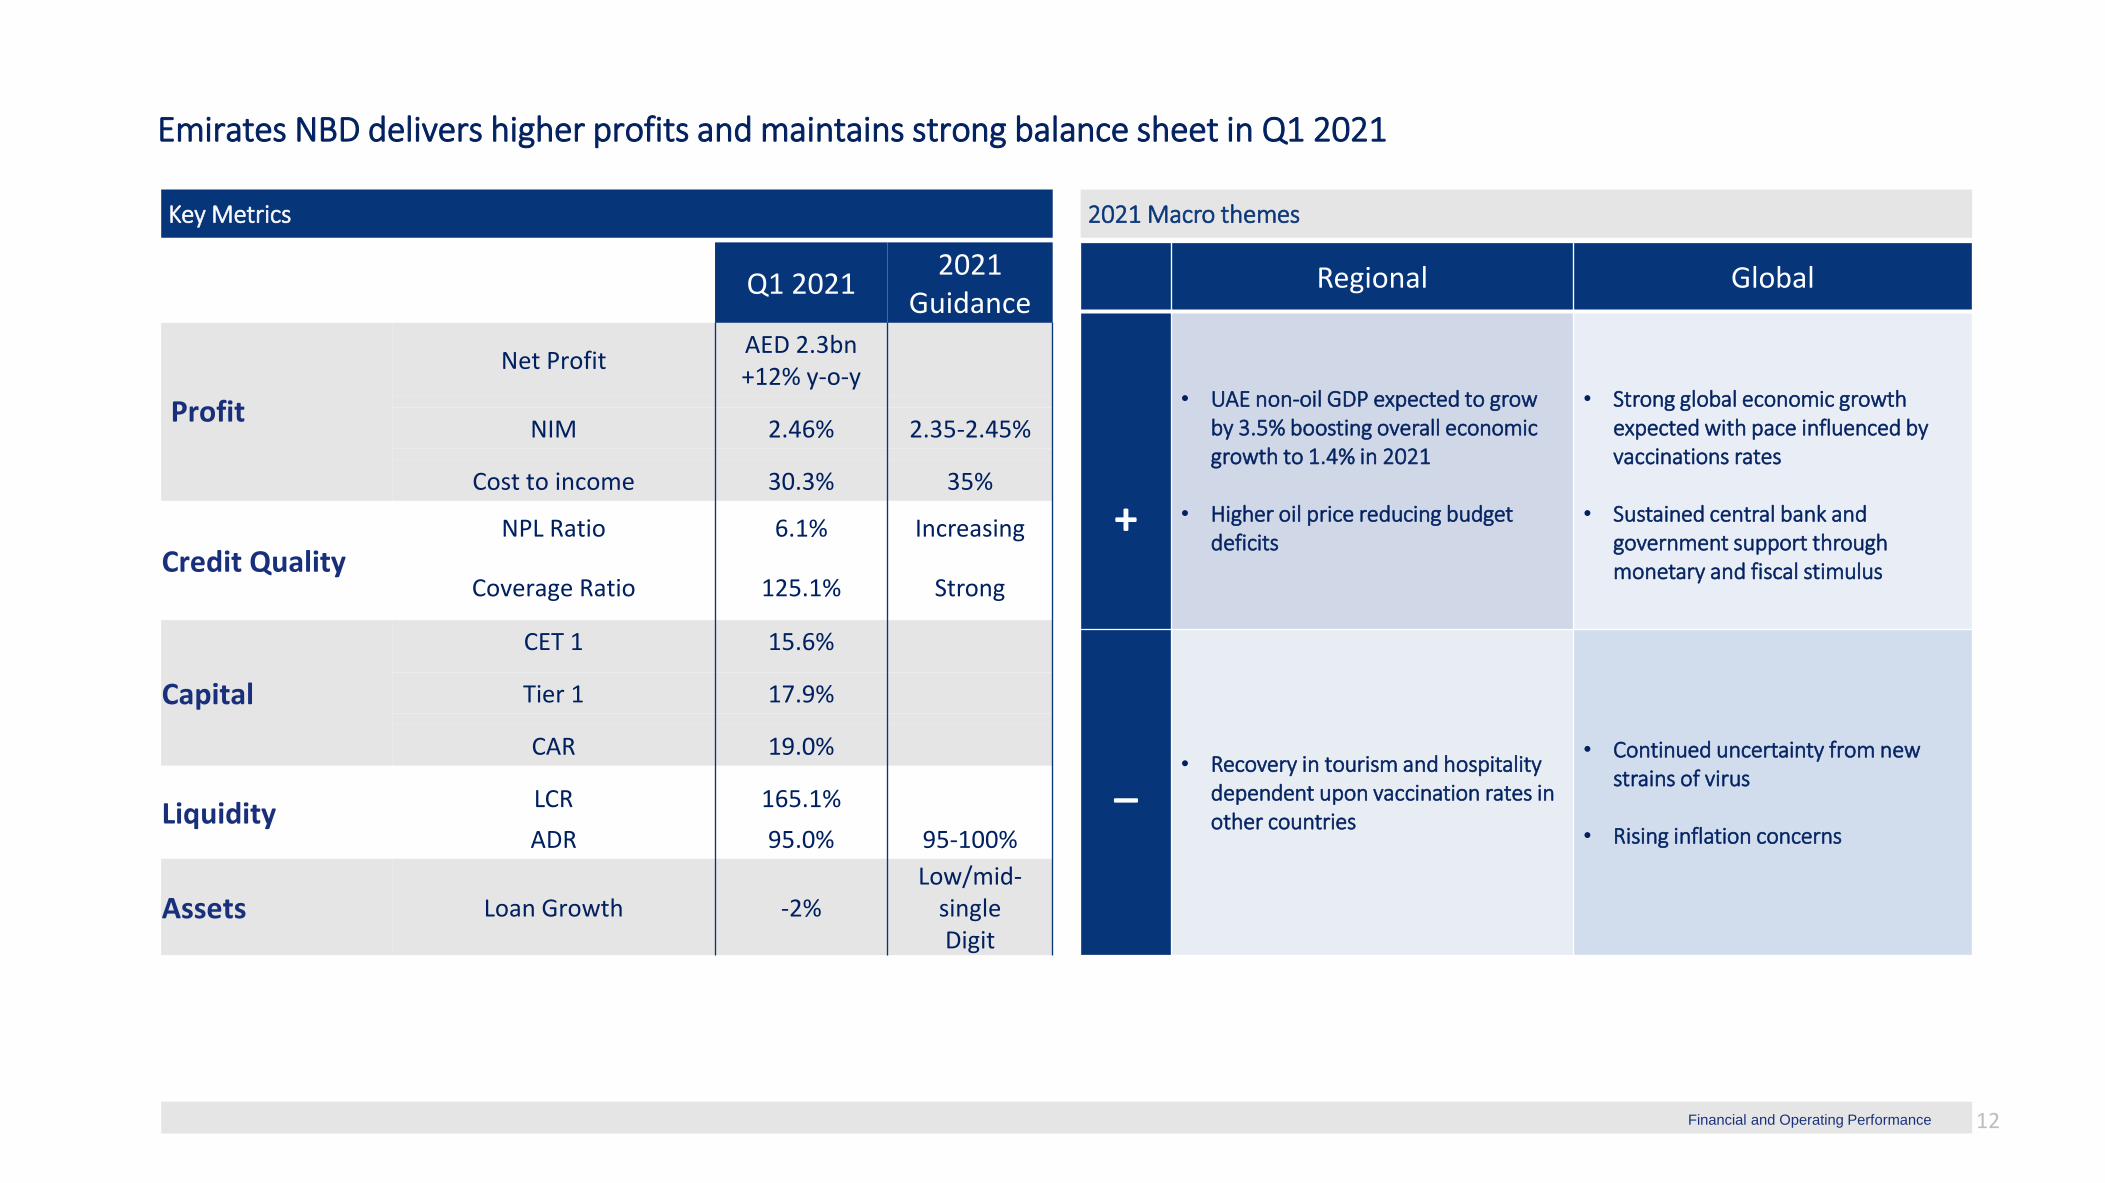
Emirates NBD maintains good profitability and a strong balance sheet despite challenging conditions in 2020
Insert subtitle right here
Q1 20212021
Guidance
Profit
Net ProfitAED 2.3bn +12% y-o-y
NIM 2.46% 2.35-2.45%
Cost to income 30.3% 35%
Credit QualityNPL Ratio 6.1% Increasing
Coverage Ratio 125.1% Strong
Capital
CET 1 15.6%
Tier 1 17.9%
CAR 19.0%
LiquidityLCR 165.1%
ADR 95.0% 95-100%
Assets Loan Growth -2%Low/mid-
single Digit
Regional Global
+
• UAE non-oil GDP expected to grow by 3.5% boosting overall economic growth to 1.4% in 2021
• Higher oil price reducing budget deficits
• Strong global economic growth expected with pace influenced by vaccinations rates
• Sustained central bank and government support through monetary and fiscal stimulus
_ • Recovery in tourism and hospitality dependent upon vaccination rates in other countries
• Continued uncertainty from new strains of virus
• Rising inflation concerns
Financial and Operating Performance
Emirates NBD delivers higher profits and maintains strong balance sheet in Q1 2021
Key Metrics 2021 Macro themes
12
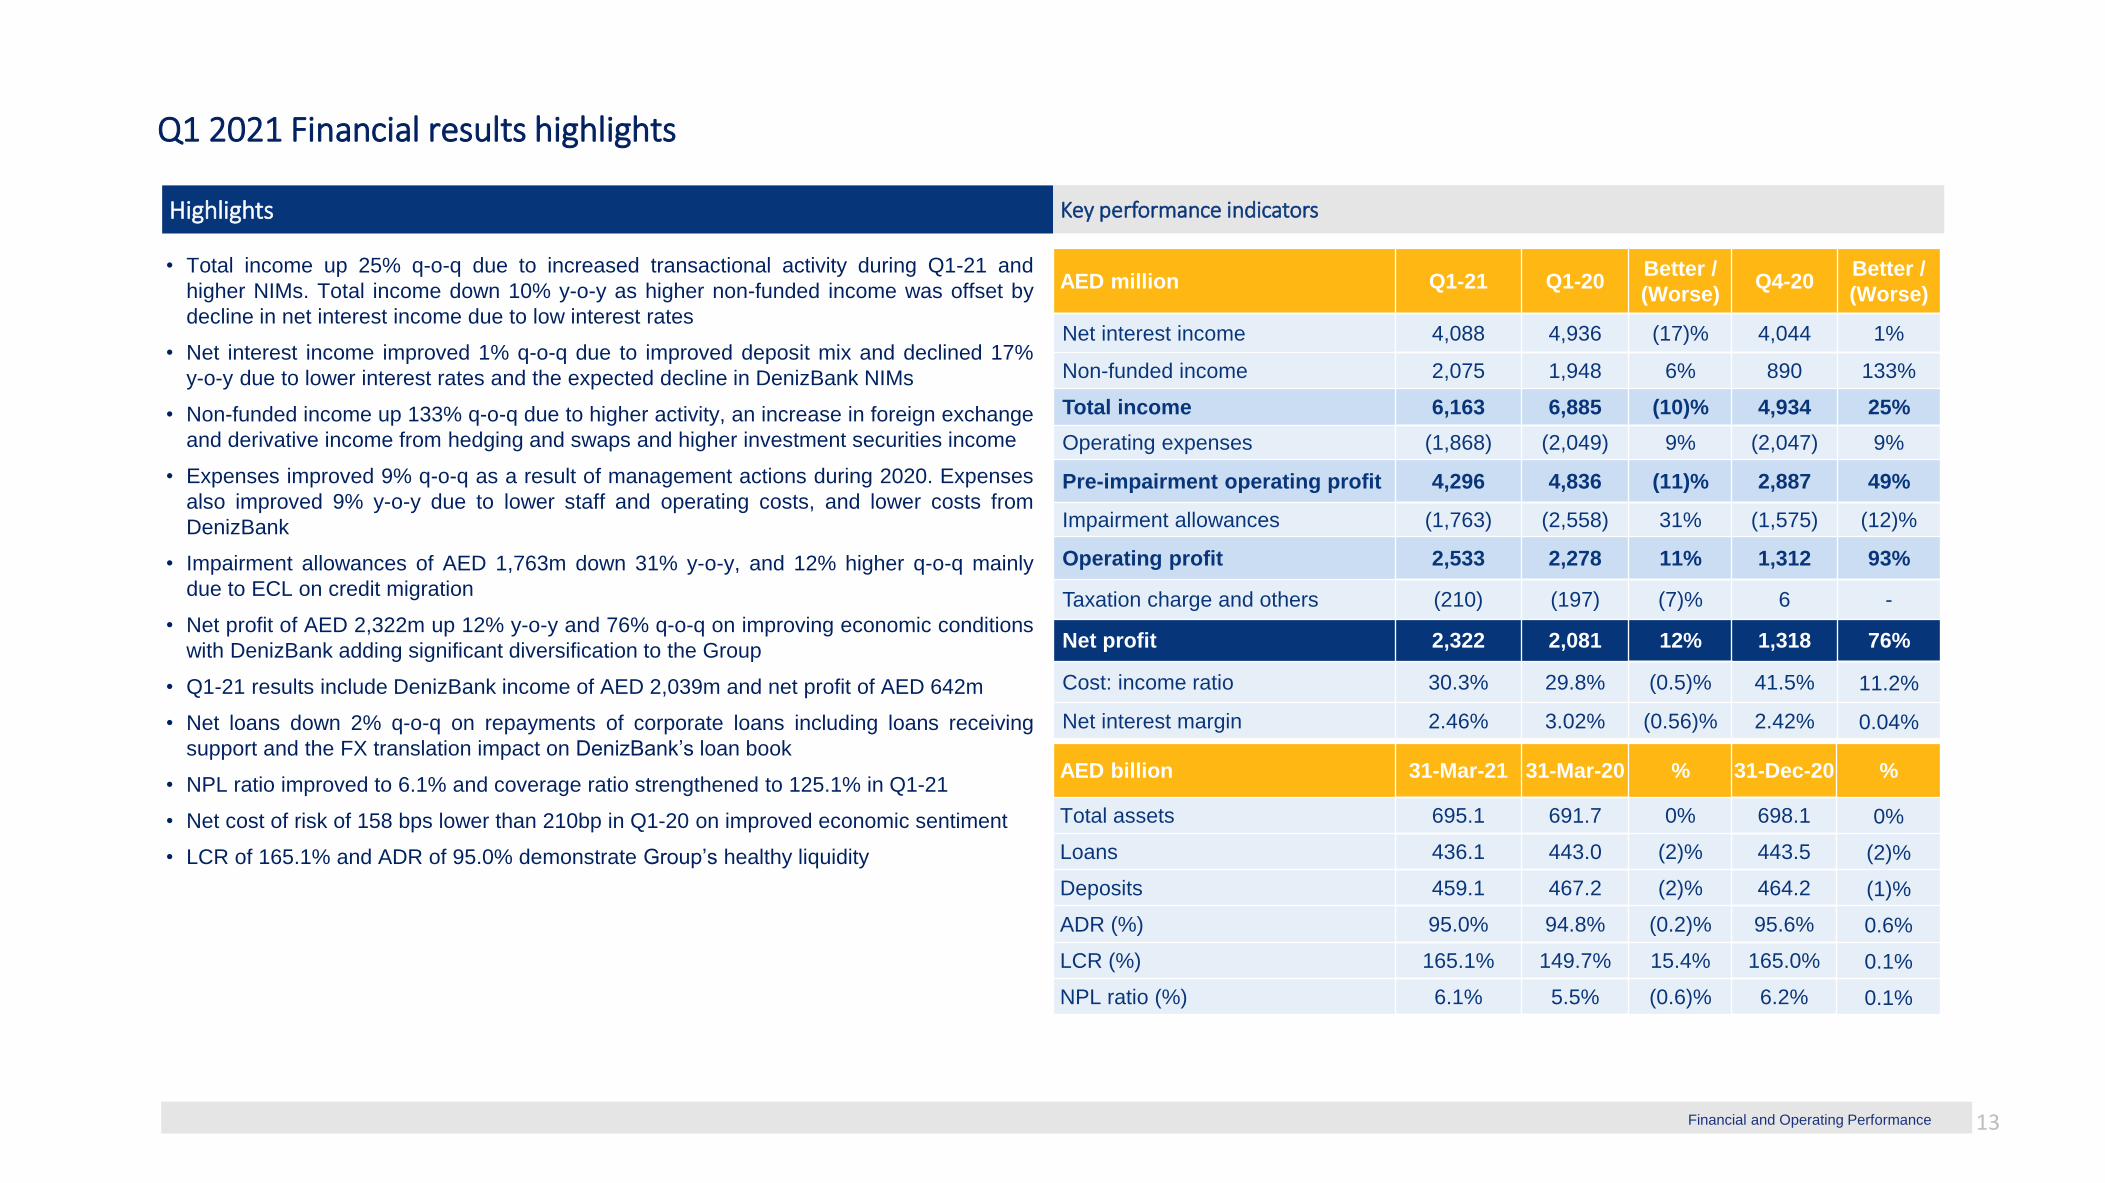
Q1 2021 Financial results highlights
• Total income up 25% q-o-q due to increased transactional activity during Q1-21 and
higher NIMs. Total income down 10% y-o-y as higher non-funded income was offset by
decline in net interest income due to low interest rates
• Net interest income improved 1% q-o-q due to improved deposit mix and declined 17%
y-o-y due to lower interest rates and the expected decline in DenizBank NIMs
• Non-funded income up 133% q-o-q due to higher activity, an increase in foreign exchange
and derivative income from hedging and swaps and higher investment securities income
• Expenses improved 9% q-o-q as a result of management actions during 2020. Expenses
also improved 9% y-o-y due to lower staff and operating costs, and lower costs from
DenizBank
• Impairment allowances of AED 1,763m down 31% y-o-y, and 12% higher q-o-q mainly
due to ECL on credit migration
• Net profit of AED 2,322m up 12% y-o-y and 76% q-o-q on improving economic conditions
with DenizBank adding significant diversification to the Group
• Q1-21 results include DenizBank income of AED 2,039m and net profit of AED 642m
• Net loans down 2% q-o-q on repayments of corporate loans including loans receiving
support and the FX translation impact on DenizBank’s loan book
• NPL ratio improved to 6.1% and coverage ratio strengthened to 125.1% in Q1-21
• Net cost of risk of 158 bps lower than 210bp in Q1-20 on improved economic sentiment
• LCR of 165.1% and ADR of 95.0% demonstrate Group’s healthy liquidity
Highlights Key performance indicators
AED billion 31-Mar-21 31-Mar-20 % 31-Dec-20 %
Total assets 695.1 691.7 0% 698.1 0%
Loans 436.1 443.0 (2)% 443.5 (2)%
Deposits 459.1 467.2 (2)% 464.2 (1)%
ADR (%) 95.0% 94.8% (0.2)% 95.6% 0.6%
LCR (%) 165.1% 149.7% 15.4% 165.0% 0.1%
NPL ratio (%) 6.1% 5.5% (0.6)% 6.2% 0.1%
AED million Q1-21 Q1-20Better /
(Worse)Q4-20
Better /
(Worse)
Net interest income 4,088 4,936 (17)% 4,044 1%
Non-funded income 2,075 1,948 6% 890 133%
Total income 6,163 6,885 (10)% 4,934 25%
Operating expenses (1,868) (2,049) 9% (2,047) 9%
Pre-impairment operating profit 4,296 4,836 (11)% 2,887 49%
Impairment allowances (1,763) (2,558) 31% (1,575) (12)%
Operating profit 2,533 2,278 11% 1,312 93%
Taxation charge and others (210) (197) (7)% 6 -
Net profit 2,322 2,081 12% 1,318 76%
Cost: income ratio 30.3% 29.8% (0.5)% 41.5% 11.2%
Net interest margin 2.46% 3.02% (0.56)% 2.42% 0.04%
Financial and Operating Performance 13

Net interest income
• Q1-21 NIM increased by 4 bps to 2.46% as improved deposit mix more than offset the
expected decline in DenizBank NIMs
• Loan yields were stable q-o-q reflecting modest change in short term interest rates in
recent quarters. 1 & 3-month EIBOR fell 4 and 12 bps respectively in Q1-21
• Funding costs improved on higher CASA
• DenizBank margins contracted due to Q4-20 and Q1-21 interest rate rises
• NIM declined 56 bps y-o-y as improved funding costs were more than offset by reduced
loan yields due to lower interest rates and lower DenizBank NIMs
• NIM guidance maintained at 2.35-2.45%
Q2 19Q1 19
2.72
2.83 2.842.77
2.83
2.82
Q3 19
3.11
2.89
Q4 19
3.02
Q1 20
2.68
Q2 20
2.48
2.732.65
Q3 20
2.42
Q4 20
2.46
Q1 21
YTD NIMQtrly NIM
0.46
0.78
0.18(1.45)
2.53
3.02
2.56
Q1 20 Loan Yield Deposit
Cost
Treasury
& Other
ENBD
Ex-Deniz
(0.07)
DenizBank Q1 21
2.46 0.15
Deposit
Cost
Q4 20
2.46
0.01
Loan Yield
(0.08)
Treasury
& Other
(0.04)
DenizBank Q1 21
2.42
Highlights Net Interest Margin (%)
Net Interest Margin Drivers (%)
Financial and Operating Performance 14

Loans and deposits trends
• Gross loans declined 1% in Q1-21 due to repayments of corporate loans including loans
receiving support and the FX translation impact on DenizBank’s loan book
• Retail lending increased 3% in Q1-21 followed by strong demand for personal loans, auto
loans and mortgages as volumes improved to pre Covid-19 levels
• Islamic financing broadly stable during Q1-21
• Corporate lending declined 1% on lower lending across various sectors during Q1-21
• DenizBank gross loans and deposits increased 6% in local currency terms and declined
5% in AED terms due to 11% decline in Turkish lira during Q1-21
• Deposit mix continues to improve with AED 16bn increase in CASA replacing AED 18bn
of more expensive Fixed Deposits
• CASA deposits represent 56% of total Group level deposits
• Domestic CASA engine strong at a record level of 65%
Highlights Trend in Gross Loans by Type (AED billion)
Trend in Deposits by Type (AED billion)Total Gross Loans by Sector
* Gross Islamic Financing Net of Deferred Income
4%
4%
4%
19%
11%
34%
6%2%
Hotels and restaurants
3%4%
AgricultureConstruction
Fin Institutions
Manufacturing
2%
Trans. & com.
Mgmt of Cos
Others
Personal
Real estate
3%Services
Sovereign
Trade
3%
56 57 57 58 60 60 62 62 62
42 41 42 43 41 40 43 44 45
86 87 86 87 83 85 81
Q4 20
266
476 479475
Q2 19
273
Q3 19
288
Q1 20 Q2 20
289
Q3 20
364
Q1 21
284
458 467 474 472
288279
Q4 19
287
Q1 19
365
267
0%-1%Islamic*
DenizBank Retail
Corporate
183 183 180 180 190 198 204 216 232
170 177 182 188 178 167 160 157 139
99 98 93 91 87 85 80
Q2 19 Q4 19
7 6
Q3 19
6
Q1 20
458
Q3 20
5
Q4 20Q2 20
8
Q1 21
77 7
472
Q1 19
7359 367
468 467 461 464 459
-2%-1%
DenizBank
Other CASA
Time
Financial and Operating Performance 15

Non-funded income
Highlights Composition of Non-Funded Income (AED million)
Trend in Core Gross Income (AED million)
• Core gross income up 77% q-o-q with increased contribution from all sources
• Core gross income improved q-o-q on higher transaction volumes coupled with increase in
foreign exchange and derivative income from hedging and swaps relating to DenizBank
• Core gross income declined 1% y-o-y primarily due to lower trade finance income
• Investment securities income improved y-o-y and q-o-q due to disposals
• Q1-21 total non-funded income improved 6% y-o-y on growth in transaction volumes and
higher investment securities income
AED million Q1-21 Q1-20Better /
(Worse)
Core gross income 2,518 2,551 (1)%
Fees & commission expense (666) (604) (10)%
Core income 1,854 1,947 (5)%
Property income / (loss) 7 (41) 116%
Investment securities & other income 215 42 407%
Total Non-Funded Income 2,075 1,948 6%
308 205 199 220
1,425
9641,160 1,083
1,494
766
601
717
751
Q3 20
93411,419
52
Q1 20 Q4 20
41
Q2 20
106
44
53
Q1 21
2,5182,551
1,712
2,122
+77%
-1%
Forex, Rates & Other
Trade financeBrokerage & AM fees
Fee Income
Financial and Operating Performance 16

Operating expenses
Highlights Cost to Income Ratio (%)
Operating expenses composition (AED million)
• Q1-21 expenses down 9% q-o-q from the impact of earlier cost management initiatives
and lower marketing expenses
• Q1-21 expenses y-o-y improved 9% on lower staff and operating expenses, and lower
costs from DenizBank
• Q1-21 cost to income ratio of 30.3% is lower than guidance on stronger non-funded
income, particularly from DenizBank. Cost to Income guidance remains at 35%
510 419 400586 510
254256 249
245230
1,2091,194
1,079
1,1341,063
76
Q2 20 Q4 20
82
2,049
Q1 20
8282
Q3 20
65
Q1 21
1,9511,810 1,868
2,047 -9%-9%
Staff Occupancy Depreciation & Amortization Other
29.7 30.332.1 31.7 31.8
29.6
31.3
29.8
34.032.0
30.3
Q4 19 Q3 20Q1 19 Q2 20Q1 20Q2 19 Q3 19
36.4 33.8
41.5
Q4 20 Q1 21
CI Ratio (YTD) CI Ratio (QTD)
Target
Financial and Operating Performance 17

Credit quality
• NPL ratio improved by 0.1% to 6.1% in Q1-21 due to corporate recoveries and DenizBank
FX translation
• Coverage ratio further strengthened to 125.1% during Q1-21
• Q1-21 cost of risk decreased to 158 bps (285 bps for DenizBank and 131 bps ENBD) from
210 bps (430 bps for DenizBank and 161 bps ENBD) in Q1-20 due to improved economic
sentiment
• AED 132m of write backs and recoveries in Q1-21 compared to AED 356m during same
period last year
• Stage 1 and 2 ECL allowances amount to AED 11.4bn or 2.9% of CRWA
Highlights Impaired Loan & Coverage Ratios (%)
Impaired Loans and Impairment Allowances (AED billion)
5.9 5.94.8 5.6 5.5 5.8 6.0 6.2 6.1
Q1 20Q3 19
123.9125.8
Q1 21Q1 19 Q2 19
126.6
112.3
Q4 19
120.5119.6
116.9
Q2 20 Q3 20
117.3
Q4 20
125.1
NPL ratio Coverage ratio
5.8
4.3
16.1 16.8
26.14.6
0.74.9 5.4
Q1 21Q2 20
4.5
17.4
1.00.8
4.9
18.1
1.0
5.8
Q4 20
4.3
17.9
0.8
5.4
Q3 20
27.6
Q1 20
28.4 28.929.8-3%
+11%
DenizBank RetailCore Corporate Islamic
23.922.4
4.3
22.3
5.71.6
Q1 20
5.5 6.1
Q2 20
3.6
23.0
36.1
1.65.8
4.1
23.1
1.7
Q4 20
1.76.2
Q1 21Q3 20
2.1 2.9
1.2
31.5 32.334.0 35.0
+3%
+15%
*Includes purchase originated credit impaired loans of AED 1.8bn (Dec-20: AED 2.1bn) acquired at fair value Financial and Operating Performance
Impaired Loans* Impairment Allowances
18

Impairment allowances and Stage 1, 2 and 3 Coverage
Highlights Impairment allowances and Coverage %
Total Gross Loans UAE Customers receiving payment deferrals (AED billion)
*Stage 3 coverage adjusted for purchase originated credit impaired loans acquired at fair value
• Stage 1 coverage ratio remains healthy at 1.1% with AED 4.5 bn of impairment allowances
• Stage 2 impairment allowances boosted to AED 6.9 bn, strengthening the coverage ratio to
21.5%, while Stage 2 loans increased with continued stage migrations
• Stage 3 coverage ratio strengthened to 88% as NPL ratio improved 0.1% to 6.1%
• The Bank has supported 110,983 customers with AED 10.3 billion of deferrals, of which
AED 5.5 billion has been repaid, resulting in net support of AED 4.8 billion as at 31-Mar-21
• UAE customers continue to repay support demonstrating improving business sentiment
87%7%
6%
Stage 1 Stage 2 Stage 3
Q4-20 (AED 479bn) Q1-21 (AED 472bn)
4.54.6
Q1-21
5.7 6.9
24.7
Q4-20
24.7
35.0 36.1
Stage 3Stage 1 Stage 2
85.7 88.0
21.1 21.5
Q4-20
1.1 1.1
Q1-21
ECL Allowances (AED billion) *ECL to Loan Coverage %
Financial and Operating Performance
88%6%
6%
8.3
6.65.2 4.8
1.9 4.0 5.5
9.28.5
Q2 20
10.3
Q3 20 Q4 20 Q1 21
Repayment Existing Support
19
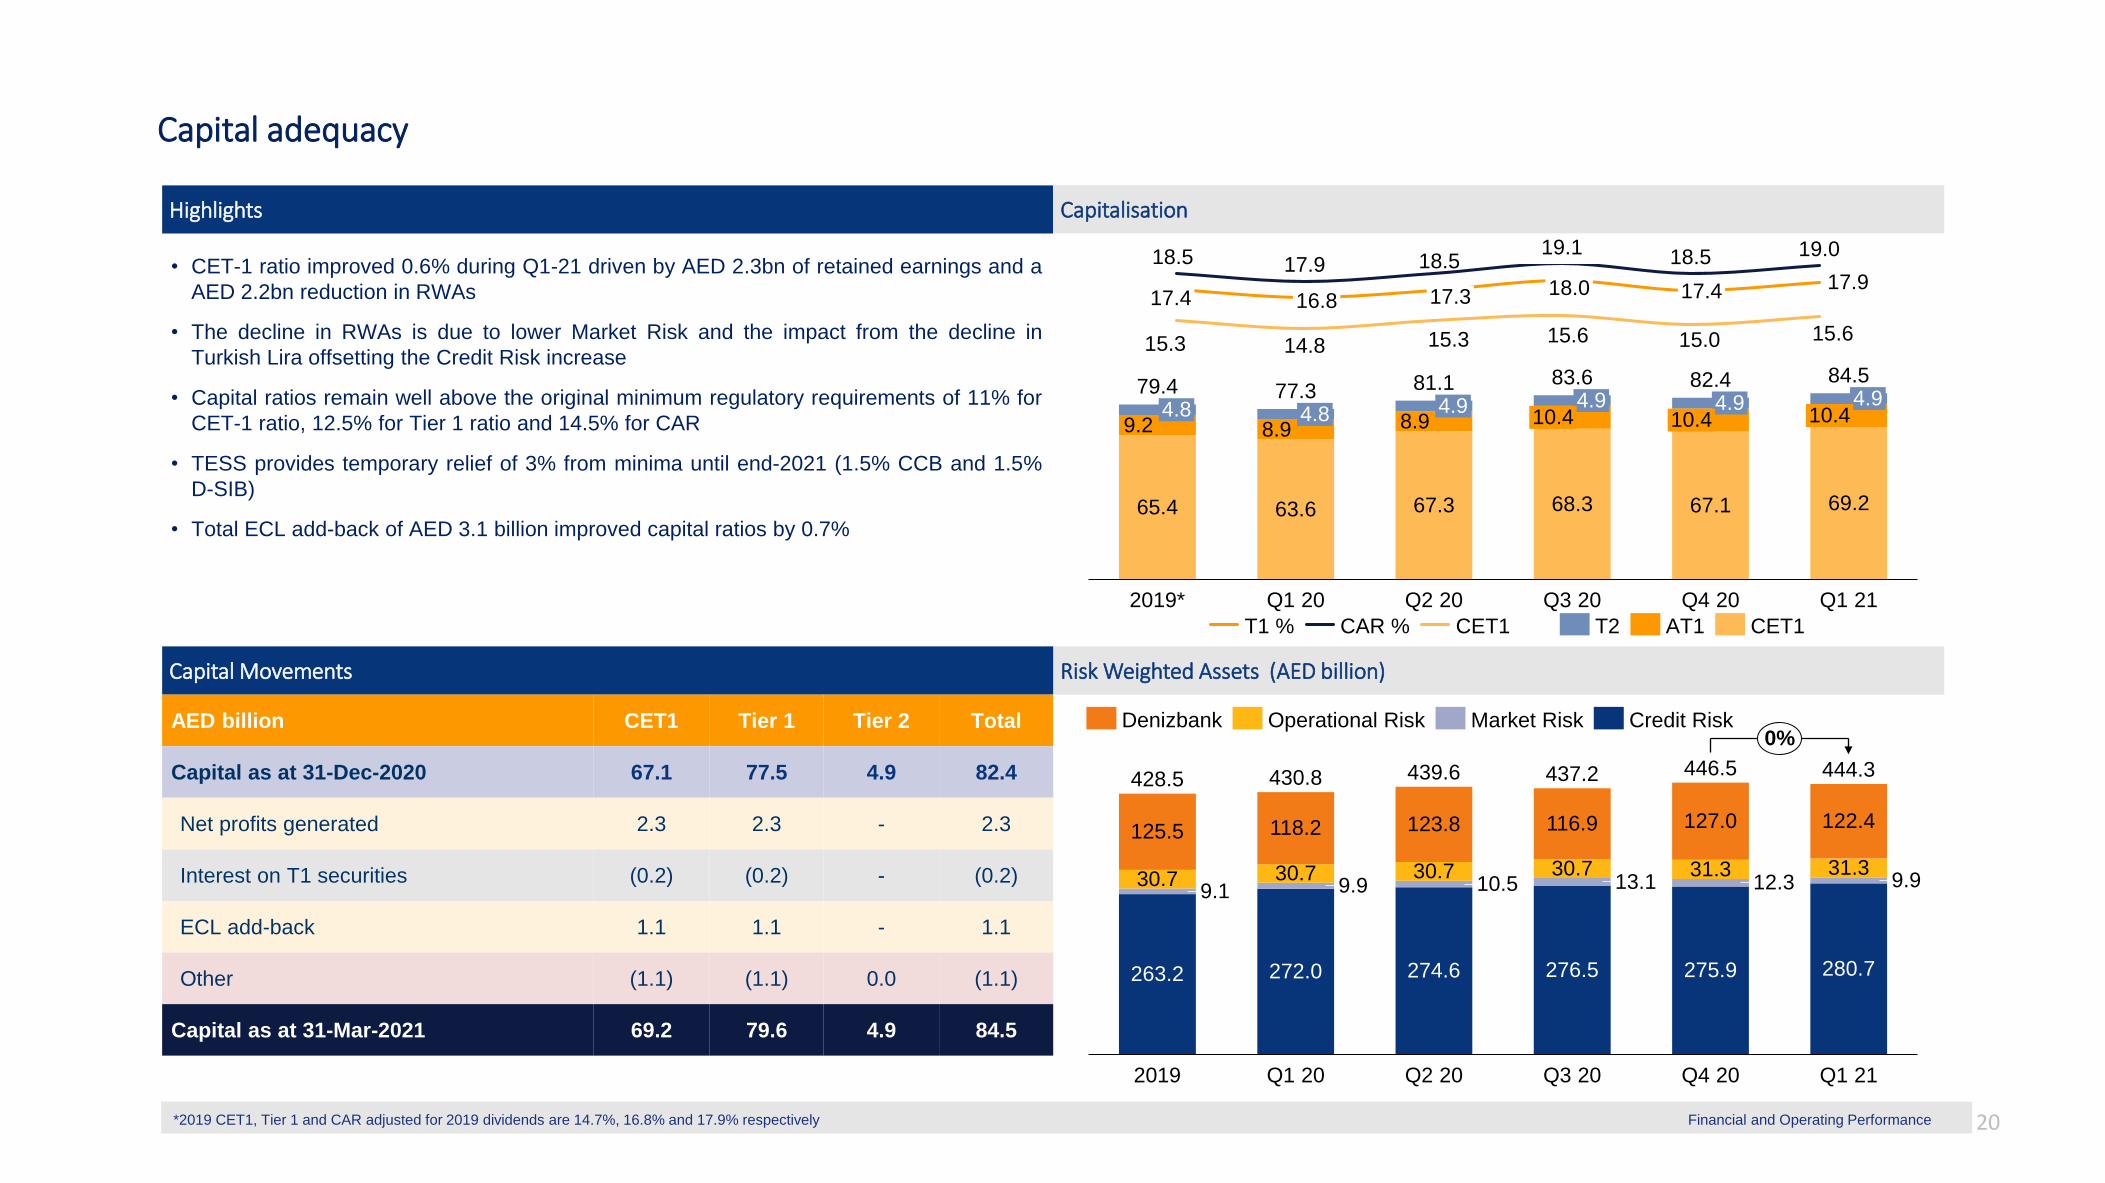
Capital adequacy
Highlights Capitalisation
Risk Weighted Assets (AED billion)Capital Movements
• CET-1 ratio improved 0.6% during Q1-21 driven by AED 2.3bn of retained earnings and a
AED 2.2bn reduction in RWAs
• The decline in RWAs is due to lower Market Risk and the impact from the decline in
Turkish Lira offsetting the Credit Risk increase
• Capital ratios remain well above the original minimum regulatory requirements of 11% for
CET-1 ratio, 12.5% for Tier 1 ratio and 14.5% for CAR
• TESS provides temporary relief of 3% from minima until end-2021 (1.5% CCB and 1.5%
D-SIB)
• Total ECL add-back of AED 3.1 billion improved capital ratios by 0.7%
*2019 CET1, Tier 1 and CAR adjusted for 2019 dividends are 14.7%, 16.8% and 17.9% respectively
AED billion CET1 Tier 1 Tier 2 Total
Capital as at 31-Dec-2020 67.1 77.5 4.9 82.4
Net profits generated 2.3 2.3 - 2.3
Interest on T1 securities (0.2) (0.2) - (0.2)
ECL add-back 1.1 1.1 - 1.1
Other (1.1) (1.1) 0.0 (1.1)
Capital as at 31-Mar-2021 69.2 79.6 4.9 84.5
30.7 9.930.7
9.1
439.6
2019
263.2
118.2
272.0
127.0
Q1 21
30.710.5
123.8
274.6
437.2
Q1 20 Q2 20
116.9
30.7
122.4
Q3 20
13.1
276.5
31.312.3
280.7
31.3
275.9
Q4 20
9.9
444.3
125.5
428.5 430.8 446.5
0%Denizbank Operational Risk Market Risk Credit Risk
17.9
18.5 17.9 18.519.1 18.5 19.0
15.3 14.8 15.3 15.6 15.0 15.6
17.417.4 16.8 17.3 18.0
65.4 63.6 67.3 68.3 67.1 69.2
9.2 8.9 8.9
79.44.9
2019*
4.8 10.44.94.8
Q1 20 Q2 20 Q3 20
4.977.3
Q1 21
10.4
Q4 20
4.910.4
81.1 83.6 82.4 84.5
T2 AT1 CET1T1 % CAR % CET1
Financial and Operating Performance 20

Funding and liquidity
• Q4-20 LCR of 165.1% and ADR of 95.0% demonstrate the Group’s continuing healthy
liquidity position
• Liquid assets* of AED 88 billion cover 14% of total liabilities and 19% of deposits
• 2021 issuances of AED 15.4bn cover 90% of this year’s term debt maturities
• Emirates NBD became first bank from Gulf region to issue an ESG-linked syndicated
loan, raising $1.75 billion of 3-year funding with interest ratchet linked to performance of
ESG criteria
• DenizBank issued a $435m equivalent Diversified Payment Rights transaction with 3, 5 &
7-year tranches in Feb-21, significantly increasing and extending its term liability profile
Highlights Advances to Deposit and Liquidity Coverage Ratio (%)
Maturity profile of Debt Issued (AED billion)Composition of liabilities / Debt issued (%)
*Including cash and deposits with Central Banks but excluding interbank balances and liquid investment securities
198.8188.8
149.3 160.0149.7 152.5 161.7 165.0 165.1
0
50
100
150
200
250
Q1 19 Q2 19 Q4 20Q4 19Q3 19 Q1 20 Q2 20 Q3 20 Q1 21
LCR %
94.092.1 91.8
92.6
94.896.1 96.6
95.6 95.0
95
90
100ADR %
LCR (%) ADR (%)
8.010.1
3.4 3.0
8.5
12.2
9.42.2
6.4
1.20.2
0.2
2021 2022
12.4
9.8
0.1
2023 2024 2025 2026 -
- 2034
Beyond
2034
10.2 10.3
3.6
9.4
DenizBank Club Deal Public & Private Placement
Maturity Profile of Debt/ Sukuk Issued AED 65.0bn
Financial and Operating Performance
Customer deposits
75%
Banks9%
Others6%
EMTNs8%
Syn bank borrow.1%
Loan secur.0%
Sukuk1%
Debt/Sukuk10%
Liabilities (AED 612.4bn) Debt/Sukuk (AED 65.0bn)
21

Liquidity within the UAE banking system remains healthy
Highlights Bank loan and deposit growth
UAE banking market (USD Bn), March 2021*GCC banking market, March 2021
• The gross advances to deposits ratio for the UAE remained healthy at 94.6% in February
2021
• Growth in the UAE bank deposits rose 2.8% y-o-y in February while gross bank lending
slowed to 1.1% y-o-y
• Gross loan growth continues to be driven by lending to government and the public sector,
with lending to the private sector declining 2.4% y-o-y
• Broad money supply (M2) grew 4.9% y-o-y in February, the fastest annual growth in three
months
Source: UAE Central Bank, Bloomberg; *ENBD as at 31-Mar-2021 excluding DenizBank Economic Environment
Banking Assets USD Bn
KSA
UAE
Oman
Kuwait
Qatar
82
244
461
802
865
188
125
129
677
387
355
Assets
Deposits
Gross Loans
Emirates NBD Other Banks
865
512
484
90
95
100
105
110
0
2
4
6
8
10
12
Dec-16 Jun-17 Dec-17 Jun-18 Dec-18 Jun-19 Dec-19 Jun-20 Dec-20
AD Ratio (RHS) Bank Deposits (LHS) Bank Loans (LHS)% y/y %
22

UAE economy expected to grow to 1.4% in 2021
Highlights UAE oil production and prices
Residential property pricesUAE GDP growth
• Emirates NBD Research expects the non-oil economy to grow by 3.5% in 2021.
• Curbs on oil production will weigh on GDP growth, expected to be 1.4% this year
• Higher economic growth expected this year in all the countries that the Group operates in
• UAE PMI improved in March on the back of the UAE’s successful Covid-19 vaccine
rollout, as well as a resumption of construction projects
• Residential real estate prices declined -4.4% y/y but were up 3.3 q/q in Q1-21, marking
the first quarterly rise in apartment sales prices since Q4-16 (data from ASTECO)
• Global oil demand very much in recovery mode in major markets but still far from levels
seen prior to the Covid-19 pandemic
Source: Bloomberg, BIS, * ENBD Research forecasts Economic Environment
2.8 2.93.0
3.23.1 3.1 3.1 3.1
3.1
2.9 2.9
2.52.6
0
10
20
30
40
50
60
70
80
90
2.2
2.4
2.6
2.8
3.0
3.2
3.4
Q1 Q2 Q3 Q4 Q1 Q2 Q3 Q4 Q1 Q2 Q3 Q4 Q1
2018 2019 2020 2021
US
D /
b
mn
b/d
UAE oil output (LHS) Brent oil (RHS)
-30
-20
-10
0
10
20
30
40
50
Jan-10 Aug-11 Mar-13 Oct-14 May-16 Dec-17 Jul-19 Feb-21
Dubai Abu Dhabi
% y/y growth
3.02.4
1.21.7
-6.9
1.4
4.3
-8.0
-6.0
-4.0
-2.0
0.0
2.0
4.0
6.0
2016 2017 2018 2019 2020f* 2021f* 2022f*
% y/y growth
23
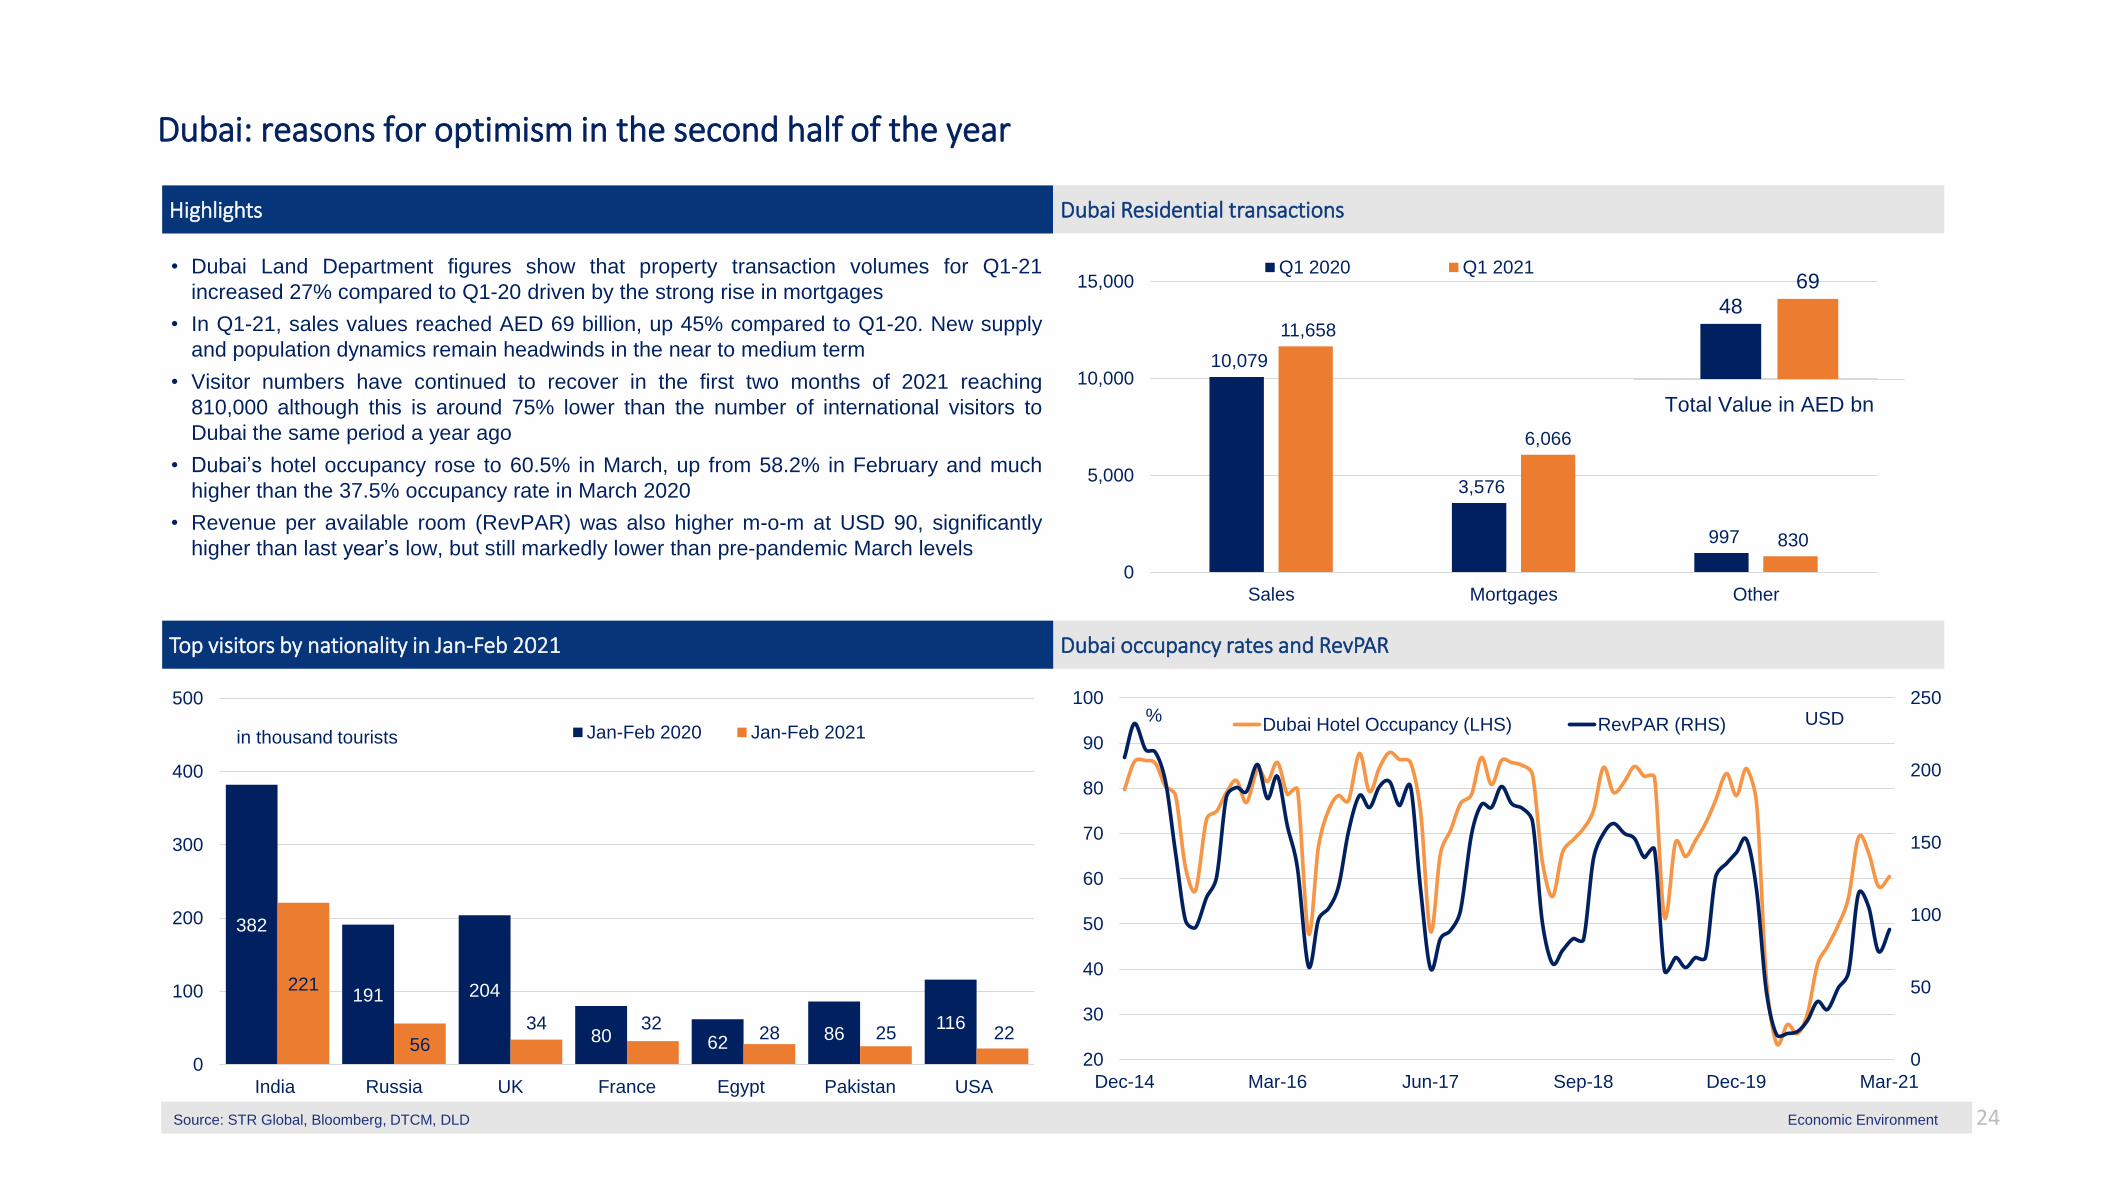
Dubai: reasons for optimism in the second half of the year
Highlights Dubai Residential transactions
Dubai occupancy rates and RevPAR Top visitors by nationality in Jan-Feb 2021
• Dubai Land Department figures show that property transaction volumes for Q1-21
increased 27% compared to Q1-20 driven by the strong rise in mortgages
• In Q1-21, sales values reached AED 69 billion, up 45% compared to Q1-20. New supply
and population dynamics remain headwinds in the near to medium term
• Visitor numbers have continued to recover in the first two months of 2021 reaching
810,000 although this is around 75% lower than the number of international visitors to
Dubai the same period a year ago
• Dubai’s hotel occupancy rose to 60.5% in March, up from 58.2% in February and much
higher than the 37.5% occupancy rate in March 2020
• Revenue per available room (RevPAR) was also higher m-o-m at USD 90, significantly
higher than last year’s low, but still markedly lower than pre-pandemic March levels
Source: STR Global, Bloomberg, DTCM, DLD Economic Environment
10,079
3,576
997
11,658
6,066
830
0
5,000
10,000
15,000
Sales Mortgages Other
Q1 2020 Q1 2021
48
69
Total Value in AED bn
0
50
100
150
200
250
20
30
40
50
60
70
80
90
100
Dec-14 Mar-16 Jun-17 Sep-18 Dec-19 Mar-21
Dubai Hotel Occupancy (LHS) RevPAR (RHS) USD%
382
191 204
80 6286
116
221
5634 32
28 25 22
0
100
200
300
400
500
India Russia UK France Egypt Pakistan USA
Jan-Feb 2020 Jan-Feb 2021in thousand tourists
24

Divisional performance (excluding DenizBank)
Retail Banking & Wealth Management
Emirates Islamic
• RBWM income up 4% q-o-q as higher volumes drove 14% increase in non funded income
• Net interest income stable compared to the previous quarter and lower y-o-y due to the
impact of interest rate cuts in Q1-20
• Customer advances grew marginally with new credit card acquisitions and spends back to
pre-Covid levels backed by successful domestic usage campaigns
• Liabilities grew by 3% with CASA balances increasing AED 7.2bn, up 5% during Q1-21
supported by successful customer campaigns
• Digital adoption strengthened further with over 3/4 of customers being digitally active while
Liv. continued to strengthen, growing its UAE base to about 450,000 customers
• EI total income improved 12% q-o-q as non funded income improved 51% on improved
market activity during Q1-21. Total income declined 10% y-o-y due to lower profit rates
• Total assets at AED 71.2 billion, up 1% from end 2020
• Customer financing at AED 41.2 billion, up 1% from end 2020
• Customer deposits at AED 46.6 billion, down 1% from end 2020
• CASA balances represented 79% of customer accounts compared to 69% at end of 2020
• EI’s headline Financing to Deposit ratio stands at 88% and remains comfortably under the
management’s range
Divisional Performance
46.2 46.4
165.0 170.2
Q4 20 Q1 21
0%+3%
DepositsLoans
671 555 634
1,4301,334 1,336
Q4 20Q1 20 Q1 21
2,1011,889 1,970
+4%
-6%
NII NFI
Balance Sheet Trends AED billion Income Trends AED million
40.8 41.246.9 46.6
Q4 20 Q1 21
+1%
-1%
Financing receivables Customer accounts
173 117 177
468
397398
Q1 20 Q4 20 Q1 21
514
641574
+12%
-10%
NII NFI
Balance Sheet Trends AED billion Income Trends AED million
25

Divisional performance (excluding DenizBank)
Corporate and Institutional Banking
Global Markets & Treasury
• CIB income up 8% q-o-q as non funded income improved 26% on higher business
volumes and net interest income improved 2%
• Income down 11% y-o-y due to lower interest rates that were partially offset by improved
non funded income from higher investment banking activity
• CIB continued to invest in digitization programmes and technology to enhance the
Transaction Banking Services product offering
• Loans down 1% in Q1-21 due to repayments of corporate loans including loans receiving
support
• CIB continues to provide support to customers affected by Covid-19
• Deposits down 3% with focus improving the deposit mix reflecting the Group’s aim to
reduce the average cost of funding while maintaining optimal liquidity
• GM&T total income up 103% q-o-q due to improved non-funded income whilst net interest
income improved on account of stability in interest rates
• Trading & Sales desks delivered solid performance with trading income up 60% compared
to Q1-20, helped by increased contributions from credit and rates trading teams
• The first bank from the Gulf region to issue an ESG-linked loan, with cost of the USD 1.75
billion facility based on percentage of women in senior management and water efficiency
• NFI increased q-o-q on higher trading income and the impact from interest rate hedging
actions taken in Q4-20
Divisional Performance
Balance Sheet Trends AED billion Income Trends AED million
Income Trends AED million
276.0 273.0
166.0 160.4
Q4 20 Q1 21
-1%
-3%
Loans Deposits
373 335 421
1,2711,023 1,045
Q1 21Q1 20 Q4 20
1,643
1,3581,466
+8%
-11%
NII NFI
87
-117
90
-74
-169
-83
Q4 20
7
Q1 20 Q1 21
-286
14
-46%+103%
NII NFI
26

DenizBank business overview
• DenizBank contributed total income of AED 2,039m and net profit of AED 642m to the
Group for Q1-21
• Q1-21 net cost of risk of 285 bps compared to 430 bps in Q1-20 and 327 bps in Q4-20
• Total assets of AED 126bn, net loans of AED 77bn and deposits of AED 80bn at the end
of Q1-21
• DenizBank is the fifth largest private bank in Turkey with a wide presence through a
network of 720 branches and over 3,100 ATMs
• Operates with 693 branches in Turkey and 27 in other territories (Austria, Germany,
Bahrain)
• Servicing around 14m customers with full services of Corporate banking, Retail banking
and Treasury, through 14,000+ employees
Business Overview Financial Highlights
Financial Highlights (AED billion)Segment breakdown
All financial numbers post acquisition (1-Aug-19) include the fair value adjustments, unless otherwise stated.
AED million Q1-21 Q1-20Better /
(Worse)Q4-20
Better /
(Worse)
Net interest income 1,285 1,571 (18)% 1,323 (3)%
Non-funded income 754 684 10% 23 3,176%
Total income 2,039 2,255 (10)% 1,346 51%
Operating expenses (559) (627) 11% (552) (1)%
Pre-impairment operating profit 1,481 1,628 (9)% 794 86%
Impairment allowances (659) (981) 33% (721) 9%
Operating profit 822 647 27% 73 1,025%
Taxation charge (180) (143) (26)% 57 (416)%
Net profit 642 504 27% 130 393%
Cost: income ratio 27.5% 27.8% 0.3% 41.0% 13.5%
Net interest margin 4.13% 4.92% (0.79)% 4.27% (0.14)%
56%
44%
Corporate Banking
Consumer Banking
Net Loans as at 31-Mar-21
131.0 125.5
81.3 76.684.9 80.3
Q1-21Q4-20
Assets Net Loans Deposits
7.0 6.7
91.2 91.8
AD Ratio(Unadjusted)
NPL Ratio (Unadjusted)
Financial and Operating Performance 27

Thank you
Investor Relations
Emirates NBD Head Office I 4th Floor
PO Box 777 I Dubai, UAE
Tel: +971 4 609 3046


