Embed Size (px)
Citation preview
INVESTOR PRESENTATION DECEMBER 2013
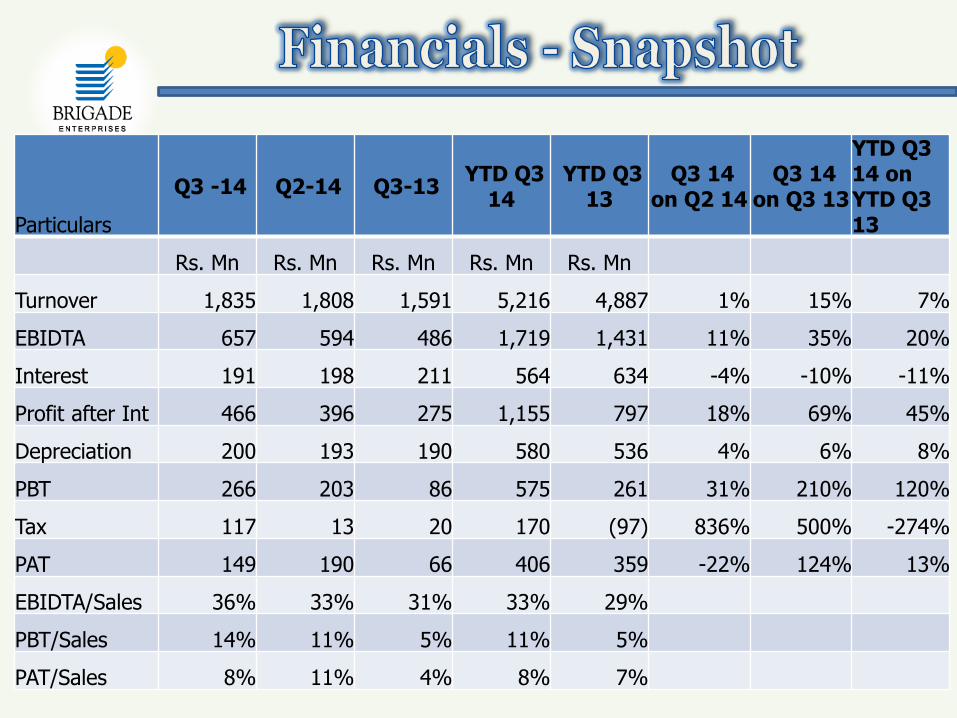
Particulars
Q3 -14 Q2-14 Q3-13 YTD Q3
14 YTD Q3
13 Q3 14
on Q2 14 Q3 14
on Q3 13
YTD Q3 14 on YTD Q3 13
Rs. Mn Rs. Mn Rs. Mn Rs. Mn Rs. Mn
Turnover 1,835 1,808 1,591 5,216 4,887 1% 15% 7%
EBIDTA 657 594 486 1,719 1,431 11% 35% 20%
Interest 191 198 211 564 634 -4% -10% -11%
Profit after Int 466 396 275 1,155 797 18% 69% 45%
Depreciation 200 193 190 580 536 4% 6% 8%
PBT 266 203 86 575 261 31% 210% 120%
Tax 117 13 20 170 (97) 836% 500% -274%
PAT 149 190 66 406 359 -22% 124% 13%
EBIDTA/Sales 36% 33% 31% 33% 29%
PBT/Sales 14% 11% 5% 11% 5%
PAT/Sales 8% 11% 4% 8% 7%

Rs. in Million
Particulars Real Estate Hospitality Lease rentals
Total
Revenue 3,272 886 1,057 5,216
Expenses 2,405 227 - 2,631
Gross profit 868 660 1,057 2,585
Admin Expenses 145 157 142 445
Employee cost 249 157 15 421
EBIDTA 474 345 900 1,719
EBIDTA / Revenue % 14.47% 38.97% 85.14% 32.96%
Interest 35 159 370 564
Profit after interest 439 186 530 1,155
Depreciation 40 204 336 580
PBT 399 (18) 194 575
Income Tax 170
PAT 406
For 9 months ended Dec 2013
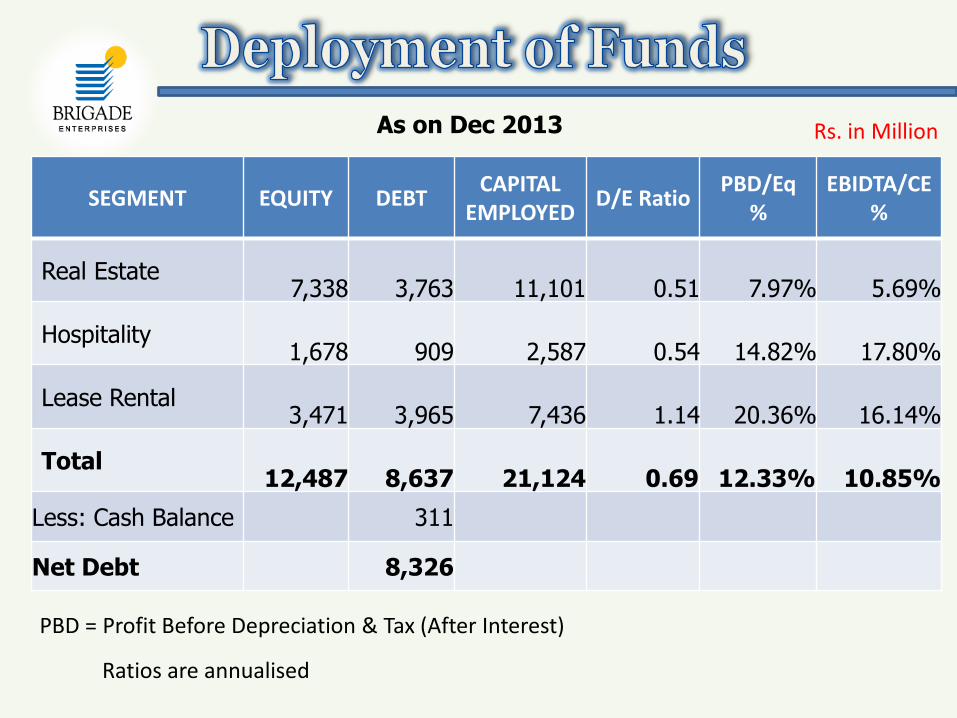
Rs. in Million
SEGMENT EQUITY DEBT CAPITAL
EMPLOYED D/E Ratio
PBD/Eq %
EBIDTA/CE %
Real Estate 7,338 3,763 11,101 0.51 7.97% 5.69%
Hospitality 1,678 909 2,587 0.54 14.82% 17.80%
Lease Rental 3,471 3,965 7,436 1.14 20.36% 16.14%
Total 12,487 8,637 21,124 0.69 12.33% 10.85%
Less: Cash Balance 311
Net Debt 8,326
As on Dec 2013
PBD = Profit Before Depreciation & Tax (After Interest)
Ratios are annualised
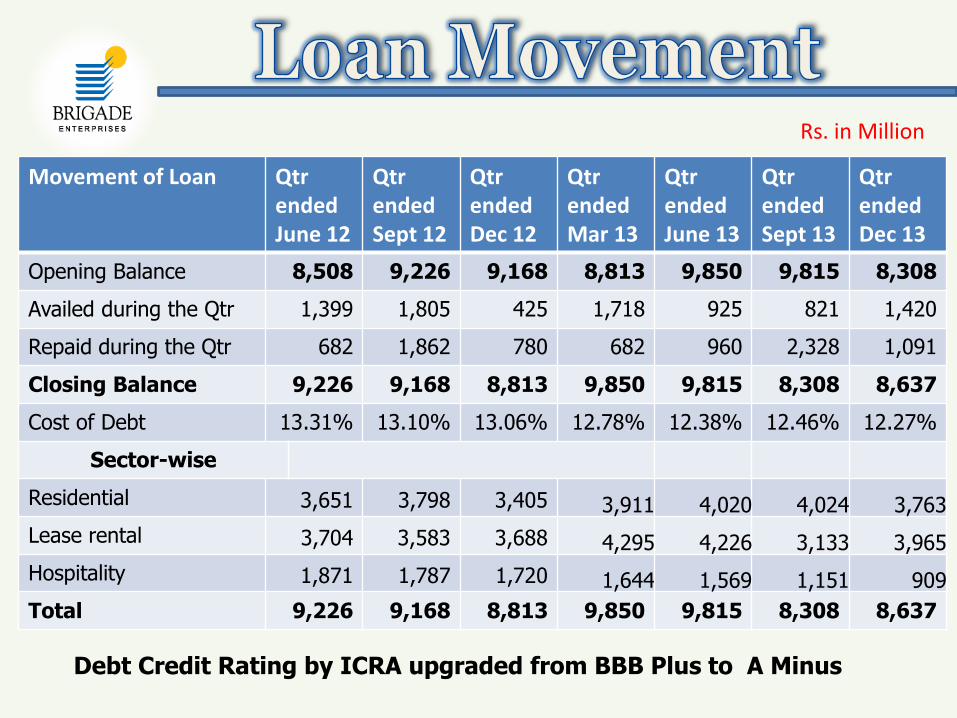
Rs. in Million
Movement of Loan Qtr ended June 12
Qtr ended Sept 12
Qtr ended Dec 12
Qtr ended Mar 13
Qtr ended June 13
Qtr ended Sept 13
Qtr ended Dec 13
Opening Balance 8,508 9,226 9,168 8,813 9,850 9,815 8,308
Availed during the Qtr 1,399 1,805 425 1,718 925 821 1,420
Repaid during the Qtr 682 1,862 780 682 960 2,328 1,091
Closing Balance 9,226 9,168 8,813 9,850 9,815 8,308 8,637
Cost of Debt 13.31% 13.10% 13.06% 12.78% 12.38% 12.46% 12.27%
Sector-wise
Residential 3,651 3,798 3,405 3,911 4,020 4,024 3,763
Lease rental 3,704 3,583 3,688 4,295 4,226 3,133 3,965
Hospitality 1,871 1,787 1,720 1,644 1,569 1,151 909
Total 9,226 9,168 8,813 9,850 9,815 8,308 8,637
Debt Credit Rating by ICRA upgraded from BBB Plus to A Minus

Rs.
Mn
8,537 8,508
9,226 9,168
8,813
9,850 9,815
8,308
8,637
13.86%
13.55%
13.31%
13.11% 13.06%
12.78%
12.38% 12.46%
12.27%
11.00%
11.50%
12.00%
12.50%
13.00%
13.50%
14.00%
7,500
8,000
8,500
9,000
9,500
10,000
Dec-11 Mar-12 Jun-12 Sep-12 Dec-12 Mar-13 Jun-13 Sep-13 Dec-13
Debt Int Rate

Type Q1 Q2 Q3 Q4 Total
Residential 715 678 473 1,866
Commercial 31 132 163
Total 715 709 605 2,029
2012-13 Quarterly sales (SFt in ‘000)
Type Q1 Q2 Q3 Q4 Total
Residential 300 271
297 537 1,405
Commercial 151 79
125 108 463
Total 451 350
422 645 1,868
=======2013-14 Sales (SFt in ‘000)=========
Increase in volume of business by 66% for 9 months on y-o-y basis

Type Q1 Q2 Q3 Q4 Total
Residential 3,345 3,364 2,579 9,288
Commercial 218 1,016 1,234
Total 3,345 3,582 3,595 10,522
Avg Rate/ SFT Rs. 4,678 5,050 5,946 5,186
2012-13 Quarterly sales ( Rs. In Mn)
Type Q1 Q2 Q3 Q4 Total
Residential 1,089 1,002 1,076 2,322 5,489
Commercial 924 376 554 518 2,372
Total 2,013 1,378
1,630 2,840 7,861
Avg Rate/ SFT Rs. 4,464 3,937 3,863 4,406 4,209
Increase in Sales value by 109% on year on year basis. Increase in Average Price Realisation 23% over previous year.
=======2013-14 Sales (Rs. In Mn)=========

Location Q-1 Q-2 Q-3 Total
Area in SFt Bangalore 6,79,960 634,102 5,25,160 18,39,222 Mysore 12,520 58,000 62,230 1,32,750 Chikmagalur 700 2,150 2,850 Mangalore 9,660 17,190 15,120 41,970 Hyderabad 12,180 12,180 Total 7,15,020 709,292 6,04,660 20,28,972
Q-1 Q-2 Q-3 Total
Rs. In Mn Bangalore 3,118 3,312 3,249 9,679 Mysore 43 196 275 514 Chikmagalur 2 7 9 Mangalore 42 74 64 180 Hyderabad 139 139 Total 3,345 3,582 3,595 10,522
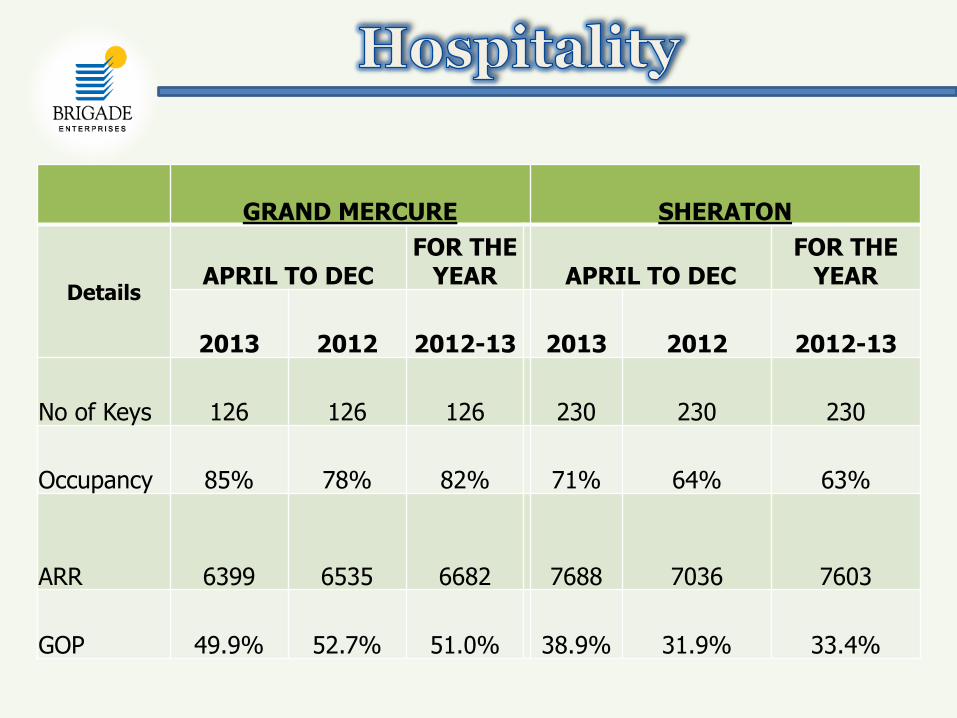
GRAND MERCURE SHERATON
Details APRIL TO DEC
FOR THE YEAR APRIL TO DEC
FOR THE YEAR
2013 2012 2012-13 2013 2012 2012-13
No of Keys 126 126 126 230 230 230
Occupancy 85% 78% 82% 71% 64% 63%
ARR 6399 6535 6682 7688 7036 7603
GOP 49.9% 52.7% 51.0% 38.9% 31.9% 33.4%

Leasable Area Leased out In pipe Line To be
Leased
WTC 599 529 70
South Parade 117 73 12 32
Orion Mall 825 772 53
B.Solitare, B.lore 10 10
Others 13 13
Total 1,564 1,397 12 155
Area in ‘000 SFt
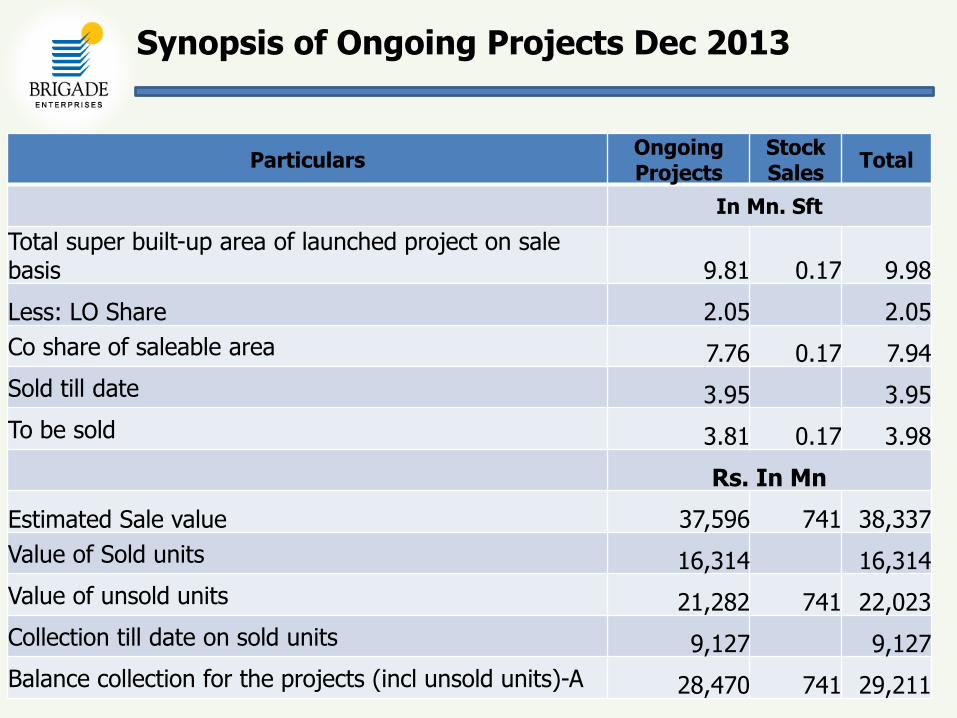
Particulars Ongoing Projects
Stock Sales
Total
In Mn. Sft
Total super built-up area of launched project on sale basis 9.81 0.17 9.98
Less: LO Share 2.05 2.05
Co share of saleable area 7.76 0.17 7.94
Sold till date 3.95 3.95
To be sold 3.81 0.17 3.98
Rs. In Mn
Estimated Sale value 37,596 741 38,337
Value of Sold units 16,314 16,314
Value of unsold units 21,282 741 22,023
Collection till date on sold units 9,127 9,127
Balance collection for the projects (incl unsold units)-A 28,470 741 29,211
Synopsis of Ongoing Projects Dec 2013
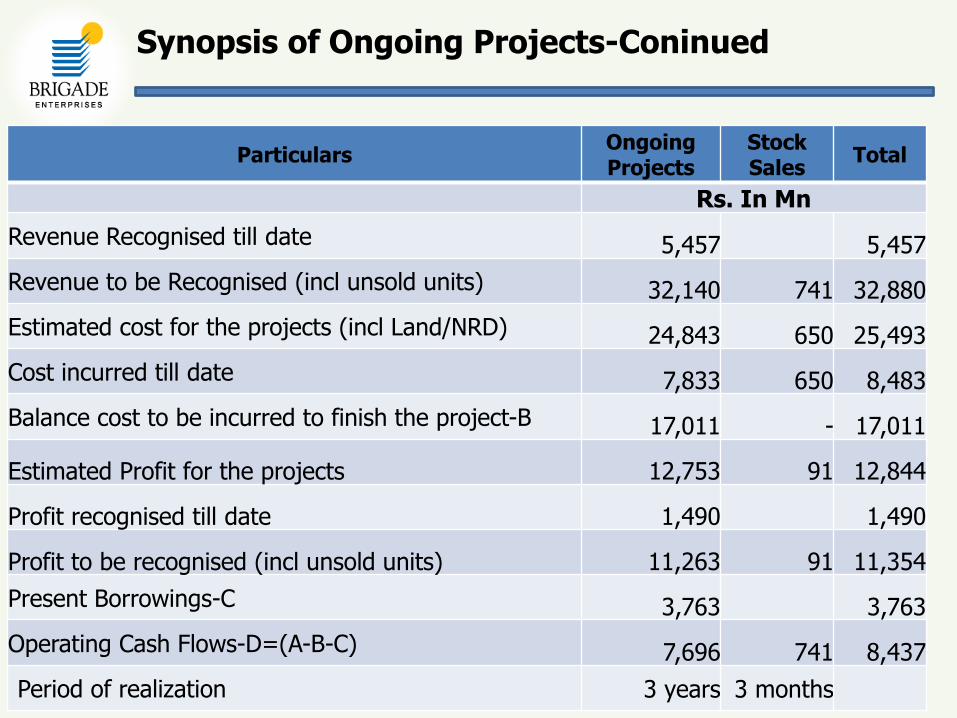
Particulars Ongoing Projects
Stock Sales
Total
Rs. In Mn
Revenue Recognised till date 5,457 5,457
Revenue to be Recognised (incl unsold units) 32,140 741 32,880
Estimated cost for the projects (incl Land/NRD) 24,843 650 25,493
Cost incurred till date 7,833 650 8,483
Balance cost to be incurred to finish the project-B 17,011 - 17,011
Estimated Profit for the projects 12,753 91 12,844
Profit recognised till date 1,490 1,490
Profit to be recognised (incl unsold units) 11,263 91 11,354
Present Borrowings-C 3,763 3,763
Operating Cash Flows-D=(A-B-C) 7,696 741 8,437
Period of realization 3 years 3 months
Synopsis of Ongoing Projects-Coninued

Projects Project Area LO/JV share Co Share Residential projects 98,11,219 20,46,918 77,64,301
B.Orchards * 11,51,614 5,75,807 5,75,807
B.Cosmopolis * 8,04,000 3,93,960 4,10,040
Total Residential 1,17,66,833 30,16,685 87,50,148
B. Metropolis Annex 460,665 230,333 230,332
B Banaswadi-Retail 2,71,830 1,19,605 1,52,225
B.Vantage, Mysore 1,31,130 65,565 65,565
B.Vantage Chennai 1,32,810 66,405 66,405
B. Info Park, Kochi 3,46,910 3,46,910
Total Commercial 13,43,345 4,81,908 8,61,437
B. Holiday Inn-Chennai 2,28,640 1,14,320 1,14,320
Mercure, Mysore 1,04,580 1,04,580
Total Hospitality 3,33,220 1,14,320 2,18,900
Grand Total 1,34,43,398 36,12,913 98,30,486
* Through SPV
Area in SFT As on Dec 2013
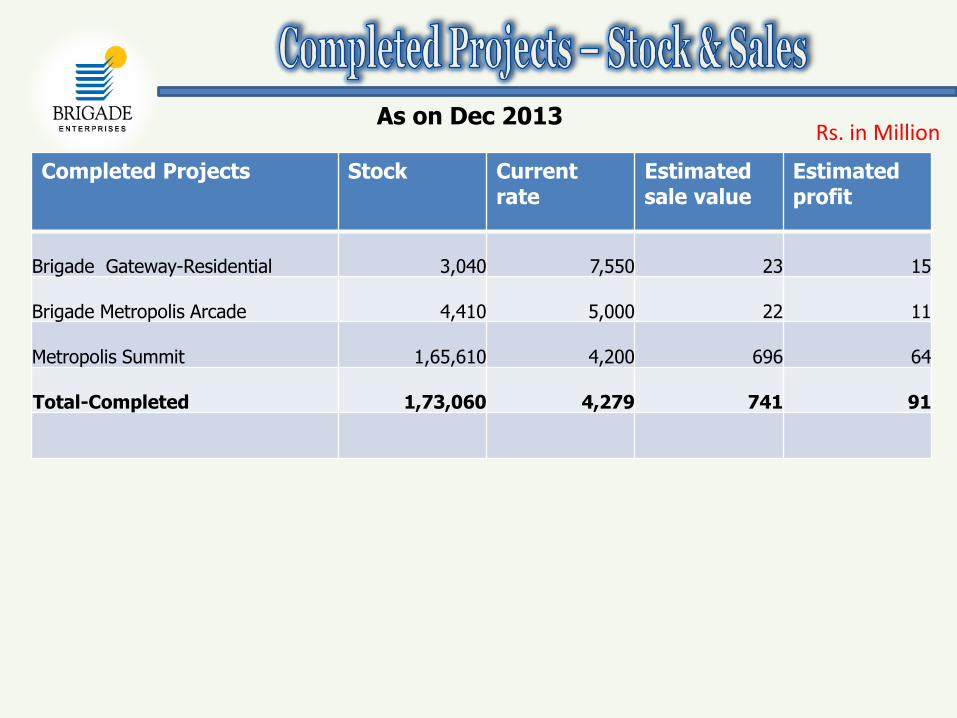
Completed Projects Stock Current rate
Estimated sale value
Estimated profit
Brigade Gateway-Residential 3,040
7,550
23 15
Brigade Metropolis Arcade 4,410
5,000
22 11
Metropolis Summit 1,65,610
4,200
696 64
Total-Completed 1,73,060
4,279
741 91
Rs. in Million As on Dec 2013
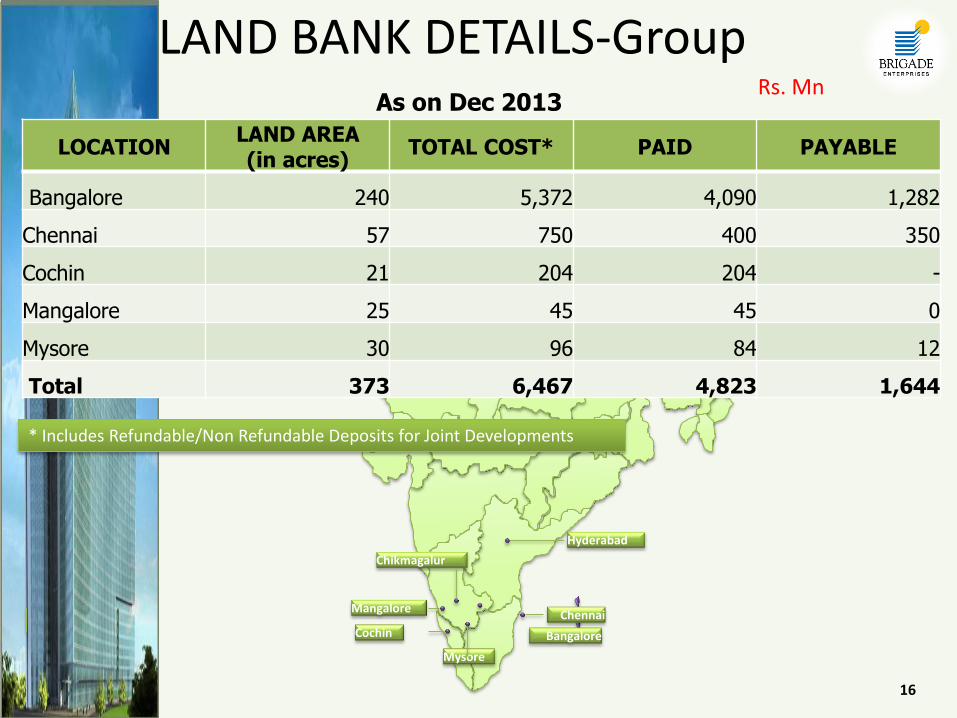
Bangalore
Hyderabad
Mangalore
Mysore
Chikmagalur
Cochin
Chennai
LAND BANK DETAILS-Group
LOCATION LAND AREA (in acres)
TOTAL COST* PAID PAYABLE
Bangalore 240 5,372 4,090 1,282
Chennai 57 750 400 350
Cochin 21 204 204 -
Mangalore 25 45 45 0
Mysore 30 96 84 12
Total 373 6,467 4,823 1,644
* Includes Refundable/Non Refundable Deposits for Joint Developments
16
Rs. Mn As on Dec 2013
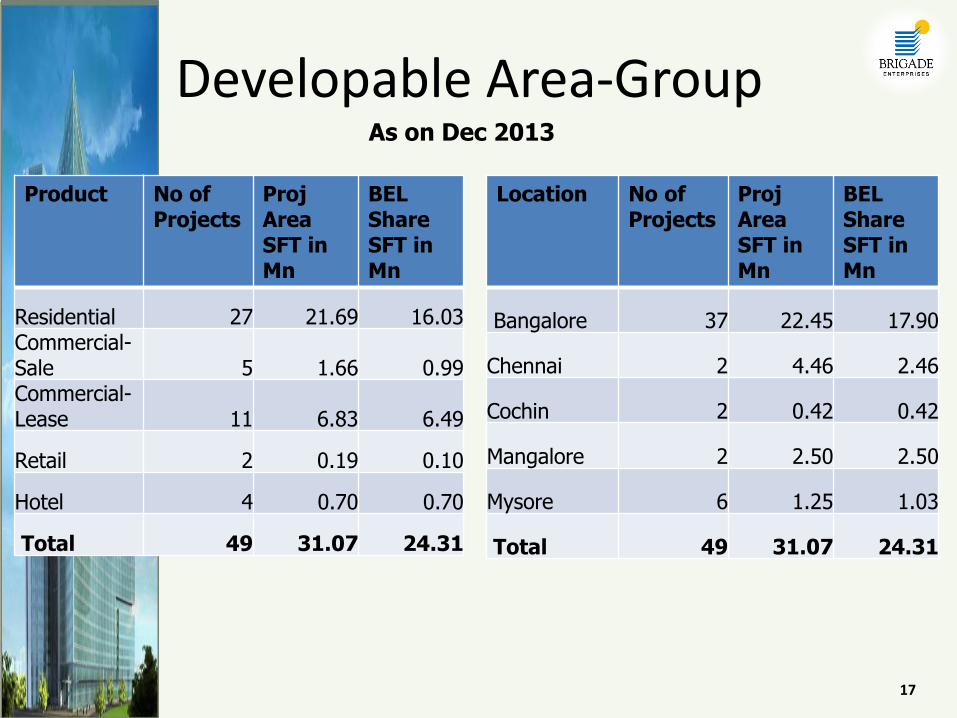
Developable Area-Group
Product No of Projects
Proj Area SFT in Mn
BEL Share SFT in Mn
Residential 27 21.69 16.03 Commercial-Sale 5 1.66 0.99 Commercial-Lease 11 6.83 6.49
Retail 2 0.19 0.10
Hotel 4 0.70 0.70
Total 49 31.07 24.31
17
Location No of Projects
Proj Area SFT in Mn
BEL Share SFT in Mn
Bangalore 37 22.45 17.90
Chennai 2 4.46 2.46
Cochin 2 0.42 0.42
Mangalore 2 2.50 2.50
Mysore 6 1.25 1.03
Total 49 31.07 24.31
As on Dec 2013
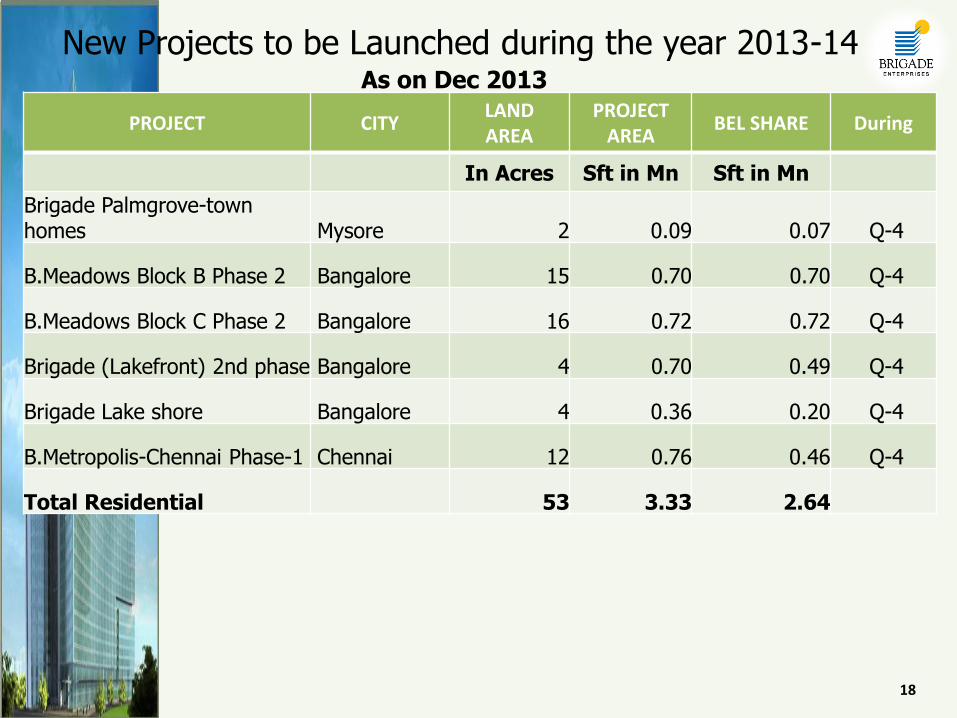
PROJECT CITY LAND AREA
PROJECT AREA
BEL SHARE During
In Acres Sft in Mn Sft in Mn
Brigade Palmgrove-town homes Mysore 2 0.09 0.07 Q-4
B.Meadows Block B Phase 2 Bangalore 15 0.70 0.70 Q-4
B.Meadows Block C Phase 2 Bangalore 16 0.72 0.72 Q-4
Brigade (Lakefront) 2nd phase Bangalore 4 0.70 0.49 Q-4
Brigade Lake shore Bangalore 4 0.36 0.20 Q-4
B.Metropolis-Chennai Phase-1 Chennai 12 0.76 0.46 Q-4
Total Residential 53 3.33 2.64
18
New Projects to be Launched during the year 2013-14 As on Dec 2013
THANK YOU Brigade Enterprises Ltd 29th & 30th Floor, World Trade Centre, Brigade Gateway Campus, 26/1, Dr. Rajkumar Road, Malleswaram-Rajajinagar, Bangalore -560 055. Phone: 91-80-4137 9200 Fax: 91-80-2221 0784 www.brigadegroup.com
K Suresh Chief Financial Officer Email: [email protected]
Pradyumna Krishnakumar EA to CMD & Analyst Email: [email protected]
Om Prakash P Company Secretary Email: [email protected]
Disclaimer: The information in this presentation contains certain forward-looking statements. These include statements regarding outlook on future development schedules, business plans and expectations ofCapital expenditures. These statements are based on current expectations that involve a Number of risks and uncertainties which could cause actual results to differ from those anticipated by the Company.
19