Embed Size (px)
Citation preview
Investor
Presentation
October/November 2019
Q3 2019 Financial Results
2
Safe harbor statement
This presentation contains “forward-looking” statements that are based on our management’s beliefs and assumptions and on information currently
available to management. Forward-looking statements include information concerning our possible or assumed future results of operations,
business strategies, financing plans, projections, competitive position, industry environment, potential growth opportunities, potential market
opportunities and the effects of competition and other actions by our counterparties.
Forward-looking statements include all statements that are not historical facts and can be identified by terms such as “anticipates,” “believes,”
“could,” “seeks,” “estimates,” “intends,” “may,” “plans,” “potential,” “predicts,” “projects,” “should,” “will,” “would” or similar expressions and the
negatives of those terms. Forward-looking statements involve known and unknown risks, uncertainties and other factors that may cause our actual
results, performance or achievements to be materially different from any future results, performance or achievements expressed or implied by the
forward-looking statements. Forward-looking statements represent our management’s beliefs and assumptions only as of the date of this
presentation, and nothing in this presentation should be regarded as a representation by any person that these beliefs or assumptions will take
place or occur. You should read the Company’s most recent Annual Report on Form 10-K filed on March 1, 2019, and in subsequent Quarterly
Reports on Form 10-Q, including the Risk Factors set forth therein and the exhibits thereto, as well as future filings and reports by the Company,
completely and with the understanding that our actual future results may be materially different from what we expect. Except as required by law,
we assume no obligation to update these forward-looking statements publicly, or to update the reasons actual results could differ materially from
those anticipated in the forward-looking statements, even if new information becomes available in the future.
This presentation includes certain non-GAAP financial measures as defined by SEC rules. As required by Regulation G, we have provided a
reconciliation of those measures to the most directly comparable GAAP measures, which is available in the Appendix slides.
1 2 3 4 5
3
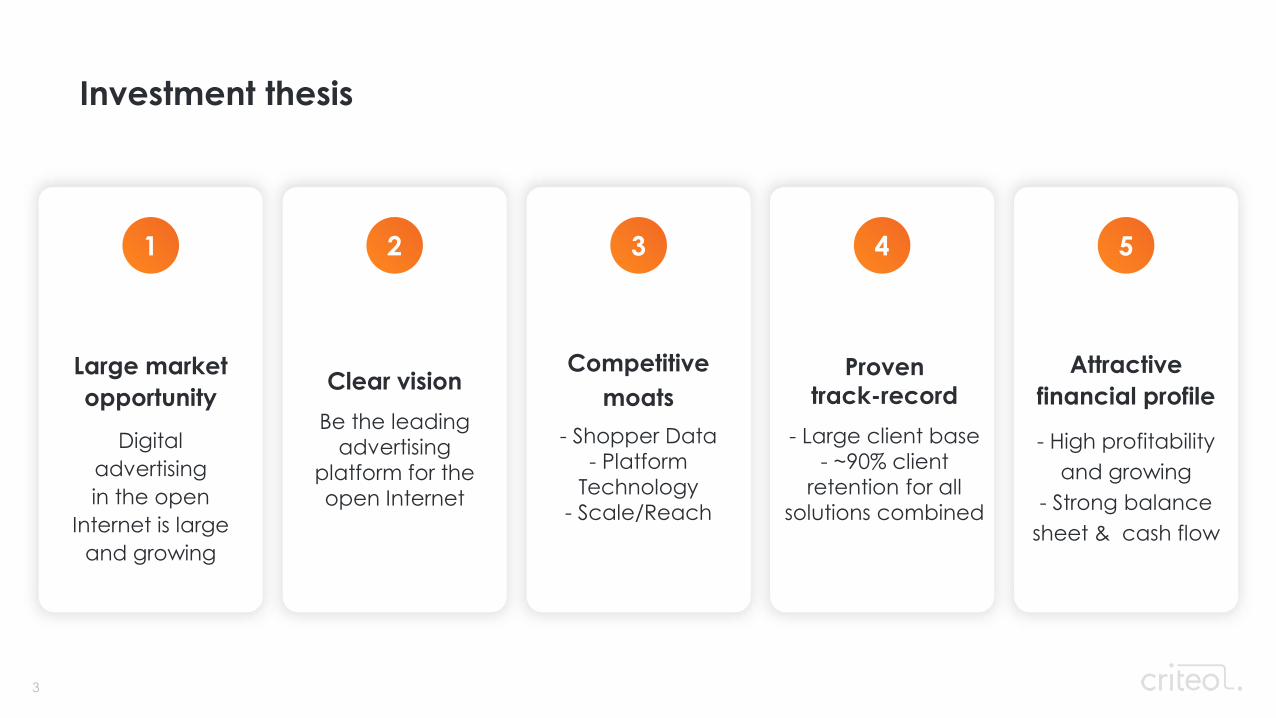
Large market
opportunity
Digital
advertising
in the open
Internet is large
and growing
Clear vision
Be the leading
advertising
platform for the
open Internet
Competitive
moats
- Shopper Data
- Platform
Technology
- Scale/Reach
Proven
track-record
- Large client base
- ~90% client
retention for all
solutions combined
Attractive
financial profile
- High profitability
and growing
- Strong balance
sheet & cash flow
Investment thesis
Vision: Be the leading
advertising platform for
the open internet
5
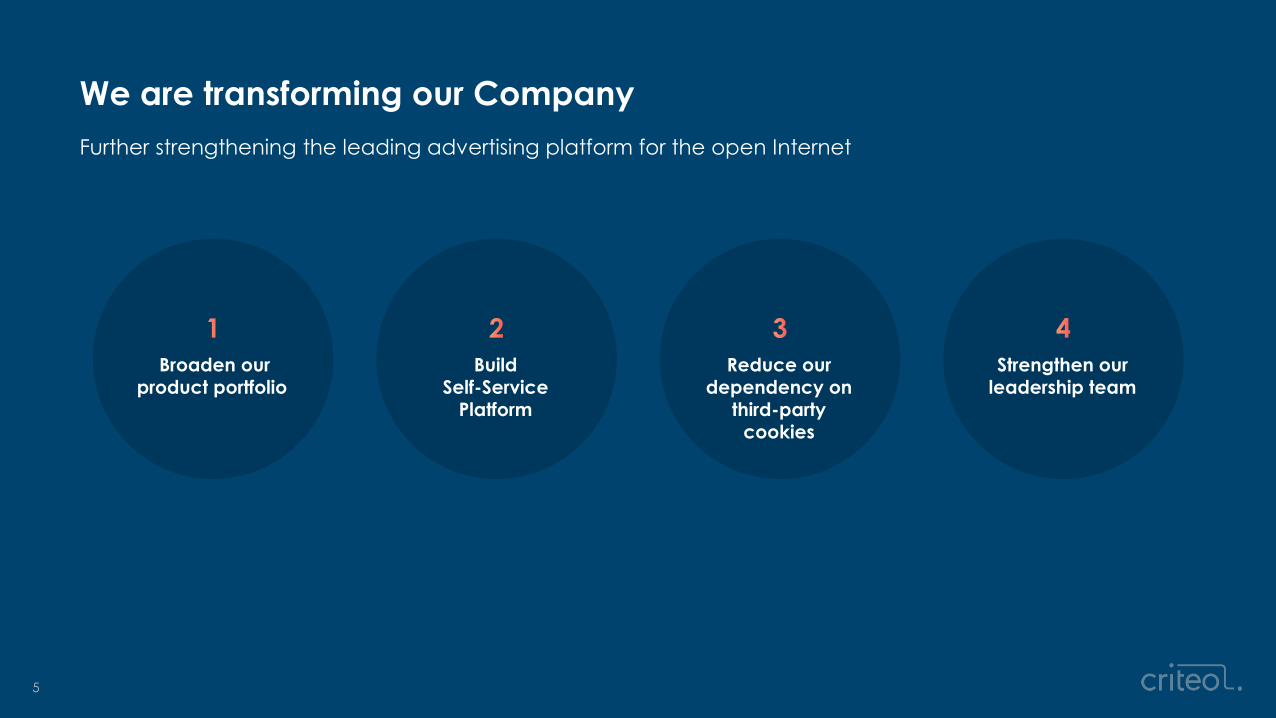
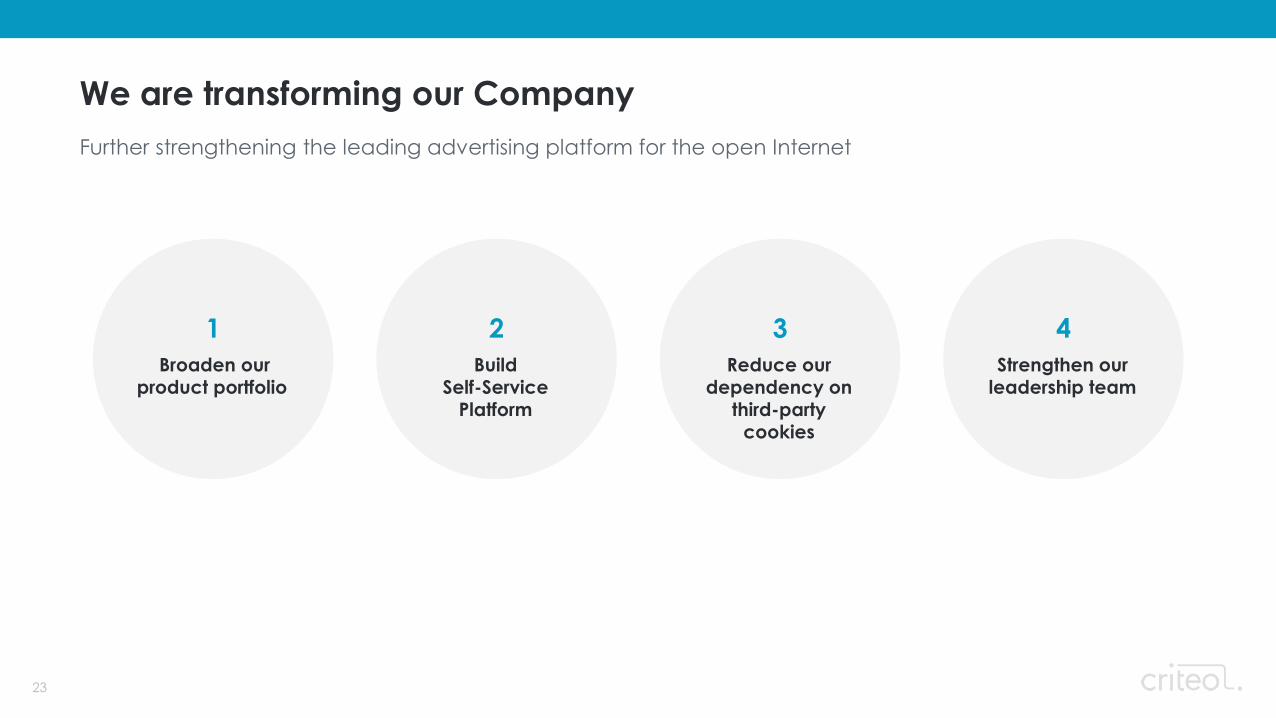
Broaden our product portfolio
BuildSelf-Service
Platform
Reduce our dependency on
third-party cookies
Strengthen our leadership team
We are transforming our Company
Further strengthening the leading advertising platform for the open Internet
6
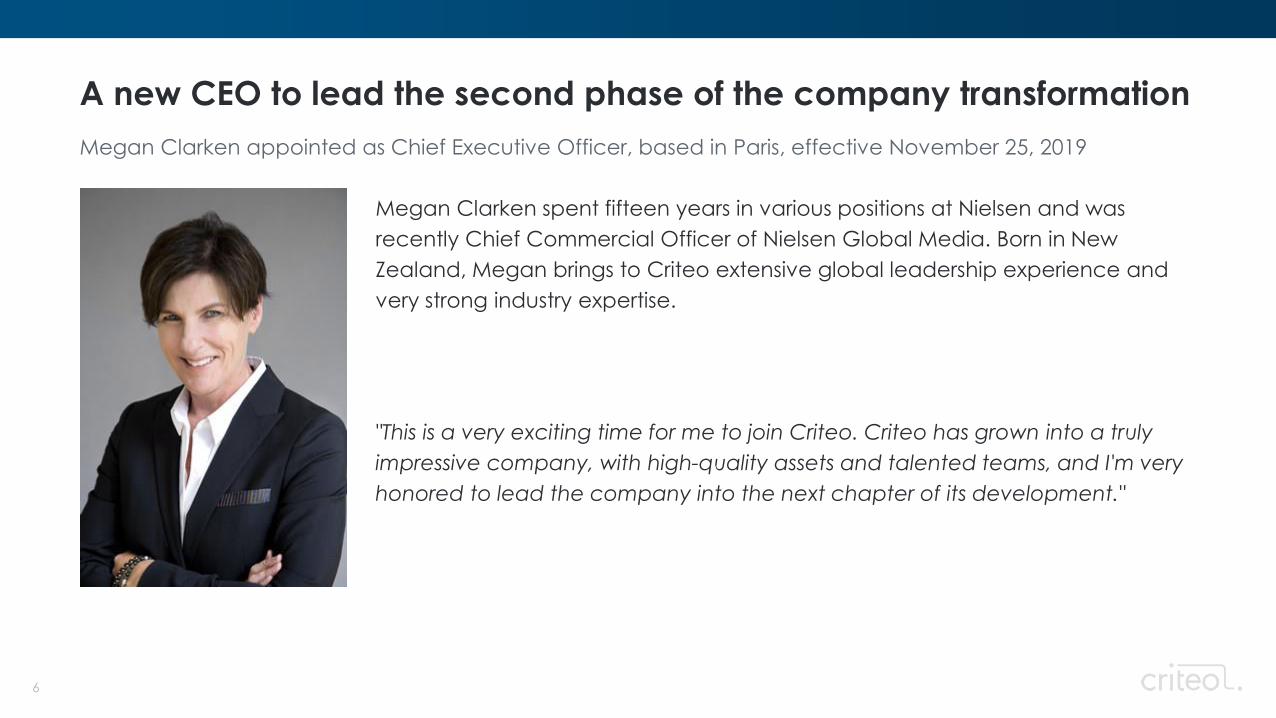
A new CEO to lead the second phase of the company transformation
Megan Clarken spent fifteen years in various positions at Nielsen and was
recently Chief Commercial Officer of Nielsen Global Media. Born in New
Zealand, Megan brings to Criteo extensive global leadership experience and
very strong industry expertise.
"This is a very exciting time for me to join Criteo. Criteo has grown into a truly
impressive company, with high-quality assets and talented teams, and I'm very
honored to lead the company into the next chapter of its development."
Megan Clarken appointed as Chief Executive Officer, based in Paris, effective November 25, 2019
7
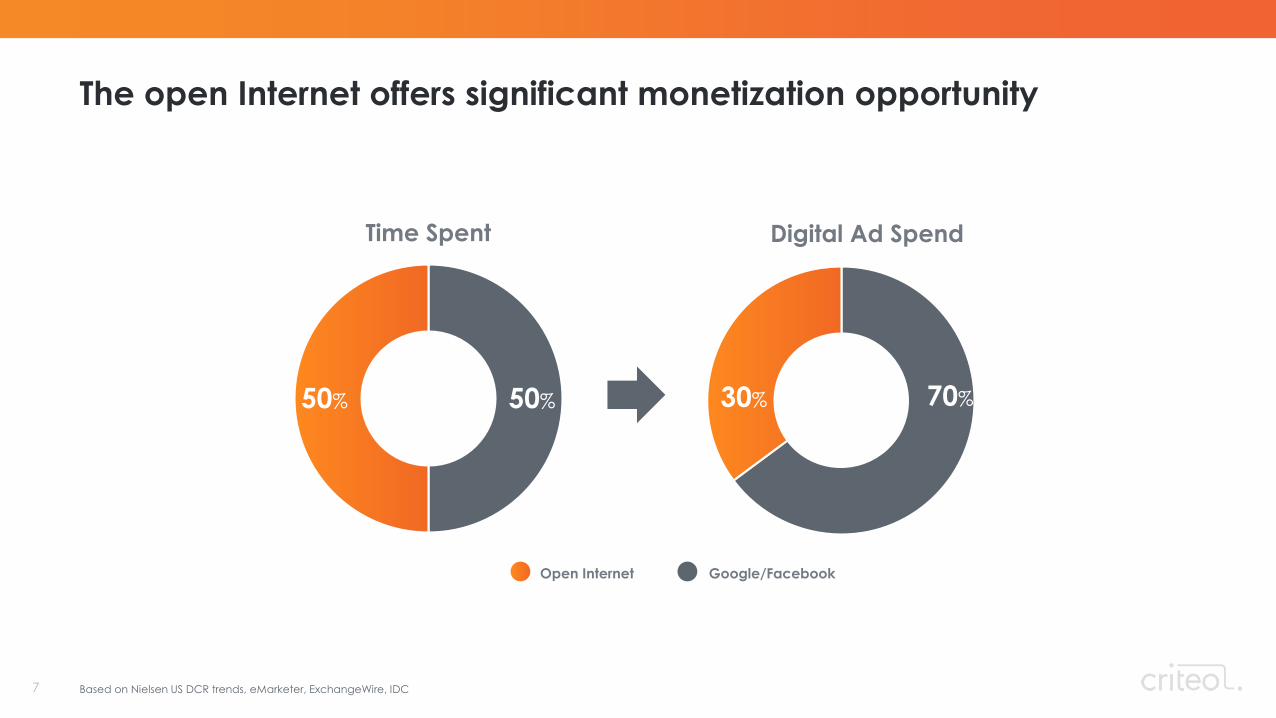
Digital Ad Spend
30% 70%
Time Spent
50% 50%
Open Internet Google/Facebook
The open Internet offers significant monetization opportunity
Based on Nielsen US DCR trends, eMarketer, ExchangeWire, IDC
8
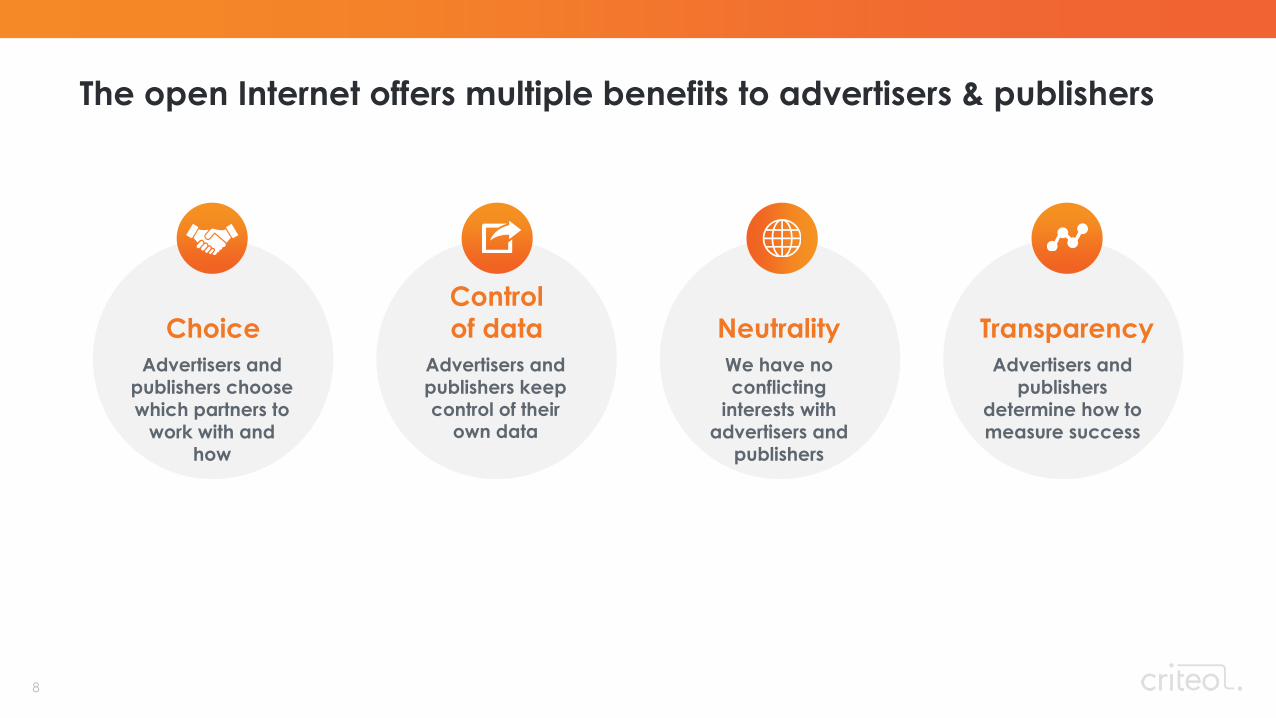
Advertisers and publishers choose which partners to
work with and how
Choice
Advertisers and publishers keep control of their
own data
Control
of data
We have no conflicting
interests with advertisers and
publishers
Neutrality
Advertisers and publishers
determine how to measure success
Transparency
The open Internet offers multiple benefits to advertisers & publishers

9
Our vision of the open Internet delivers benefits for all
Performance
Automation
Control
Demand
Relevance
Transparency
PublishersAdvertisers
Consumers
Experience
Consent
$800B+Annual
ecommerce
sales
20,000Advertisers
4,200+Publishers
connected to
Criteo Direct
Bidder
2BCriteo IDs
Incl.
1,000+Brands
Incl.
200+App
Developers
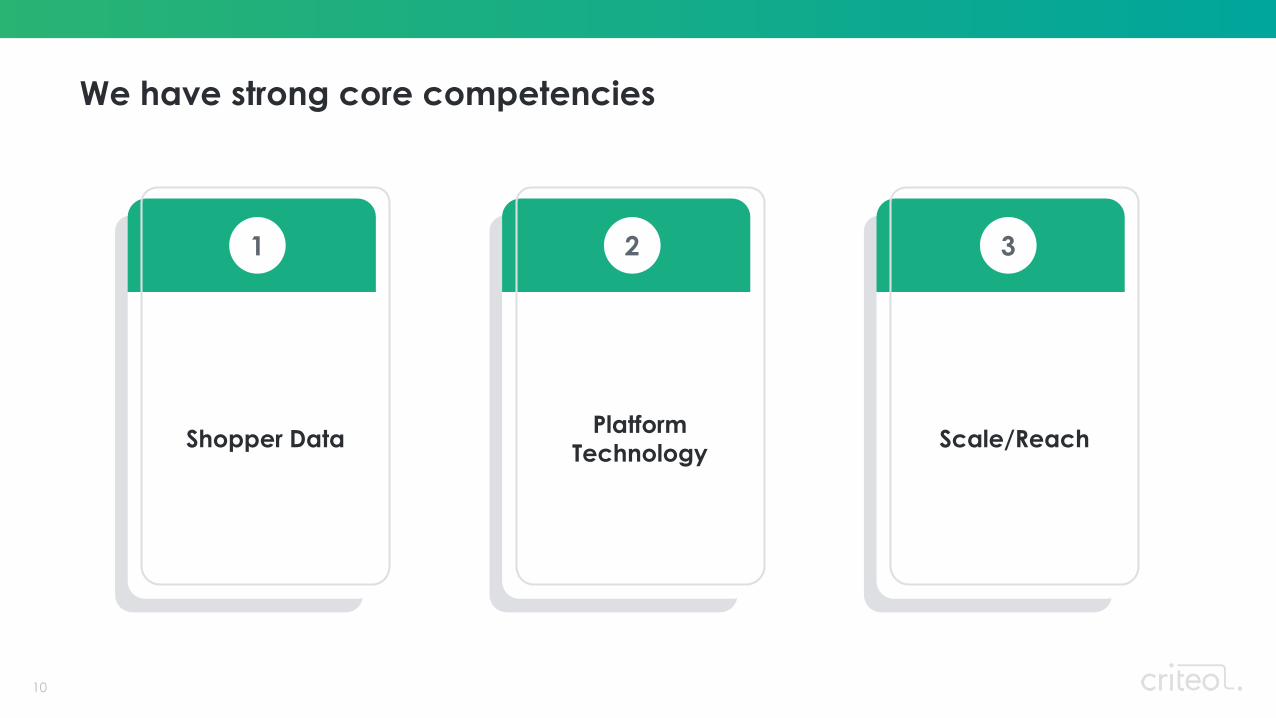
1 2 3
10
Shopper DataPlatform
TechnologyScale/Reach
We have strong core competencies

11
Criteo Shopper Graph: the world’s largest set of shopper data
A unified understanding of a shopper’s online journey and real-time shopping intent data
Identity Graph:
2B Criteo IDs cross device,
same device, and
online/offline
Interest Map:
anonymized
shopper interest
across products
Measurement Network:
conversion and sales
across retailers
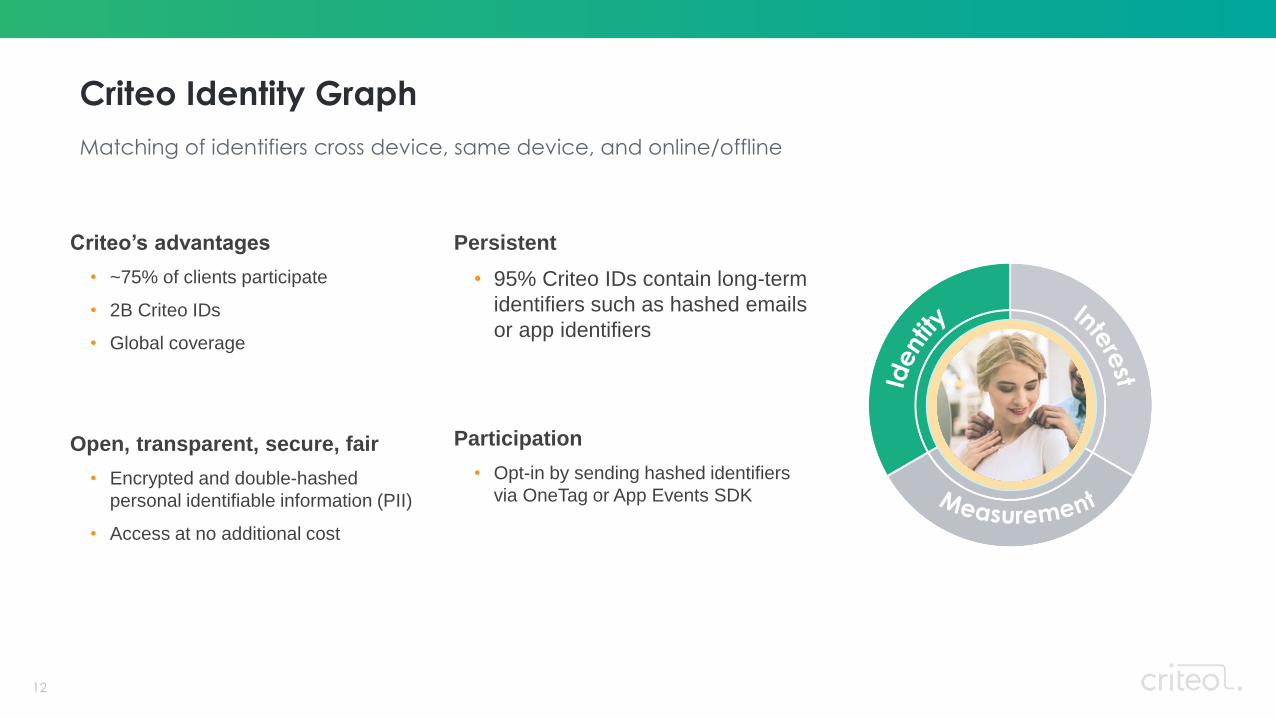
12
Criteo Identity Graph
Matching of identifiers cross device, same device, and online/offline
Criteo’s advantages
• ~75% of clients participate
• 2B Criteo IDs
• Global coverage
Open, transparent, secure, fair
• Encrypted and double-hashed
personal identifiable information (PII)
• Access at no additional cost
Persistent
• 95% Criteo IDs contain long-term
identifiers such as hashed emails
or app identifiers
Participation
• Opt-in by sending hashed identifiers
via OneTag or App Events SDK
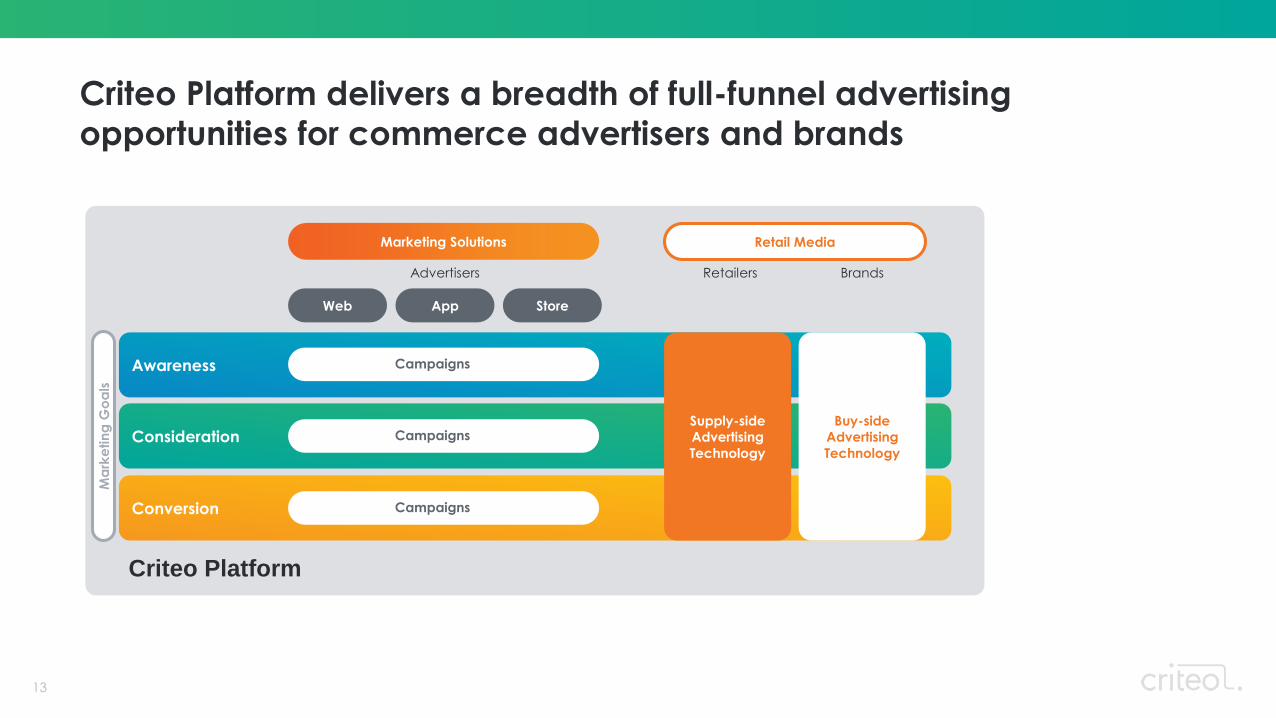
13
Criteo Platform delivers a breadth of full-funnel advertising
opportunities for commerce advertisers and brands
Awareness
Consideration
Conversion
Retail MediaMarketing Solutions
Supply-side
Advertising
Technology
RetailersAdvertisers
Criteo Platform
Web App Store
Brands
Buy-side
Advertising
Technology
Campaigns
Campaigns
Campaigns
Ma
rke
tin
g G
oa
ls

14
Fueled by a unique commerce data set and powered by AI
Shopper Graph
1 Dynamic Creative Optimization+
AI EngineLookalike FinderProduct
RecommendationsDCO+1 Predictive Bidding
120+Intent signals/shopper
2B
Criteo IDs
4.5B+Products
$800BeCommerce Sales

15
Marketing Solutions
Full-funnel capability addresses the entire customer journey
Awareness
Marketing Goals
Consideration Conversion
Ad Objectives
Optimization
Get people to consider yourproducts or services
Encourage interested people to purchase
Generate interest in yourproducts or services
Reach
Views
Traffic: Web, App
App Installs
Conversion: Web, App
Store Conversions
Visits
Installs
Purchase
(Conversions)
Brand Awareness
Video Views

16
Retail Media
Enables brands to connect with key retail audiences at all stages of their shopping journey
Supply-side Advertising Technology
Awareness Consideration Conversion
Buy-side Advertising Technology
Sargento Swiss
Cheese Slices$3.79
DEMAND
SUPPLY
Standard Commerce Display Sponsored Products
Flexible range of targeting and creative options

17
Full self-service campaign workflow for all clients
API and managed service option
Campaign Creation & Optimization Analytics & Insights

18
A global company with scale and broad reach
Advertisers
(incl. 1,000+ Brands)Criteo IDsAnnual
ecommerce sales
App Developers connected to Direct Bidder
Publishers connected to
Direct Bidder
$800B+ 20,000 2B
4,200+ 200+
Ads served in 2018
Employees (incl. 680+ in RD/Product)
2,800
1,300B+
Countries
95+

19
Direct relationships with many premium commerce and brand clients

20
We maintain high retention across our large client base
11.011.9
12.9
14.515.4
16.417.3
18.1 18.5 19.0 19.2 19.4 19.4 19.7 20.0
0%
10%
20%
30%
40%
50%
60%
70%
80%
90%
100%
Q1 2016 Q2 2016 Q3 2016 Q4 2016 Q1 2017 Q2 2017 Q3 2017 Q4 2017 Q1 2018 Q2 2018 Q3 2018 Q4 2018 Q1 2019 Q2 2019 Q3 2019
Client Retention Rate1 Number of clients (in thousands)
1 The retention rate represents the percentage of live clients during the previous quarter that continued to be live clients during the current quarter. For all solutions combined.

21
Extensive supply partnerships ensure broad audience access
Exchange partners
Long-tail & emerging formats
Closed environments
Additional Reach
• Flexible buying technology: RTB/S2S, Criteo direct bidder, SDK, API
• Any relevant creative formats/environment: IAB, Native, In-App, Video, Google AMP
Direct partnerships
4,200+ Premium publishers
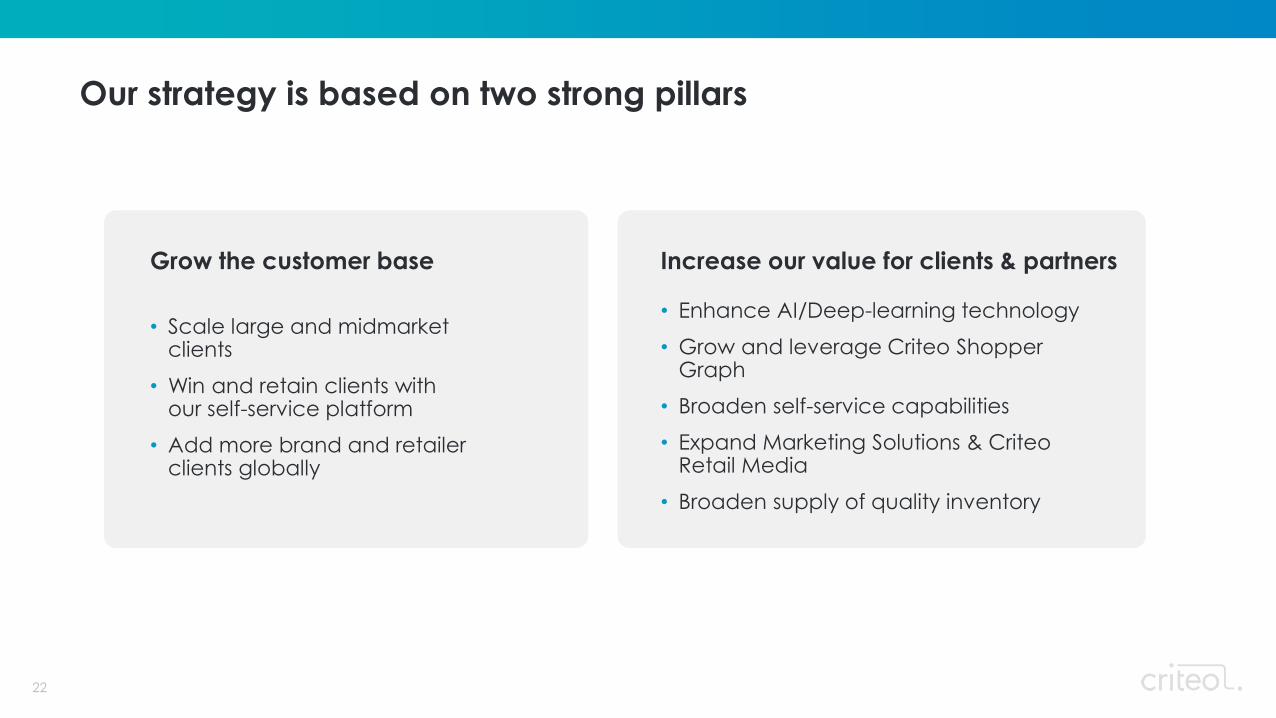
22
Our strategy is based on two strong pillars
• Scale large and midmarket clients
• Win and retain clients with our self-service platform
• Add more brand and retailer clients globally
Grow the customer base Increase our value for clients & partners
• Enhance AI/Deep-learning technology
• Grow and leverage Criteo Shopper Graph
• Broaden self-service capabilities
• Expand Marketing Solutions & Criteo Retail Media
• Broaden supply of quality inventory
23
Broaden our product portfolio
1
BuildSelf-Service
Platform
2
Reduce our dependency on
third-party cookies
3
Strengthen our leadership team
4
We are transforming our Company
Further strengthening the leading advertising platform for the open Internet

24
One-size-fits-all
go-to-market
approach
Product and Sales
working in silos
Dedicated
go-to-market
per product line
Customer-centric
integrated product
roadmap
Seperate Orgs for
Large Customers &
Mid-Market
Fragmented
operations
Unified
regional
leadership
Integrated
business
platform
Multi-layer
organization
Lean and agile
organization
We are evolving to accelerate our transformation
25
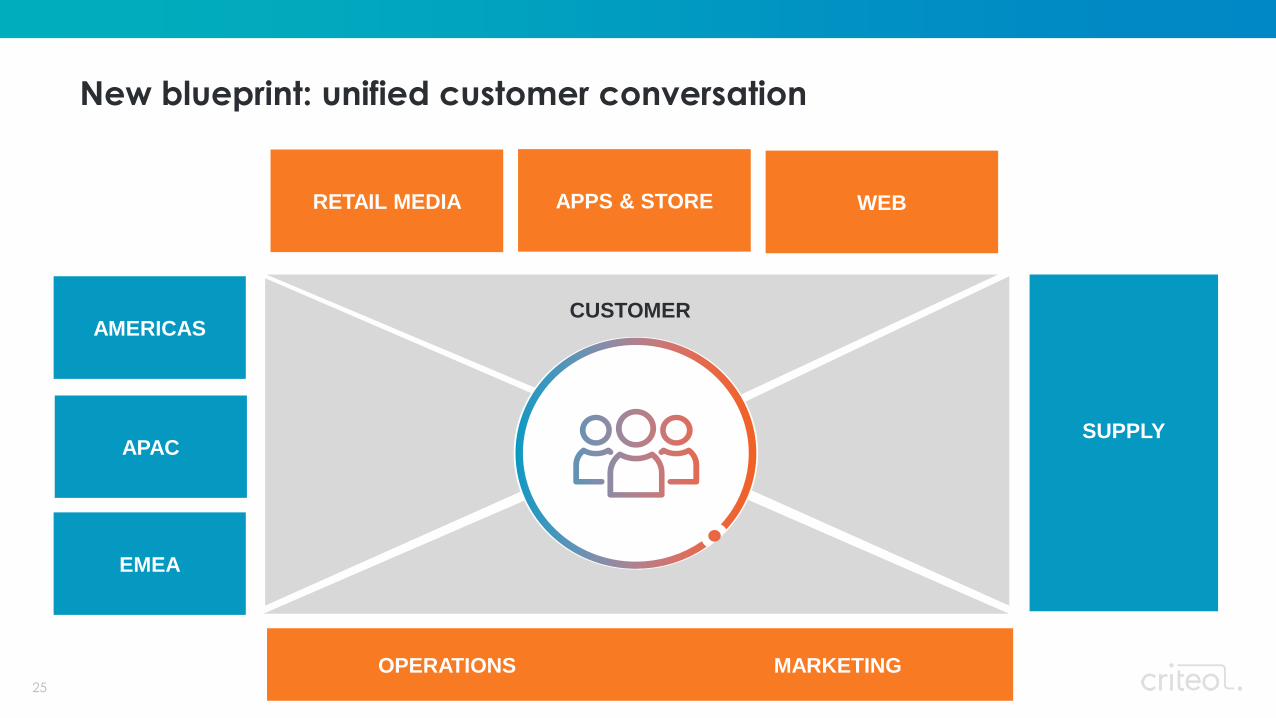
New blueprint: unified customer conversation
AMERICAS
APAC
EMEA
SUPPLY
RETAIL MEDIA APPS & STORE WEB
OPERATIONS MARKETING
CUSTOMER

26
Criteo leadership team
JessBreslavAmericas
KennethPao
APAC
ShruthiChindalur
EMEA
Thomas JeanjeanPlatform & Operations
Cédric Vandervynkt
Web
GeoffroyMartin
Supply & Retail Media
AlexValle
App & Store
BenoitFouilland
CFO
DiarmuidGillCTO
Isabelle Leung-Tack
Global Communications
RyanDamon
General Counsel
DenisCollinPeople
Management
MeganClarken
CEO
JBRudelle
Chairman
& Co-founder

27
A tailored go-to-market approach to best serve our clients
A
$200K+
B
$50K+
D
$10K+
E
$5K+
F
<$5K
C
$20K+
Large Clients Upper Mid-Market Lower Mid-Market
Monthly
ad spend
Highly customized service and proactive insights/proposals
Efficient, high quality, scalable and automated serviceto the highest number of clients
Client tiering
Objectives • Adapt sales organization to a multi-solution offering
• Provide the right level of service to each client
• Scale operations and enhance profitability
Consultative sales Telesales Self-service platform
1
2
3

28
We invest in growing areas in digital advertising – and beyond
• Leverage strong growth of apps
• Store advertising
• App
• Store-to-web retargeting*
Shopping environments
• Self-service campaign
optimization modules• Build flexible and modular client platformAdvertiser control
• Consideration, Awareness* • Complete expansion of solution suiteMarketing goals
* Prospective

29
Our financial structure offers significant flexibility
* Based on a $1.5bn market capitalization, pursuant to the 2019 AGM authorization to issue up to 6.6m shares** For M&A and to satisfy employee equity plan vesting
Strong balance
sheet
1,5971,701
Dec 2018 Sep 2019
Total assets (in $M) Financial liabilities (in $M)
Very low
debt
4 4
Dec 2018 Sep 2019
Cash & cash equivalents (in $M)
Significant
cash pile
364409
Dec 2018 Sep 2019
~25% of assets
$409Mcash
As of Sep 30, 2019
€350Mcommitted financing
$150M equity raise capacity*
Share buy-back authorization**
30
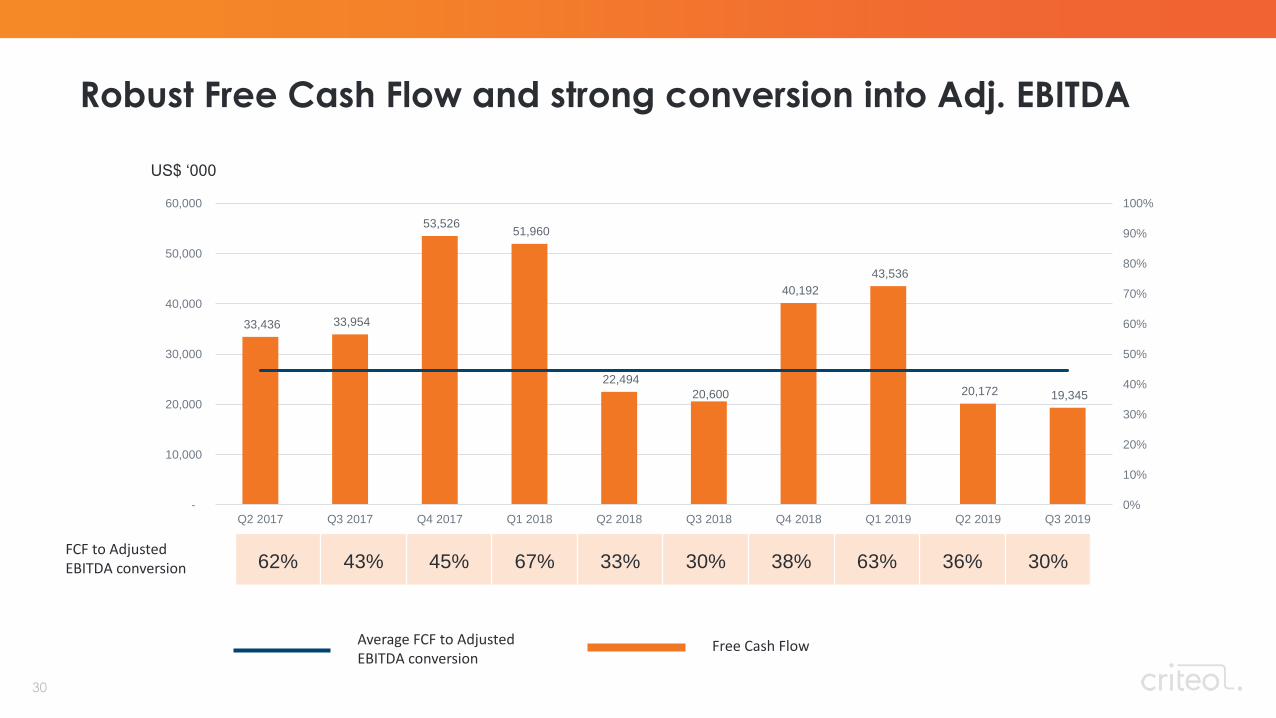
Robust Free Cash Flow and strong conversion into Adj. EBITDA
33,436 33,954
53,526 51,960
22,494
20,600
40,192
43,536
20,172 19,345
0%
10%
20%
30%
40%
50%
60%
70%
80%
90%
100%
-
10,000
20,000
30,000
40,000
50,000
60,000
Q2 2017 Q3 2017 Q4 2017 Q1 2018 Q2 2018 Q3 2018 Q4 2018 Q1 2019 Q2 2019 Q3 2019
62% 43% 45% 67% 33% 30% 38% 63% 36% 30%
Average FCF to Adjusted EBITDA conversion
FCF to Adjusted EBITDA conversion
Free Cash Flow
US$ ‘000
31
•
•
•
•
•
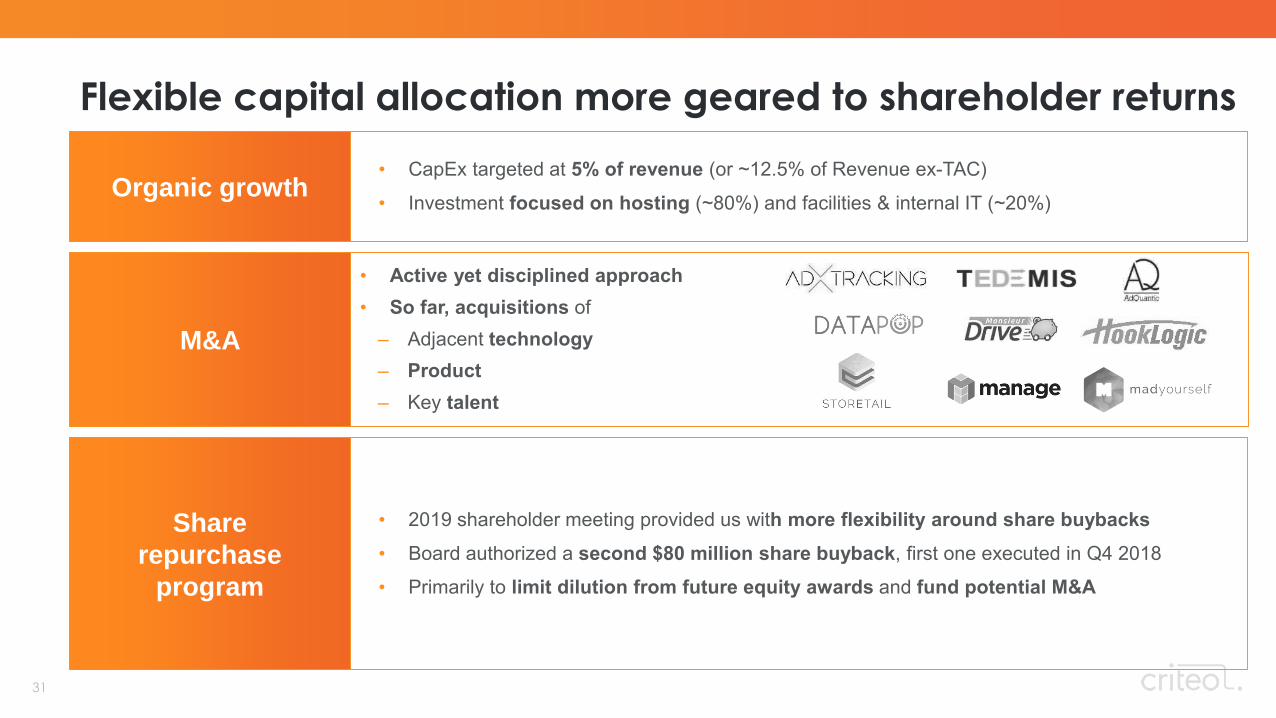
Flexible capital allocation more geared to shareholder returns
•
•
–
–
–
Organic growth
M&A
Share
repurchase
program
1 2 3
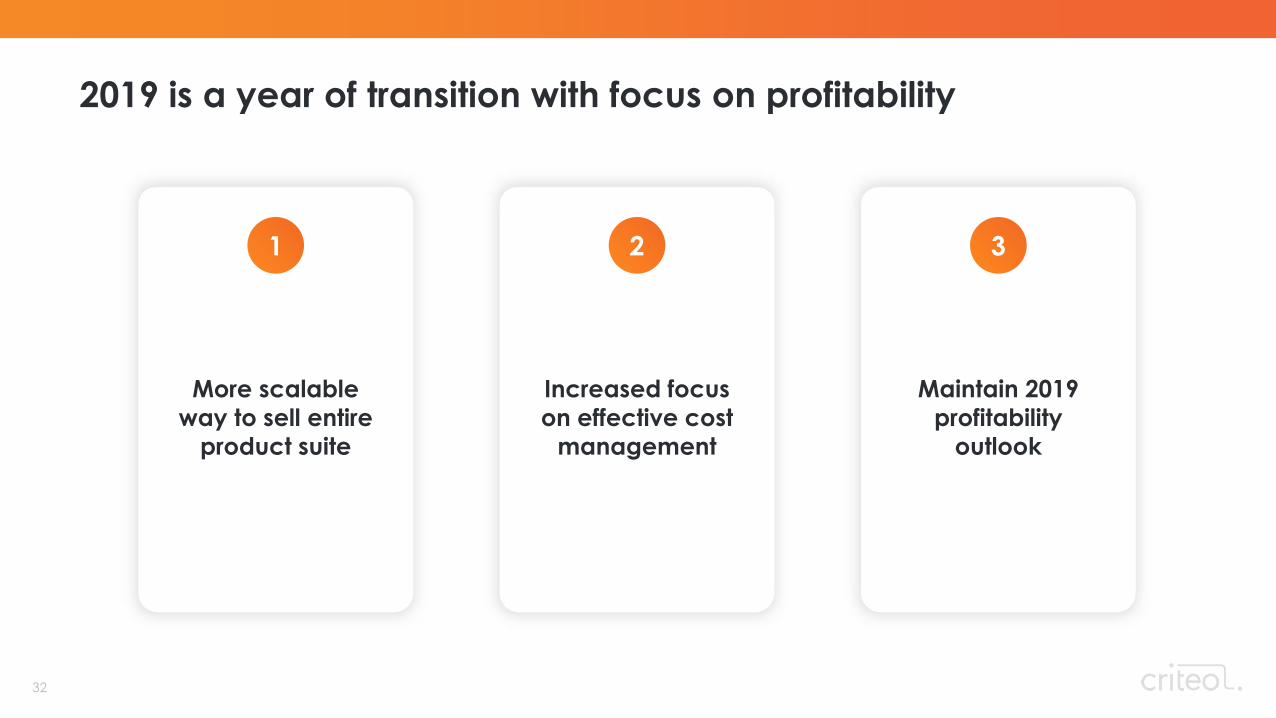
32
More scalable
way to sell entire
product suite
Increased focus
on effective cost
management
Maintain 2019
profitability
outlook
2019 is a year of transition with focus on profitability
33
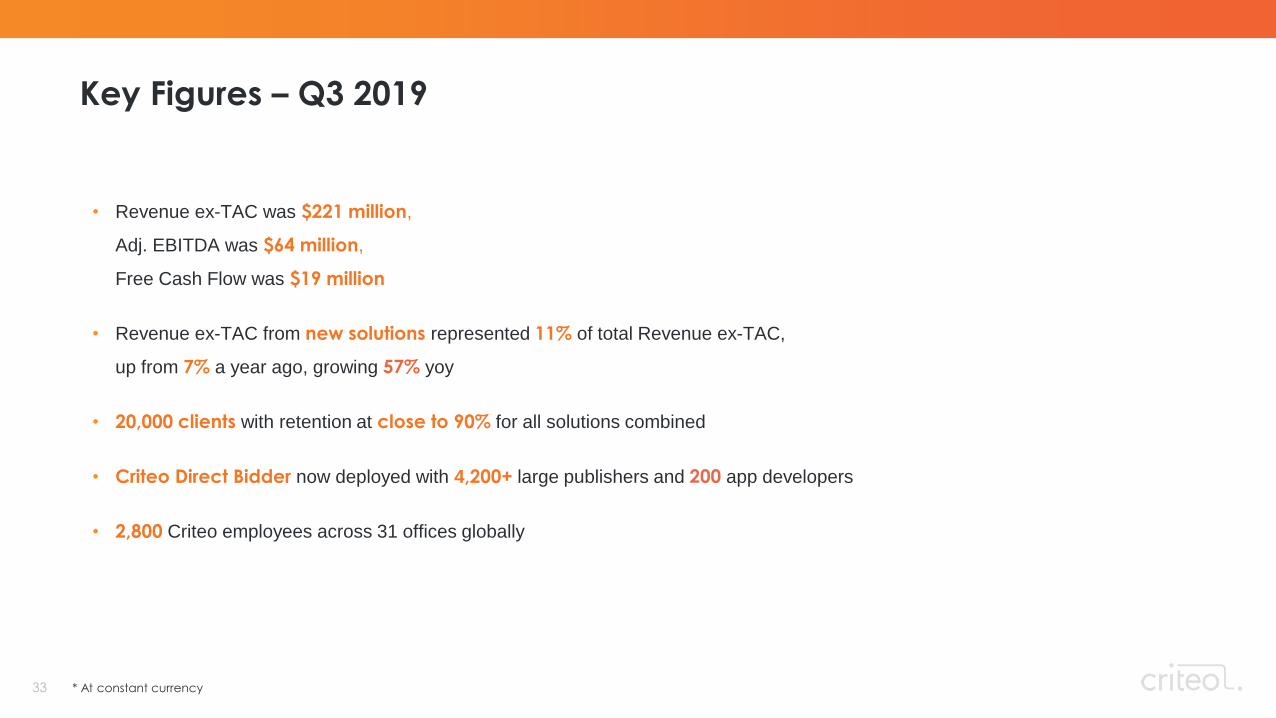
Key Figures – Q3 2019
• Revenue ex-TAC was $221 million,
Adj. EBITDA was $64 million,
Free Cash Flow was $19 million
• Revenue ex-TAC from new solutions represented 11% of total Revenue ex-TAC,
up from 7% a year ago, growing yoy
• 20,000 clients with retention at close to 90% for all solutions combined
• Criteo Direct Bidder now deployed with 4,200+ large publishers and app developers
• 2,800 Criteo employees across 31 offices globally
* At constant currency

34
Regional performance – Q3 2019
+0% Americas
(+3% U.S.)
+1% EMEA
-2% APAC
* At constant currency
Americas 38%
EMEA 37%
APAC25%
Q3 2019 Revenue ex-TACMix by Region
Q3 2019 Revenue ex-TACGrowth* by Region
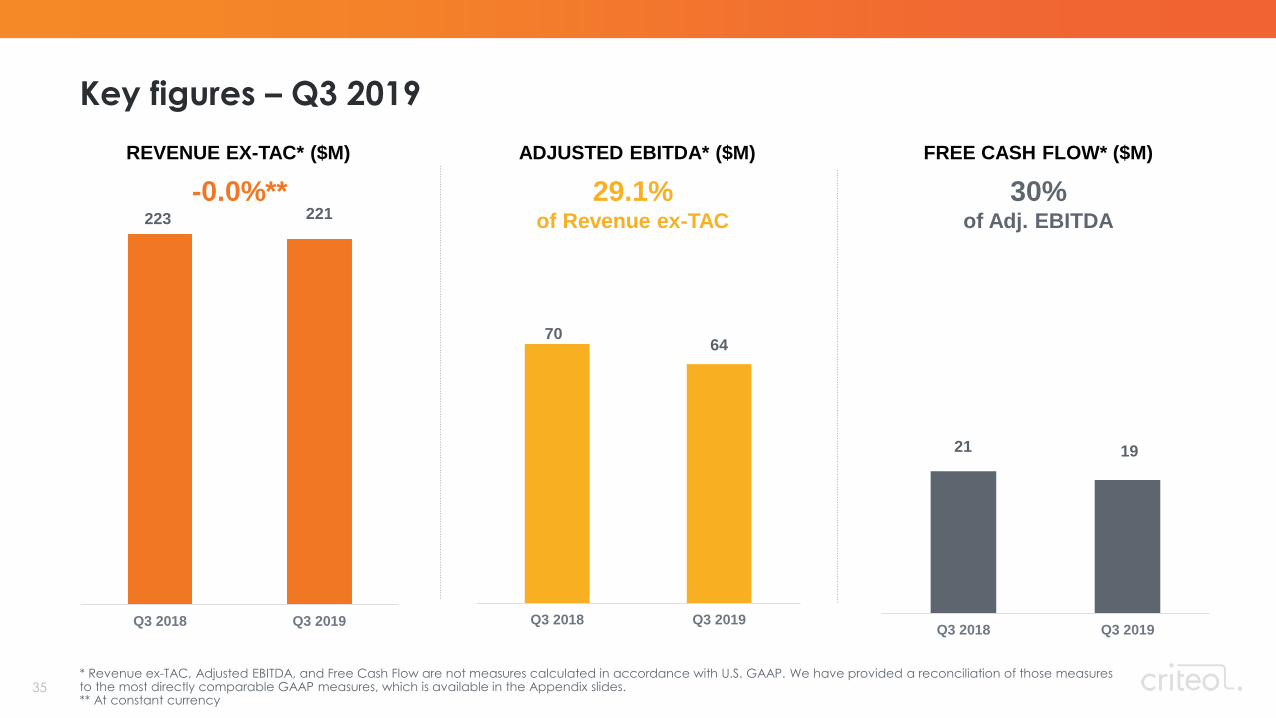
35
223 221
Q3 2018 Q3 2019
-0.0%**
Key figures – Q3 2019
* Revenue ex-TAC, Adjusted EBITDA, and Free Cash Flow are not measures calculated in accordance with U.S. GAAP. We have provided a reconciliation of those measures to the most directly comparable GAAP measures, which is available in the Appendix slides. ** At constant currency
REVENUE EX-TAC* ($M) ADJUSTED EBITDA* ($M) FREE CASH FLOW* ($M)
29.1% of Revenue ex-TAC
30% of Adj. EBITDA
7064
Q3 2018 Q3 2019
21 19
Q3 2018 Q3 2019
36
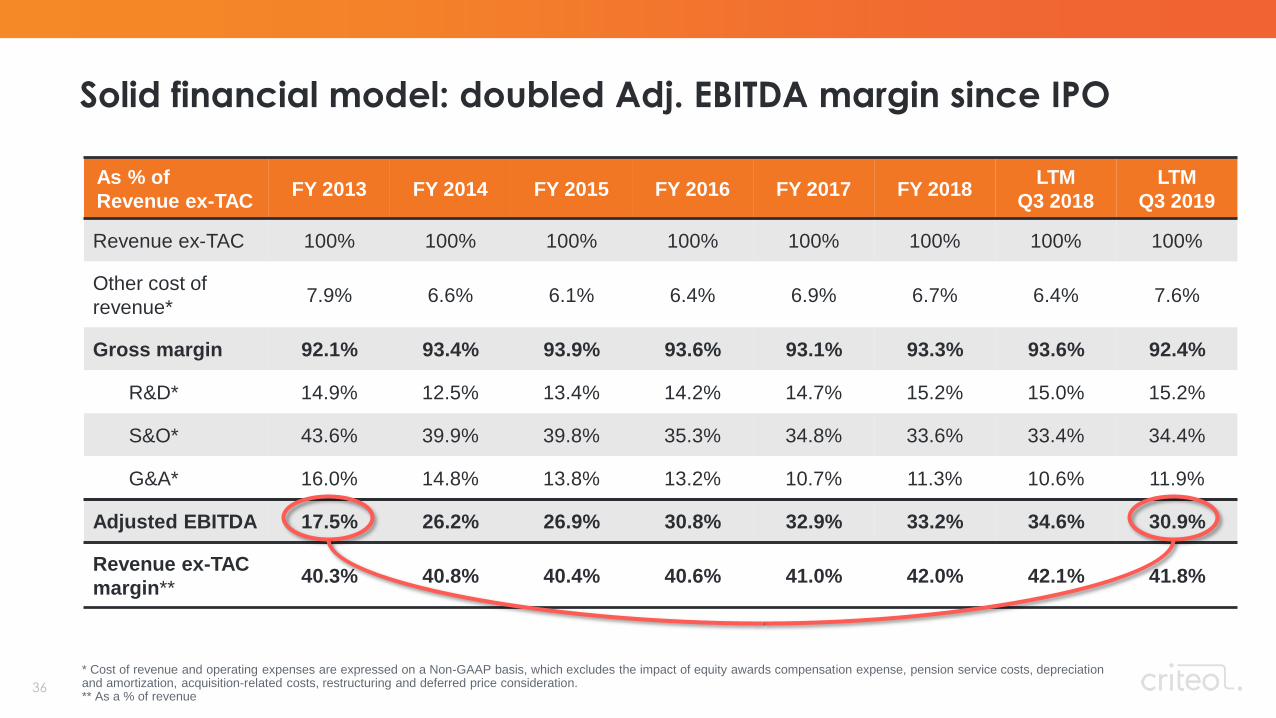
Solid financial model: doubled Adj. EBITDA margin since IPO
As % of
Revenue ex-TACFY 2013 FY 2014 FY 2015 FY 2016 FY 2017 FY 2018
LTM
Q3 2018
LTM
Q3 2019
Revenue ex-TAC 100% 100% 100% 100% 100% 100% 100% 100%
Other cost of
revenue*7.9% 6.6% 6.1% 6.4% 6.9% 6.7% 6.4% 7.6%
Gross margin 92.1% 93.4% 93.9% 93.6% 93.1% 93.3% 93.6% 92.4%
R&D* 14.9% 12.5% 13.4% 14.2% 14.7% 15.2% 15.0% 15.2%
S&O* 43.6% 39.9% 39.8% 35.3% 34.8% 33.6% 33.4% 34.4%
G&A* 16.0% 14.8% 13.8% 13.2% 10.7% 11.3% 10.6% 11.9%
Adjusted EBITDA 17.5% 26.2% 26.9% 30.8% 32.9% 33.2% 34.6% 30.9%
Revenue ex-TAC
margin**40.3% 40.8% 40.4% 40.6% 41.0% 42.0% 42.1% 41.8%
* Cost of revenue and operating expenses are expressed on a Non-GAAP basis, which excludes the impact of equity awards compensation expense, pension service costs, depreciation and amortization, acquisition-related costs, restructuring and deferred price consideration. ** As a % of revenue

1 2 3 4 5
37
Large market
opportunity
Digital
advertising
in the open
Internet is large
and growing
Clear vision
Be the leading
advertising
platform for the
open Internet
Competitive
moats
- Shopper Data
- Platform
Technology
- Scale/Reach
Proven
track-record
- Large client base
- ~90% client
retention for all
solutions combined
Attractive
financial profile
- High profitability
and growing
- Strong balance
sheet & cash flow
Investment thesis

38
VP, Head of Investor Relations
32, rue Blanche
75009 Paris
+33 1 7621 2166
Director, Investor Relations
387 Park Ave South, 12th Floor
New York, NY 10016
+1 917 837 8617
Friederike EdelmannEdouard Lassalle
Investor Relations contacts

39
Appendix

40
Foreign Exchange impact on actual results and guidance
USD million @ Q3 2018 FXFX
impactActual @ Q3 guidance FX
FX
impactActual
Revenue ex-TAC 223.4$ (2.6)$ 220.7$ 223.2$ (2.5)$ 220.7$
USD million @ Q4 2018 FXFX
impact
Guidance
Midpoint*
Revenue ex-TAC 261.2$ (3.2)$ 258.0$
USD million @ FY 2018 FXFX
impact
Guidance
Midpoint*
Revenue ex-TAC 966.0$ (24.0)$ 942.0$
* Based on FX assumptions for Q4 2019 and Fiscal Year 2019 published in the Oct 30, 2019 earnings release
Q3 2019 Actual
Q4 2019 Guidance
Fiscal Year 2019 Guidance

41
($ in thousands) Q2’17 Q3'17 Q4’17 Q1’18 Q2’18 Q3’18 Q4’18 Q1’19 Q2’19
Revenue 542,022 563,973 674,031 564,164 537,185 528,869 670,096 558,123 528,147
Less: Traffic
acquisition costs322,200 329,576 397,087 323,746 306,963 305,387 398,238 322,429 304,229
Revenue ex-TAC 219,822 234,397 276,944 240,418 230,222 223,482 271,858 235,694 223,918
Revenue ex-TAC reconciliation
($ in thousands) 2017 2018
Revenue 2,296,692 2,300,314
Less: Traffic acquisition costs 1,355,556 1,334,334
Revenue ex-TAC 941,136 965,980
Q3’19
522,606
301,901
220,705

42
Adjusted EBITDA reconciliation
($ in thousands) Q2’17 Q3'17 Q4'17 Q1’18 Q2’18 Q3’18 Q4’18 Q1’19 Q2’19 Q3’19 2017 2018
Net income 7,505 22,269 52,368 21,090 14,707 17,948 42,134 21,401 12,537 20,557 96,659 95,879
Adjustments:
Financial (income)
expense, net2,094 2,886 2,221 1,325 1,006 1,007 1,746 1,974 1,354 900 9,534 5,084
Provision for income taxes 3,665 7,858 15,927 12,386 8,638 6,821 18,299 10,018 5,683 7,913 31,651 46,144
Equity awards
compensation expense14,918 22,028 20,464 19,303 20,245 17,261 10,267 13,882 14,391 11,700 72,351 67,076
Pension service costs 299 320 321 434 419 419 419 394 391 388 1,231 1,691
Depreciation and
amortization expense22,306 23,755 24,570 23,646 23,560 25,619 30,675 19,296 21,315 22,388 90,796 103,500
Acquisition-related costs - - - - - 516 1,222 - - - 6 1,738
Restructuring 3,299 - 4,057 (252) 199 - - 1,890 728 303 7,356 (53)
Total net adjustments 46,581 56,847 67,560 56,842 54,067 51,643 62,628 47,454 43,862 43,662 212,925 225,180
Adjusted EBITDA 54,086 79,116 119,928 77,932 68,774 69,591 104,762 68,855 56,399 64,219 309,584 321,059

43
Free cash flow reconciliation
($ in thousands) Q3 2018 Q3 2019
CASH FROM OPERATING ACTIVITIES 50,256 43,289
Acquisition of intangible assets, property, plant and equipment (60,627) (27,239)
Change in accounts payable related to intangible assets, property, plant and equipment 30,971 3,295
FREE CASH FLOW 20,600 19,345