Embed Size (px)
Citation preview

1 I INVESTOR PRESENTATION 5/6/2015
INVESTOR PRESENTATION 1Q’15

2 I INVESTOR PRESENTATION 5/6/2015
FORWARD-LOOKING STATEMENTS
• This presentation includes "forward-looking statements” within the meaning of Section 27A of the Securities Act of 1933 and Section 21E of the Securities Exchange Act of 1934. Forward-looking statements are statements other than statements of historical fact that give our current expectations or forecasts of future events. They include production forecasts, estimates of operating costs, assumptions regarding future natural gas and liquids prices, planned drilling activity, anticipated asset sales and related adjustments, reductions in leverage, estimates of future capital expenditures, estimates of recoverable resources, projected rates of return and expected efficiency gains, as well as projected cash flow, inventory levels and capital efficiency, business strategy and other plans and objectives for future operations. Although we believe the expectations and forecasts reflected in the forward-looking statements are reasonable, we can give no assurance they will prove to have been correct. They can be affected by inaccurate or changed assumptions or by known or unknown risks and uncertainties.
• Factors that could cause actual results to differ materially from expected results include those described under "Risk Factors” in Item 1A of our annual report on Form 10-K and any updates to those factors set forth in Chesapeake's subsequent Quarterly Reports on Form 10-Q or Current Reports on Form 8-K (available at http://www.chk.com/investors/sec-filings). These risk factors include: the volatility of oil, natural gas and NGL prices; write-downs of our oil and natural gas carrying values due to declines in prices; the availability of operating cash flow and other funds to finance reserve replacement costs; our ability to replace reserves and sustain production; uncertainties inherent in estimating quantities of oil, natural gas and NGL reserves and projecting future rates of production and the amount and timing of development expenditures; our ability to generate profits or achieve targeted results in drilling and well operations; leasehold terms expiring before production can be established; commodity derivative activities resulting in lower prices realized on oil, natural gas and NGL sales; the need to secure derivative liabilities and the inability of counterparties to satisfy their obligations; adverse developments or losses from pending or future litigation and regulatory proceedings, including royalty claims; the limitations our level of indebtedness may have on our financial flexibility; charges incurred in response to market conditions and in connection with actions to reduce financial leverage and complexity; drilling and operating risks and resulting liabilities; effects of environmental protection laws and regulation on our business; legislative and regulatory initiatives further regulating hydraulic fracturing; our need to secure adequate supplies of water for our drilling operations and to dispose of or recycle the water used; federal and state tax proposals affecting our industry; potential OTC derivatives regulation limiting our ability to hedge against commodity price fluctuations; impacts of potential legislative and regulatory actions addressing climate change; competition in the oil and gas exploration and production industry; a deterioration in general economic, business or industry conditions; negative public perceptions of our industry; limited control over properties we do not operate; pipeline and gathering system capacity constraints and transportation interruptions; cyber attacks adversely impacting our operations; and interruption in operations at our headquarters due to a catastrophic event.
• Disclosures concerning the estimated contribution of derivative contracts to our future results of operations are based upon market information as of a specific date. These estimates and underlying market prices are subject to significant volatility. Our production forecasts are dependent upon many assumptions, including estimates of production decline rates from existing wells and the outcome of future drilling activity. Expected asset sales may not be completed in the time frame anticipated or at all. References to “EUR” (estimated ultimate recovery) and “resources” include estimates of quantities of natural gas, oil and NGL we believe will ultimately be produced, but that are not yet classified as “proved reserves,” as defined in SEC regulations. Estimates of unproved resources are by their nature more speculative than estimates of proved reserves and accordingly are subject to substantially greater risk of actually being realized by Chesapeake. We believe our estimates of unproved resources are reasonable, but our estimates have not been reviewed by independent engineers. Estimates of unproved resources may change significantly as development provides additional data, and actual quantities that are ultimately recovered may differ substantially from prior estimates.
• We caution you not to place undue reliance on our forward-looking statements, which speak only as of the date of this presentation, and we undertake no obligation to update any of the information provided in this presentation, except as required by applicable law.

3 I INVESTOR PRESENTATION 5/6/2015
STRONG STRATEGIC POSITION
High-quality assets
Talented people
Superior capital efficiency
Industry-leading cash costs
Strong liquidity
CHK

4 I INVESTOR PRESENTATION 5/6/2015
1Q’15 FINANCIAL & OPERATIONAL RESULTS
PROD. and G&A EXP. ADJ. EARNINGS/FDS ADJ. EBITDA
5% YOY
$5.75/boe(1)
$ 928 mm $ 0.11
(1) Includes stock-based compensation (2) Adjusted for asset sales (3) Oil and NGLs collectively referred to as “Liquids” Note: Reconciliation of non-GAAP measures to comparable GAAP measures appear on pages 39-40
14% YOY
686 mboe/d(2)
LIQUIDS MIX(3) ADJ. OIL PRODUCTION
29% 17% YOY
122 mbbls/d
of Total Production
ADJ. PRODUCTION

5 I INVESTOR PRESENTATION 5/6/2015
SOUTHERN DIVISION

6 I INVESTOR PRESENTATION 5/6/2015
EAGLE FORD LOW-COST VALUE GENERATION
• 1Q’15 operational updates ˃ 600 – 700 incremental wells added to undrilled
inventory following successful down spacing tests
˃ First 3 wells with 10,000’+ laterals drilled in 1Q’15
˃ 7% sequential production increase to 113 mboe/d
˃ Currently at seven rigs, transitioning to 3 by 2Q’15
˃ 105 1Q’15 TILs had average peak rate of 763 boe/d
• Strategic priorities ˃ Take advantage of lower activity levels to optimize
field development planning
˃ Front-loaded development planning with focus on prioritizing wells with >10,000’ laterals
˃ Incorporate tighter well spacing into development plan, avoiding lost opportunities
$8.1
$6.9 $5.9
$5.5
2012 2013 2014 2015
Well Cost ($ in mm)

7 I INVESTOR PRESENTATION 5/6/2015
EAGLE FORD SPACING TEST RESULTS
• No appreciable production impact from reduced spacing
• Increased drillable locations by 600 – 700 to ~4,500 total Lower Eagle Ford locations
• Additional down spacing tests planned
7
Four Corners Oil Area McMullen
Oil Area
Southern Wet Gas Area
~120 Incremental Wells
~90 Incremental Wells
~500 Incremental Wells
0
20
40
0 30 60
Cum
ulat
ive
Oil
(mbo
) McMullen Oil Area 500' Spacing
330' Spacing
0
50
100
0 100 200 300 400
Cum
ulat
ive
Oil
(mbo
) Four Corners Oil Area
500' Spacing360' spacing
0
25
50
0 100 200
Cum
ulat
ive
Oil
(mbo
) Southern Wet Gas Area 660' Spacing
500' Spacing

8 I INVESTOR PRESENTATION 5/6/2015
EAGLE FORD DRIVING CAPITAL EFFICIENCY WITH LONGER LATERALS
• Field development planning focused on prioritizing longer lateral wells
• Successfully drilled five wells with laterals >10,000’ in 1Q’15
• One 10,000’ lateral well pays out twice as fast as two 5,000’ lateral wells
33% Decrease in cost per foot
76% Improvement in EUR with 10,000’ laterals
~600 Potential number of locations with lateral lengths > 10,000’
439 588
772
$12.30 $10.71
$9.33
$-
$2.00
$4.00
$6.00
$8.00
$10.00
$12.00
$14.00
$16.00
$18.00
-100
100
300
500
700
900
1100
Four Corners5,000'
Four Corners7,500'
Four Corners10,000'
EUR (mboe)Well Cost / EUR ($/boe)
1,080
840 720
Four Corners5,000'
Four Corners7,500'
Four Corners10,000'
Well Cost / Lateral Foot($ / ft.)
9 I INVESTOR PRESENTATION 5/6/2015
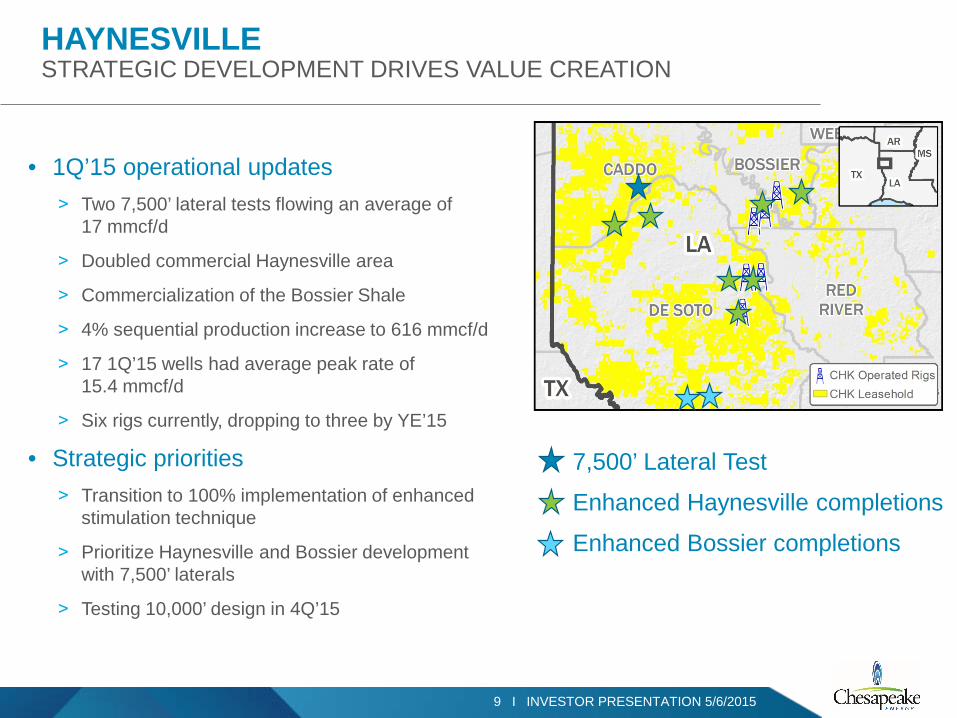
HAYNESVILLE STRATEGIC DEVELOPMENT DRIVES VALUE CREATION
7,500’ Lateral Test
Enhanced Haynesville completions
Enhanced Bossier completions
• 1Q’15 operational updates ˃ Two 7,500’ lateral tests flowing an average of
17 mmcf/d
˃ Doubled commercial Haynesville area
˃ Commercialization of the Bossier Shale
˃ 4% sequential production increase to 616 mmcf/d
˃ 17 1Q’15 wells had average peak rate of 15.4 mmcf/d
˃ Six rigs currently, dropping to three by YE’15
• Strategic priorities ˃ Transition to 100% implementation of enhanced
stimulation technique
˃ Prioritize Haynesville and Bossier development with 7,500’ laterals
˃ Testing 10,000’ design in 4Q’15

10 I INVESTOR PRESENTATION 5/6/2015
HAYNESVILLE NEW WELL DESIGNS ARE EXPANDING THE PLAY
• Increased lateral lengths and enhanced stimulations have expanded the core of the play ˃ EUR expected to increase 200% ˃ Expected 42% reduction in cost per lateral foot ˃ 50% improvement in capital efficiency expected
• Enhanced stimulation design makes poorer quality reservoirs economic and increases our available location count
7 9.3
14
4,500 5,000
7,500
0
2
4
6
8
10
12
14
16
0
1,000
2,000
3,000
4,000
5,000
6,000
7,000
8,000
Traditional Well Modern Well Modern ExtendedLateral
EUR (BCF)Lateral Length (ft)
1,900
1,500
1,100
10
15
18
5
7
9
11
13
15
17
19
0200400600800
1,0001,2001,4001,6001,800
Traditional Well Modern Well Modern ExtendedLateral
Well Cost / Lateral Ft
IP Rate (MMCFPD)
$8.5mm $8.3mm
$7.5mm

11 I INVESTOR PRESENTATION 5/6/2015
HAYNESVILLE NEW STIMULATION TECHNIQUES DRIVE PERFORMANCE
• Enhanced stimulations have expanded the core of the play ˃ Extending production peaks
˃ Greater than a 25% increase in EUR
˃ Expands developable area by 90,000 net acres to a total of 184,000 net acres

12 I INVESTOR PRESENTATION 5/6/2015
HAYNESVILLE BREAKING THROUGH DEVELOPMENT BARRIERS
• 7,500’ lateral test results ˃ Wells located in traditional 6 – 8 bcf
contour interval
˃ Production test exceeds offsets by more than 8 mmcf/d
$8.2mm Field estimated D&C cost

13 I INVESTOR PRESENTATION 5/6/2015
BOSSIER SHALE CREATING VALUE IN ALL PRODUCTIVE FORMATIONS
• Capital efficiencies and enhanced completion techniques open play for development
• Low existing well count allows development with longer laterals
• 200 – 400 incremental development wells • Competitive with traditional Haynesville
171
285
422
Area 1 Areas 1 & 2 Areas 1 - 3
Cumulative Well Count 4,500 ft7,500 ft10,000 ft
0
2
4
6
8
10
12
14
16
0 30 60 90Aver
age
Dai
ly P
rodu
ctio
n R
ate
(mm
cf/d
)
Days
Enhanced Bossier Completion Tests
Modern Well Rate Traditional Well Rate
BEDSOLE 1-10-13 H-2 ALT IP: 14.2 MMcf/day
4,700’ Lateral, $7.7MM
CHK MIN 28-10-13 2H ALT IP: 14.6 MMcf/day
4,450’Lateral, $6.9MM

14 I INVESTOR PRESENTATION 5/6/2015
MISSISSIPPIAN LIME CONSISTENTLY OUTPERFORMING EXPECTATIONS
• 1Q’15 operational updates ˃ 11% sequential production increase to
32 mboe/d net ˃ Currently running three rigs & one
completion crew ˃ 48 wells brought online in 1Q’15 had
average peak rate of 733 mboe/d ˃ Positive new formation tests in the Oswego
and Hoxbar
• Strategic priorities ˃ Expand drillable inventory via capital
efficiencies and delineation drilling ˃ Test new horizons currently not within the
active development programs ˃ Focus on reducing base decline through
artificial lift and recompletions
24 26 27 28
32
1Q'14 2Q'14 3Q'14 4Q'14 1Q'15
Net Production (mboe/d)

15 I INVESTOR PRESENTATION 5/6/2015
MISSISSIPPIAN LIME IMPROVED KNOWLEDGE DRIVES PERFORMANCE
280 295
335
2012 2013 2014
Operated Mississippian Lime EUR (mboe)
0
100
200
300
400
500
2 6 10 14 18 22 26 30 34
Daily
Pro
duct
ion
(boe
/d)
Normalized Time (Months)
2012
2013
2014
• Significant well performance improvement over the last three years ˃ Completion optimization
˃ Balanced rig program of core and delineation wells
˃ HBP program substantially complete
20% Increase in EUR over two years

16 I INVESTOR PRESENTATION 5/6/2015
MISSISSIPPIAN LIME LEADING THE INDUSTRY
• 45% capital reduction projected from 2012 to 2015
• 2015 development program generates 39% ROR at $2.5 mm(1)
• Capital efficiency improvements and field delineation program continue to generate incremental core locations
30%
39%
52%
$2.25$2.50$2.75D&C Cost ($ in mm)
Core Development Economics $4.6
$3.5 $3.1
$0.22 $0.18 $0.20 $2.5
2012 2013 2014 2015
Supply Chain Efficiency
Gains Design Improvements
Miss Lime CAPEX per Well ($ in mm)
E
(1) Based on $3.25/mcf gas and $65 /bbl oil

17 I INVESTOR PRESENTATION 5/6/2015
35
40
45
50
55
60
65
70
75
80
J F M A M J J A S O N D J F M A M J J A S O N D
mbo
e/d
Gross Operated Base Production
2013
2014
28%
MID-CONTINENT NORTH IMPROVED OPERATING EFFICIENCY STRENGTHENS BASE PRODUCTION
• Increase in pre-emptive artificial lift installation and optimization
• Proactive work-over and recompletion program generated >100% ROR
• 6% reduction in downtime
• 20% reduction in downtime during winter months due to winterization initiatives
35%
20% Increase in base decline YOY

18 I INVESTOR PRESENTATION 5/6/2015
ENHANCING OUR BASE PRODUCTION IMPROVED RECOVERY FROM OUR ASSETS
• Abundant opportunities within Chesapeake ˃ 4,600 under-stimulated legacy wells
• Re-stimulating the Barnett
˃ Early field completions were small ˃ 1,100+ potential re-frac opportunities
• Enhancing the Haynesville
˃ New drills enhance existing producers ˃ Evaluating re-frac options vs. stimulation from
development program

19 I INVESTOR PRESENTATION 5/6/2015
NORTHERN DIVISION

20 I INVESTOR PRESENTATION 5/6/2015
UTICA 2015 STRATEGIC FOCUS
• 1Q’15 operational updates
˃ Five rigs currently; two rigs by middle of 3Q’15
˃ Four frac crews currently; 2.5 on average for remainder of year
˃ Minimum two rigs to hold acreage
• Strategic priorities
˃ Reduce WOC/WOPL well inventory
˃ Focus on capital efficiency via industry-leading operations
˃ Limit testing to expand core resources
˃ Optimize base production
CHK/TOT JV Outline CHK Operated Rigs Industry Rigs CHK Leasehold Oil Window Wet Gas Window Dry Gas Window

21 I INVESTOR PRESENTATION 5/6/2015
UTICA INDUSTRY-LEADING PERFORMANCE
0
200
400
600
800
1,000
1,200
0
5
10
15
20
25
30
CHK COMP A COMP B COMP C COMP DFt
/ D
ay
Dril
l Day
s
Drill Days
Penetration Rate
Drilling Performance
$0
$2
$4
$6
$8
$10
$12
CHK COMP B COMP C COMP D COMP A
Gro
ss C
apex
/ W
ell,
$mm
Average Well Cost
Most efficient driller by 40% Based on IHS Supply Analytics – November 2014 Report

22 I INVESTOR PRESENTATION 5/6/2015
0
200
400
600
800
1,000
1,200
1,400
0
200
400
600
800
1,000
1,200
1,400
0 1 2 3
Cum
ulat
ive
Pro
duct
ion
(mbo
e)
Ave
rage
boe
/d
End of YEAR
2014 Program Daily Avg. Rate2015 Program Daily Avg. Rate2014 Program Cumulative Production2015 Program Cumulative Production
UTICA ENHANCED COMPLETIONS PROGRESS
• 20% EUR improvement driven by enhanced completions
˃ Longer lateral lengths
˃ Increased stages per well
˃ Tailored cluster spacing
(1) Type curve represents core wet development area
4,900 ft. 5,150 ft. 6,200 ft. 7,900 ft. 10
17
29
41
2012 2013 2014 2015E
Lateral Length per Well
Stages per Well
Completion Performance
>25% Expected increase in lateral lengths vs. 2014
Eight stages per day Current average stages per day per crew; 12 stages max by single crew
Type Curve (1)
1,595 mboe gross EUR type curve 1,265 boe/d first month avg

23 I INVESTOR PRESENTATION 5/6/2015
~25% Expected rate of return based on actual results at $3.25 gas / $65 oil
UTICA IMPROVING PERFORMANCE LEADS TO CORE EXPANSION
• Optimized completions
• Enhanced geologic interpretation
˃ Targeting
˃ Fault identification
˃ Pressure mapping
0
200
400
600
800
1,000
1,200
1,400
1,600
1,800
2,000
0 100 200 300 400
Gro
ss B
oe/d
Days
Columbiana County Well Results
Early WellsNew WellsExpected Type Curve
CHK/TOT JV Outline CHK Leasehold Oil Window Wet Gas Window Dry Gas Window
+50% Improvement in new well performance vs. early wells
3 Wells
9 Wells

24 I INVESTOR PRESENTATION 5/6/2015
-
20
40
60
80
100
120
140
160
180
200
Jan-14 Apr-14 Jul-14 Oct-14 Jan-15 Apr-15 Jul-15 Oct-15
UTICA BASE OPTIMIZATION
• Operating more efficiently
˃ Decreasing downtime through better winter operations preparation
˃ Choke management
˃ Pressure maintenance program
• Midstream improvements
˃ Line pressure decrease
˃ Fewer disruptions
2015 Base Gross Operated Production
60% Reduction in winter downtime 2014 – 15 vs. 2013 – 14
Mbo
e/d
Original Forecast Current Forecast
-
20
40
60
80
100
120
140
160
180
200
Jan-14 Apr-14 Jul-14 Oct-14 Jan-15 Apr-15 Jul-15 Oct-15

25 I INVESTOR PRESENTATION 5/6/2015
POWDER RIVER 2015 STRATEGIC FOCUS
• 1Q’15 operational updates
˃ One rig current through YE’15
˃ One frac crew currently; limited crews remainder of year
˃ Federal Units limit amount of activity needed to hold acreage
• Strategic priorities
˃ Primarily focused on Sussex
˃ Niobrara resource expansion
˃ Continuing to drive efficiencies
˃ Huge resource potential via stacked plays
(1) Includes Teapot, Parkman, Sussex and Shannon (2) Includes stacked, staggered laterals and Niobrara core expansion, Frontier and Mowry
> 2.0 billion boe Gross recoverable resources
Gross Unrisked Resources
3,000+ Potential gross locations
(1)
(2)

26 I INVESTOR PRESENTATION 5/6/2015
-
100
200
300
400
500
600
700
-
200
400
600
800
1,000
1,200
- 1 2 3
Cum
ulat
ive
Pro
duct
ion
(mbo
e)
Ave
rage
boe
/d
End of Year
POWDER RIVER SUSSEX PERFORMANCE
Sussex Performance
Sussex Drilled Wells Peak 24-Hour Rates
14 days Recent spud to rig release record $3.2mm drilling cost ($1 mm savings)
8,950’ Recent completed lateral length with record stages of 30
800 mboe gross EUR type curve (63% Oil) 950 boe/d first month average
Sussex Parkman Teapot Frontier Niobrara CHK Leasehold
Mar 2015 TIL Peak 1,990 boe/d
(68% Oil)
Feb 2014 TIL Peak 1,420 boe/d
(75% Oil)
Jan 2014 TIL Peak 2,900 boe/d
(50% Oil)
Jul 2014 TIL Peak 1,000 boe/d
(88% Oil)
20% – 50% Expected rate of return at $3.25 gas / $65 oil
Type Curve Average Rate Type Curve Cumulative Production Current Performance Average Rate
+100%

27 I INVESTOR PRESENTATION 5/6/2015
POWDER RIVER NIOBRARA COMPLETION PERFORMANCE
• 20% EUR improvement driven by enhanced completions ˃ Averaged lateral length of 5,425’ in 2014
(+7% vs. 2013)
˃ Averaged 20 frac stages in 2014 (+33% vs. 2013)
• Testing stacked laterals
0
100
200
300
400
500
600
700
0
200
400
600
800
1,000
1,200
1,400
0 1 2 3
Cum
ulat
ive
Pro
duct
ion
(mbo
e)
Ave
rage
boe
/d
End of Year
2014 Program Daily Avg. Rate2015 Program Daily Avg. Rate2014 Program Cumulative Production2015 Program Cumulative Production
Niobrara Type Curve
8,795’ Record lateral length
42 stages Record per well
1,085 mboe gross EUR type curve 1,270 boe/d first month average

28 I INVESTOR PRESENTATION 5/6/2015
NORTHERN MARCELLUS 2015 STRATEGIC FOCUS
• 1Q’15 operational updates
˃ One rig current through YE’15
˃ One frac crew currently; limited crews remainder of year
• Strategic priorities
˃ Minimum activity required to hold acreage
˃ Continue to drive efficiencies
˃ Expanding resources with upper Marcellus tests and lower Marcellus expansion
˃ Continued production curtailment to limit in-basin sales
CHK Operated Rigs Industry Rigs CHK Leasehold

29 I INVESTOR PRESENTATION 5/6/2015
$360
$290
$220 $205
11,000
12,000
13,000
14,000
15,000
0
100
200
300
400
2012 2013 2014 Q1 2015
Dril
led
Ft.
Cos
t / F
t.
Drill Cost per Ft Drilled Footage
NORTHERN MARCELLUS DRILLING PERFORMANCE
• Extensive use of Operations Support Center to reduce trouble time
• Improvement in all segments leading to significant cycle-time efficiencies
˃ 54% reduction from 2012 to 1Q’15
˃ 29% reduction from 2014 to 1Q’15
• Rig efficiency increased 150%
• Cost per foot decreased 40%
(1) 1Q’’15 capex based on field estimated costs
26 25
17
12
0
250
500
750
1,000
1,250
1,500
0
5
10
15
20
25
30
2012 2013 2014 Q1 2015
Ft. /
Day
Day
s
Drill Days Ft per Day
<10 days Record drill days achieved in 2015 on back-to-back wells
29% Continued improvement in drilling days in 1Q’15
(1)
2012 2013 2014 1Q’15
2012 2013 2014 1Q’15(1)

30 I INVESTOR PRESENTATION 5/6/2015
NORTHERN MARCELLUS ENHANCED COMPLETIONS LEADING TO BETTER RESULTS
ROR Comparison vs. Realized Gas Price
10,750’ Record lateral length
50 stages Record per well
0
10
20
30
40
50
60
70
80
90
100
$0.00 $0.50 $1.00 $1.50 $2.00 $2.50 $3.00 $3.50 $4.00 $4.50
Rat
e of
Ret
urn
(%)
2011 2013 2015E
IP 8 mmcf/d 9 mmcf/d 11 mmcf/d
EUR 9 bcf 10 bcf 12 bcf
Capex / Well $9 mm $8 mm $7 mm
Lateral Length 5,200’ 5,400’ 6,000’
Stages 11 13 24
+20% EUR Improvement
30% ROR price threshold has been cut in half since 2011
2011
2013
2015

31 I INVESTOR PRESENTATION 5/6/2015
OPERATIONS SUPPORT CENTER CENTRAL COMMAND CENTER
• Provides 24/7 real-time analysis and execution support ˃ Reducing trouble and nonproductive time
˃ Geologic well navigation and placement
˃ Production monitoring and control
˃ Liquids dispatch and logistics
• Expanding proven success across all business units leading to ˃ Less downtime
˃ More efficient growth
˃ Continuous improvement
Support Center Overview
Staffed with 100+ employees in all disciplines
Operating 24/7 year-round in 12-hour shifts
Supported more than 1,000 wells drilled in 2014
Real-time monitoring & analyzing for 6,000+ producing wells at any given time

32 I INVESTOR PRESENTATION 5/6/2015
8%
8%
10%
18%
19%
21%
35%
39%
0% 5% 10%15%20%25%30%35%40%
Capex (Other)
Fluids, Mud & Chemicals
OCTG
Directional Drilling
Pressure Pumping
Water (Hauling/Transfer/Services)
Fuel
Rig Mobilization
2015 Estimated Capex Savings by Category
SUPPLY CHAIN STRONG SUCCESS CAPTURING SUPPLIER COST SAVINGS
• Captured supply chain savings ˃ Cost per well savings of ~15%
˃ LOE supplier cost reductions ~$0.10/boe
• Continued focus areas ˃ Targeting further savings in all spend categories
˃ Optimizing inventory and asset utilization
• Does not include additional savings for design changes or operational efficiencies

33 I INVESTOR PRESENTATION 5/6/2015
- 2 4 6 8 10 12 14 16 18
0
50
100
150
200
250
300
1Q'15 2Q'15E 3Q'15E 4Q'15E
Frac
Cre
ws
Wel
l Cou
nt
Completion Activity
TIL Frac Crews
-
10
20
30
40
50
60
0.0
0.2
0.4
0.6
0.8
1.0
1.2
1.4
1Q'15 2Q'15E 3Q'15E 4Q'15E
$ in
bill
ions
D&C Capex and Rig Count
D&C Capex Reduction from Feb'15 Rigs
• = Actual 1Q’15 results
LOWER 2015 CAPEX AND ACTIVITY
Note: Data above based on Outlook issued 5/6/2015
• ~45% reduction in total capex vs. 2014; >30% reduction in D&C capex • ~$6 billion of budgeted liquidity at YE’15 with a combination of cash on balance
sheet and an undrawn credit facility

34 I INVESTOR PRESENTATION 5/6/2015
COMPANY GAS DIFFERENTIALS
(1) Non-Basis includes gathering, compression, treating, firm transportation and fuel (2) 2016 assumes activity consistent with 4Q 2015 budget
$1.41 $1.35 - 1.45 $1.35 - 1.45
$0.33 $0.35 - 0.45 $0.30 - 0.40 $0.11
$0.17 - 0.19 $0.21 - 0.23
$0.00
$0.50
$1.00
$1.50
$2.00
$2.50
2014 2015 2016
($/m
cf)
MVC ShortfallBasis & BtuNon-Basis(1)
(2)

35 I INVESTOR PRESENTATION 5/6/2015
2015E OUTLOOK SUMMARY
2015E Adjusted Production Growth 1 – 3% Absolute Production: Liquids – mmbbls 62 – 64 Oil – mmbbls 38.5 – 39.5 NGL(1) – mmbbls 23.5 – 24.5 Natural gas - bcf 1,025 – 1,040 Total absolute production – mmboe 233 – 237 Absolute daily rate – mboe 640 – 650 Operating Costs per Boe of Projected Production:
Production expenses, production taxes and G&A(2) $6.60 – $7.35
Capital Expenditures($mm) (3) $3,000 – $3,500 Capitalized Interest ($mm) $475 Total capital expenditures ($mm) $3,475 – $3,975
(1) Assumes ethane recovery in Utica to fulfill CHK’s pipeline commitments, no ethane recovery in Powder River Basin, and partial ethane recovery in Mid-Continent and Eagle Ford
(2) Includes stock-based compensation and restructuring and other termination costs (3) Includes capital expenditures for drilling and completion, leasehold, geological and geophysical costs and other property and plant and equipment

36 I INVESTOR PRESENTATION 5/6/2015
STRONG STRATEGIC POSITION
High-quality assets
Talented people
Superior capital efficiency
Industry-leading cash costs
Strong liquidity
CHK

37 I INVESTOR PRESENTATION 5/6/2015 37 I INVESTOR PRESENTATION 5/6/2015
APPENDIX

38 I INVESTOR PRESENTATION 5/6/2015
Utica 3 – 5 3 – 5 2 – 3
REDUCED ACTIVITY LEVELS
2015E Avg.Op Rigs
(2/25 Outlook)
Eagle Ford 12 – 14 8 –10 2 – 4
Haynesville 7 – 8 5 – 6 2 – 4
PRB: Niobrara & Upper Cretaceous 3 – 4 2 – 3 1 – 2
Mississippian Lime 7 – 8 5 – 6 2 – 4
Mid-Continent South 1 – 2 1 – 2 0 – 1
Marcellus 1 – 2 1 – 2 0 – 1
Other(1) 1 – 2 0 – 1 – Total 35 – 45 25 – 35 9 – 19
(1) Other includes Cleveland Tonkawa, Barnett
2015E Avg.Op Rigs
(3/23 Outlook)
YE 2015 Op. Rigs
(3/23 Outlook)

39 I INVESTOR PRESENTATION 5/6/2015
($ in mm)
Three Months Ended: 3/31/2015 3/31/2014 Net income available to common stockholders $(3,782) $374 Adjustments, net of tax: Unrealized gains on derivatives 192 80 Restructuring and other termination costs (7) (4) Provision for legal contingencies 18 -- Impairment of oil and natural gas properties 3,635 -- Impairments of fixed assets and other 3 12 Net (gains) losses on sales of fixed assets 2 (14) Net gain on sales of investments -- (42) Losses on purchases of debt and extinguishment of other financing -- -- Tax rate adjustment (17) -- Other (2) (1) Adjusted net income available to common stockholders(1) $42 $405 Preferred stock dividends 43 43 Earnings allocated to participating securities -- 8 Total adjusted net income attributable to CHK $85 $456 Weighted average fully diluted shares outstanding(2) 776 767 Adjusted earnings per share assuming dilution(1) $0.11 $0.59
(1) Adjusted net income and adjusted earnings per share assuming dilution are not measures of financial performance under accounting principles generally accepted in the United States (GAAP), and should not be considered as an alternative to net income available to common stockholders or diluted earnings per share. Adjusted net income available to common stockholders and adjusted earnings per share assuming dilution exclude certain items that management believes affect the comparability of operating results. The company believes these adjusted financial measures are a useful adjunct to earnings calculated in accordance with GAAP because:
i. Management uses adjusted net income available to common stockholders to evaluate the company's operational trends and performance relative to other oil and natural gas producing companies.
ii. Adjusted net income available to common stockholders is more comparable to earnings estimates provided by securities analysts. iii. Items excluded generally are one-time items or items whose timing or amount cannot be reasonably estimated. Accordingly, any guidance provided by the
company generally excludes information regarding these types of items. (2) Weighted average fully diluted shares outstanding include shares that were considered antidilutive for calculating earnings per share in accordance with GAAP.
RECONCILIATION OF ADJUSTED EARNINGS PER SHARE

40 I INVESTOR PRESENTATION 5/6/2015
($ in mm) Three Months Ended: 3/31/2015 3/31/2014 Cash provided by operating activities $423 $1,291 Changes in assets and liabilities 487 332 Operating cash flow(1) $910 $1,614 Net income $(3,720) $466 Interest expense 51 39 Income tax expense (1,372) 280 Depreciation and amortization of other assets 35 78 Oil, natural gas and NGL depreciation, depletion and amortization 684 628 EBITDA(2) $(4,322) $1,491 Adjustments: Unrealized gains on oil, natural gas and NGL derivatives 274 144 Restructuring and other termination costs (10) (7) Impairments of fixed assets and other 25 -- Net gains on sales of fixed assets 4,976 -- Losses on investments 4 20 Net (gain) loss on sales of investments 3 (23) Losses on purchases of debt and extinguishment of other financing -- (67) Provision for legal contingencies -- -- Net income attributable to noncontrolling interests (19) (41) Other (3) (2) Adjusted EBITDA(3) $928 $1,515
RECONCILIATION OF ADJUSTED EBITDA
(1) Operating cash flow represents net cash provided by operating activities before changes in assets and liabilities. Operating cash flow is presented because management believes it is a useful adjunct to net cash provided by operating activities under GAAP. Operating cash flow is widely accepted as a financial indicator of an oil and natural gas company's ability to generate cash that is used to internally fund exploration and development activities and to service debt. This measure is widely used by investors and rating agencies in the valuation, comparison, rating and investment recommendations of companies within the oil and natural gas exploration and production industry. Operating cash flow is not a measure of financial performance under GAAP and should not be considered as an alternative to cash flows from operating, investing or financing activities as an indicator of cash flows, or as a measure of liquidity.
(2) Ebitda represents net income before interest expense, income taxes, and depreciation, depletion and amortization expense. Ebitda is presented as a supplemental financial measurement in the evaluation of our business. We believe that it provides additional information regarding our ability to meet our future debt service, capital expenditures and working capital requirements. This measure is widely used by investors and rating agencies in the valuation, comparison, rating and investment recommendations of companies. Ebitda is also a financial measurement that, with certain negotiated adjustments, is reported to our lenders pursuant to our bank credit agreements and is used in the financial covenants in our bank credit agreements. Ebitda is not a measure of financial performance under GAAP. Accordingly, it should not be considered as a substitute for net income, income from operations or cash flow provided by operating activities prepared in accordance with GAAP.
(3) Adjusted ebitda excludes certain items that management believes affect the comparability of operating results. The company believes these non-GAAP financial measures are a useful adjunct to ebitda because:
(1) Management uses adjusted ebitda to evaluate the company's operational trends and performance relative to other oil and natural gas producing companies. (2) Adjusted ebitda is more comparable to estimates provided by securities analysts. (3) Items excluded generally are one-time items or items whose timing or amount cannot be reasonably estimated. Accordingly, any guidance provided by the company generally excludes information regarding these types of items.
Accordingly, adjusted EBITDA should not be considered as a substitute for net income, income from operations or cash flow provided by operating activities prepared in accordance with GAAP.

41 I INVESTOR PRESENTATION 5/6/2015
CAPTURING MORE FOR LESS NORTHERN DIVISION
Marcellus North: 39% Improvement Utica: 53% Improvement
Powder River: 46% Improvement
Note: Capex / EUR is defined as net drilling and completion (D&C) costs per well divided by net estimated ultimate reserves booked per well
42 I INVESTOR PRESENTATION 5/6/2015
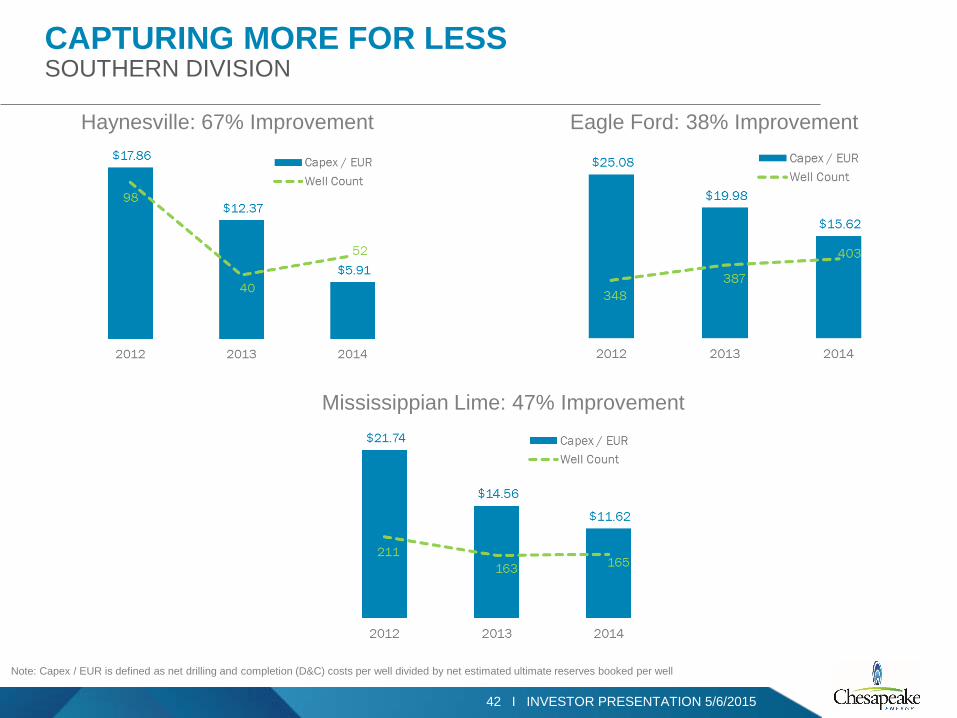
CAPTURING MORE FOR LESS SOUTHERN DIVISION
Haynesville: 67% Improvement Eagle Ford: 38% Improvement
Mississippian Lime: 47% Improvement
Note: Capex / EUR is defined as net drilling and completion (D&C) costs per well divided by net estimated ultimate reserves booked per well

43 I INVESTOR PRESENTATION 5/6/2015
DRILLING AND SERVICES COMMITMENTS
• Commitments roll off through 2015 – CHK has chosen to pay some penalties due to current market conditions and desire to lower overall spending
51 Rigs
45 Rigs
51 Rigs
65 Rigs
71 Rigs
$0
$25
$50
$75
$100
$125
$150
Q1 2015 Q2 2015 Q3 2015 Q4 2015
Tota
l Com
mitm
ent (
$ in
mm
)
PTL Commitment FulfilledDrill Commitment FulfilledDrill Commitment Penalty
1Q’15 2Q’15 3Q’15 4Q’15

44 I INVESTOR PRESENTATION 5/6/2015
CORPORATE INFORMATION
PUBLICLY TRADED SECURITIES CUSIP TICKER 3.25% Senior Notes due 2016 #165167CJ4 CHK16 6.25% Senior Notes due 2017 #027393390 N/A 6.50% Senior Notes due 2017 #165167BS5 CHK17 7.25% Senior Notes due 2018 #165167CC9 CHK18A 3mL + 3.25% Senior Notes due 2019 #165167CM7 CHK19 6.625% Senior Notes due 2020 #165167CF2 CHK20A 6.875% Senior Notes due 2020 #165167BU0 CHK20 6.125% Senior Notes Due 2021 #165167CG0 CHK21 5.375% Senior Notes Due 2021 #165167CK21 CHK21A 4.875% Senior Notes Due 2022 #165167CN5 CHK22 5.75% Senior Notes Due 2023 #165167CL9 CHK23 2.75% Contingent Convertible Senior Notes due 2035 #165167BW6 CHK35
2.50% Contingent Convertible Senior Notes due 2037 #165167BZ9/ #165167CA3
CHK37/ CHK37A
2.25% Contingent Convertible Senior Notes due 2038 #165167CB1 CHK38 4.5% Cumulative Convertible Preferred Stock #165167842 CHK PrD
5.0% Cumulative Convertible Preferred Stock (Series 2005B) #165167834/ #165167826 N/A
5.75% Cumulative Convertible Preferred Stock #U16450204/ #165167776/ #165167768
N/A
5.75% Cumulative Convertible Preferred Stock (Series A) #U16450113/ #165167784/ #165167750
N/A
Chesapeake Common Stock #165167107 CHK
6100 N. Western Avenue Oklahoma City, OK 73118 WEBSITE: www.chk.com
CHESAPEAKE HEADQUARTERS
BRAD SYLVESTER, CFA Vice President — Investor Relations and Communications DOMENIC J. DELL'OSSO, JR. Executive Vice President and Chief Financial Officer
Investor Relations department can be reached by phone at (405) 935-8870 or by email at [email protected]
CORPORATE CONTACTS