Embed Size (px)
Citation preview
FY2017 Results – Investor Presentation
31 May 2017
FY2017 Results Investor Presentation
5/31/2017 9:36 AM
5/31/2017 9:36 AM
FY2017 Results – Investor Presentation
Financial
Overview
1 2 4
FY2017
Financial
Overview
Business
UpdateSupplementary
Information
Table of Contents
• Key
Performance
Indicators
• Top 4 Aspirations
• Key
Milestones
• Wholesale
Banking
Heartbeat
• Retail Banking
Heartbeat
• General
Insurance
Heartbeat
• Group
Performance
• Divisional
Performance
• Economic and
Banking Data
5
FY2018-2020
Strategy
• Business Strategy
3
Financial
Performance
• Performance
Highlights
• Guidance &
Expectations
FY2017 Results – Investor Presentation
GCEO Presentation
3

FY2017 Results – Investor Presentation
Financial
Overview
PATMI
FY2017 Key Performance Indicators
4
Return on Equity (ROE)
Cost-to-income (CTI) Ratio CET 11Dividend Payout
13.8%
8.8% 8.5%
8.5% to 9.0%
FY15 FY16 FY17 FY17Guidance
1,918.6
1,302.2 1,324.6
~5% Growth
p.a.
FY15 FY16 FY17 FY17Guidance
YOY ∆ :
+1.7%
43%
36%
40% ~40%
FY15 FY16 FY17 FY17Guidance
45.7%
58.8% 57.4% ≤ 57%
FY15 FY16 FY17 FY17Guidance
10.5%
11.3%
11.6%
10.0%
FY15 FY16 FY17 FY17Guidance
+/-1%
1. Based on Aggregated Banking Entities net of proposed dividend
PBP
2,566.8
1,521.5 1,605.1
FY15 FY16 FY17
YOY ∆ :
+5.5%
FY2017 Results – Investor Presentation
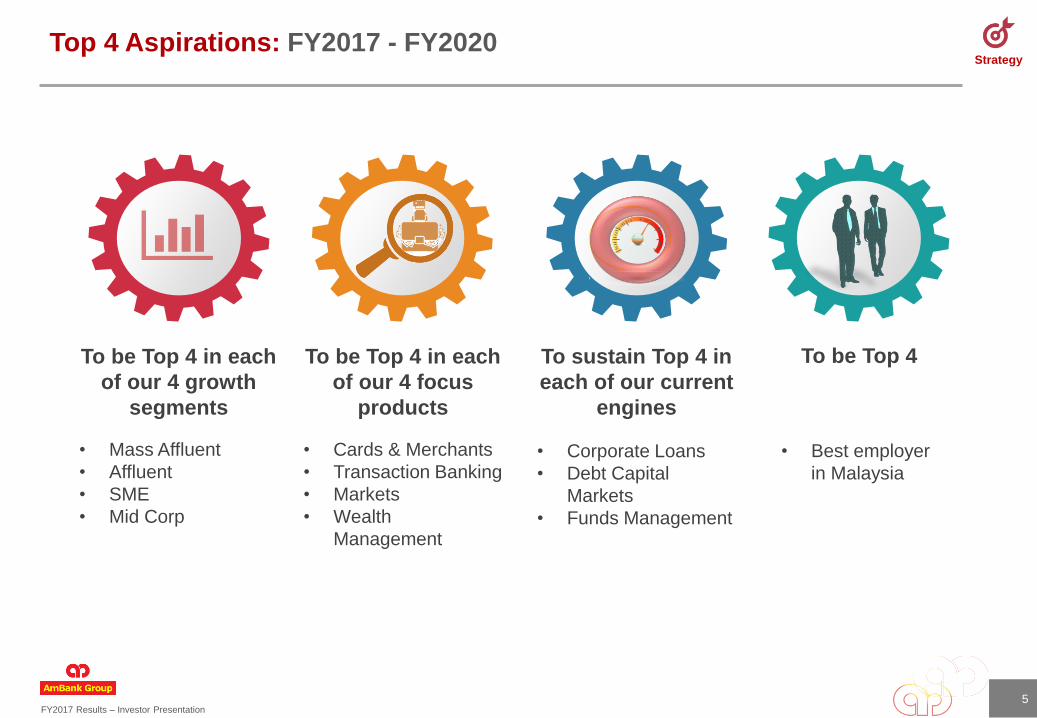
StrategyTop 4 Aspirations: FY2017 - FY2020
5
To be Top 4 in each
of our 4 growth
segments
• Mass Affluent
• Affluent
• SME
• Mid Corp
To be Top 4 in each
of our 4 focus
products
• Cards & Merchants
• Transaction Banking
• Markets
• Wealth
Management
To sustain Top 4 in
each of our current
engines
• Corporate Loans
• Debt Capital
Markets
• Funds Management
To be Top 4
• Best employer
in Malaysia
FY2017 Results – Investor Presentation
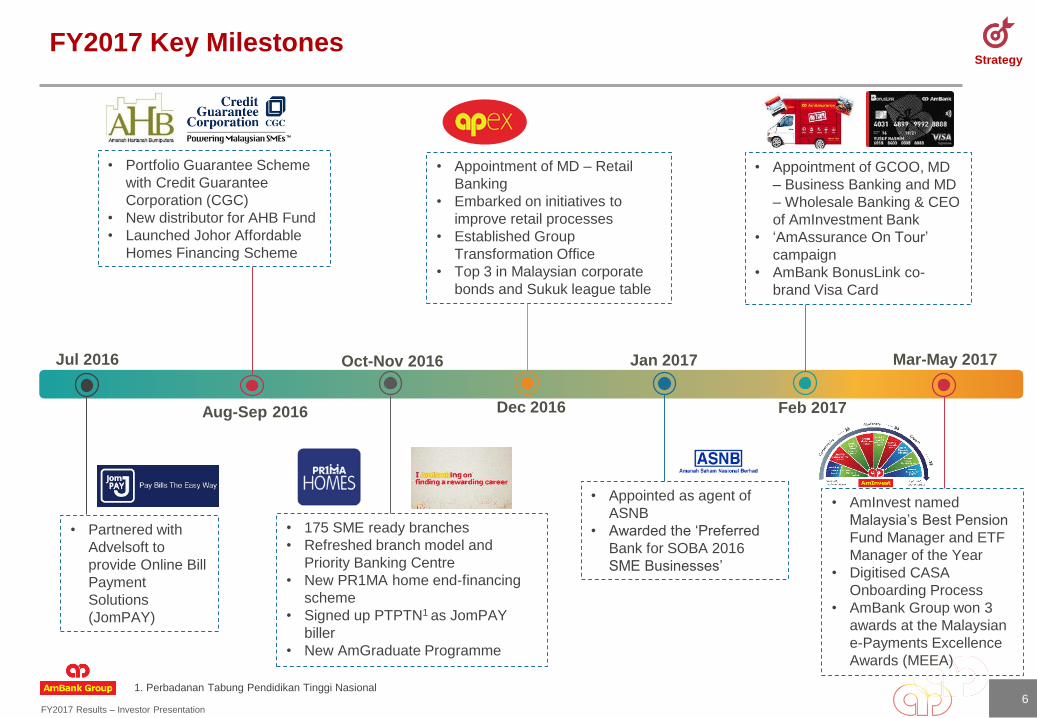
StrategyFY2017 Key Milestones
6
• 175 SME ready branches
• Refreshed branch model and
Priority Banking Centre
• New PR1MA home end-financing
scheme
• Signed up PTPTN1 as JomPAY
biller
• New AmGraduate Programme
• Portfolio Guarantee Scheme
with Credit Guarantee
Corporation (CGC)
• New distributor for AHB Fund
• Launched Johor Affordable
Homes Financing Scheme
• Partnered with
Advelsoft to
provide Online Bill
Payment
Solutions
(JomPAY)
Jul 2016
Aug-Sep 2016
Oct-Nov 2016
Dec 2016
• Appointment of MD – Retail
Banking
• Embarked on initiatives to
improve retail processes
• Established Group
Transformation Office
• Top 3 in Malaysian corporate
bonds and Sukuk league table
Feb 2017
• Appointed as agent of
ASNB
• Awarded the ‘Preferred
Bank for SOBA 2016
SME Businesses’
• Appointment of GCOO, MD
– Business Banking and MD
– Wholesale Banking & CEO
of AmInvestment Bank
• ‘AmAssurance On Tour’
campaign
• AmBank BonusLink co-
brand Visa Card
Jan 2017 Mar-May 2017
• AmInvest named
Malaysia’s Best Pension
Fund Manager and ETF
Manager of the Year
• Digitised CASA
Onboarding Process
• AmBank Group won 3
awards at the Malaysian
e-Payments Excellence
Awards (MEEA)
1. Perbadanan Tabung Pendidikan Tinggi Nasional
FY2017 Results – Investor Presentation
Wholesale
Banking
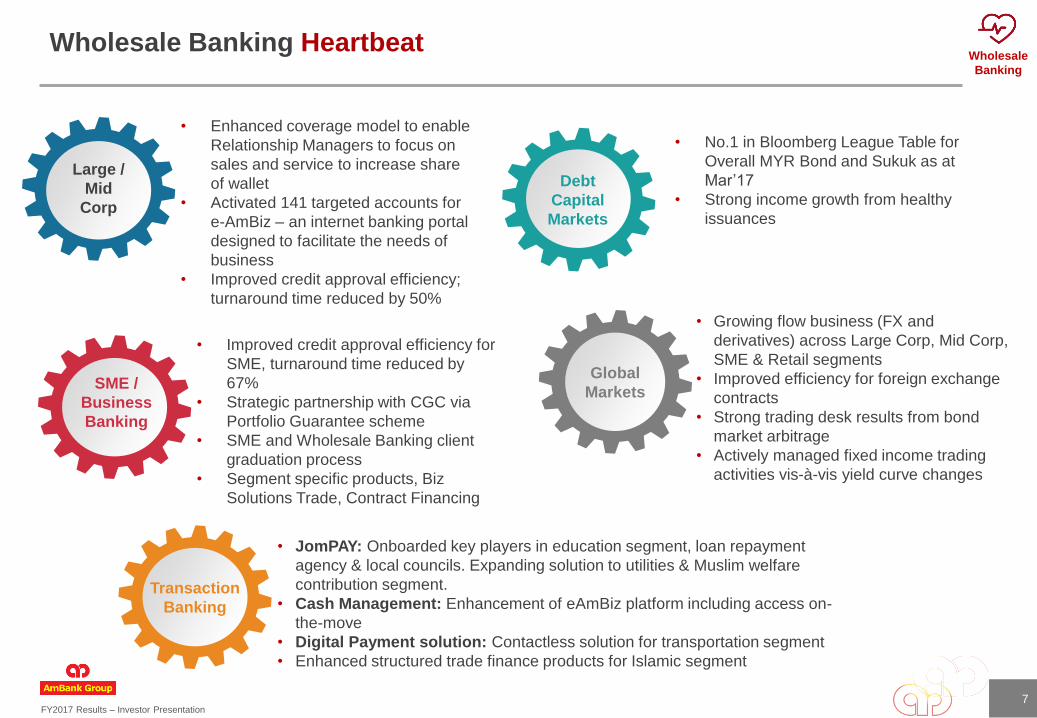
Wholesale Banking Heartbeat
7
• Growing flow business (FX and
derivatives) across Large Corp, Mid Corp,
SME & Retail segments
• Improved efficiency for foreign exchange
contracts
• Strong trading desk results from bond
market arbitrage
• Actively managed fixed income trading
activities vis-à-vis yield curve changes
• Improved credit approval efficiency for
SME, turnaround time reduced by
67%
• Strategic partnership with CGC via
Portfolio Guarantee scheme
• SME and Wholesale Banking client
graduation process
• Segment specific products, Biz
Solutions Trade, Contract Financing
• JomPAY: Onboarded key players in education segment, loan repayment
agency & local councils. Expanding solution to utilities & Muslim welfare
contribution segment.
• Cash Management: Enhancement of eAmBiz platform including access on-
the-move
• Digital Payment solution: Contactless solution for transportation segment
• Enhanced structured trade finance products for Islamic segment
• Enhanced coverage model to enable
Relationship Managers to focus on
sales and service to increase share
of wallet
• Activated 141 targeted accounts for
e-AmBiz – an internet banking portal
designed to facilitate the needs of
business
• Improved credit approval efficiency;
turnaround time reduced by 50%
Large /
Mid
Corp
Global
Markets
• No.1 in Bloomberg League Table for
Overall MYR Bond and Sukuk as at
Mar’17
• Strong income growth from healthy
issuances
Debt
Capital
Markets
SME /
Business
Banking
Transaction
Banking
FY2017 Results – Investor Presentation
Retail
Banking
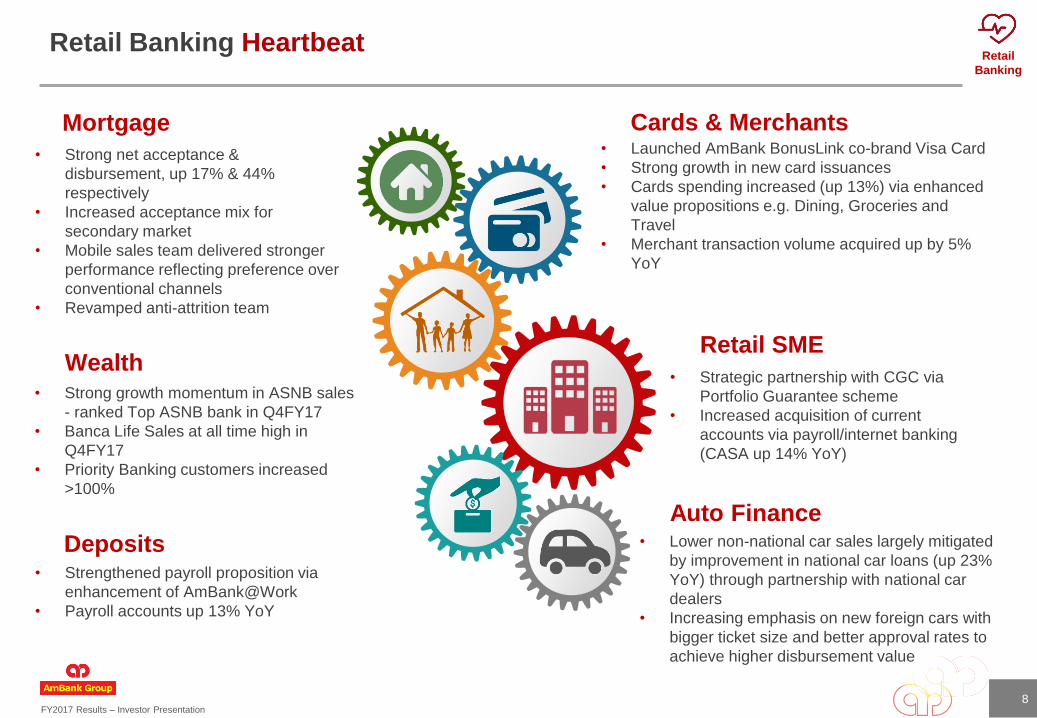
Retail SME
• Strategic partnership with CGC via
Portfolio Guarantee scheme
• Increased acquisition of current
accounts via payroll/internet banking
(CASA up 14% YoY)
Retail Banking Heartbeat
8
Mortgage
• Strong net acceptance &
disbursement, up 17% & 44%
respectively
• Increased acceptance mix for
secondary market
• Mobile sales team delivered stronger
performance reflecting preference over
conventional channels
• Revamped anti-attrition team
Deposits• Strengthened payroll proposition via
enhancement of AmBank@Work
• Payroll accounts up 13% YoY
Auto Finance• Lower non-national car sales largely mitigated
by improvement in national car loans (up 23%
YoY) through partnership with national car
dealers
• Increasing emphasis on new foreign cars with
bigger ticket size and better approval rates to
achieve higher disbursement value
Cards & Merchants• Launched AmBank BonusLink co-brand Visa Card
• Strong growth in new card issuances
• Cards spending increased (up 13%) via enhanced
value propositions e.g. Dining, Groceries and
Travel
• Merchant transaction volume acquired up by 5%
YoY
Wealth• Strong growth momentum in ASNB sales
- ranked Top ASNB bank in Q4FY17
• Banca Life Sales at all time high in
Q4FY17
• Priority Banking customers increased
>100%
FY2017 Results – Investor Presentation
General
Insurance
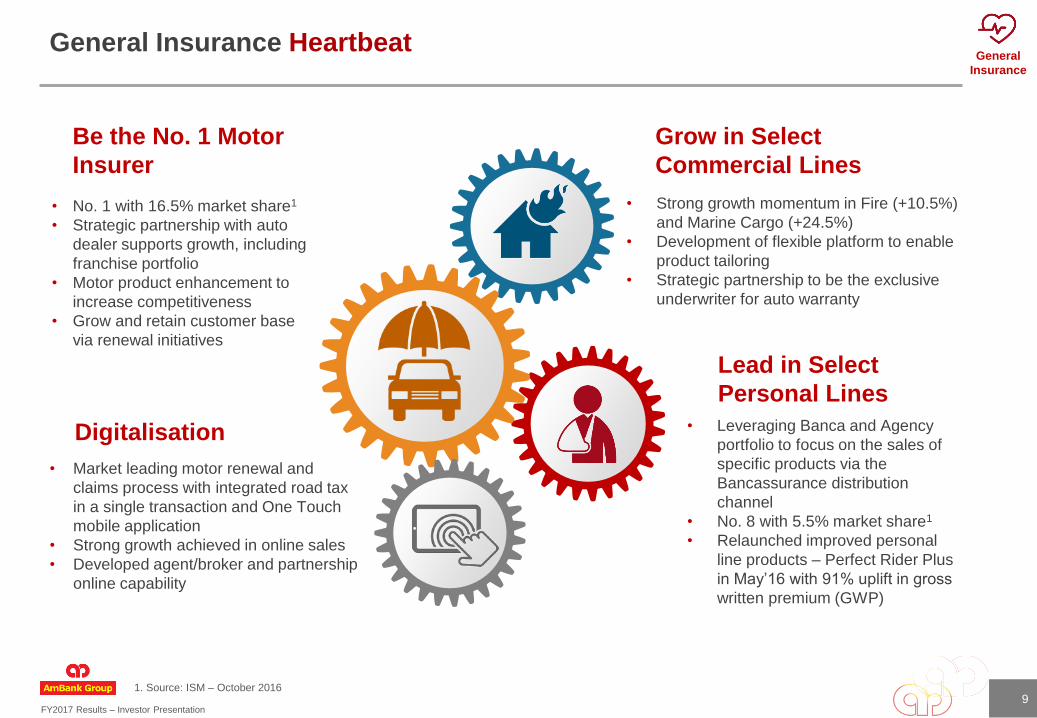
General Insurance Heartbeat
9
Digitalisation
• Market leading motor renewal and
claims process with integrated road tax
in a single transaction and One Touch
mobile application
• Strong growth achieved in online sales
• Developed agent/broker and partnership
online capability
Be the No. 1 Motor
Insurer
• No. 1 with 16.5% market share1
• Strategic partnership with auto
dealer supports growth, including
franchise portfolio
• Motor product enhancement to
increase competitiveness
• Grow and retain customer base
via renewal initiatives
Grow in Select
Commercial Lines
• Strong growth momentum in Fire (+10.5%)
and Marine Cargo (+24.5%)
• Development of flexible platform to enable
product tailoring
• Strategic partnership to be the exclusive
underwriter for auto warranty
Lead in Select
Personal Lines
• Leveraging Banca and Agency
portfolio to focus on the sales of
specific products via the
Bancassurance distribution
channel
• No. 8 with 5.5% market share1
• Relaunched improved personal
line products – Perfect Rider Plus
in May’16 with 91% uplift in gross
written premium (GWP)
1. Source: ISM – October 2016
FY2017 Results – Investor Presentation
CFO Presentation
10
FY2017 Results – Investor Presentation
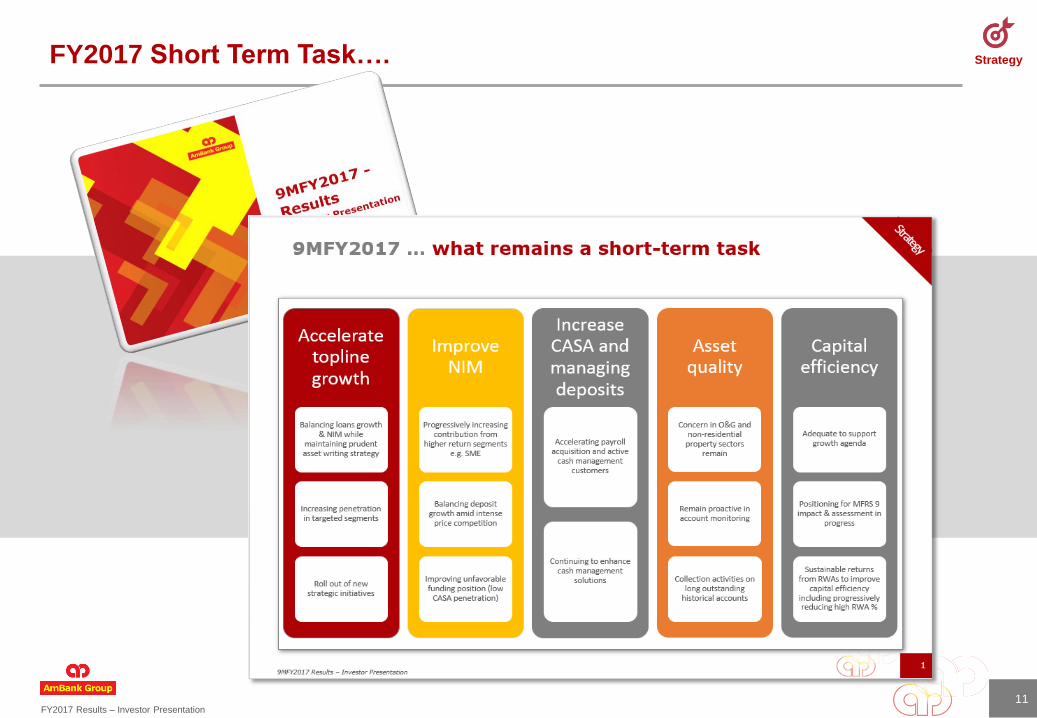
StrategyFY2017 Short Term Task….
11
FY2017 Results – Investor Presentation
Financial
Overview
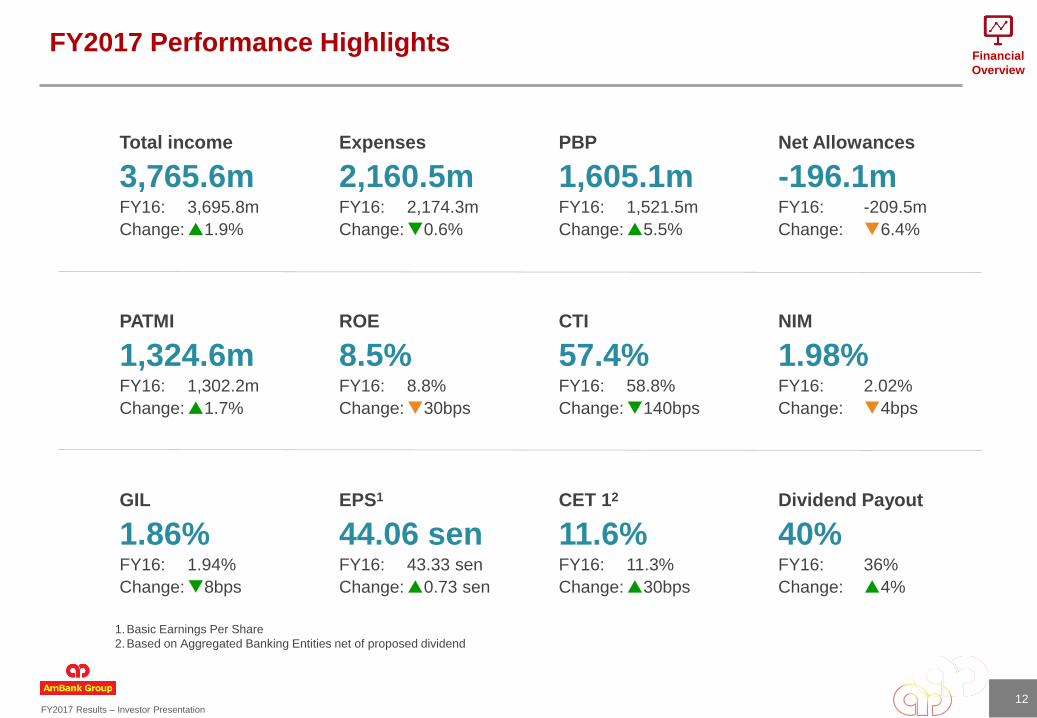
FY2017 Performance Highlights
12
Total income Expenses PBP Net Allowances
3,765.6m 2,160.5m 1,605.1m -196.1mFY16: 3,695.8m FY16: 2,174.3m FY16: 1,521.5m FY16: -209.5m
Change:1.9% Change:0.6% Change:5.5% Change: 6.4%
PATMI ROE CTI NIM
1,324.6m 8.5% 57.4% 1.98%FY16: 1,302.2m FY16: 8.8% FY16: 58.8% FY16: 2.02%
Change:1.7% Change:30bps Change:140bps Change: 4bps
GIL EPS1 CET 12 Dividend Payout
1.86% 44.06 sen 11.6% 40%FY16: 1.94% FY16: 43.33 sen FY16: 11.3% FY16: 36%
Change:8bps Change:0.73 sen Change:30bps Change: 4%
1.Basic Earnings Per Share
2.Based on Aggregated Banking Entities net of proposed dividend

FY2017 Results – Investor Presentation
99.8 99.7 103.2 102.1 100.0 96.1 99.2 104.8
84.3% 82.8% 84.7% 84.7% 85.8%89.6% 90.3%
85.7%
Q1FY16 Q2FY16 Q3FY16 Q4FY16 Q1FY17 Q2FY17 Q3FY17 Q4FY17
Customer Deposits
Adjusted LDR
339.5 382.5
300.2 280.0
323.0 352.6313.2
335.8
476.5435.4
325.7283.9
415.7 429.7
335.6
424.1
9.3% 10.2%8.0% 7.5% 8.5% 9.0% 8.0% 8.4%
Q1FY16 Q2FY16 Q3FY16 Q4FY16 Q1FY17 Q2FY17 Q3FY17 Q4FY17
PATMI PBP ROE
1. Customer deposits include stable funding sources
Quarterly Performance
PATMI (RM’ mil) & ROE (%) Net Lending (RM’ bil)
Customer Deposits1 (RM’ bil) and LDR (%) Total Income (RM’ bil)
PATMI QoQ growth: 7.2%
ROE QoQ growth: 0.4%
57.5%57.5%
24.6 24.1 22.723.3 22.2 21.8 21.6 21.3 20.8
347.5 318.6 311.7 339.3 385.6 405.2 275.2
407.3
616.4 616.3 580.8 565.2565.6 549.0
578.2
599.3
963.8 934.9 892.5 904.5
951.2 954.2
853.4
1,006.7
Q1FY16 Q2FY16 Q3FY16 Q4FY16 Q1FY17 Q2FY17 Q3FY17 Q4FY17
Non-interest Income
Net Interest Income
YoY growth: 1.9%
QoQ growth: 18.0%
61.9 63.5 63.8 65.2 65.0 65.7 69.7 70.4
22.2 21.8 21.6 21.4 20.8 20.4 19.9 19.6
84.1 85.3 85.4 86.5 85.8 86.189.5 90.0
Q1FY16 Q2FY16 Q3FY16 Q4FY16 Q1FY17 Q2FY17 Q3FY17 Q4FY17
Loans excluding Auto Finance
Auto Finance
YoY growth: 4.0%
YoY growth (excl.AF): 8.0%
QoQ growth: 0.5%
QoQ growth (excl.AF): 1.0%
YoY growth: 2.5%
QoQ growth: 5.7%
13
Q4FY17
Results

FY2017 Results – Investor Presentation
Financial
Overview
1,302.2 1,324.6
156.413.8
13.1
86.6
13.4
60.9
FY16 IntInc NII TInc Exp PBP Prov PBT Tax &Zakat
PAT MI FY17
YoY growth 4% 12% 2% 1% 5.5% 6% 4% 18% 1% 13% 1.7%
PBP grew 5.5% YoY, PATMI up 1.7%
14
Group
P&L
RM’ milNet Interest
Income
Non-Interest
Income
Total
IncomeExpenses PBP
Provisions/
AllowancesPBT Tax & Zakat PAT MI PATMI
FY17 2,292.2 1,473.4 3,765.6 2,160.5 1,605.1 (196.1) 1,801.2 392.4 1,408.8 84.2 1,324.6
FY16 2,378.8 1,317.0 3,695.8 2,174.3 1,521.5 (209.5) 1,731.0 331.5 1,399.5 97.3 1,302.2
Profit underpinned by stronger NoII, improved asset quality and recoveries while expenses were well contained
NIM:
1.98%
NoII%:
39.1%
CTI:
57.4%
GIL:
1.86%
Credit
Cost:
-0.19%
Effective
tax rate:
22.0%
19%
81%
20%
80%
Conventional PATMI Islamic PAT Positive growth in FY17 Contraction in FY17
FY2017 Results – Investor Presentation
Financial
Overview
Wholesale Banking
59%
Insurance14%
Others2%
Wholesale Banking
44%
Retail Banking36%
Insurance15%
Others5%
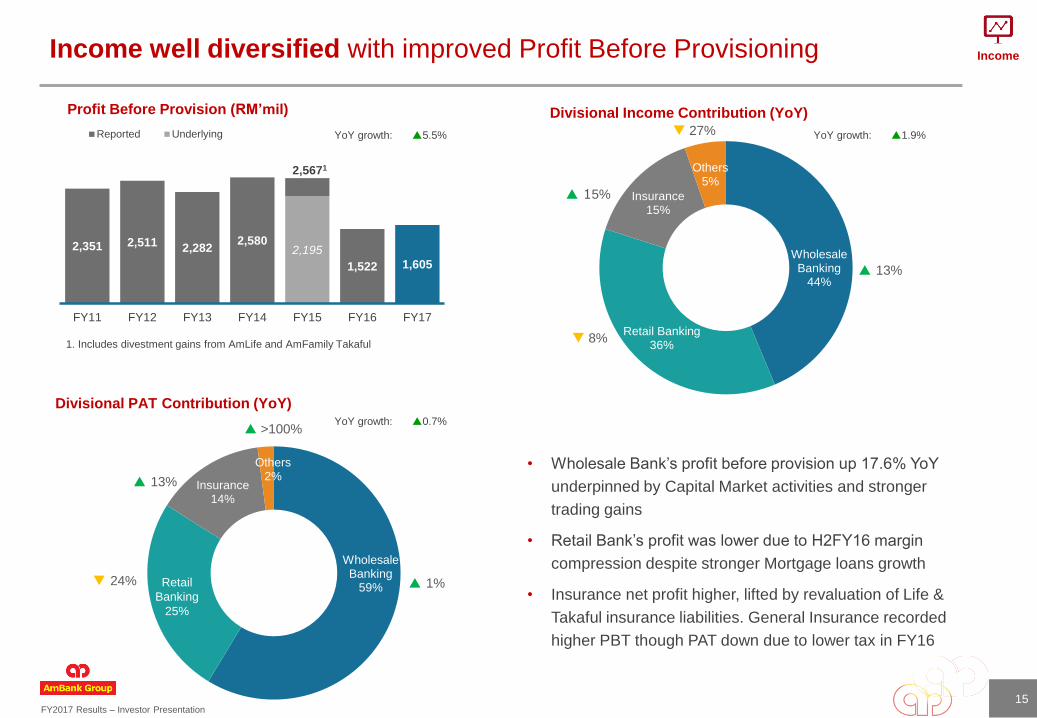
Income well diversified with improved Profit Before Provisioning
15
2,351 2,511 2,2822,580
2,195
1,522 1,605
FY11 FY12 FY13 FY14 FY15 FY16 FY17
Reported Underlying
2,5671
• Wholesale Bank’s profit before provision up 17.6% YoY
underpinned by Capital Market activities and stronger
trading gains
• Retail Bank’s profit was lower due to H2FY16 margin
compression despite stronger Mortgage loans growth
• Insurance net profit higher, lifted by revaluation of Life &
Takaful insurance liabilities. General Insurance recorded
higher PBT though PAT down due to lower tax in FY16
1. Includes divestment gains from AmLife and AmFamily Takaful
Profit Before Provision (RM’mil)
Divisional PAT Contribution (YoY)
Divisional Income Contribution (YoY)
Income
13%
1% 24%
>100%
15%
13%
27%
8%
YoY growth: 5.5%
YoY growth: 0.7%
YoY growth: 1.9%
Retail
Banking
25%

FY2017 Results – Investor Presentation
Financial
Overview
1,317.0
1,473.4 28.4
34.7
128.7 10.9 67.7
8.3
17.1 26.8 61.8
FY16 Investment Bank Markets Fund Mgmt Corp & CommBanking
WealthManagement
Cards Other Retail Insurance Others FY17
202 198
1.0 4.1
2.4
4.7 1.9
FY16 Portfolio Rebalancing Wholesale Retail Deposit Rates Deposit Mix FY17
Stronger non-interest income, offset by H2FY16 margin compression
16
Income
Non-interest Income Drivers
RM’mil
YoY growth 18% 28% 6% 73% 28% 13% 29% 19% 54% 12%
Composition 13% 11% 8% 21% 3% 8% 4% 28% 4%
Net Interest Margin Movement Margin compression due to roll-off of higher yield legacy Retail loans and deposit mix, alleviated by
increasing composition of SME loans and active COF management
Strong YoY growth with encouraging momentum last few quarters in sustainable fees (eg Wealth &
Banca), reflecting momentum on strategic agenda
Asset repricing Deposits
bps
4bps
FY2017 Results – Investor Presentation
Financial
Overview
616 616
581565 566
549578
599
2.12% 2.11%
1.93% 1.92% 1.94% 1.92%
2.02%2.06%
Q1FY16 Q2FY16 Q3FY16 Q4FY16 Q1FY17 Q2FY17 Q3FY17 Q4FY17
FY17 NIM : 1.98%FY16 NIM : 2.02%
Gross Yield
Industry Avg.
Lending Rate
Avg 1M
KLIBOR
COF
NIM
4.99%
5.34%
5.60%
5.35%
5.11%4.96%
2.69% 2.90%
3.08%
3.17%3.34%
3.27%
2.51%2.66%
2.75%
2.43%
2.02% 1.98%
4.88%4.75%
4.56% 4.63% 4.57% 4.54%
3.03% 3.06%
3.07%
3.27% 3.35%
3.15%
FY12 FY13 FY14 FY15 FY16 FY17
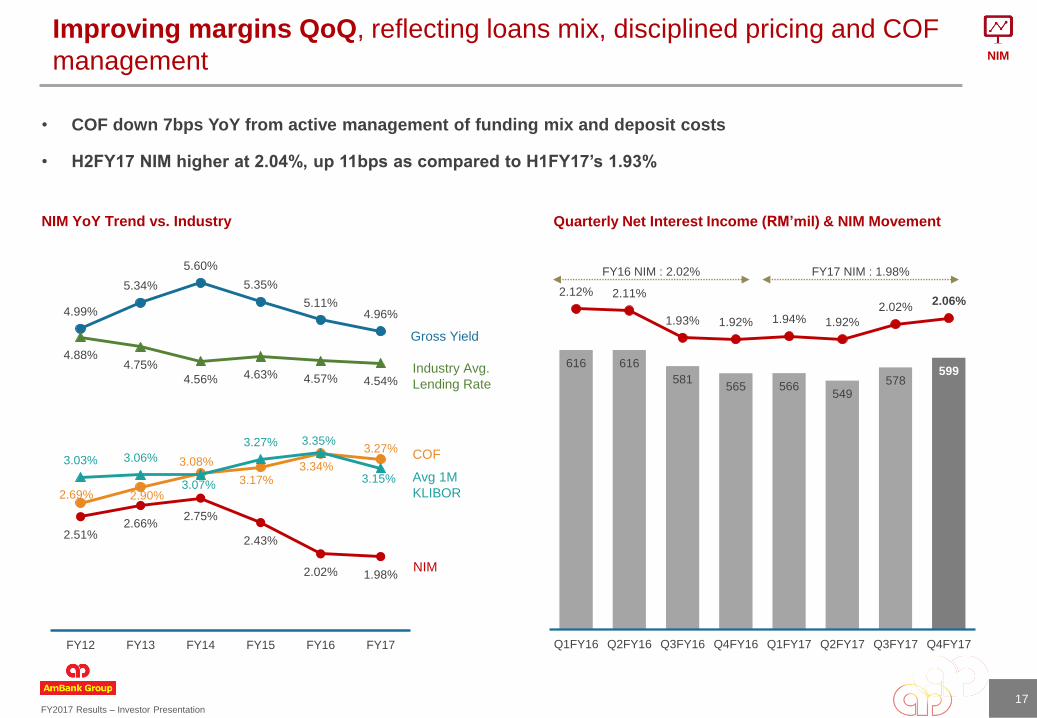
Improving margins QoQ, reflecting loans mix, disciplined pricing and COF
management
Quarterly Net Interest Income (RM’mil) & NIM Movement
1717
NIM
NIM YoY Trend vs. Industry
• COF down 7bps YoY from active management of funding mix and deposit costs
• H2FY17 NIM higher at 2.04%, up 11bps as compared to H1FY17’s 1.93%

FY2017 Results – Investor Presentation
Financial
Overview
2,174.3
2,120.6
2,158.3 2,162.8
2,205.9
2,160.5 2,160.5
37.7
4.543.1
34.2
53.7
79.6
FY16 reported Regulatory Penalty YTD FY16underlying
Realignment ofRewards Scheme
Regulatory FY17pre-investment
Productivity &Growth
Governance &Compliance
Cost Savings &Efficiencies
FY17 reported
Expense growth contained through cost saving initiatives
As we move into FY18/19, focus will intensify on productivity and efficiency
18
CTI ratio:
FY17: 57.4%
FY16: 58.8%
Expenses:
YoY: 0.6% (Reported)Expense Growth Driver (RM’ mil)
Growth6%
Productivity21%
Infrastructure57%
Compliance16%
Capex: RM97 mil
Opex: RM36 mil
• Personnel
(RM34.9m)
• Productivity
(RM7.2m)
• Growth
(RM1.0m)
Expenses
Realignment
of Rewards
Scheme
Efficiency Indicators YoY Change
Total income per employee (RM’000) 4.5%
Total cost per employee (RM’000) 1.9%
Customer deposit per employee (RM’mil) 6.8%
Gross loans per employee (RM’mil) 6.2%
Planned projects & investments spend in FY17
FY2017 Results – Investor Presentation
Financial
Overview
AmBank
Peers
-0.50%
0.00%
0.50%
1.00%
Mar-08 Mar-09 Mar-10 Mar-11 Mar-12 Mar-13 Mar-14 Mar-15 Mar-16 Mar-17
(209.5) (196.1)
113.1
25.0
(8.0)
(116.7)
FY16 Individual
Allowance
Collective
Allowance
Recoveries Others FY17
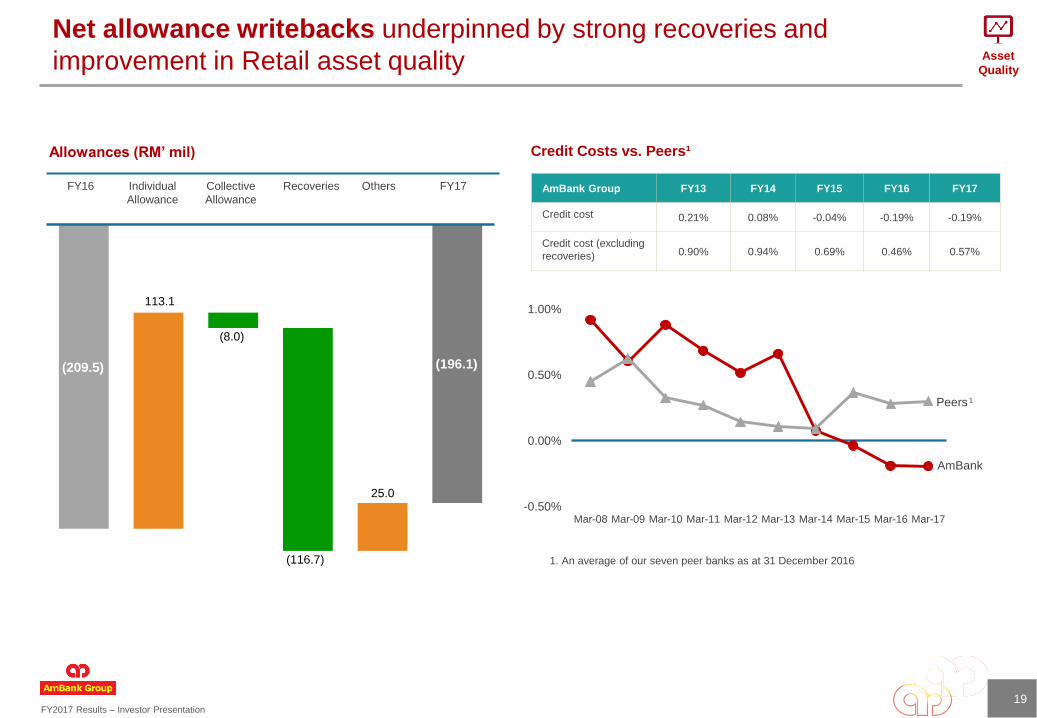
Allowances (RM’ mil)
AmBank Group FY13 FY14 FY15 FY16 FY17
Credit cost 0.21% 0.08% -0.04% -0.19% -0.19%
Credit cost (excluding
recoveries) 0.90% 0.94% 0.69% 0.46% 0.57%
1. An average of our seven peer banks as at 31 December 2016
19
Asset
Quality
Credit Costs vs. Peers¹
¹
Net allowance writebacks underpinned by strong recoveries and
improvement in Retail asset quality

FY2017 Results – Investor Presentation
Financial
Overview
Strong ~ Very
Strong71%
Satisfactory ~ Moderate
20%
Marginal ~ Substandard
2%
Impaired7%
Strong ~ Very
Strong51%Satisfactory ~
Moderate34%
Marginal ~ Substandard
7%
Impaired8%
1,680.5 1,662.11,572.7
1,700.9 1,689.3
1.98%1.86% 1.79%
1.94% 1.86%
FY13 FY14 FY15 FY16 FY17
Gross Impaired Loans GIL Ratio
Gross Impaired Loans Ratios Exposure to Oil & Gas Sector by Internal Risk Grades
20
Asset
Quality
• With focus on preferred segments, Retail GIL ratio continues to improve with active collection and preemptive efforts
• Loans exposure to Oil & Gas and Commercial Real Estate Sectors reduced 24% and 10% YoY respectively
Total loans to
Commercial Real Estate
sector:
Approximately 9% of
total gross loans
Exposure to Commercial Real Estate Sector by Internal Risk Grades
Total loans to O&G
sector:
Approximately 2% of
total gross loans
GIL Ratio Q1FY17 Q2FY17 Q3FY17 Q4FY17
Group 1.69% 1.64% 1.54% 1.86%
RB 1.52% 1.53% 1.44% 1.33%
WB 1.89% 1.75% 1.64% 2.46%
GIL Ratio QoQ Breakdown
Retail asset quality continues to improve, whilst Wholesale impacted by
impairments in Q4

FY2017 Results – Investor Presentation
Financial
Overview
87.9
91.0 0.2
1.2
4.3
0.1 0.1 0.2
1.3
1.7
FY16 Large Corp Mid Corp SME Mortgage Auto Fin Cards Retail SME Others FY17
Loans growth reflecting focus on “new” targeted segments
21
Gross Loans Movement Represented by Business (RM’bil)
YoY growth 6% 2% 10% 21% 8% 8% 12% 8% 3.5%
Composition 22% 9% 14% 28% 22% 2% 1% 2%
YoY increase of 3.5% supported by good momentum in Retail and Wholesale SME
LD
Ratio:
85.7%
ROA:
1.09%
Breakdown by rate sensitivity:
Fixed rate – 31%
Variable rate – 69%
Breakdown by concept:
Islamic – 30%
Conventional – 70%
Breakdown by customers type:
Retail – 53%
Non-retail – 47%
Wholesale 1.5% Retail 5.4%
Loans
FY2017 Results – Investor Presentation
Financial
Overview
4.4%
4.9%
4.3%4.2%
4.3%
Mar 16 Jun 16 Sep 16 Dec 16 Mar 17
Industry CASA AmBank Grp Mkt Share
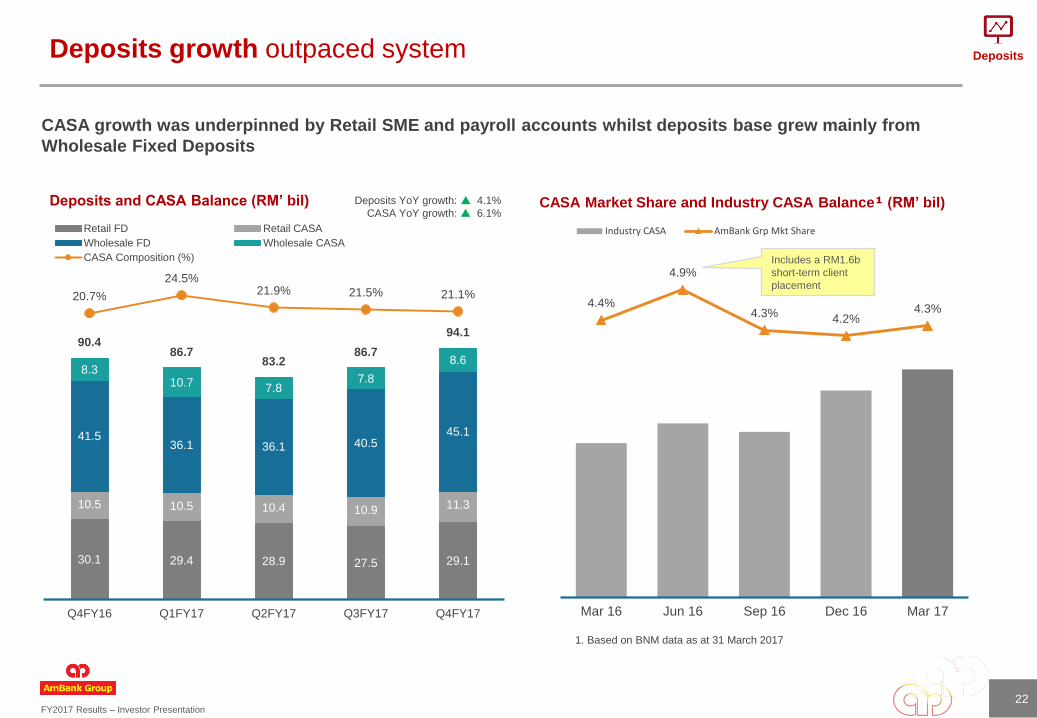
Deposits growth outpaced system
Deposits and CASA Balance (RM’ bil)
22
CASA growth was underpinned by Retail SME and payroll accounts whilst deposits base grew mainly from
Wholesale Fixed Deposits
30.1 29.4 28.9 27.5 29.1
10.5 10.5 10.4 10.9 11.3
41.536.1 36.1 40.5
45.1
8.310.7 7.8
7.8
8.6
90.486.7
83.286.7
94.1
20.7%
24.5%21.9% 21.5% 21.1%
Q4FY16 Q1FY17 Q2FY17 Q3FY17 Q4FY17
Retail FD Retail CASA
Wholesale FD Wholesale CASA
CASA Composition (%)
CASA Market Share and Industry CASA Balance¹ (RM’ bil)
1. Based on BNM data as at 31 March 2017
Includes a RM1.6b
short-term client
placement
Deposits
Deposits YoY growth: 4.1%
CASA YoY growth: 6.1%

FY2017 Results – Investor Presentation
Financial
Overview
127.6 132.7 133.8 133.8 134.8
72.7% 72.8% 71.5% 71.2% 72.2%
60.8% 62.4% 61.1% 59.6% 60.2%
FY13 FY14 FY15 FY16 FY17
Total Assets RWA/Total Assets Peers
10.33%
11.02%10.62%
132bps
1 bps 10 bps23 bps16 bps 3 bps
32 bps40 bps
FY16 Profitfor
FY17
Transfer toReg
Reserve
InterimDividend
Paid
Others Credit RWA MarketRWA
OperationalRWA
FY17Before
Dividend
ProposedFinal
Dividend
FHC FY17
Capital levels positioned for growth with headroom for efficiency
9.3% 9.7% 10.5% 11.3% 11.6%
11.0% 11.1%11.8%
12.3% 12.5%14.8% 15.4% 15.8% 16.1% 16.3%
FY13 FY14 FY15 FY16 FY17
CET 1 Tier 1 RWCAR/Total CAR
Capital Adequacy Ratios²RWA/Total Assets
Dividend Payout
RM’ bil
7.0 7.2
12.0
5.0 5.0
15.0 16.9
15.3
10.5 12.6
41% 41%43%
36%40%
FY13 FY14 FY15 FY16 FY17
Interim Dividend (sen) Final Dividend (sen) Dividend Payout (%)
Capital
• Group capital ratios remain adequate, whilst we are progressively
optimising capital structure and RWA efficiency for Basel III FHC @
FY2020
• Positioning for MFRS 9 and impact assessment in progress
• Basel III FHC indicative ratio as at 31 March 2017 – CET 1: 10.6%
23
Basel III
FHC
indicative
ratio Mar-17
CET 1:
10.6%
Leverage
ratio: 10.4%
Double
leverage
ratio: 1.12x
1. An average of our seven peer banks as at 31 December 2016
1
2. Based on Aggregated Banking Entities net of proposed dividend
Financial Holding Company Indicative Ratio
3
3. Proposed final dividend
FY2017 Results – Investor Presentation
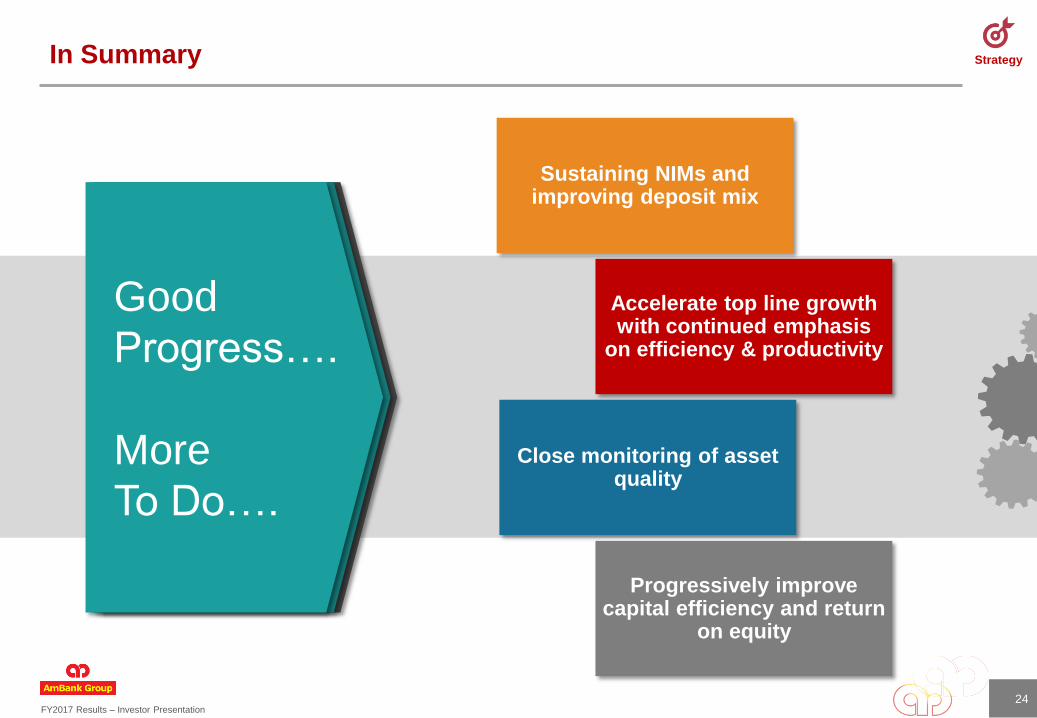
StrategyIn Summary
24
Sustaining NIMs and improving deposit mix
Accelerate top line growth with continued emphasis
on efficiency & productivity
Close monitoring of asset quality
Progressively improve capital efficiency and return
on equity
Good
Progress….
More
To Do….
FY2017 Results – Investor Presentation
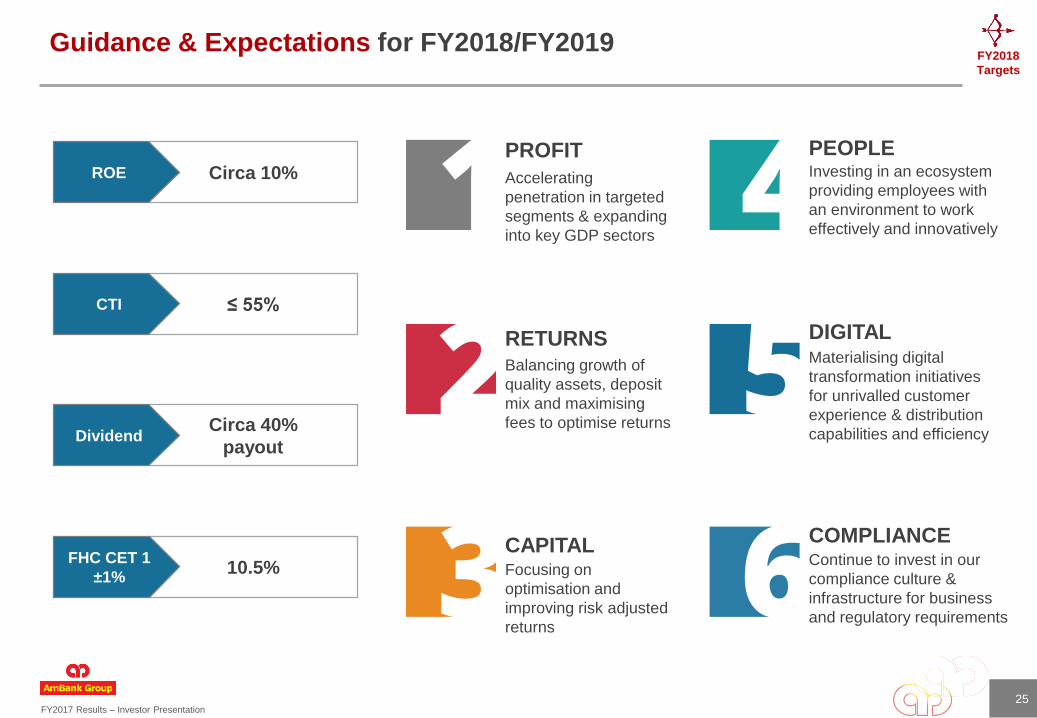
FY2018
Targets
10.5%
Circa 40%
payout
≤ 55%
Circa 10%
Guidance & Expectations for FY2018/FY2019
ROE
CTI
Dividend
FHC CET 1
±1%
PROFIT
Accelerating
penetration in targeted
segments & expanding
into key GDP sectors
RETURNSBalancing growth of
quality assets, deposit
mix and maximising
fees to optimise returns
CAPITALFocusing on
optimisation and
improving risk adjusted
returns
DIGITALMaterialising digital
transformation initiatives
for unrivalled customer
experience & distribution
capabilities and efficiency
COMPLIANCEContinue to invest in our
compliance culture &
infrastructure for business
and regulatory requirements
PEOPLEInvesting in an ecosystem
providing employees with
an environment to work
effectively and innovatively
25
FY2017 Results – Investor Presentation
FY2018-2020Strategy
26
FY2017 Results – Investor Presentation
Strategy
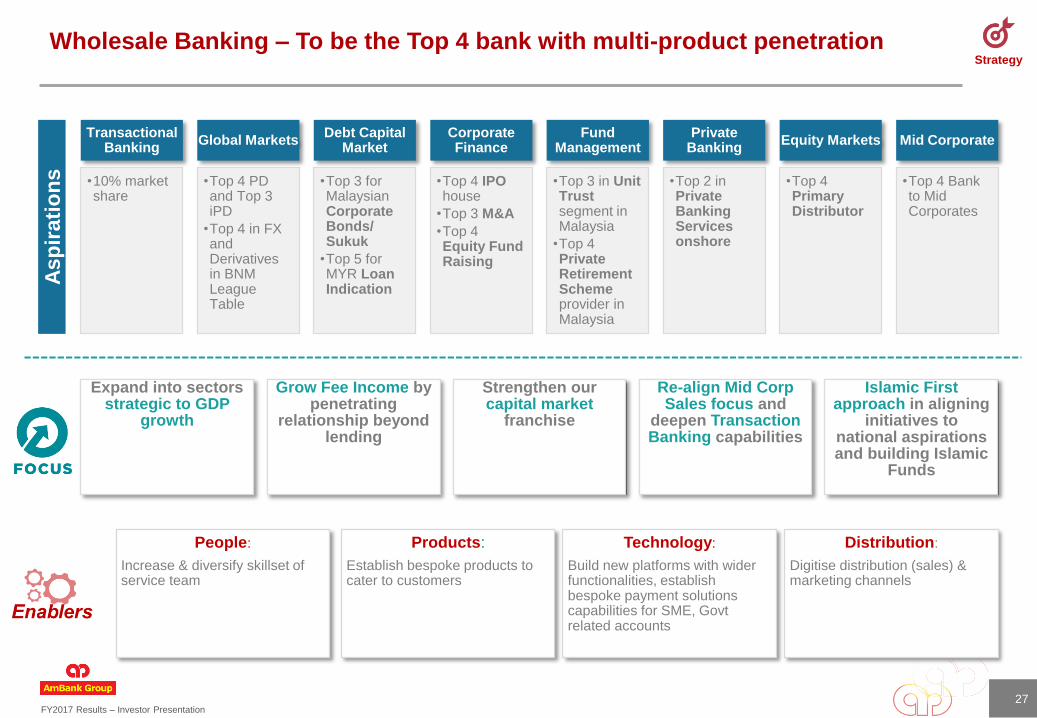
Wholesale Banking – To be the Top 4 bank with multi-product penetration
27
Transactional Banking
•10% market share
Global Markets
•Top 4 PD and Top 3 iPD
•Top 4 in FX and Derivatives in BNM League Table
Debt Capital Market
•Top 3 for Malaysian Corporate Bonds/ Sukuk
•Top 5 for MYR Loan Indication
Corporate Finance
•Top 4 IPO house
•Top 3 M&A
•Top 4 Equity Fund Raising
Fund Management
•Top 3 in Unit Trust segment in Malaysia
•Top 4 Private Retirement Scheme provider in Malaysia
Private Banking
•Top 2 in Private Banking Services onshore
Equity Markets
•Top 4 Primary Distributor
Mid Corporate
•Top 4 Bank to Mid Corporates
Expand into sectors strategic to GDP
growth
Grow Fee Income by penetrating
relationship beyond lending
Strengthen our capital market
franchise
Re-align Mid Corp Sales focus and
deepen Transaction Banking capabilities
Islamic First approach in aligning
initiatives to national aspirations and building Islamic
Funds
People:
Increase & diversify skillset of service team
Products:
Establish bespoke products to cater to customers
Technology:
Build new platforms with wider functionalities, establish bespoke payment solutions capabilities for SME, Govt related accounts
Distribution:
Digitise distribution (sales) & marketing channels
Asp
irati
on
s
FY2017 Results – Investor Presentation
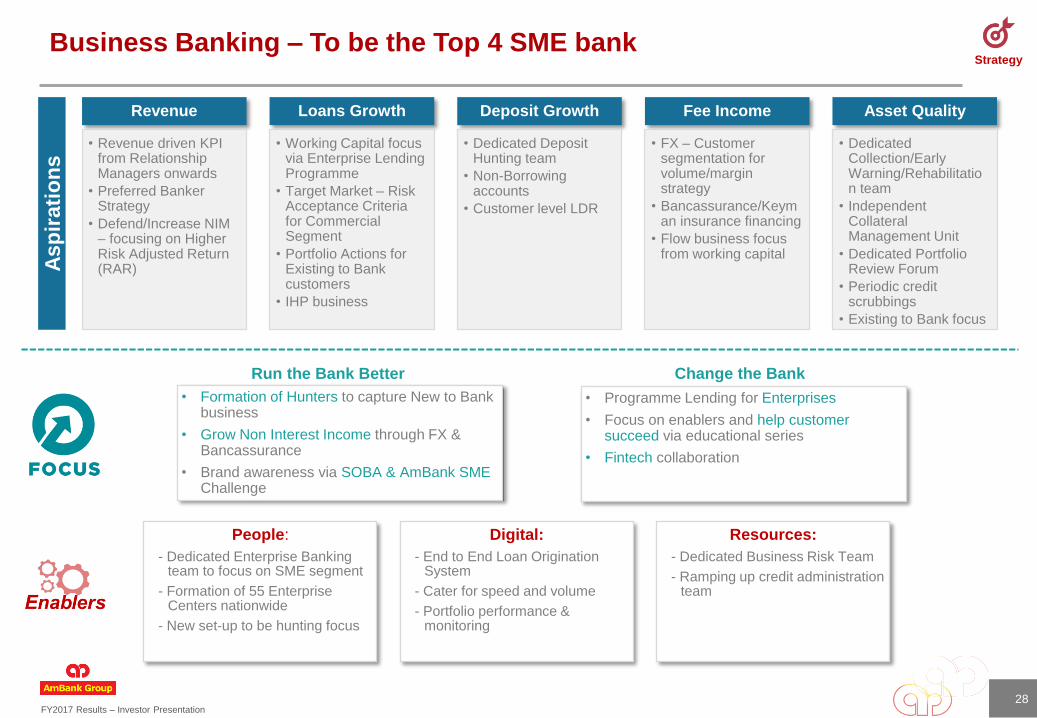
StrategyBusiness Banking – To be the Top 4 SME bank
28
Revenue
• Revenue driven KPI from Relationship Managers onwards
• Preferred Banker Strategy
• Defend/Increase NIM – focusing on Higher Risk Adjusted Return (RAR)
Loans Growth
• Working Capital focus via Enterprise Lending Programme
• Target Market – Risk Acceptance Criteria for Commercial Segment
• Portfolio Actions for Existing to Bank customers
• IHP business
Deposit Growth
• Dedicated Deposit Hunting team
• Non-Borrowing accounts
• Customer level LDR
Fee Income
• FX – Customer segmentation for volume/margin strategy
• Bancassurance/Keyman insurance financing
• Flow business focus from working capital
Asset Quality
• Dedicated Collection/Early Warning/Rehabilitation team
• Independent Collateral Management Unit
• Dedicated Portfolio Review Forum
• Periodic credit scrubbings
• Existing to Bank focus
People:
- Dedicated Enterprise Banking team to focus on SME segment
- Formation of 55 Enterprise Centers nationwide
- New set-up to be hunting focus
Digital:
- End to End Loan Origination System
- Cater for speed and volume
- Portfolio performance & monitoring
Resources:
- Dedicated Business Risk Team
- Ramping up credit administration team
Asp
irati
on
s
• Formation of Hunters to capture New to Bank business
• Grow Non Interest Income through FX & Bancassurance
• Brand awareness via SOBA & AmBank SME Challenge
• Programme Lending for Enterprises
• Focus on enablers and help customer succeed via educational series
• Fintech collaboration
Run the Bank Better Change the Bank
FY2017 Results – Investor Presentation
Strategy
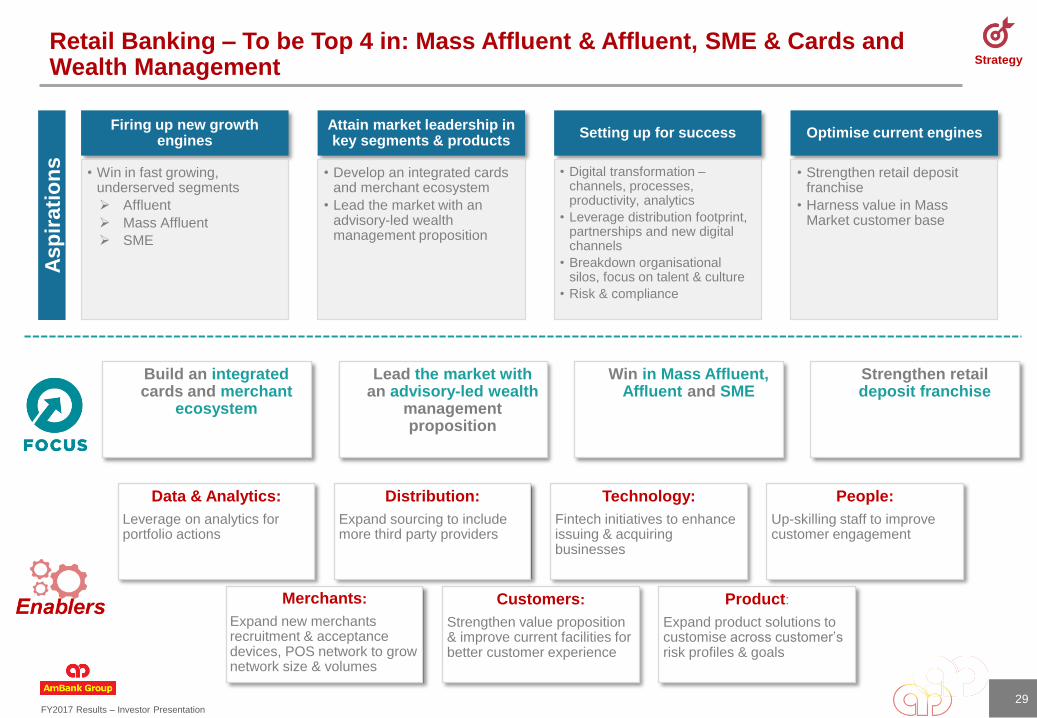
Retail Banking – To be Top 4 in: Mass Affluent & Affluent, SME & Cards and Wealth Management
29
Firing up new growth engines
• Win in fast growing, underserved segments
Affluent
Mass Affluent
SME
Attain market leadership in key segments & products
• Develop an integrated cards and merchant ecosystem
• Lead the market with an advisory-led wealth management proposition
Setting up for success
• Digital transformation –channels, processes, productivity, analytics
• Leverage distribution footprint, partnerships and new digital channels
• Breakdown organisationalsilos, focus on talent & culture
• Risk & compliance
Optimise current engines
• Strengthen retail deposit franchise
• Harness value in Mass Market customer base
Build an integratedcards and merchant
ecosystem
Lead the market with an advisory-led wealth
management proposition
Win in Mass Affluent, Affluent and SME
Strengthen retail deposit franchise
Data & Analytics:
Leverage on analytics for portfolio actions
Distribution:
Expand sourcing to include more third party providers
Technology:
Fintech initiatives to enhance issuing & acquiring businesses
People:
Up-skilling staff to improve customer engagement
Merchants:
Expand new merchants recruitment & acceptance devices, POS network to grow network size & volumes
Customers:
Strengthen value proposition & improve current facilities for better customer experience
Product:
Expand product solutions to customise across customer’s risk profiles & goals
Asp
irati
on
s

FY2017 Results – Investor Presentation
StrategyIslamic Banking – To be the Top 4 Islamic bank
30
Revenue
• Drive revenue increase via focused areas
• Increase composition of non-funded income
Financing
• Grow financing base in selected segments (e.g. SME)
Margin
• Improve net financing margin via cost of funds reduction and grow profitable assets
Liquidity/deposits
• Diversify depositor base
• Grow low cost deposits
Grow low cost and retail deposits and
auto financing
Push ASB financing Diversify income via fee-based income from wealth, bancatakaful, remittances & cards
Intensify SME and Mid Corp clients via
transaction banking solutions, FX, vendor
and contract financing
Niche market segments (e.g. Halal players, religious bodies,
affordable housing, Government sector)
People:
• Islamic banking knowledge of the distribution channels
• Talent to drive new business areas
Technology:
• New AmOnline and mobile banking platforms
• Upgraded cash management
• Digital credit process
• Front-end Straight-Through-processing
Pricing:
• Pricing of financing driven by cross-sell and non-funded income
• Simplified pricing matrix
Product:
• Invoice Financing-i
• Factoring-i
• Foreign currency current account-i
Asp
irati
on
s
FY2017 Results – Investor Presentation
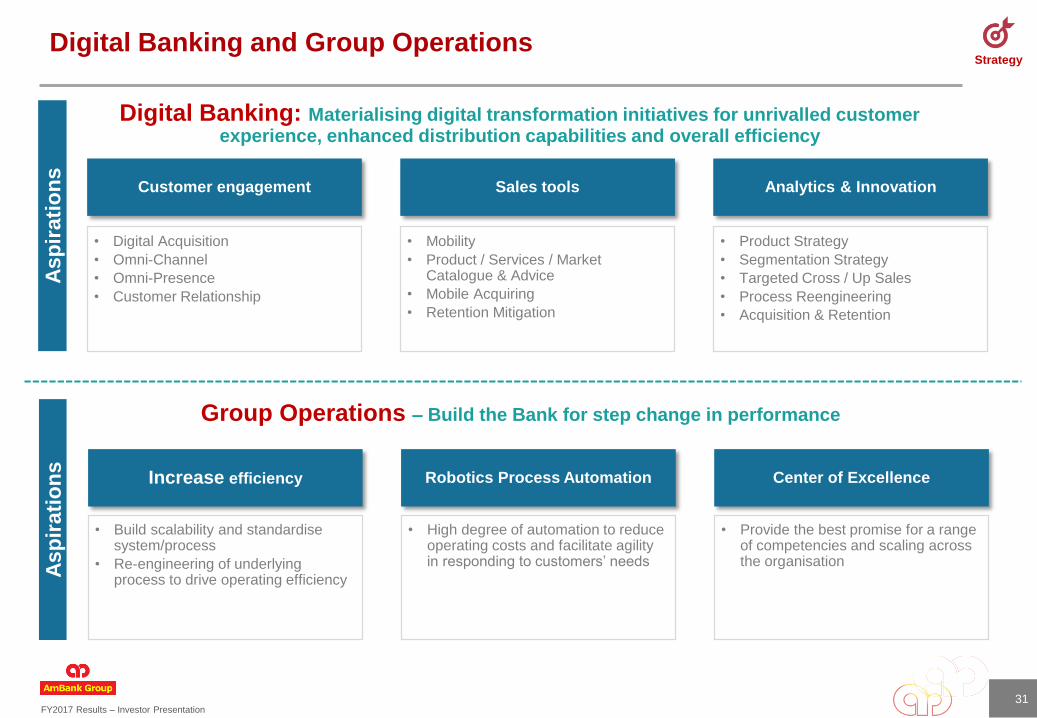
StrategyDigital Banking and Group Operations
Digital Banking: Materialising digital transformation initiatives for unrivalled customer experience, enhanced distribution capabilities and overall efficiency
31
Customer engagement
• Digital Acquisition
• Omni-Channel
• Omni-Presence
• Customer Relationship
Sales tools
• Mobility
• Product / Services / Market Catalogue & Advice
• Mobile Acquiring
• Retention Mitigation
Analytics & Innovation
• Product Strategy
• Segmentation Strategy
• Targeted Cross / Up Sales
• Process Reengineering
• Acquisition & Retention
Asp
irati
on
s
Group Operations – Build the Bank for step change in performance
Increase efficiency
• Build scalability and standardisesystem/process
• Re-engineering of underlying process to drive operating efficiency
Robotics Process Automation
• High degree of automation to reduce operating costs and facilitate agility in responding to customers’ needs
Center of Excellence
• Provide the best promise for a range of competencies and scaling across the organisation
Asp
irati
on
s
FY2017 Results – Investor Presentation
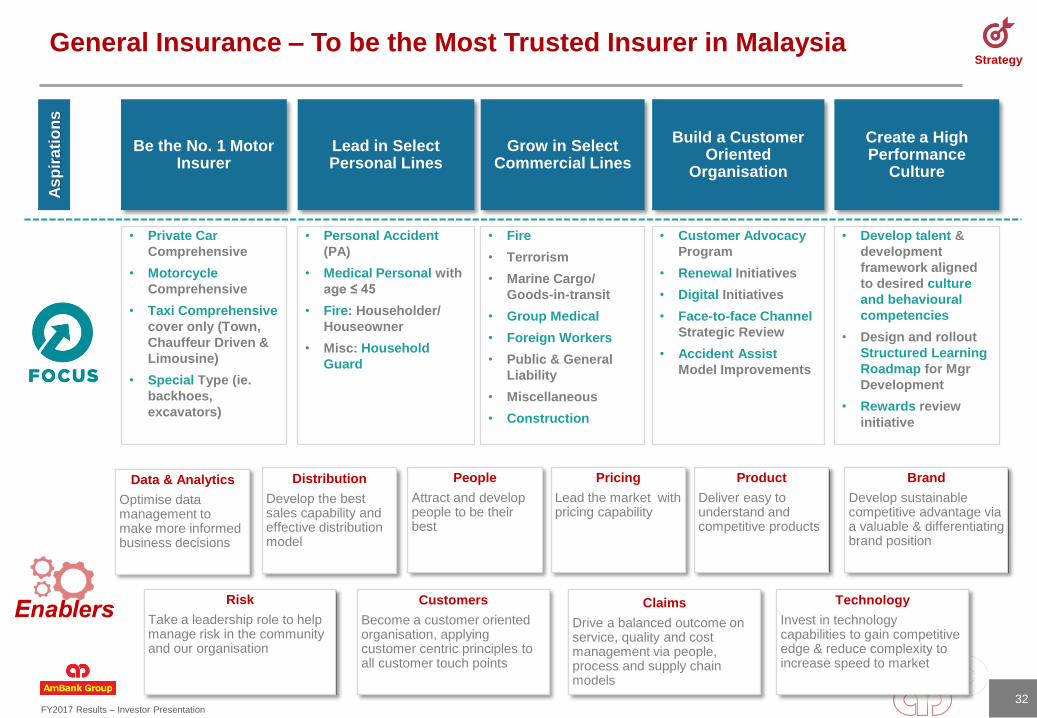
StrategyGeneral Insurance – To be the Most Trusted Insurer in Malaysia
32
Be the No. 1 Motor Insurer
Lead in Select Personal Lines
Grow in Select Commercial Lines
Build a Customer Oriented
Organisation
Create a High Performance
Culture
Data & Analytics
Optimise data management to make more informed business decisions
Distribution
Develop the best sales capability and effective distribution model
People
Attract and develop people to be their best
Pricing
Lead the market with pricing capability
Product
Deliver easy to understand and competitive products
Brand
Develop sustainable competitive advantage via a valuable & differentiating brand position
Risk
Take a leadership role to help manage risk in the community and our organisation
Customers
Become a customer oriented organisation, applying customer centric principles to all customer touch points
Claims
Drive a balanced outcome on service, quality and cost management via people, process and supply chain models
Technology
Invest in technology capabilities to gain competitive edge & reduce complexity to increase speed to market
As
pir
ati
on
s
• Private Car
Comprehensive
• Motorcycle
Comprehensive
• Taxi Comprehensive
cover only (Town,
Chauffeur Driven &
Limousine)
• Special Type (ie.
backhoes,
excavators)
• Personal Accident
(PA)
• Medical Personal with
age ≤ 45
• Fire: Householder/
Houseowner
• Misc: Household
Guard
• Fire
• Terrorism
• Marine Cargo/
Goods-in-transit
• Group Medical
• Foreign Workers
• Public & General
Liability
• Miscellaneous
• Construction
• Customer Advocacy
Program
• Renewal Initiatives
• Digital Initiatives
• Face-to-face Channel
Strategic Review
• Accident Assist
Model Improvements
• Develop talent &
development
framework aligned
to desired culture
and behavioural
competencies
• Design and rollout
Structured Learning
Roadmap for Mgr
Development
• Rewards review
initiative

FY2017 Results – Investor Presentation
StrategyLife Assurance and Takaful
Life Assurance: Focusing on customer-centricity, AmMetLife wants to be the preferred life insurer of choice for all Malaysians
33
Optimise value and risk
• Optimise unit cost acquisition with focus on Agency, Bancassurance & EB channels
Drive operational excellence
• Invest in system capabilities to automate processes and build self-service eSolutions
Deliver the right solutions for the right
customers
• Innovative products and solutions to meet protection needs of customers during different life stages
Strengthen distribution advantage
• Digital solutions for professional agency forces and bancassurancespecialists
• Gain EB market share through service delivery differentiation
Asp
irati
on
s
Takaful: Deliver engaging customer and partner experiences that create competitive advantage and drive value
eChannel (direct)
• To build an Online Straight Through process under ‘Live Digital Project’
• On-line Takaful term plan
• Unique proposition to provide ‘Warm Lead’ to the intermediaries
Agency
• Organic growth for existing Agency Force
• Hybrid Agency Force i.e. leveraging with AmMetLife Insurance Agency Force
Bancatakaful
• Distribution via Takaful Specialist, Personal Banker/Wealth Specialist
• Muslim centric product for bank customers
Asp
irati
on
s

FY2017 Results – Investor Presentation
StrategyPeople and Culture – To be the Top 4 Employer of Choice
Elevating the way we work
• Technology Enabled workforce
• Connected Access -anytime/ anywhere
• Create a flexible workplace
• Self productivity driven
• Performance Driven
Leadership &
Team Building
• Leadership Bonding
• Strategic Business Unit/ workforce bonding
• Understanding our plans and the need for change
• Regular Engagement
Managing Change
• Scheduled Communications & Messaging
• Strategic Change Management
• Tactical Change Management
• Channels and Cascade Network
Inculcating performance driven culture
• Culture Alignment - What & Why
• Enforcement - How
• Living the Plan
Leadershipalignment
Capabilitybuilding
Peopleprocesses
Changechampions
Viralnetworks
Key behaviours
Role based development
Talent management Organisation & KPI alignment
Culture
Asp
irati
on
s
Formal change programme elements Informal change programme elements
34
FY2017 Results – Investor Presentation
Group Performance
35

FY2017 Results – Investor Presentation
47.8% 45.6% 45.7%
58.8% 57.4%
16.5%
3.6%-0.2% 0.8% -0.6%
FY13 FY14 FY15 FY16 FY17
CTI% Expenses Growth%
4,379 4,7434,263
3,696 3,766
31%34%
41%36% 39%
FY13 FY14 FY15 FY16 FY17
Total income (Reported)Total income (Underlying)Non-interest income %
CAGR FY13-17: 3.7%
YoY growth: 1.9%
1,621 1,782
1,639 1,302 1,325
13.9% 14.1% 13.8%
8.8% 8.5%
FY13 FY14 FY15 FY16 FY17
PATMI (Reported)
PATMI (Underlying)
ROE (%)
1,919
54.0 59.3 63.8
43.3 44.1
1.37%1.45% 1.60%
1.05% 1.09%
FY13 FY14 FY15 FY16 FY17
EPS ROA
Yearly Performance
PATMI (RM’ mil) & ROE (%) Cost to Income Ratio and Expenses Growth (%)
Total Income (RM’ mil) and Non-interest Income (%) ROA (%) and EPS (Basic)
ROE:
CAGR FY13-17: 1.4%
YoY Growth: 0.3%
PATMI:
CAGR FY13-17: 4.9%
YoY Growth: 1.7%
EPS:
CAGR FY13-17: 5.0%
YoY growth: 1.8%
4,725
ROA:
CAGR FY13-17: 0.07%
YoY growth: 0.04%
CTI:
CAGR FY13-17:2.4%
YoY growth: 1.4%
Expenses:
CAGR FY13-17: 4.3%
36
FY17
Results
FY2017 Results – Investor Presentation
Investment Bank13%
Markets11%
Fund Mgmt8%
Corp & Comm Banking
21%Wealth
Management3%
Cards8%
Other Retail4%
Insurance28%
Others4%
WB53%
RB15%
Insurance & Others32%
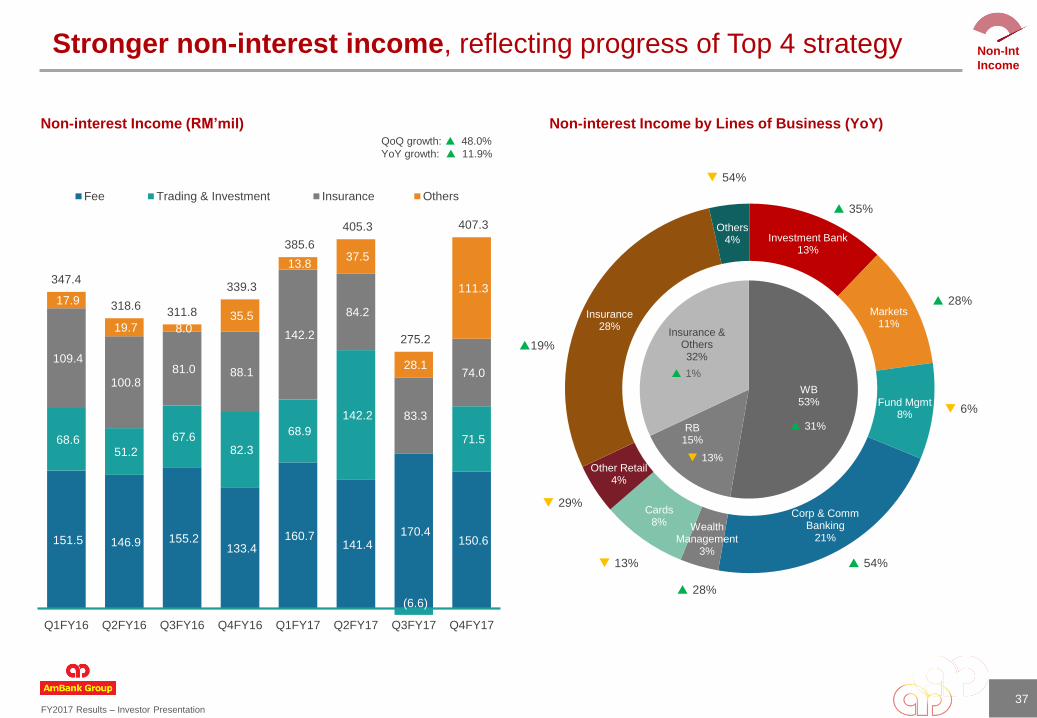
Stronger non-interest income, reflecting progress of Top 4 strategy
54%
28%
19%
35%
6%
QoQ growth: 48.0%
YoY growth: 11.9%
28%
1%
13%
31%
Non-interest Income by Lines of Business (YoY)Non-interest Income (RM’mil)
151.5 146.9 155.2 133.4
160.7 141.4
170.4 150.6
68.6 51.2
67.6 82.3
68.9
142.2
(6.6)
71.5
109.4
100.8 81.0 88.1
142.2
84.2
83.3
74.0
17.9
19.7 8.0 35.5
13.8 37.5
28.1
111.3 347.4
318.6 311.8
339.3
385.6
405.3
275.2
407.3
Q1FY16 Q2FY16 Q3FY16 Q4FY16 Q1FY17 Q2FY17 Q3FY17 Q4FY17
Fee Trading & Investment Insurance Others
54% 13%
29%
37
Non-Int
Income
FY2017 Results – Investor Presentation
1.95%
1.91%
1.74%
1.68%
1.52% 1.52%
1.44% Retail 1.33%
1.63%
2.00%
1.86%
2.22%
1.90%
1.76%
1.64%
Wholesale 2.46%
1.81%
1.96%
1.81%
1.94%
1.69%1.64%
1.54%
Group 1.86%
1.62% 1.62% 1.60% 1.60%1.66% 1.65%
1.61%
Industry, 1.63%
Q1FY16 Q2FY16 Q3FY16 Q4FY16 Q1FY17 Q2FY17 Q3FY17 Q4FY17
38
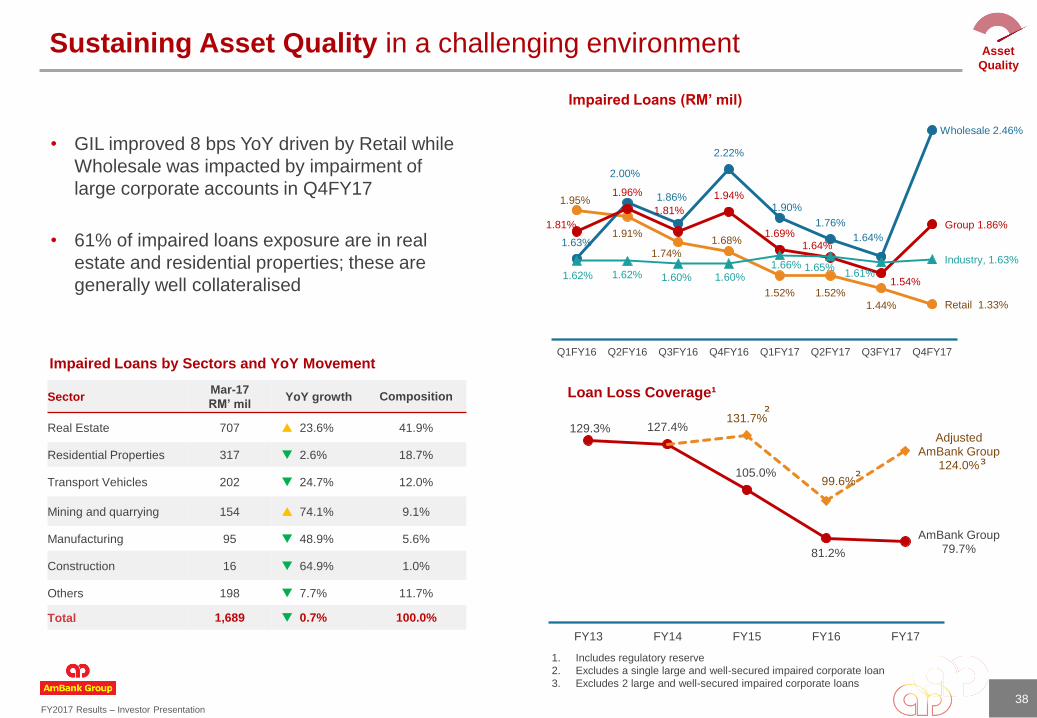
Sustaining Asset Quality in a challenging environment
Impaired Loans (RM’ mil)
Impaired Loans by Sectors and YoY Movement
1. Includes regulatory reserve
2. Excludes a single large and well-secured impaired corporate loan
3. Excludes 2 large and well-secured impaired corporate loans
• GIL improved 8 bps YoY driven by Retail while
Wholesale was impacted by impairment of
large corporate accounts in Q4FY17
• 61% of impaired loans exposure are in real
estate and residential properties; these are
generally well collateralised
Asset
Quality
Loan Loss Coverage¹SectorMar-17
RM’ milYoY growth Composition
Real Estate 707 23.6% 41.9%
Residential Properties 317 2.6% 18.7%
Transport Vehicles 202 24.7% 12.0%
Mining and quarrying 154 74.1% 9.1%
Manufacturing 95 48.9% 5.6%
Construction 16 64.9% 1.0%
Others 198 7.7% 11.7%
Total 1,689 0.7% 100.0%
129.3% 127.4%
105.0%
81.2%
AmBank Group79.7%
131.7%
99.6%
Adjusted AmBank Group
124.0%
FY13 FY14 FY15 FY16 FY17
³²
²

FY2017 Results – Investor Presentation
-74.2 -74.8 -278.1 -276.4-211.3
753.4872.2 834.6
650.7 714.0
-565.9-748.5
-624.4-565.0
-681.7
30.0
83.3
30.4
-18.8 -17.1
143.3 132.2 -37.5 -209.5 -196.1
FY13 FY14 FY15 FY16 FY17
Performing Loans Non-Performing Loans Recoveries Others
288
639
215
271
203
438
167
254207
418
89
148
Defaulted Assets Non-defaulted Assets Model RiskAdjustment
Macro Adjustment
FY15 FY16 FY17
39
Provision Charges/(Writebacks)1 (RM’ mil)Impaired Loans – Key Segments
Collective Allowance Balance (RM’ mil)
FY17 Total: RM 862 mil
FY16 Total: RM 1,062 mil
FY15 Total: RM 1,413 mil
2.4%
3.1%
2.8%
0.8%
1.7%
2.2%2.0%
1.6%
1.3%
1.8%1.7%
2.2%
1.0%
1.5%1.3%
2.5%
Auto Finance Mortgage Retail Wholesale Banking
FY14 FY15 FY16 FY17
Asset Quality Asset
Quality
1. Includes provision for contingencies, securities, foreclosed property, trade and
sundry debtors
FY2017 Results – Investor Presentation
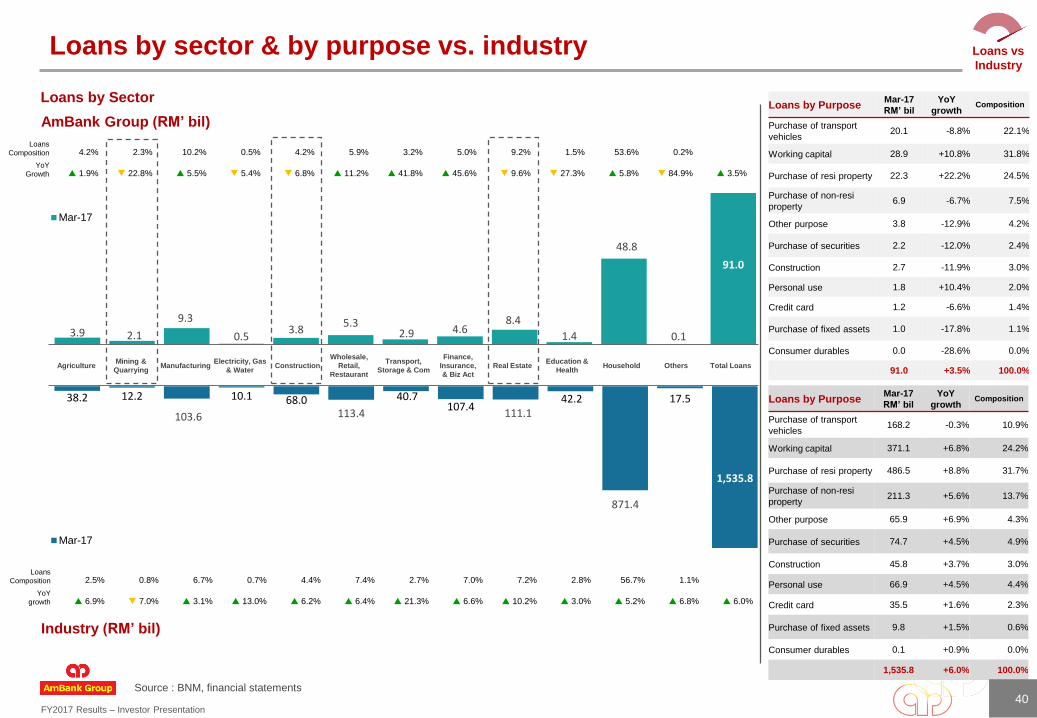
38.2 12.2
103.6
10.1 68.0113.4
40.7107.4
111.142.2
871.4
17.5
1,535.8
Mar-17
3.9 2.1
9.3
0.53.8
5.32.9 4.6
8.4
1.4
48.8
0.1
91.0
Mar-17
Loans by PurposeMar-17
RM’ bil
YoY
growthComposition
Purchase of transport
vehicles20.1 -8.8% 22.1%
Working capital 28.9 +10.8% 31.8%
Purchase of resi property 22.3 +22.2% 24.5%
Purchase of non-resi
property6.9 -6.7% 7.5%
Other purpose 3.8 -12.9% 4.2%
Purchase of securities 2.2 -12.0% 2.4%
Construction 2.7 -11.9% 3.0%
Personal use 1.8 +10.4% 2.0%
Credit card 1.2 -6.6% 1.4%
Purchase of fixed assets 1.0 -17.8% 1.1%
Consumer durables 0.0 -28.6% 0.0%
91.0 +3.5% 100.0%
Source : BNM, financial statements
Loans by sector & by purpose vs. industry
Loans by PurposeMar-17
RM’ bil
YoY
growthComposition
Purchase of transport
vehicles168.2 -0.3% 10.9%
Working capital 371.1 +6.8% 24.2%
Purchase of resi property 486.5 +8.8% 31.7%
Purchase of non-resi
property211.3 +5.6% 13.7%
Other purpose 65.9 +6.9% 4.3%
Purchase of securities 74.7 +4.5% 4.9%
Construction 45.8 +3.7% 3.0%
Personal use 66.9 +4.5% 4.4%
Credit card 35.5 +1.6% 2.3%
Purchase of fixed assets 9.8 +1.5% 0.6%
Consumer durables 0.1 +0.9% 0.0%
1,535.8 +6.0% 100.0%
Industry (RM’ bil)
AgricultureMining &
QuarryingManufacturing
Electricity, Gas
& WaterConstruction
Wholesale,
Retail,
Restaurant
Transport,
Storage & Com
Finance,
Insurance,
& Biz Act
Real EstateEducation &
HealthHousehold Others Total Loans
Loans by Sector
40
Loans vs
Industry
Loans
Composition 2.5% 0.8% 6.7% 0.7% 4.4% 7.4% 2.7% 7.0% 7.2% 2.8% 56.7% 1.1%
YoY
growth 6.9% 7.0% 3.1% 13.0% 6.2% 6.4% 21.3% 6.6% 10.2% 3.0% 5.2% 6.8% 6.0%
YoY
Growth 1.9% 22.8% 5.5% 5.4% 6.8% 11.2% 41.8% 45.6% 9.6% 27.3% 5.8% 84.9% 3.5%
AmBank Group (RM’ bil)
Loans
Composition 4.2% 2.3% 10.2% 0.5% 4.2% 5.9% 3.2% 5.0% 9.2% 1.5% 53.6% 0.2%
FY2017 Results – Investor Presentation
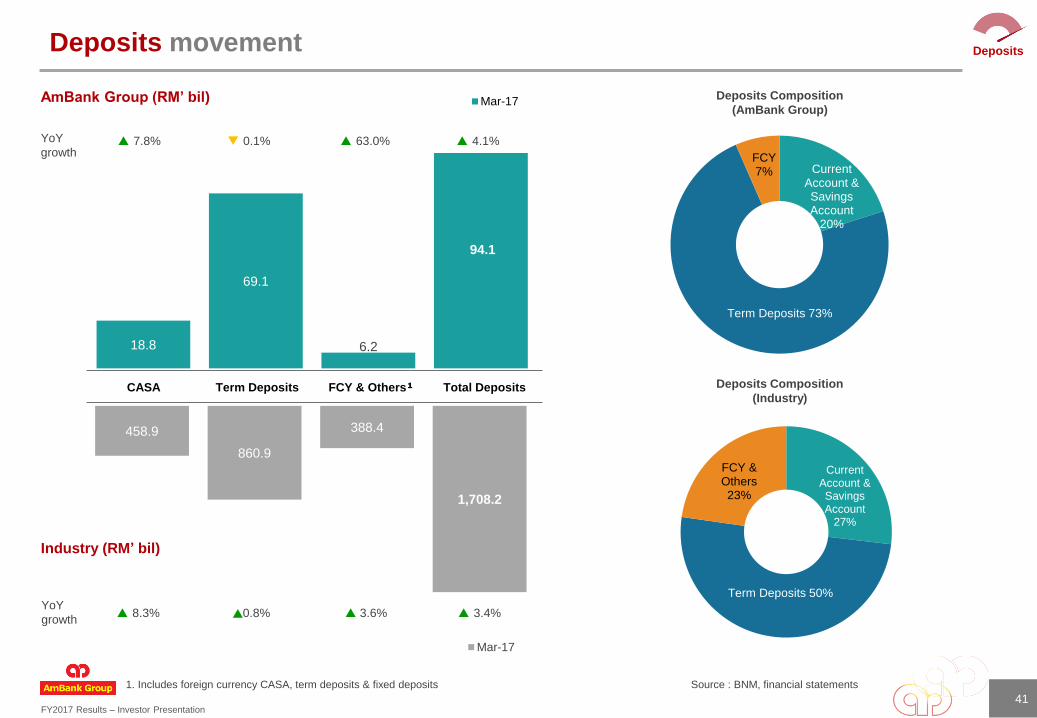
458.9
860.9
388.4
1,708.2
Mar-17
8.3% 0.8% 3.6% 3.4%
Current Account & Savings Account
20%
Term Deposits 73%
FCY7%
18.8
69.1
6.2
94.1
CASA Term Deposits FCY & Others Total Deposits
Mar-17
7.8% 0.1% 63.0% 4.1%
Deposits movement
AmBank Group (RM’ bil)
CASA Term Deposits FCY & Others¹ Total Deposits
Industry (RM’ bil)
Deposits Composition
(AmBank Group)
Deposits Composition
(Industry)
YoY
growth
YoY
growth
Current Account & Savings Account
27%
Term Deposits 50%
FCY & Others 23%
41
Deposits
1. Includes foreign currency CASA, term deposits & fixed deposits Source : BNM, financial statements
FY2017 Results – Investor Presentation
99.6%
98.0% 97.6%
94.0%
95.8%
93.4%
89.8%88.8%
88.1%
83.8%84.7%
85.7%
FY12 FY13 FY14 FY15 FY16 FY17
LDR Adjusted LDR
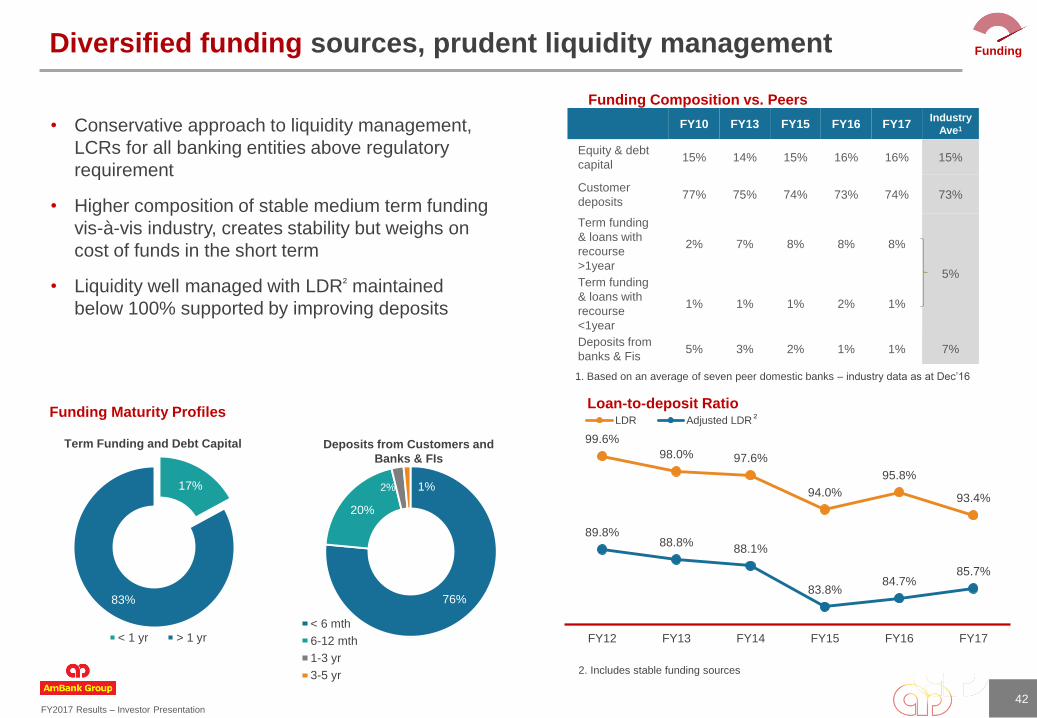
FY10 FY13 FY15 FY16 FY17Industry
Ave1
Equity & debt
capital15% 14% 15% 16% 16% 15%
Customer
deposits77% 75% 74% 73% 74% 73%
Term funding
& loans with
recourse
>1year
2% 7% 8% 8% 8%
5%Term funding
& loans with
recourse
<1year
1% 1% 1% 2% 1%
Deposits from
banks & Fis5% 3% 2% 1% 1% 7%
Diversified funding sources, prudent liquidity management
• Conservative approach to liquidity management,
LCRs for all banking entities above regulatory
requirement
• Higher composition of stable medium term funding
vis-à-vis industry, creates stability but weighs on
cost of funds in the short term
• Liquidity well managed with LDR² maintained
below 100% supported by improving deposits
Funding Composition vs. Peers
Funding Maturity ProfilesLoan-to-deposit Ratio
76%
20%
2% 1%
< 6 mth
6-12 mth
1-3 yr
3-5 yr
17%
83%
< 1 yr > 1 yr
Deposits from Customers and
Banks & FIs
Term Funding and Debt Capital
²
1. Based on an average of seven peer domestic banks – industry data as at Dec’16
42
2. Includes stable funding sources
Funding
FY2017 Results – Investor Presentation
Divisional Performance&
Economic and Banking Data
FY2017 Results – Investor Presentation
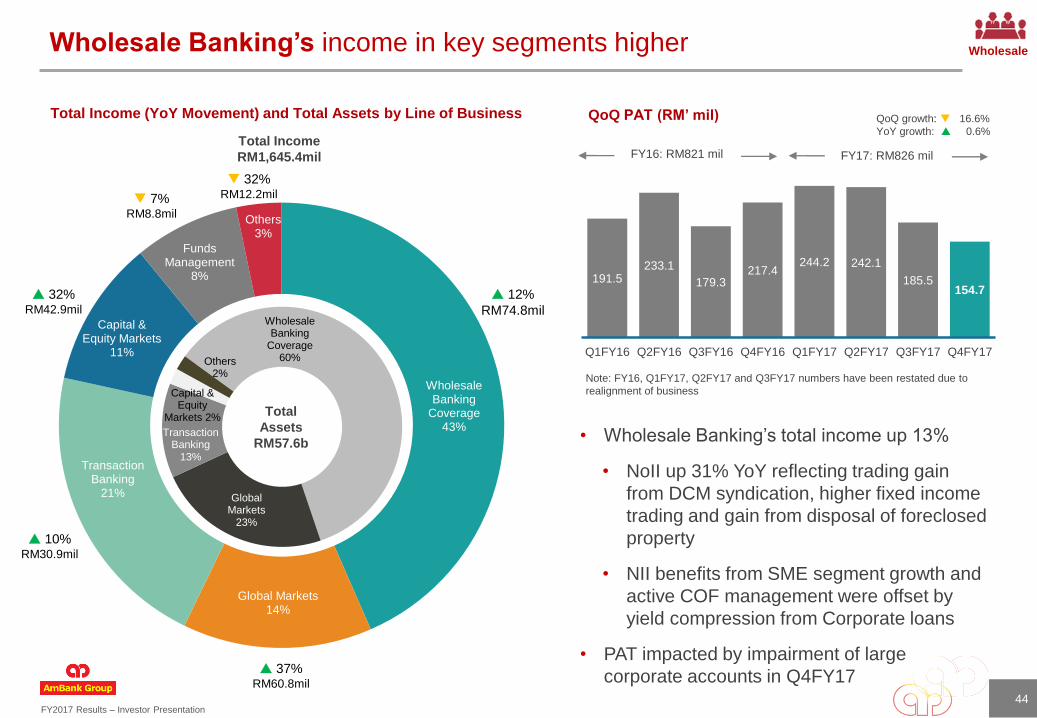
Wholesale Banking’s income in key segments higher
44
Total Income (YoY Movement) and Total Assets by Line of Business QoQ PAT (RM’ mil)
Wholesale Banking
Coverage43%
Global Markets14%
Transaction Banking
21%
Capital & Equity Markets
11%
Funds Management
8%
Others3%
Wholesale Banking
Coverage60%
Global Markets
23%
Transaction Banking
13%
Capital & Equity
Markets 2%
Others2%
12%
RM74.8mil
37%RM60.8mil
7%RM8.8mil
10%RM30.9mil
32%RM42.9mil
32%RM12.2mil
Total
Assets
RM57.6b
Total Income
RM1,645.4mil
• Wholesale Banking’s total income up 13%
• NoII up 31% YoY reflecting trading gain
from DCM syndication, higher fixed income
trading and gain from disposal of foreclosed
property
• NII benefits from SME segment growth and
active COF management were offset by
yield compression from Corporate loans
• PAT impacted by impairment of large
corporate accounts in Q4FY17
191.5233.1
179.3217.4
244.2 242.1
185.5154.7
Q1FY16 Q2FY16 Q3FY16 Q4FY16 Q1FY17 Q2FY17 Q3FY17 Q4FY17
FY16: RM821 mil FY17: RM826 mil
Note: FY16, Q1FY17, Q2FY17 and Q3FY17 numbers have been restated due to
realignment of business
QoQ growth: 16.6%
YoY growth: 0.6%
Wholesale
FY2017 Results – Investor Presentation
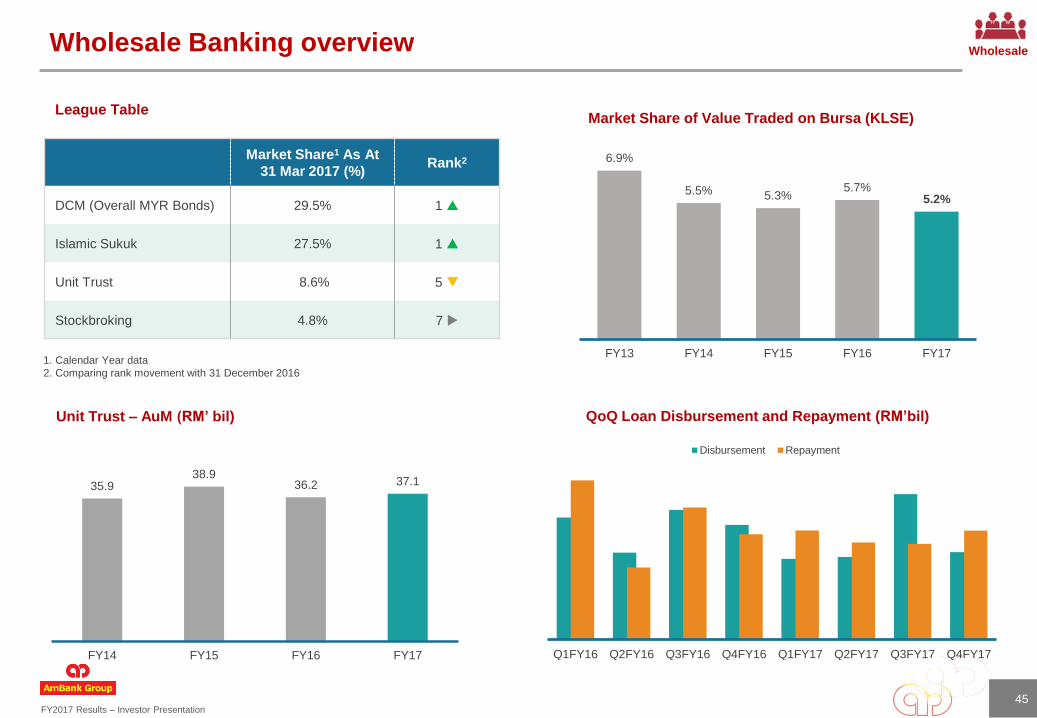
35.938.9
36.2 37.1
FY14 FY15 FY16 FY17
Market Share1 As At
31 Mar 2017 (%)Rank2
DCM (Overall MYR Bonds) 29.5% 1
Islamic Sukuk 27.5% 1
Unit Trust 8.6% 5
Stockbroking 4.8% 7
45
Market Share of Value Traded on Bursa (KLSE)League Table
QoQ Loan Disbursement and Repayment (RM’bil)
1. Calendar Year data
2. Comparing rank movement with 31 December 2016
Q1FY16 Q2FY16 Q3FY16 Q4FY16 Q1FY17 Q2FY17 Q3FY17 Q4FY17
Disbursement Repayment
Unit Trust – AuM (RM’ bil)
6.9%
5.5% 5.3%5.7%
5.2%
FY13 FY14 FY15 FY16 FY17
Wholesale Banking overview Wholesale
FY2017 Results – Investor Presentation
FY17 vs
FY16 FY17 FY16
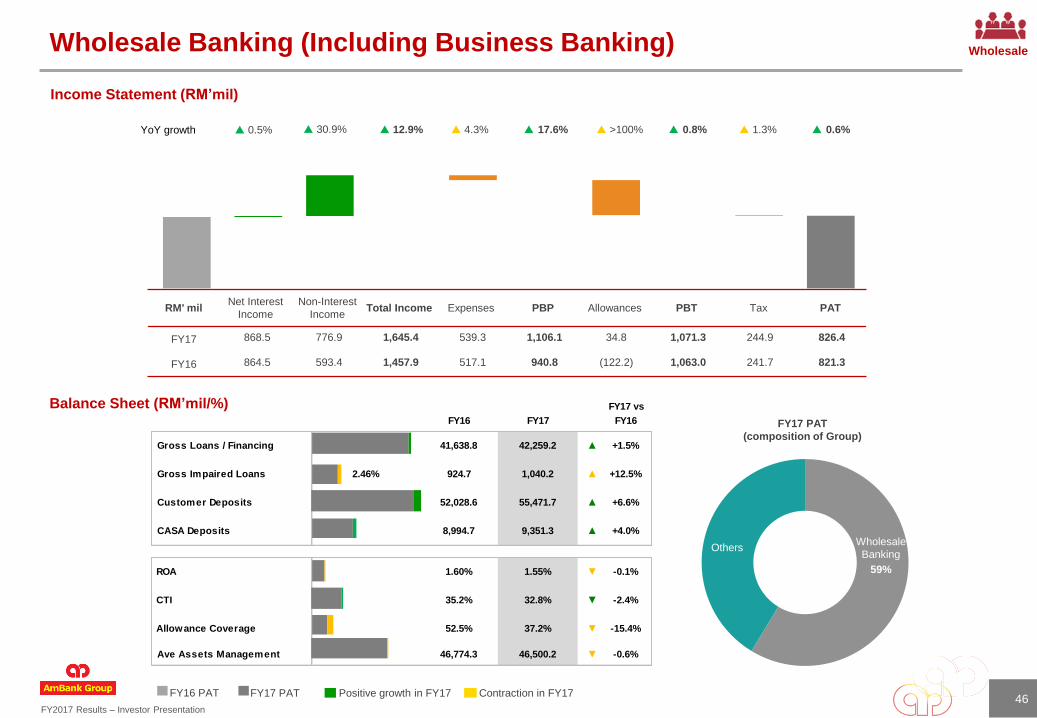
Gross Loans / Financing 41,638.8 42,259.2 ▲ +1.5%
Gross Impaired Loans 2.46% 924.7 1,040.2 ▲ +12.5%
Customer Deposits 52,028.6 55,471.7 ▲ +6.6%
CASA Deposits 8,994.7 9,351.3 ▲ +4.0%
ROA 1.60% 1.55% -▼ -0.1%
CTI 35.2% 32.8% -▼ -2.4%
Allowance Coverage 52.5% 37.2% -▼ -15.4%
Ave Assets Management 46,774.3 46,500.2 -▼ -0.6%
59%
12.9% 17.6% 4.3% >100% 0.8% 1.3% 0.6%YoY growth
FY17 PAT
(composition of Group)
Wholesale Banking (Including Business Banking)
Income Statement (RM’mil)
FY17 PATFY16 PAT Positive growth in FY17 Contraction in FY17
30.9% 0.5%
OthersWholesale
Banking
RM' milNet Interest
Income
Non-Interest
IncomeTotal Income Expenses PBP Allowances PBT Tax PAT
FY17 868.5 776.9 1,645.4 539.3 1,106.1 34.8 1,071.3 244.9 826.4
FY16 864.5 593.4 1,457.9 517.1 940.8 (122.2) 1,063.0 241.7 821.3
Balance Sheet (RM’mil/%)
46
Wholesale
FY2017 Results – Investor Presentation47
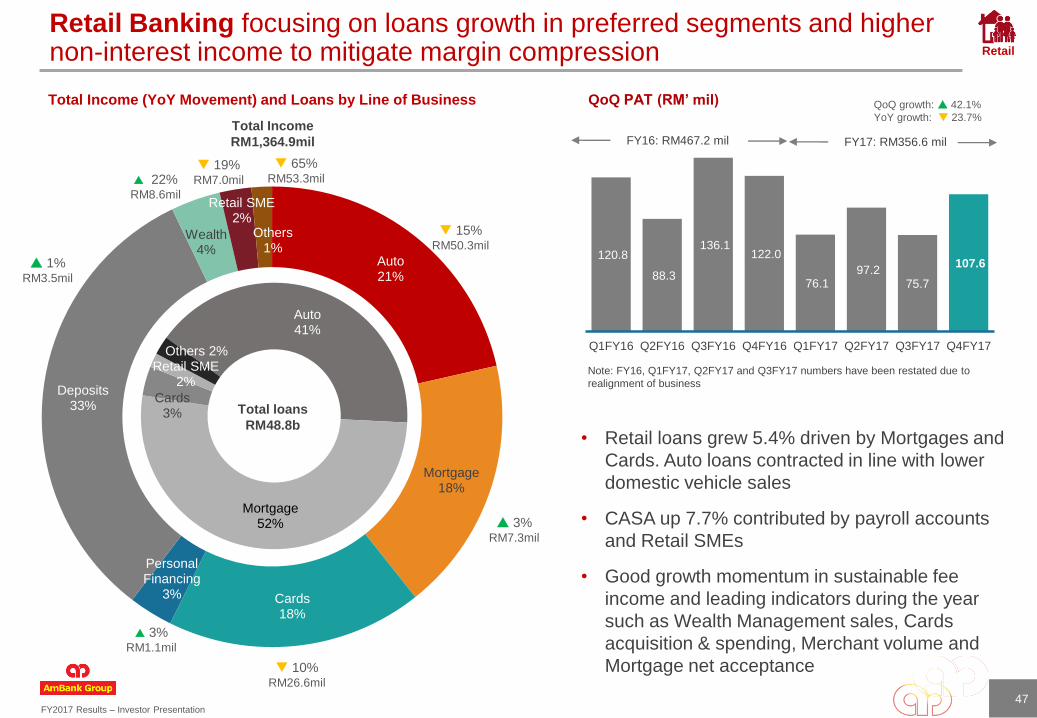
Retail Banking focusing on loans growth in preferred segments and higher non-interest income to mitigate margin compression
Total Income (YoY Movement) and Loans by Line of Business
Total Income
RM1,364.9mil
Auto21%
Mortgage18%
Cards18%
Personal Financing
3%
Deposits33%
Wealth4%
Retail SME2%
Others1%
Auto41%
Mortgage52%
Cards3%
Retail SME2%
Others 2%
Total loans
RM48.8b
10%RM26.6mil
1%RM3.5mil
3%RM1.1mil
19%RM7.0mil
15%RM50.3mil
3%RM7.3mil
22%RM8.6mil
65%RM53.3mil
• Retail loans grew 5.4% driven by Mortgages and
Cards. Auto loans contracted in line with lower
domestic vehicle sales
• CASA up 7.7% contributed by payroll accounts
and Retail SMEs
• Good growth momentum in sustainable fee
income and leading indicators during the year
such as Wealth Management sales, Cards
acquisition & spending, Merchant volume and
Mortgage net acceptance
QoQ PAT (RM’ mil)
120.8
88.3
136.1 122.0
76.1 97.2
75.7
107.6
Q1FY16 Q2FY16 Q3FY16 Q4FY16 Q1FY17 Q2FY17 Q3FY17 Q4FY17
QoQ growth: 42.1%
YoY growth: 23.7%
Note: FY16, Q1FY17, Q2FY17 and Q3FY17 numbers have been restated due to
realignment of business
FY16: RM467.2 mil FY17: RM356.6 mil
Retail
FY2017 Results – Investor Presentation
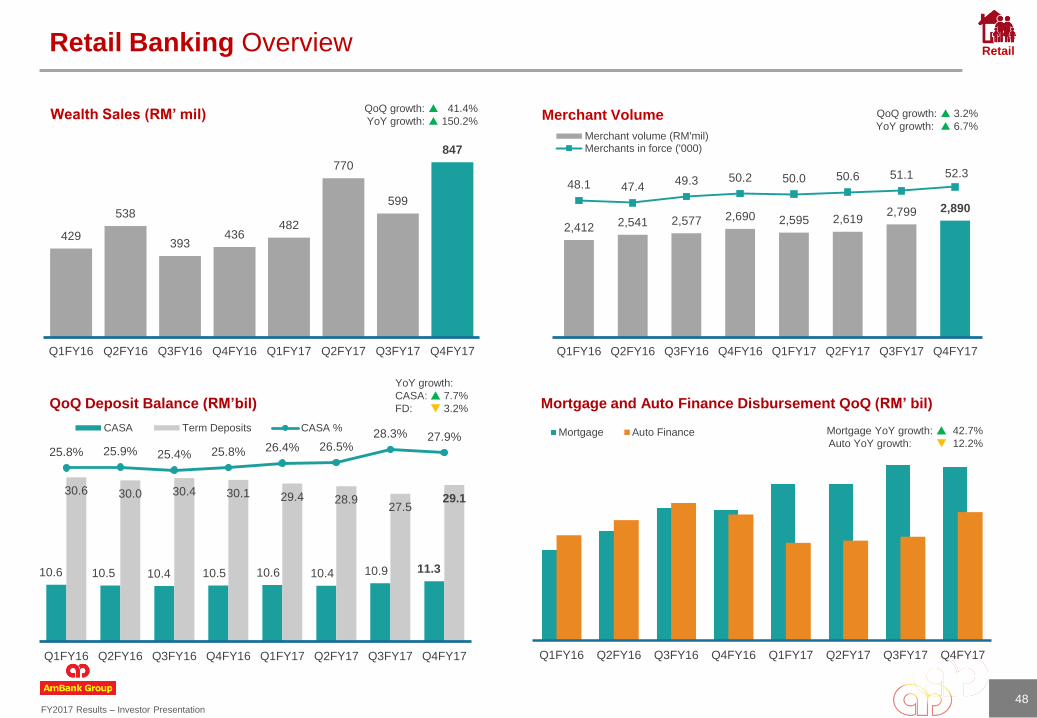
Retail Banking Overview
Merchant Volume
QoQ Deposit Balance (RM’bil) Mortgage and Auto Finance Disbursement QoQ (RM’ bil)
Q1FY16 Q2FY16 Q3FY16 Q4FY16 Q1FY17 Q2FY17 Q3FY17 Q4FY17
Mortgage Auto Finance
10.6 10.5 10.4 10.5 10.6 10.4 10.9 11.3
30.6 30.0 30.4 30.1 29.4 28.927.5
29.1
25.8% 25.9% 25.4% 25.8% 26.4% 26.5%28.3% 27.9%
Q1FY16 Q2FY16 Q3FY16 Q4FY16 Q1FY17 Q2FY17 Q3FY17 Q4FY17
CASA Term Deposits CASA % Mortgage YoY growth: 42.7%
Auto YoY growth: 12.2%
YoY growth:
CASA: 7.7%
FD: 3.2%
48
Wealth Sales (RM’ mil)
429
538
393436
482
770
599
847
Q1FY16 Q2FY16 Q3FY16 Q4FY16 Q1FY17 Q2FY17 Q3FY17 Q4FY17
2,412 2,541 2,577 2,690 2,595 2,6192,799 2,890
48.1 47.4 49.3 50.2 50.0 50.6 51.1 52.3
Q1FY16 Q2FY16 Q3FY16 Q4FY16 Q1FY17 Q2FY17 Q3FY17 Q4FY17
Merchant volume (RM'mil)Merchants in force ('000)
QoQ growth: 3.2%
YoY growth: 6.7%
Retail
QoQ growth: 41.4%
YoY growth: 150.2%
FY2017 Results – Investor Presentation
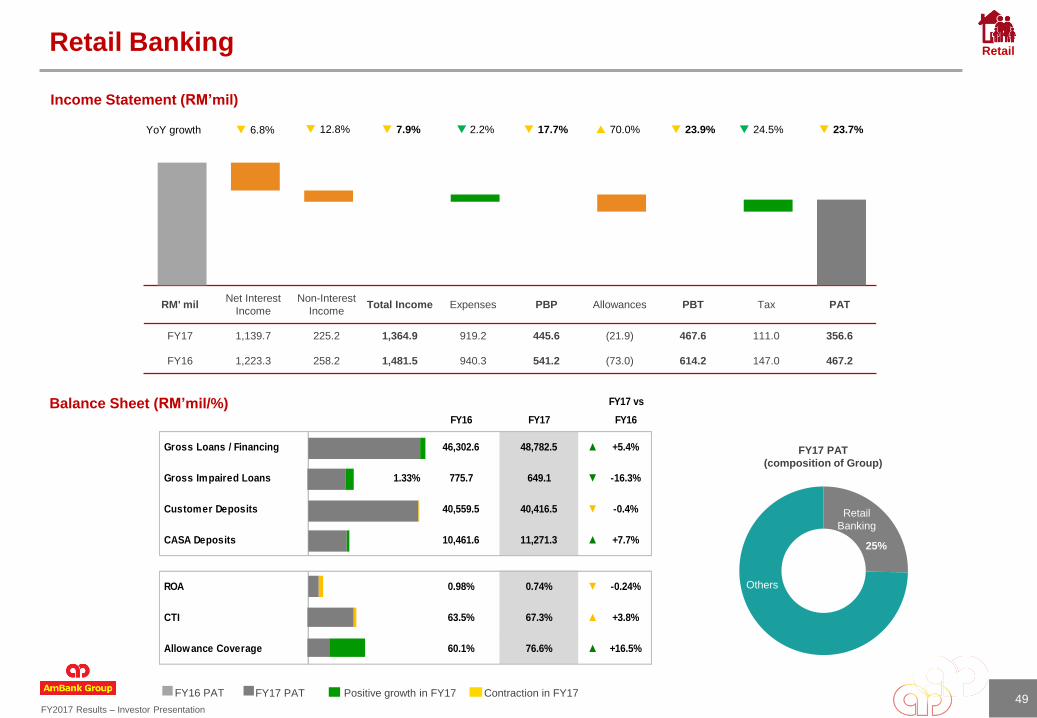
25%
49
Retail Banking
Income Statement (RM’mil)
Balance Sheet (RM’mil/%)
FY17 PAT
(composition of Group)
7.9% 2.2% 70.0% 23.9% 24.5% 23.7%YoY growth 12.8% 6.8%
Others
Retail
Banking
RM' milNet Interest
Income
Non-Interest
IncomeTotal Income Expenses PBP Allowances PBT Tax PAT
FY17 1,139.7 225.2 1,364.9 919.2 445.6 (21.9) 467.6 111.0 356.6
FY16 1,223.3 258.2 1,481.5 940.3 541.2 (73.0) 614.2 147.0 467.2
17.7%
FY17 PATFY16 PAT Positive growth in FY17 Contraction in FY17
FY17 vs
FY16 FY17 FY16
Gross Loans / Financing 46,302.6 48,782.5 ▲ +5.4%
Gross Impaired Loans 1.33% 775.7 649.1 -▼ -16.3%
Customer Deposits 40,559.5 40,416.5 -▼ -0.4%
CASA Deposits 10,461.6 11,271.3 ▲ +7.7%
ROA 0.98% 0.74% -▼ -0.24%
CTI 63.5% 67.3% ▲ +3.8%
Allowance Coverage 60.1% 76.6% ▲ +16.5%
Retail

FY2017 Results – Investor Presentation
Perlis
Kedah
PulauPinang
Perak
SarawakKuala Lumpur
Putrajaya
NegeriSembilan
Melaka Johor
Pahang
Selangor
Labuan
SabahTerengganu
Kelantan
Brunei Darussalam
Branches ATM Regional Offices
Perlis 1 3
Kedah 6 24 1
Pulau Pinang 14 51 1
Perak 18 45 1
Selangor 38 221 2
Kuala Lumpur 23 105 3
Putrajaya 1 3
Negeri Sembilan 7 38
Melaka 6 34 1
Johor 21 81 1
Pahang 9 29 1
Terengganu 4 16
Kelantan 2 16
Sabah 9 40 1
Labuan 1 3
Sarawak 15 57 1
175 766 13
Population Density: < 100 persons per km2 101 - 500 persons per km
501 - 1,000 persons per km2 1,001 - 1,500 persons per km2
>1,501 persons per km2
SME
branches
AmBank
Islamic
branches
Weekend
banking
branches
ATMs @ 7-
Eleven
Electronic
banking
centres
Internet &
mobile
banking
AmGeneral AmMetlifeAmInvestment
Bank
AmCard
Services
MBC2
175 (140 Cluster
Branches)
3 29 266 183AmOnline
AmGenie
29 branches
3 counters
15 branches
48 agencies
7 retail broking
6 corporate25
Retail Banking – Distribution channels
1. MBC – Merchant Business Centres
Other Customer Touch Points
Retail
50
FY2017 Results – Investor Presentation
Income Statement (RM’mil)
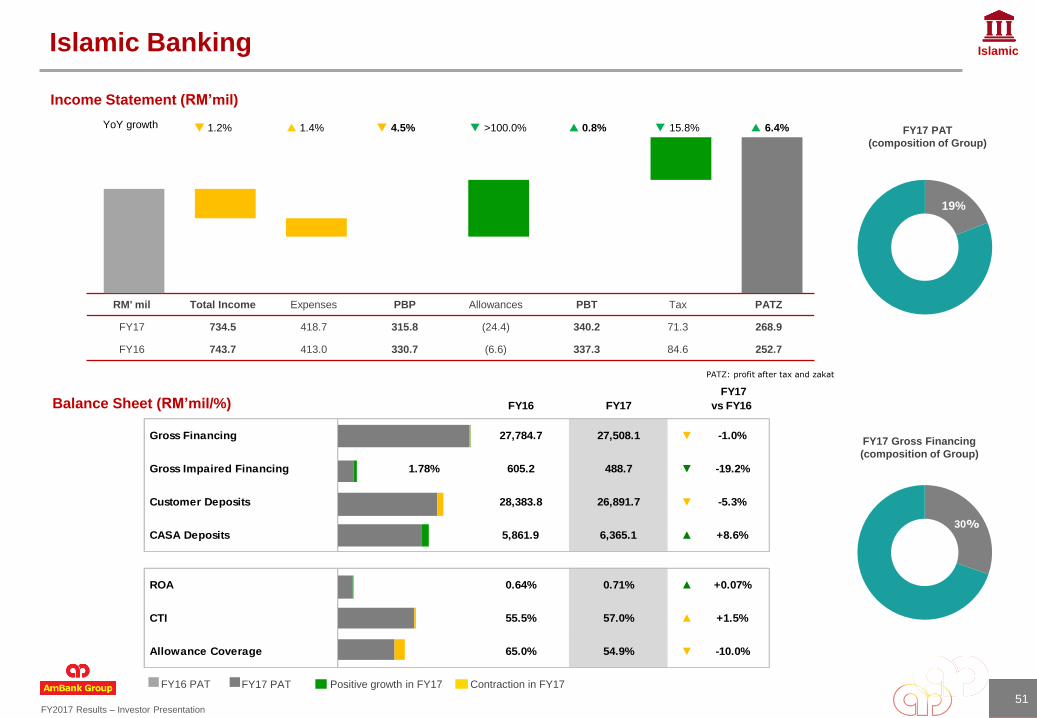
19%
Islamic Banking
PATZ: profit after tax and zakat
FY17 Gross Financing
(composition of Group)
YoY growth 1.2% 4.5% 1.4% >100.0% 0.8% 15.8% 6.4% FY17 PAT
(composition of Group)
30%
51
RM' mil Total Income Expenses PBP Allowances PBT Tax PATZ
FY17 734.5 418.7 315.8 (24.4) 340.2 71.3 268.9
FY16 743.7 413.0 330.7 (6.6) 337.3 84.6 252.7
51
Balance Sheet (RM’mil/%)
FY17 PATFY16 PAT Positive growth in FY17 Contraction in FY17
Islamic
FY16 FY17
Gross Financing 27,784.7 27,508.1 -▼ -1.0%
Gross Impaired Financing 1.78% 605.2 488.7 -▼ -19.2%
Customer Deposits 28,383.8 26,891.7 -▼ -5.3%
CASA Deposits 5,861.9 6,365.1 ▲ +8.6%
ROA 0.64% 0.71% ▲ +0.07%
CTI 55.5% 57.0% ▲ +1.5%
Allowance Coverage 65.0% 54.9% -▼ -10.0%
FY17
vs FY16
FY2017 Results – Investor Presentation
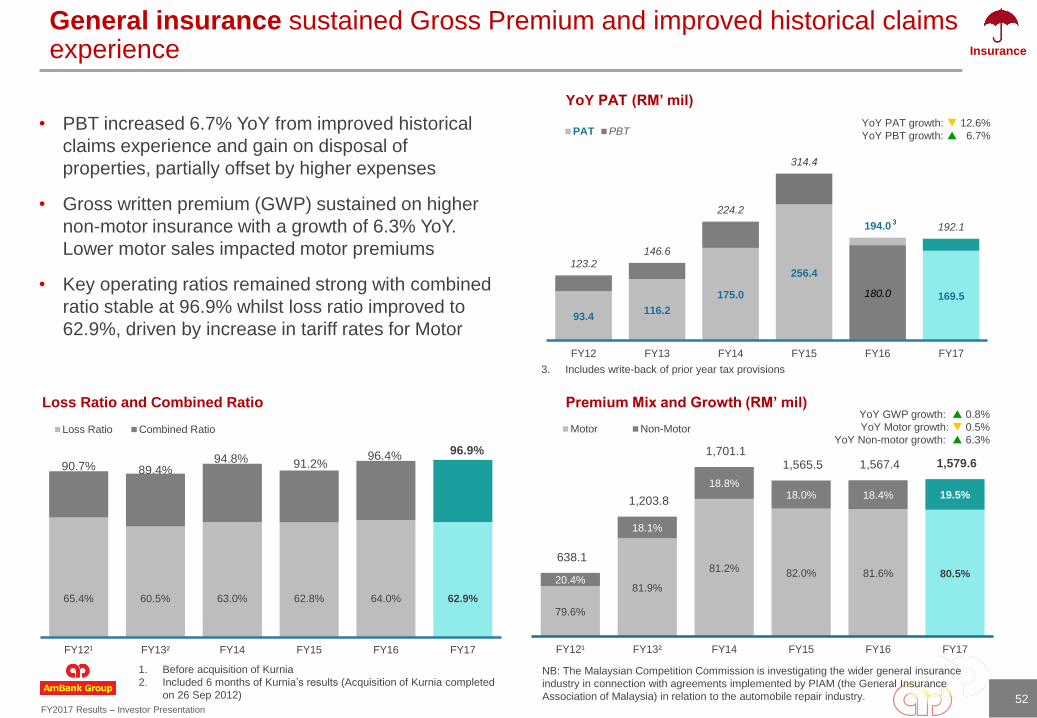
65.4% 60.5% 63.0% 62.8% 64.0% 62.9%
90.7% 89.4%94.8% 91.2%
96.4% 96.9%
FY12¹ FY13² FY14 FY15 FY16 FY17
Loss Ratio Combined Ratio
79.6%
81.9%
81.2% 82.0% 81.6% 80.5%20.4%
18.1%
18.8%18.0% 18.4% 19.5%
638.1
1,203.8
1,701.1 1,565.5 1,567.4 1,579.6
FY12¹ FY13² FY14 FY15 FY16 FY17
Motor Non-Motor
93.4116.2
175.0
256.4
180.0 169.5
123.2146.6
224.2
314.4
194.0 192.1
FY12 FY13 FY14 FY15 FY16 FY17
PAT PBT
General insurance sustained Gross Premium and improved historical claims experience
YoY PAT (RM’ mil)
Premium Mix and Growth (RM’ mil)Loss Ratio and Combined Ratio
• PBT increased 6.7% YoY from improved historical
claims experience and gain on disposal of
properties, partially offset by higher expenses
• Gross written premium (GWP) sustained on higher
non-motor insurance with a growth of 6.3% YoY.
Lower motor sales impacted motor premiums
• Key operating ratios remained strong with combined
ratio stable at 96.9% whilst loss ratio improved to
62.9%, driven by increase in tariff rates for Motor
YoY PAT growth: 12.6%
YoY PBT growth: 6.7%
YoY GWP growth: 0.8%
YoY Motor growth: 0.5%
YoY Non-motor growth: 6.3%
1. Before acquisition of Kurnia
2. Included 6 months of Kurnia’s results (Acquisition of Kurnia completed
on 26 Sep 2012)
NB: The Malaysian Competition Commission is investigating the wider general insurance
industry in connection with agreements implemented by PIAM (the General Insurance
Association of Malaysia) in relation to the automobile repair industry. 52
Insurance
3
3. Includes write-back of prior year tax provisions
FY2017 Results – Investor Presentation
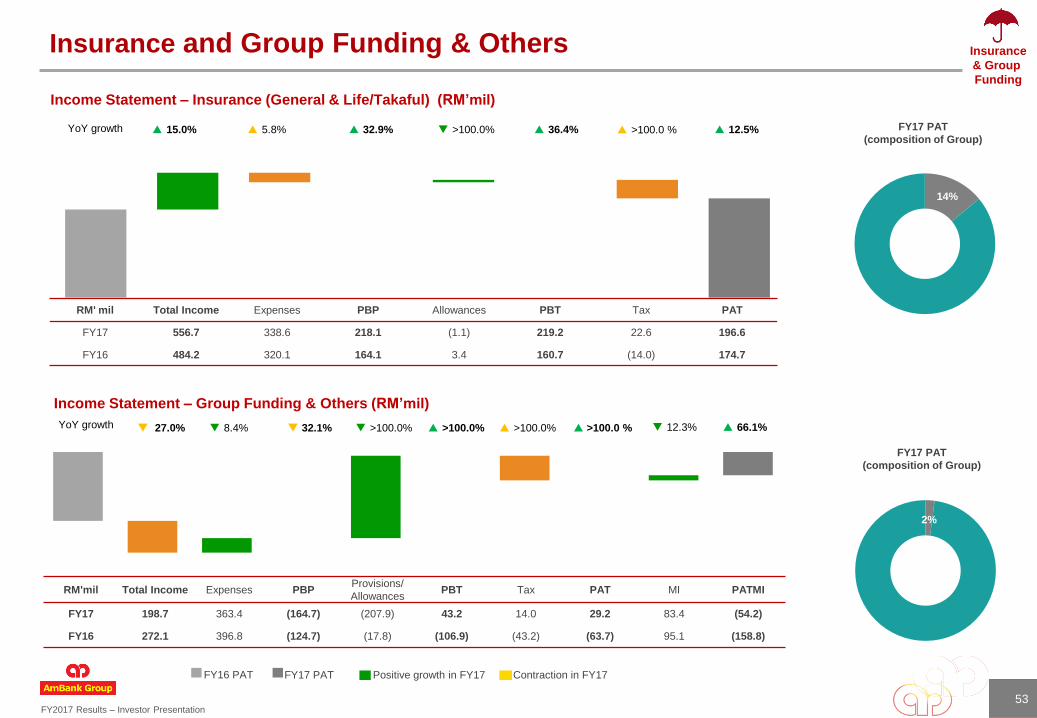
14%
2%
Insurance and Group Funding & Others
RM'mil Total Income Expenses PBPProvisions/
AllowancesPBT Tax PAT MI PATMI
FY17 198.7 363.4 (164.7) (207.9) 43.2 14.0 29.2 83.4 (54.2)
FY16 272.1 396.8 (124.7) (17.8) (106.9) (43.2) (63.7) 95.1 (158.8)
15.0% 32.9% 5.8% >100.0% 36.4% >100.0 % 12.5%YoY growth FY17 PAT
(composition of Group)
FY17 PAT
(composition of Group)
YoY growth 27.0% 32.1% 8.4% >100.0% >100.0% >100.0% >100.0 % 12.3%
53
66.1%
RM' mil Total Income Expenses PBP Allowances PBT Tax PAT
FY17 556.7 338.6 218.1 (1.1) 219.2 22.6 196.6
FY16 484.2 320.1 164.1 3.4 160.7 (14.0) 174.7
53
Income Statement – Insurance (General & Life/Takaful) (RM’mil)
Income Statement – Group Funding & Others (RM’mil)
FY17 PATFY16 PAT Positive growth in FY17 Contraction in FY17
Insurance
& Group
Funding

FY2017 Results – Investor Presentation
Funding sources and maturity profile
LDR1 of 85.7%
AmBank Islamic Berhad
1. RM2b Subordinated Sukuk
Musharakah Programme
2. RM3b Senior Sukuk Musyarakah
Programme
3. RM3b Basel III-compliant
Subordinated Sukuk Murabahah
Programme via Tawarruq
arrangement
AMMB Holdings Berhad
1. RM2b Medium Term Notes
Programme (Senior and/or
Subordinated)
2. RM10b Basel III-Compliant Tier 2
Subordinated Notes Programme
Funding diversity underpinned by
CASA: RM19.9 billion Fixed deposits: RM74.2 billion
Supplemented by term funding & debt capital
AmBank (M) Berhad
1. RM500m Innovative Tier-1 Capital
Securities Programme
2. RM500m Non-innovative Tier 1
Capital Securities Programme
3. RM2b Medium Term Notes
4. RM4b Tier-2 Subordinated Notes
5. RM7b Senior Notes2
6. USD2b Euro Medium Term Notes
1. Includes stable funding sources from additional Tier 1 and Tier 2 capital which do not meet all qualifying criteria for full recognition of capital instruments under Basel III
2. 1st senior notes issuance by a financial institution in Malaysia
AmBank (M) Berhad &
AmBank Islamic
Berhad
Loans with Recourse
Recourse obligations on
loans sold to Cagamas -
maturing in 2017 and
2018
Islamic financing sold to
Cagamas – maturing in
2018
Funding characteristics
• Improve funding stability, maturity gap and liquidity ratios
• Reduce dependence on short-dated deposits to fund long-dated fixed rate loan assets which incur liquidity risk and interest rate risk
• Diversifies investor base
• No obligation for buy back since we are not exposed to withdrawal risks and the notes are traded in the open market
• Enable depositors to invest in long and medium dated papers
54
Insights
FY2017 Results – Investor Presentation
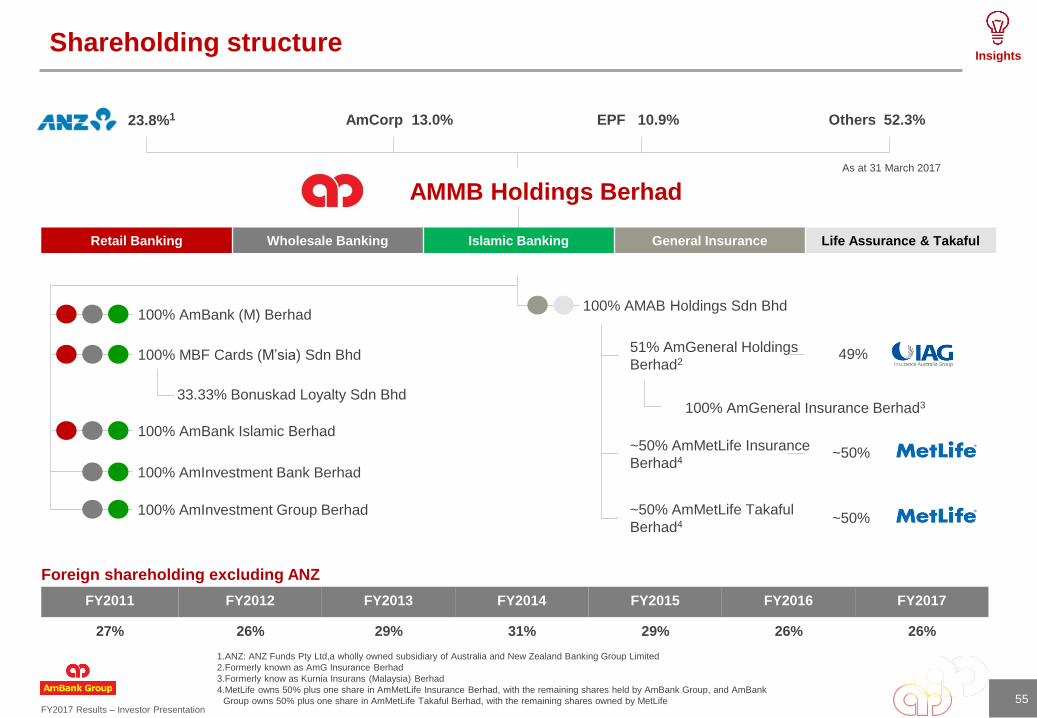
AMMB Holdings Berhad
23.8%1 AmCorp 13.0% EPF 10.9% Others 52.3%
100% AmBank (M) Berhad
100% AmInvestment Group Berhad
100% AmInvestment Bank Berhad
FY2011 FY2012 FY2013 FY2014 FY2015 FY2016 FY2017
27% 26% 29% 31% 29% 26% 26%
1.ANZ: ANZ Funds Pty Ltd,a wholly owned subsidiary of Australia and New Zealand Banking Group Limited
2.Formerly known as AmG Insurance Berhad
3.Formerly know as Kurnia Insurans (Malaysia) Berhad
4.MetLife owns 50% plus one share in AmMetLife Insurance Berhad, with the remaining shares held by AmBank Group, and AmBank
Group owns 50% plus one share in AmMetLife Takaful Berhad, with the remaining shares owned by MetLife
Foreign shareholding excluding ANZ
100% AmBank Islamic Berhad
100% MBF Cards (M’sia) Sdn Bhd
33.33% Bonuskad Loyalty Sdn Bhd
100% AMAB Holdings Sdn Bhd
51% AmGeneral Holdings
Berhad2
~50% AmMetLife Takaful
Berhad4
~50% AmMetLife Insurance
Berhad4
100% AmGeneral Insurance Berhad3
49%
~50%
~50%
As at 31 March 2017
Retail Banking Wholesale Banking Islamic Banking General Insurance Life Assurance & Takaful
55
Shareholding structureInsights
FY2017 Results – Investor Presentation
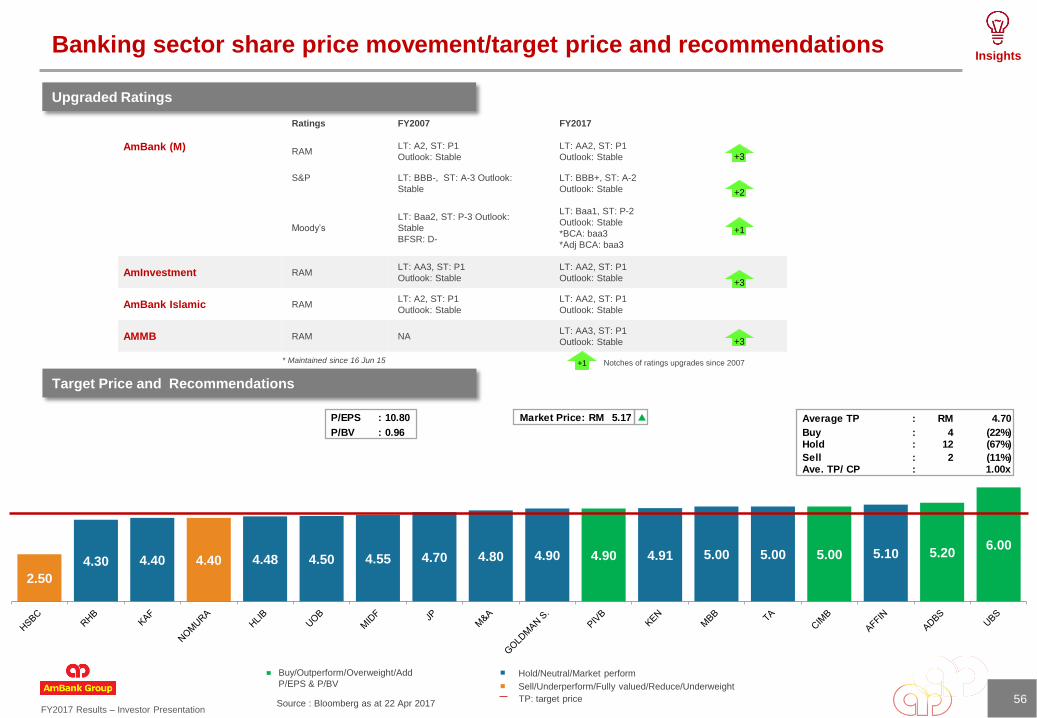
2.50
4.30 4.40 4.40 4.48 4.50 4.55 4.70 4.80 4.90 4.90 4.91 5.00 5.00 5.00 5.10 5.206.00
Ratings FY2007 FY2017
AmBank (M) RAMLT: A2, ST: P1
Outlook: Stable
LT: AA2, ST: P1
Outlook: Stable
S&P LT: BBB-, ST: A-3 Outlook:
Stable
LT: BBB+, ST: A-2
Outlook: Stable
Moody’s
LT: Baa2, ST: P-3 Outlook:
Stable
BFSR: D-
LT: Baa1, ST: P-2
Outlook: Stable
*BCA: baa3
*Adj BCA: baa3
AmInvestment RAMLT: AA3, ST: P1
Outlook: Stable
LT: AA2, ST: P1
Outlook: Stable
AmBank Islamic RAMLT: A2, ST: P1
Outlook: Stable
LT: AA2, ST: P1
Outlook: Stable
AMMB RAM NALT: AA3, ST: P1
Outlook: Stable
+3
+3
+1 Notches of ratings upgrades since 2007
+1
+3
Banking sector share price movement/target price and recommendations
* Maintained since 16 Jun 15
+2
Upgraded Ratings
Target Price and Recommendations
Source : Bloomberg as at 22 Apr 2017
Buy/Outperform/Overweight/Add
P/EPS & P/BV
TP: target price
Sell/Underperform/Fully valued/Reduce/Underweight
Hold/Neutral/Market perform
P/EPS : 10.80 Market Price: RM 5.17 Average TP : RM 4.70
P/BV : 0.96 Buy : 4 (22%)Hold : 12 (67%)
Sell : 2 (11%)Ave. TP/ CP : 1.00x
Insights
56
FY2017 Results – Investor Presentation
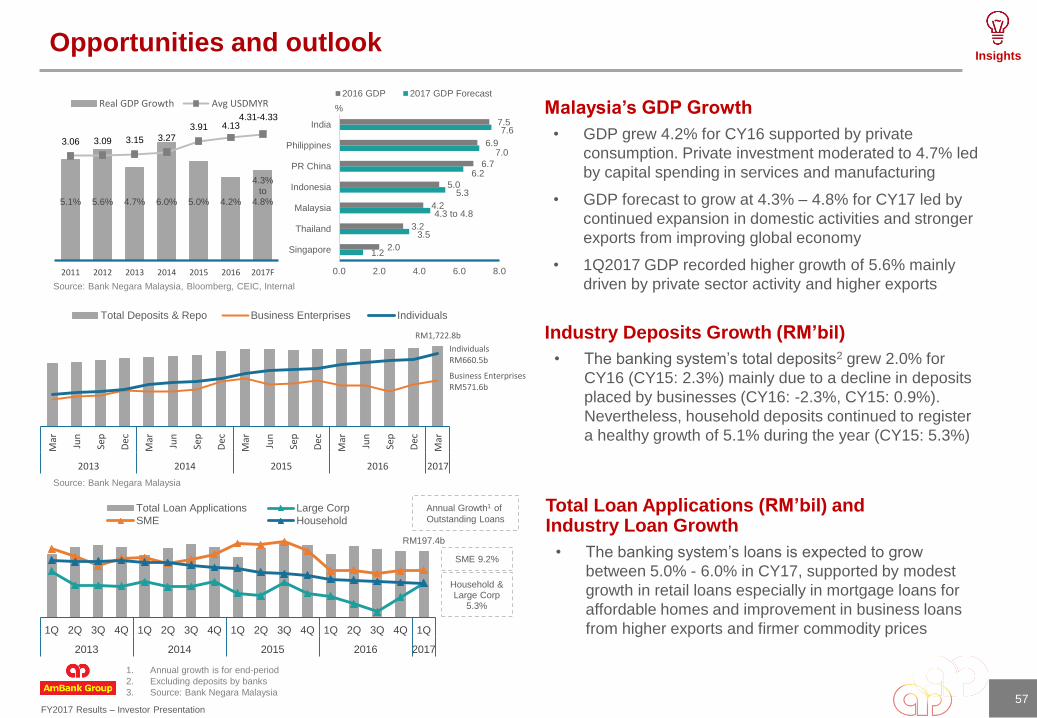
5.1% 5.6% 4.7% 6.0% 5.0% 4.2%
4.3%to
4.8%
3.06 3.09 3.15 3.27
3.91 4.134.31-4.33
2011 2012 2013 2014 2015 2016 2017F
Real GDP Growth Avg USDMYR
RM197.4b
SME 9.2%
Household & Large Corp
5.3%
1Q 2Q 3Q 4Q 1Q 2Q 3Q 4Q 1Q 2Q 3Q 4Q 1Q 2Q 3Q 4Q 1Q
2013 2014 2015 2016 2017
Total Loan Applications Large Corp
SME Household
Annual Growth1 of
Outstanding Loans
RM1,722.8b
Business EnterprisesRM571.6b
IndividualsRM660.5b
Mar
Jun
Sep
Dec
Mar
Jun
Sep
Dec
Mar
Jun
Sep
Dec
Mar
Jun
Sep
Dec
Mar
2013 2014 2015 2016 2017
Total Deposits & Repo Business Enterprises Individuals
1.2
3.5
4.3 to 4.8
5.3
6.2
7.0
7.6
2.0
3.2
4.2
5.0
6.7
6.9
7.5
0.0 2.0 4.0 6.0 8.0
Singapore
Thailand
Malaysia
Indonesia
PR China
Philippines
India
2016 GDP 2017 GDP Forecast
Opportunities and outlook
Source: Bank Negara Malaysia, Bloomberg, CEIC, Internal
Malaysia’s GDP Growth
Industry Deposits Growth (RM’bil)
Source: Bank Negara Malaysia
Total Loan Applications (RM’bil) and Industry Loan Growth
• GDP grew 4.2% for CY16 supported by private
consumption. Private investment moderated to 4.7% led
by capital spending in services and manufacturing
• GDP forecast to grow at 4.3% – 4.8% for CY17 led by
continued expansion in domestic activities and stronger
exports from improving global economy
• 1Q2017 GDP recorded higher growth of 5.6% mainly
driven by private sector activity and higher exports
• The banking system’s loans is expected to grow
between 5.0% - 6.0% in CY17, supported by modest
growth in retail loans especially in mortgage loans for
affordable homes and improvement in business loans
from higher exports and firmer commodity prices
• The banking system’s total deposits2 grew 2.0% for
CY16 (CY15: 2.3%) mainly due to a decline in deposits
placed by businesses (CY16: -2.3%, CY15: 0.9%).
Nevertheless, household deposits continued to register
a healthy growth of 5.1% during the year (CY15: 5.3%)
57
Insights
1. Annual growth is for end-period
2. Excluding deposits by banks
3. Source: Bank Negara Malaysia
%

FY2017 Results – Investor Presentation
GIL 1.63%
LLC 89.1%
Ma
r
Jun
Se
p
Dec
Ma
r
Jun
Se
p
Dec
Ma
r
Jun
Se
p
Dec
Ma
r
Jun
Se
p
Dec
Ma
r
Jun
Se
p
Dec
Ma
r
Jun
Se
p
Dec
Ma
r
2011 2012 2013 2014 2015 2016 2017
Gross Impaired Loans Loan Loss Coverage
CPI 4.3%
BCI 112.7
CSI 76.6
1Q 2Q 3Q 4Q 1Q 2Q 3Q 4Q 1Q 2Q 3Q 4Q 1Q 2Q 3Q 4Q 1Q
2013 2014 2015 2016 2017
CPI Business Conditions Index Consumer Sentiment Index
55.0 64.2
67.1 66.3 71.1
12.8%14.0%
14.6%
9.0%
9.2%8.5%
9.4%7.7%
4.8% 7.1%
4.7%6.0%
5.0% 4.2%
5.6%
2013 2014 2015 2016 1Q2017
Business Loans (RM' bil) SME Loans Growth Rate
Business Loans Growth Rate GDP Growth
Opportunities and outlook
Source: Bank Negara Malaysia, MIER
Business and Consumer Confidence Recovering
System SME loans Growth Outpaced GDP Growth
Industry Asset Quality
• Inflation is projected to be higher at 3.8% - 4.0% (CY16:
2.1%) reflecting the impact of persistent weakness of
the ringgit and higher commodity prices, especially on
retail fuel price
• Consumer Sentiment Index retreating affected by a
confluence of global and domestic factors, including the
heightened volatility in financial markets and the
prolonged underperformance of the ringgit
• The growth in financing to SMEs continued to remain
healthy at 9.0% as at end-December 2016 benefitting
from the various Governmental incentives aimed at
spurring business activities and provide impetus to SMEs
• In an environment of cautious business sentiment and
continued uncertainty in the economy, managing asset
quality remains a core focus for industry players and
stakeholders alike
58
2
2. Monthly average of loan disbursements to businesses, including SMEs
Source : Bank Negara Malaysia
Insights
1
1. Source: Bank Negara Malaysia, excludes regulatory reserve

FY2017 Results – Investor Presentation
GDP5.6%
Consumption 3.6%Investment 2.4%
1Q 2Q 3Q 4Q 1Q 2Q 3Q 4Q 1Q 2Q 3Q 4Q 1Q 2Q 3Q 4Q 1Q
2013 2014 2015 2016 2017
GDP Consumption Investment
4.59%
3.00%
6.66%
3.62%
2009 2010 2011 2012 2013 2014 2015 2016 2017
Avg lending rate (commercial banks) OPR
Avg BLR Avg base rate
AII 104.7
RPI 98.7
RTI 71.6
1Q 2Q 3Q 4Q 1Q 2Q 3Q 4Q 1Q 2Q 3Q 4Q 1Q 2Q 3Q 4Q 1Q
2013 2014 2015 2016 2017
MIER: Auto Industry Index (AII)MIER: Residential Property Index (RPI)MIER: Retail Trade Index (RTI)
Key economy indicators
* Effective 2 January 2015, the Base Rate would replace the Base Lending Rate as the
main reference rate for new retail floating rate loans
OPR reduction by 25bps
to 3% on 13 July 2016
Source: BNM, MIER
External Trade27.5
FDI 10.8
1Q 2Q 3Q 4Q 1Q 2Q 3Q 4Q 1Q 2Q 3Q 4Q 1Q 2Q 3Q 4Q 1Q 2Q 3Q 4Q 1Q 2Q 3Q 4Q
2011 2012 2013 2014 2015 2016
External Trade FDI
RM’ bil
Consumer IndicesGDP, Consumption and Investment Growth
FDI Flow and Trade BalanceKey Interest Rates
Insights
59
FY2017 Results – Investor Presentation
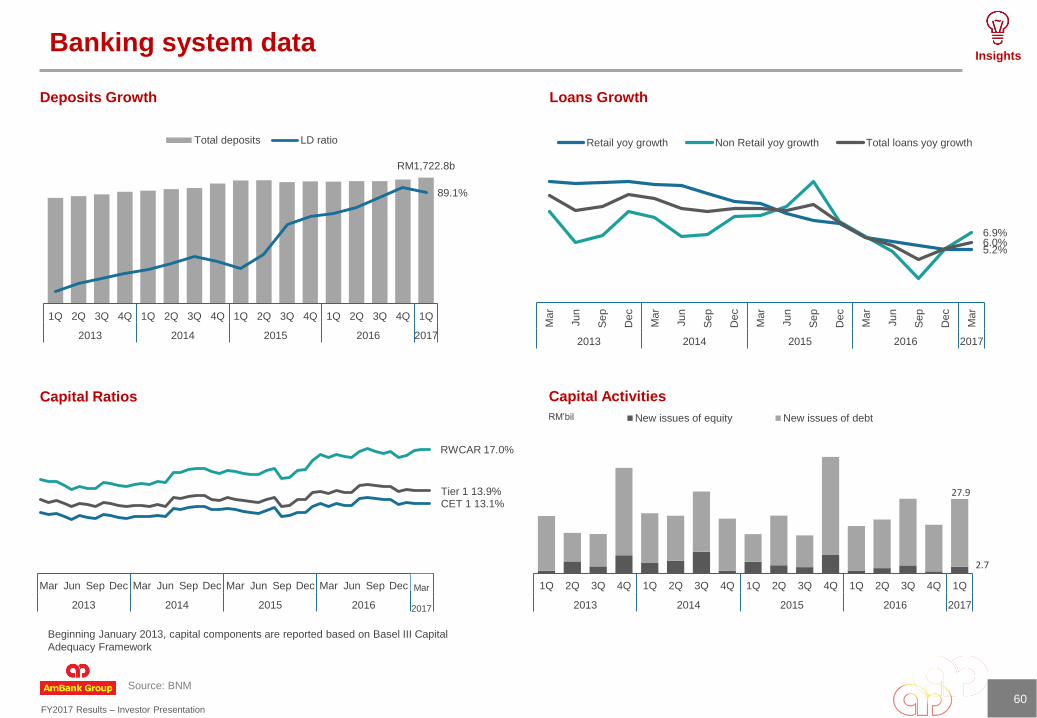
2.7
27.9
1Q 2Q 3Q 4Q 1Q 2Q 3Q 4Q 1Q 2Q 3Q 4Q 1Q 2Q 3Q 4Q 1Q
2013 2014 2015 2016 2017
New issues of equity New issues of debt
RWCAR 17.0%
Tier 1 13.9%CET 1 13.1%
Mar Jun Sep Dec Mar Jun Sep Dec Mar Jun Sep Dec Mar Jun Sep Dec Mar
2013 2014 2015 2016 2017
5.2%
6.9%6.0%
Ma
r
Jun
Se
p
Dec
Ma
r
Jun
Se
p
Dec
Ma
r
Jun
Se
p
Dec
Ma
r
Jun
Se
p
Dec
Ma
r
2013 2014 2015 2016 2017
Retail yoy growth Non Retail yoy growth Total loans yoy growth
RM1,722.8b
89.1%
1Q 2Q 3Q 4Q 1Q 2Q 3Q 4Q 1Q 2Q 3Q 4Q 1Q 2Q 3Q 4Q 1Q
2013 2014 2015 2016 2017
Total deposits LD ratio
Banking system data
Source: BNM
Beginning January 2013, capital components are reported based on Basel III Capital
Adequacy Framework
RM’bil
Loans GrowthDeposits Growth
Capital ActivitiesCapital Ratios
Insights
60
Mar
2017

FY2017 Results – Investor Presentation
Glossary/Disclaimer of warranty and limitation of liability
61
Reported Performance
Reported performance refers to the financial performance as reported in the audited financial statements and disclosed to the market
One Offs
One offs comprise those impacts on financial performance that arise from changes to :
• accounting and provisioning policies (eg 5 and 7 year rules)
• differences between economic and accounting hedges
• prior period catch ups (eg backdated salary costs)
• strategic investments and divestments (eg ANZ partnership), and
• tax and regulatory regimes (eg deferred tax asset write off due to reduction in corporate tax rates)
Underlying Performance
Underlying performance refers to the financial performance adjusted for one off impacts as above
Business Divisions
Business divisions
• comprise AmBank Group’s core operating businesses that generate profits from direct customer transactions and interactions
• have relatively more stable income streams, incur the bulk of the costs and typically have a lower risk profile
• in most instances have market shares and growth metrics that can be measured and benchmarked externally
Operating Segments
Operating segments
• have more volatile and lumpy income streams, with the former a direct function of risk appetite
• include
• income and expenses associated with shareholder funds, loan rehabilitation and legacy businesses, plus
• costs associated with corporate, shared services and governance functions currently not charged back to the business units
The information provided is believed to be correct at the time of presentation. AMMB Holdings Berhad or AMMB Holdings or “AMMB” or its affiliates do not make any representation or warranty,
express or implied, as to the adequacy, accuracy, completeness or fairness of any such information and opinion contained and shall not be liable for any consequences of any reliance thereon.
Neither AMMB Holdings nor its affiliates are acting as your financial advisor or agent. The individual is responsible to make your own independent assessment of the information herein and
should not treat such content as advice relating to legal, accounting, and taxation or investment matters and should consult your own advisers.
Forward looking statements are based upon the current beliefs and expectations of the AMMB Holdings and are subject to significant risks and uncertainties. Actual results may differ from those
set forth in the forward looking statements. AMMB Holdings does not undertake to update the forward looking statements to reflect impact of circumstances or events that may arise after the
date of this presentation.
The information in the presentation is not and should not be construed as an offer or recommendation to buy or sell securities. Neither does this presentation purport to contain all the information
that a prospective investor may require. Because it is not possible for AMMB Holdings or its affiliates to have regard to the investment objectives, financial situation and particular needs of each
individual who reads the information contained thus the information presented may not be appropriate for all persons.
The information contained is not allowed to be reproduced, redistributed, transmitted or passed on, directly or indirectly, to any other person or published electronically or via print, in whole or in
part, for any purpose.
The term "AMMB Holdings" and “AmBank Group” denotes all Group companies within the AMMB Holdings Group and this Disclaimer of Warranty and Limitation of Liability policy applies to the
financial institutions under AMMB Holdings.
Disclaimer of Warranty and Limitation of Liability
FY2017 Results – Investor Presentation
Glossary/Disclaimer of warranty and limitation of liability
62
The material in this presentation is general background information about AmBank Group’s activities current at
the date of the presentation. It is information given in summary form and does not purport to be complete. It is
not intended to be relied upon as advice to investors or potential investors and does not take into account the
investment objectives, financial situation or needs of any particular investor. These should be considered, with
or without professional advice when deciding if an investment is appropriate.
For further information, visit www.ambankgroup.com;
or contact
Ganesh Kumar Nadarajah
Executive Vice President, Group Finance – Business Performance & Investor Relations
Tel: +603 2036 1435
Fax: +603 2031 7384
Email: [email protected] / [email protected]
Cindy Ho Soke Ching
Vice President, Group Finance – Business Performance & Investor Relations
Tel: +603 2036 1926
Fax: +603 2031 7384
Email: [email protected] / [email protected]


![(ANZ Asia Tour) - AmBank€¦ · FY 2007 FY 2008 Build & Scale & Presence AMBANK GROUP – INVESTOR RELATIONS – ANZ ASIA TOUR [June 2010] 2 better decision making • Implemented](https://img.dokumen.tips/doc/110x75/5f245d2c3bfee55aaf020d52/anz-asia-tour-ambank-fy-2007-fy-2008-build-scale-presence-ambank.jpg)