Embed Size (px)
Citation preview

Wockhardt Limited
Investor MeetAugust 2012

Safe Harbor Statement
• Except for historical information contained herein, statements in this communication, which includewords or phrases such as “will”, “aim”, “will likely result”, “would”, “believe”, “may”, “expect”, “willcontinue”, “anticipate”, “estimate”, “intend”, “plan”, “contemplate”, “seek to”, “future”, “objective”,“goal”, “likely”, “project”, “should”, “potential”, “will pursue” and similar expressions or variations ofsuch expressions may constitute “forward looking statements”. These forward looking statementsinvolve a number of risks, uncertainties and other factors that could cause actual results to differmaterially from those suggested by the forward looking statements. These risks and uncertaintiesinclude, but are not limited to our ability to successfully implement our strategy, our growth andexpansion plans, obtain regulatory approvals, our provisioning policies, technological changes,investment and business income, cash flow projections, our exposure to market risks as well as otherrisks. Wockhardt Limited does not undertake any obligation to update forward looking statements toreflect events or circumstances after the date thereof.
Investor Meet Aug 2012 2

Business Highlights
Dr. Murtaza KhorakiwalaManaging Director – Wockhardt Limited
August 2012

Key Questions
1. Do we have a Sustainable Business Model2. Q1 Results & Peer Positioning3. Will we deliver Consistent Profits
Investor Meet Aug 2012 26

Sustainable Business Model
Investor Meet Aug 2012 27
WOCKHARDT
Research
GlobalisationOperational Excellence

Sustainable Business Model
Investor Meet Aug 2012 28
WOCKHARDT
Research
GlobalisationOperational Excellence

Research
Generics
• Blockbuster• Niche• Complex Technology
Biosimilars• Insulins• MABs
New Chemical Entity
• Anti Infectives
Investor Meet Aug 2012 29
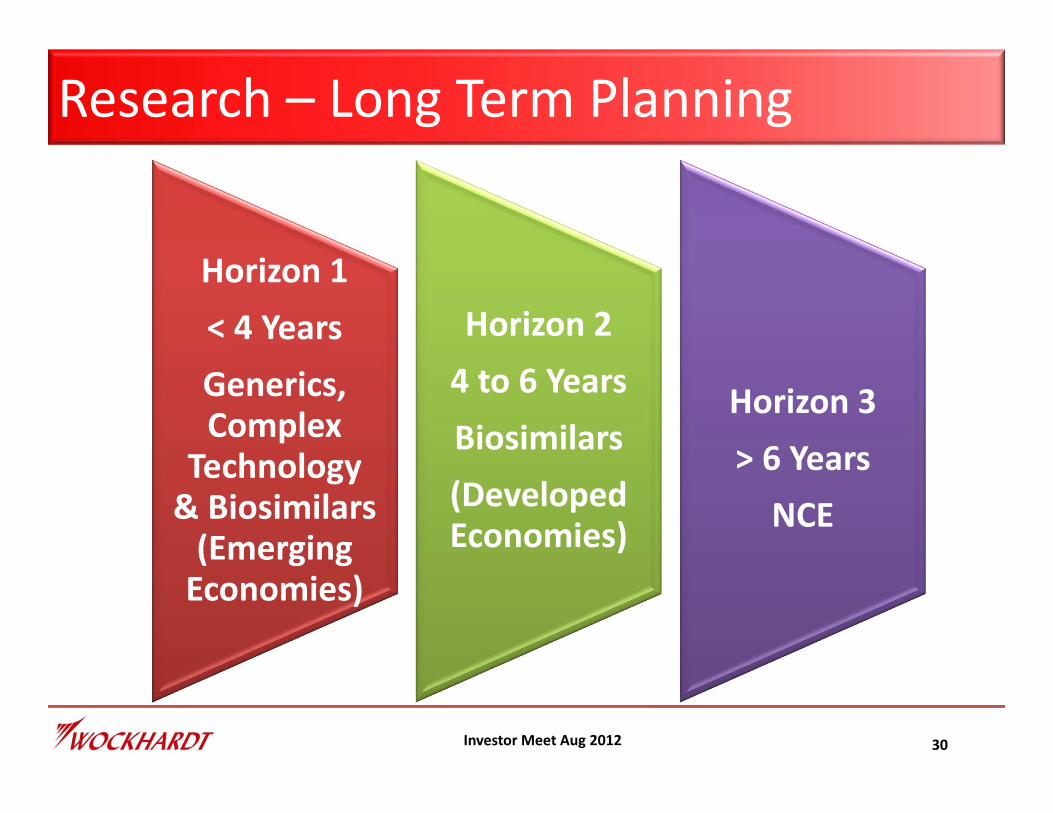
Research – Long Term Planning
Investor Meet Aug 2012 30
Horizon 1< 4 YearsGenerics, Complex
Technology & Biosimilars(Emerging Economies)
Horizon 24 to 6 YearsBiosimilars(Developed Economies)
Horizon 3> 6 YearsNCE

Complex Products Focused Research
458Products sold in USA & Europe manufactured in India, USA, UK & Ireland
164Global Patents granted globally. 1585 patents filed
578Scientists developing innovative and technologically advanced medicines
33US ANDAs pending approval
Investor Meet Aug 2012 31
3 R&D Centers Worldwide
Won Patent Awards 3 Years in a row

Recent Product Launches
Investor Meet Aug 2012 32
US6 – FY12PantoprazoleDonepezilVenlafaxineFluticasoneLevofloxacinClarithromycin
6 – FY12PantoprazoleDonepezilVenlafaxineFluticasoneLevofloxacinClarithromycin
4 – FY13 (till date)LEC
ValacyclovirLansoprazole OTCFexofenadine OTC
4 – FY13 (till date)LEC
ValacyclovirLansoprazole OTCFexofenadine OTC
UK7 – FY12Alendronic Acid
Mycophenolate MofetilRemifentanil Powder Inj
OxycodoneAdenosine Soln Inj
DonepezilClarithromycin
7 – FY12Alendronic Acid
Mycophenolate MofetilRemifentanil Powder Inj
OxycodoneAdenosine Soln Inj
DonepezilClarithromycin
3 – FY13 (till date)AtorvastatinLosartanRopinarole
3 – FY13 (till date)AtorvastatinLosartanRopinarole
OthersFY12
13 – Ireland24 – India
FY1213 – Ireland24 – India
FY13 (till date)4 ‐ Ireland6 ‐ India
FY13 (till date)4 ‐ Ireland6 ‐ India

Product Approvals Since 1 April ‘12
Investor Meet Aug 2012 33
US
6 – Till DateLansoprazole OTC
Clopidogrel BisulphateAlfuzosin
EntacaponeFelodipine
Ziprasidone (TA)
UK
2 – Till DateAtorvastatinLevetiracetam
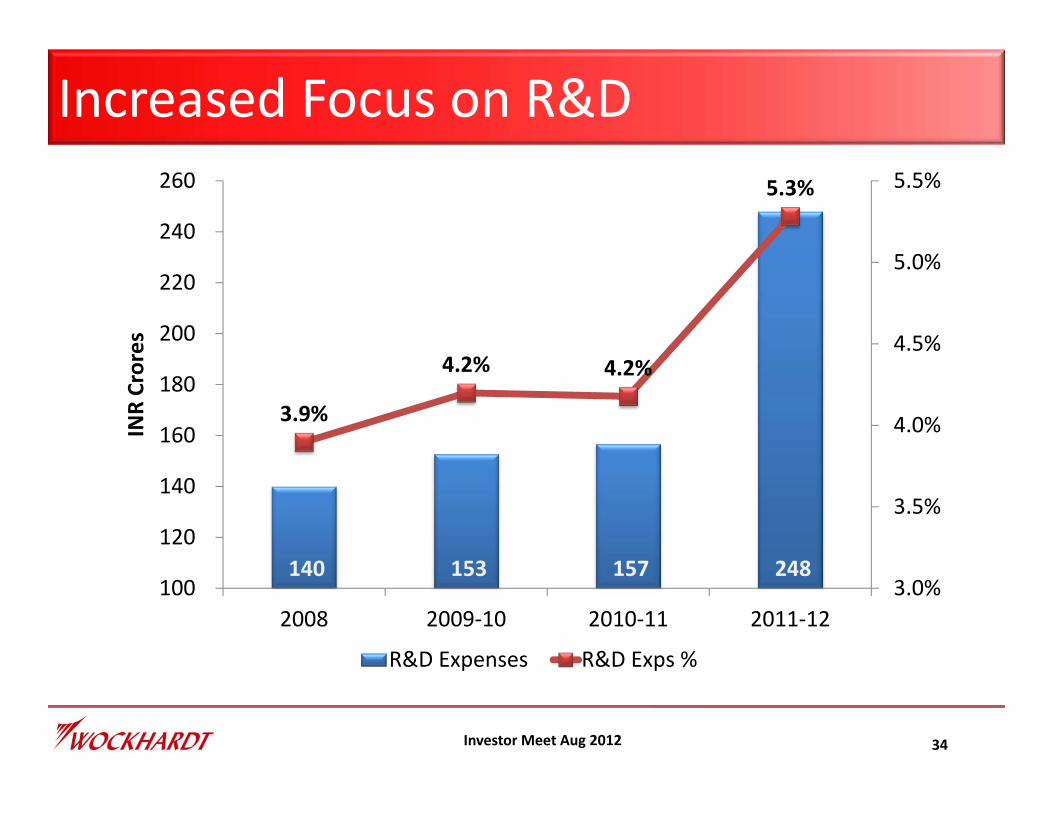
Increased Focus on R&D
Investor Meet Aug 2012 34
140 153 157 248
3.9%
4.2% 4.2%
5.3%
3.0%
3.5%
4.0%
4.5%
5.0%
5.5%
100
120
140
160
180
200
220
240
260
2008 2009‐10 2010‐11 2011‐12
INR Crores
R&D Expenses R&D Exps %

Sustainable Business Model
Investor Meet Aug 2012 35
WOCKHARDT
Research
GlobalisationOperational Excellence

Global Operations
Investor Meet Aug 2012 36
RoW operationsWockhardt Direct operations
USA
UK, Ireland,France, Switz.
India
Mexico
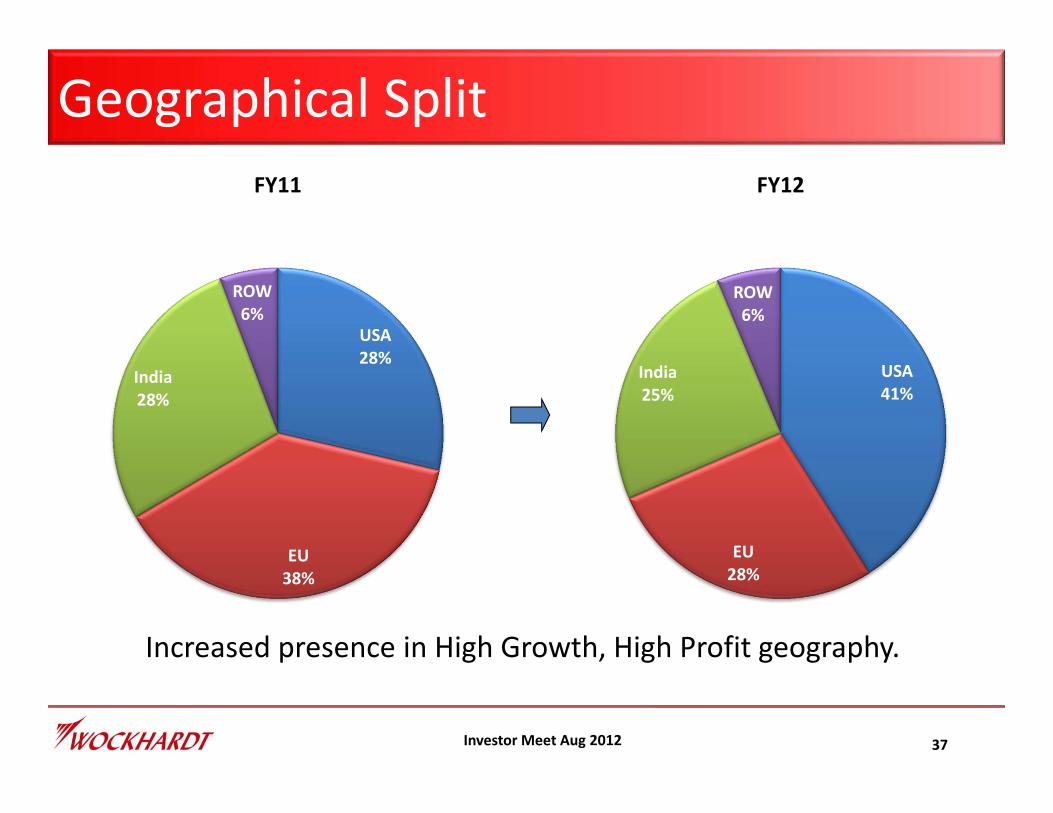
Geographical Split
37Investor Meet Aug 2012
USA28%
EU38%
India28%
ROW6%
FY11
USA41%
EU28%
India25%
ROW6%
FY12
Increased presence in High Growth, High Profit geography.

US Business: Profitable Growth
Investor Meet Aug 2012 38
• Growth of 78% YOY
• 6 New Products launched in
FY12
• 6 Approvals received in FY13 &
4 launched
• Improved Market Share
position in key products
• Surge in the Injectable
business
• Launch of AG version of
Stalevo® - LEC
$144m
$211m
$375m
$ values at convenience translation rate of Rs.50.83

EU Operations: Strong UK OperationsUK Operations
• Strong UK operations growth by
13% against a depressed market
growth
• UK business rank No. 3 in
overall Generic space and No. 2
in UK hospital business
• 7 new products launched in
FY12 and 3 in Q1 FY13
including Atorvastatin
Investor Meet Aug 2012 39
669
758
600
640
680
720
760
800
FY11 FY12
Rs.cr.
UK
£ 82m
£ 92m
£ values at convenience translation rate of Rs.81.44

EU Operations: Ireland & France
Investor Meet Aug 2012 40
Ireland Operations
• Continues to be No. 1 branded generic
company in Ireland with 30% market share
• Launched 13 products in FY 12 and 4 in
YTD FY13 including Atorvastatin
France Operations
• De-growth of 52% due to
genericization of its key drug
• Restructured the operations
– Reduced operating costs by ~70%
– Reduced employees from 497 to 63
472
229
0
100
200
300
400
500
FY11 FY12
Rs.cr.
France
194 183
0
50
100
150
200
250
FY11 FY12
Rs.cr.
Ireland
€ 28.6m € 27.0m
€ 70m
€ 34m
€ values at convenience translation rate of Rs.67.90

India & RoW Operations• Indian Branded Business grew
at 16% in FY12 compared to
15% market Growth.
• 7 Brands among top 300
Industry brands
• Strong pan India field force of
over 3000 employees
• 3rd rank in Indian Pain
management market.
• RoW operations grew by 36% in
FY12
Investor Meet Aug 2012 41

Sustainable Business Model
Investor Meet Aug 2012 42
WOCKHARDT
Research
GlobalisationOperational Excellence

Fit & Trim Operations
Gross Margins at 64% in FY12 vs. 63% in FY08
Operating Expenses at32% in FY12 vs.40% in FY08
Investor Meet Aug 2012 43
EBITDA Margins at 31% in FY12 vs. 18% in FY10

Manufacturing Cost (‐29%)
Investor Meet Aug 2012 44
100117
136
164
8470 71
‐
100
200
2008 2009‐10 2010‐11 2011‐12
Base
Relative No. of Units Relative Cost per unit

People Productivity (+27%)
632 588 542 589
17.6%16.2%
14.5%
12.8%
6%
9%
12%
15%
18%
400
450
500
550
600
650
2008 2009‐10 2010‐11 2011‐12
INR Crore
Employee Cost Employee Cost as % of Sales
Investor Meet Aug 2012 45

Working Capital (Improved by 26%)
1160 916 882 1106
32.3%
25.2%23.5% 24.0%
15%
18%
21%
24%
27%
30%
33%
36%
400
500
600
700
800
900
1000
1100
1200
2008 2009‐10 2010‐11 2011‐12
INR Crore
Working Capital Working Capital as % of Sales
Investor Meet Aug 2012 46
* Working Capital measured as on the last Working Day of the respective Year

Q1 Results

Sales – Growth of 35% over Q1FY12
1,053 1,111 1,209 1,241 1,426600
750
900
1,050
1,200
1,350
1,500
Jun‐11 Sep‐11 Dec‐11 Mar‐12 Jun‐12
Sales
Investor Meet Aug 2012 48
Growth of 35% over Q1FY12
5th Consecutive Quarter of Sequential Growth

EBITDA – Growth of 61% over Q1FY12
312 323 376 429 502
29.5% 29.1%
31.1%
34.6% 35.2%
20%
22%
24%
26%
28%
30%
32%
34%
36%
200
300
400
500
600
Jun‐11 Sep‐11 Dec‐11 Mar‐12 Jun‐12
EBITDA & EBITDA Margins
EBITDA EBITDA Margin
Investor Meet Aug 2012 49
Growth of 61% over Q1FY12
10th Consecutive Quarter of Sequential Growth
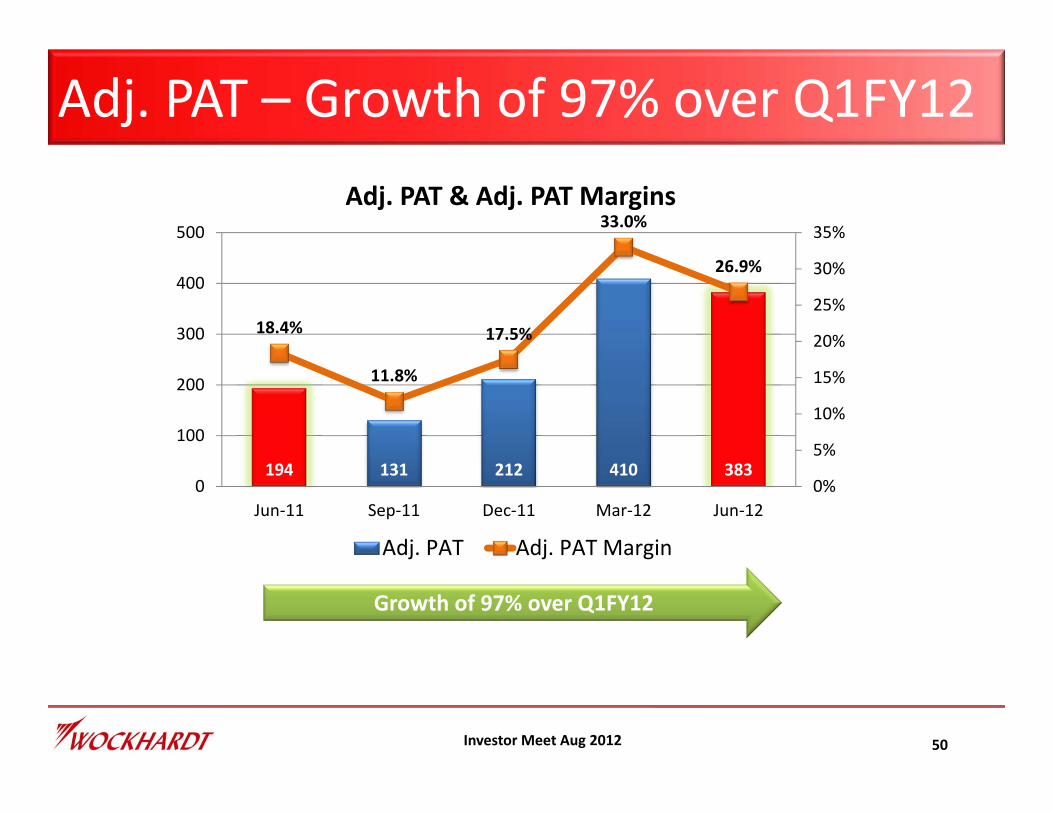
Adj. PAT – Growth of 97% over Q1FY12
194 131 212 410 383
18.4%
11.8%
17.5%
33.0%
26.9%
0%
5%
10%
15%
20%
25%
30%
35%
0
100
200
300
400
500
Jun‐11 Sep‐11 Dec‐11 Mar‐12 Jun‐12
Adj. PAT & Adj. PAT Margins
Adj. PAT Adj. PAT Margin
Investor Meet Aug 2012 50
Growth of 97% over Q1FY12

Peer Positioning

Peer Positioning – Q1FY13
Investor Meet Aug 2012 52
SALES – No. 6
2,683 2,541
2,254
2,012
1,594
1,426
1,041
‐
500
1,000
1,500
2,000
2,500
3,000
Sun Pharma Dr Reddys Lupin Cipla Cadila Healthcare Wockhardt Glenmark

563
502 499
458
345
165
100
150
200
250
300
350
400
450
500
550
600
Sun Pharma Cipla Wockhardt Dr Reddys Lupin Cadila Healthcare Glenmark
Peer Positioning – Q1FY13
Investor Meet Aug 2012 53
EBITDA3rd Highest in Industry
1242 Top 3

Peer Positioning – Q1FY13
Investor Meet Aug 2012 54
EBITDA Margins2nd Highest in Industry
35.2%
28.0%
21.7%20.3% 19.7%
15.9%
10.0%
15.0%
20.0%
25.0%
30.0%
35.0%
40.0%
Sun Pharma Wockhardt Cipla Cadila Healthcare Lupin Dr Reddys Glenmark
Top 346.3%

401 378
336
280
195
78
‐
50
100
150
200
250
300
350
400
450
500
Sun Pharma Cipla Wockhardt Dr Reddys Lupin Cadila Healthcare Glenmark
Peer Positioning – Q1FY13
Investor Meet Aug 2012 55
PAT3rd Highest in Industry
796 Top 3

Peer Positioning – Q1FY13
Investor Meet Aug 2012 56
PAT Margins2nd Highest in Industry
30%
27%
20%
13%12% 12%
8%
5%
10%
15%
20%
25%
30%
Sun Pharma Wockhardt Cipla Dr Reddys Lupin Cadila Healthcare Glenmark
Top 3
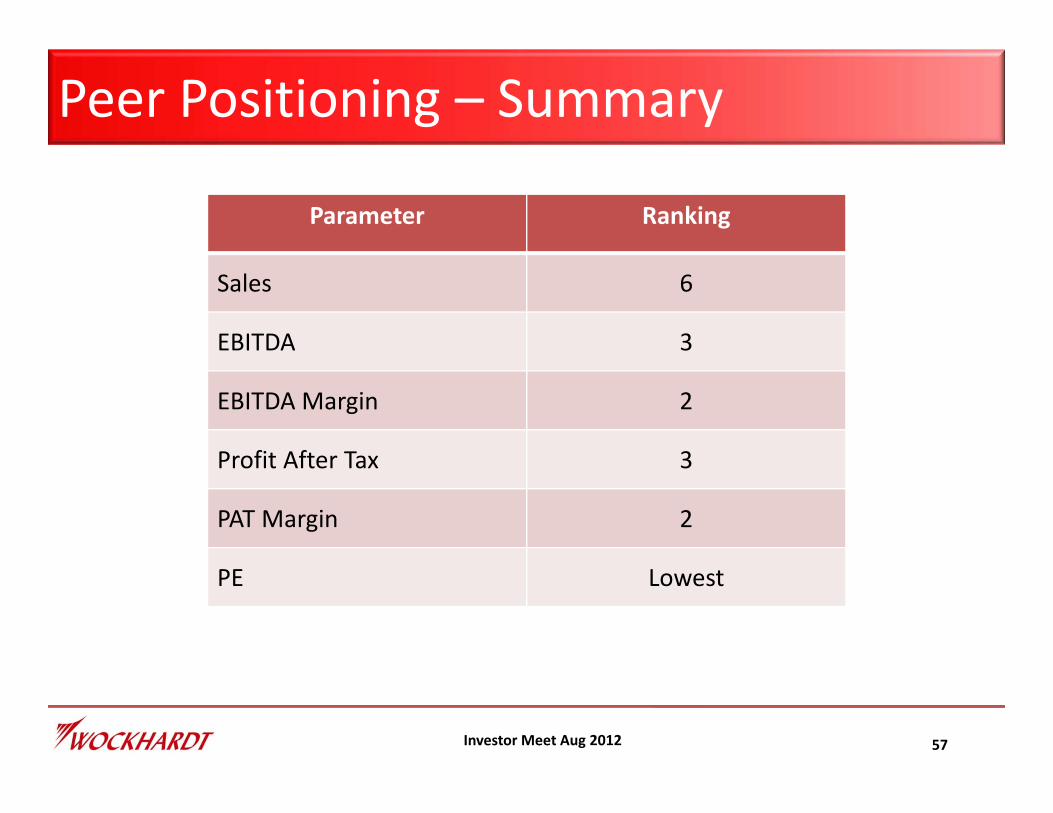
Peer Positioning – Summary
Investor Meet Aug 2012 57
Parameter Ranking
Sales 6
EBITDA 3
EBITDA Margin 2
Profit After Tax 3
PAT Margin 2
PE Lowest

Peer Positioning
Investor Meet Aug 2012 58
Courtesy : Mint

Consistent Profitable Growth
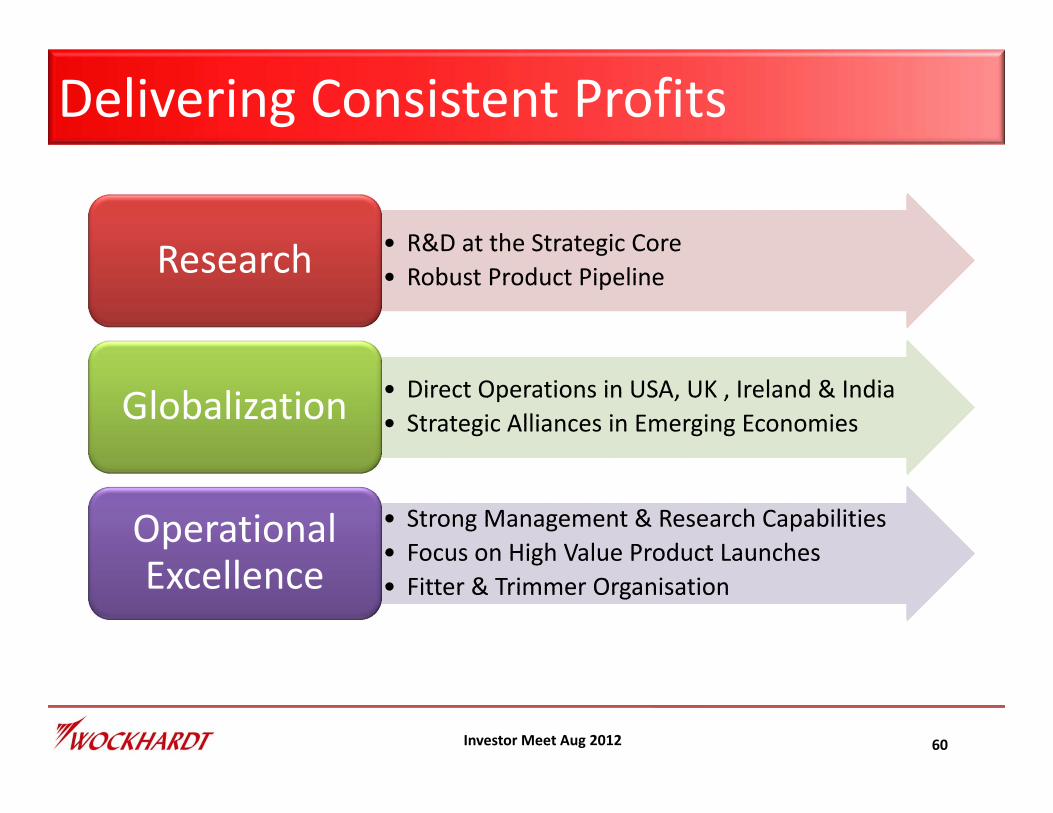
Delivering Consistent Profits
Investor Meet Aug 2012 60
• R&D at the Strategic Core• Robust Product Pipeline• R&D at the Strategic Core• Robust Product PipelineResearch
• Direct Operations in USA, UK , Ireland & India• Strategic Alliances in Emerging Economies• Direct Operations in USA, UK , Ireland & India• Strategic Alliances in Emerging EconomiesGlobalization
• Strong Management & Research Capabilities• Focus on High Value Product Launches• Fitter & Trimmer Organisation
• Strong Management & Research Capabilities• Focus on High Value Product Launches• Fitter & Trimmer Organisation
Operational Excellence
Summary

Summary: A Sustainable Business Model
Focused strategy on driving growth in key markets: US, UK and India
Investor Meet Aug 2012 62

Summary: A Sustainable Business Model
Focus on core operations
Investor Meet Aug 2012 63

Summary: A Sustainable Business Model
Sustained Profitability Growth
Investor Meet Aug 2012 64

Summary: A Sustainable Business Model
Robust Research & Development Program
Investor Meet Aug 2012 65
Summary: A Sustainable Business Model
Strong Manufacturing Capabilities
Investor Meet Aug 2012 66

Summary: A Sustainable Business Model
Highly Competent Leadership at the helm
Investor Meet Aug 2012 67

Summary: A Sustainable Business Model
Wockhardt Associate Ownership Mindset
Investor Meet Aug 2012 68

Investor Meet Aug 2012 69
“A man is but the product of his thoughts. What he thinks, he becomes”
Mahatma Gandhi


![Investor Meet [Company Update]](https://img.dokumen.tips/doc/110x75/577c7a6b1a28abe054951eb5/investor-meet-company-update.jpg)


![Investor Meet Presentation [Company Update]](https://img.dokumen.tips/doc/110x75/577cb48b1a28aba7118c80c9/investor-meet-presentation-company-update.jpg)
