Embed Size (px)
Citation preview

0
39
105
0
158
255
101
178
227
10
155
217
146
196
234
165
179
171
159
207
103
178
8
56
236
0
140
174
220
219
Investor Day 20 May 2015

0
39
105
0
158
255
101
178
227
10
155
217
146
196
234
165
179
171
159
207
103
178
8
56
236
0
140
174
220
219
Agenda
1) Introduction Dennis Holt 09:30 – 09:35
2) Strategic update Niall Booker 09:35 – 10:20
3) Financial update John Baines 10:20 – 10:45
Coffee Break 10:45 – 11:00
4) Core bank Liam Coleman 11:00 – 11:45
5) Information Technology Steve Friedlos 11:45 – 12.15
6) Conduct & risk management Chris Page 12:15 – 12:30
Lunch 12:30 – 13:10
7) Non-core bank Grahame McGirr 13:10 – 13:40
8) Liquidity Ashley Lillie 13:40 – 14:10
9) UK regulatory overview Daniel Mundy 14:10 – 14:30
1

0
39
105
0
158
255
101
178
227
10
155
217
146
196
234
165
179
171
159
207
103
178
8
56
236
0
140
174
220
219
Introduction
Dennis Holt - Chairman
Section 1

0
39
105
0
158
255
101
178
227
10
155
217
146
196
234
165
179
171
159
207
103
178
8
56
236
0
140
174
220
219
Strategic update
Niall Booker – Chief Executive Officer
Section 2

0
39
105
0
158
255
101
178
227
10
155
217
146
196
234
165
179
171
159
207
103
178
8
56
236
0
140
174
220
219
Our strategy
4
A strategy which over time drives value for all stakeholders
Has no cost to taxpayers and minimises the likelihood of taxpayers support in
the unlikely event of resolution
3
Delivers a resilient, standalone bank which can prosper in its own right
distinguished in the market place by adherence to values and ethics
1
Enables the Bank to play a role in any future consolidation 2
To become an efficient and financially sustainable UK Retail and SME Bank that is
distinguished by its values and ethics
Creates value for customers, shareholders, employees, communities we serve
and meets regulatory requirements
4

0
39
105
0
158
255
101
178
227
10
155
217
146
196
234
165
179
171
159
207
103
178
8
56
236
0
140
174
220
219
A multi-year turnaround plan
Turnaround plan very much under way
5
Original focus Current focus
• Initial priorities were to stabilise the Bank:
• Capital
• Liquidity
• Conduct risk discovery
• Group separation
• Building on initial priorities:
• Rebuild and grow the Core bank
• Shrink Non-core to make the Bank
more resilient to potential future severe
stresses
• Conduct remediation / risk management
• IT and operational resilience
• Cost reduction

0
39
105
0
158
255
101
178
227
10
155
217
146
196
234
165
179
171
159
207
103
178
8
56
236
0
140
174
220
219
• Controlled mortgage and asset growth
• Current account growth – customer led
ethical policy
• Improved NIM by increasing margins on
deposits
• Full regulatory compliance – prudential
and conduct
• Legacy issues remediated
• Efficient and competitive cost base
• Building profits and control RWAs
• Significant digitalisation
What will the Core bank look like?
6
Frictionless banking
Creating an efficient and financially sustainable UK Retail and SME Bank
Key steps on the journey End point
• Digital led, multi channel offering
• Outsourced where we do not have scale
or excellence
• Rebuilt SME franchise
• Brand reflecting:
• First class customer service – retaining
some degree of personal interaction
• Distinguished by our ethics and values
• Simple, transparent and few products

0
39
105
0
158
255
101
178
227
10
155
217
146
196
234
165
179
171
159
207
103
178
8
56
236
0
140
174
220
219
Values and ethics
We are committed to a customer led ethical policy
7
• Part of our DNA and drives our distinctive brand
positioning
• Critically important to existing customers, key
driver of retention over last 18 months, has some
appeal to younger generations
• Not for everyone but more than 50% of non
customers are interested in a Bank that provides
great service but does it ethically
• Has to be more than “what we don’t do”
• Key is to invest in products and services that
bring values and ethics to life
• Recently launched overdraft proposition

0
39
105
0
158
255
101
178
227
10
155
217
146
196
234
165
179
171
159
207
103
178
8
56
236
0
140
174
220
219
Financial update
John Baines – Finance Director
Section 3

0
39
105
0
158
255
101
178
227
10
155
217
146
196
234
165
179
171
159
207
103
178
8
56
236
0
140
174
220
219
Conduct • Planned conduct remediation activities to be substantially progressed in 2015
Continued progress in implementing the turnaround plan
Q1 2015 trading update
9
KPIs
• Mortgage applications and completions above plan expectations during Q1 2015 with completions
totalling £0.5bn
• Redemptions at £0.5bn have trended downwards in Q1 2015 compared to H2 2014
• Current account portfolio remained broadly stable
Income • Net interest income slightly ahead of expectations due to pricing actions on retail deposits, lowering
funding costs
Costs • Cost reduction programme remains on track
• Project portfolio being managed to budget with ongoing prioritisation of project portfolio
Liquidity • Retail deposit pricing actions, notably in re-pricing Selected Access Saver products, led to managed
reductions in deposits thus lowering surplus liquidity

0
39
105
0
158
255
101
178
227
10
155
217
146
196
234
165
179
171
159
207
103
178
8
56
236
0
140
174
220
219
Comprehensive cost reduction programme will address key cost drivers – delivering a more
competitive cost base
Cost reduction perspective
10
Suppliers
Systems
People
Bank cost drivers
Premises
Operating cost base evolution (£m)
656 595
2013 2014 2015 2016 2017 2018
325–350
45%
32%
11%
12%
2014 2018

0
39
105
0
158
255
101
178
227
10
155
217
146
196
234
165
179
171
159
207
103
178
8
56
236
0
140
174
220
219
Cost reduction programme remains on track
2015 ─ 2018: Key cost saving initiatives
11
Premises
Procurement
• Rationalisation of ATM network following disposal
of Group ATMs
Efficiency Savings
ATMs
• Incremental savings year on year to 2018
• Improved management and control of all 3rd party
expenditure
• Enabled by procurement outsource and P2P
• Continued reduction in permanent FTEs through
further efficiency savings
• End to end process improvement – Lean
• Process automation
• Channel shift
• Premises implementation strategy to rationalise
estate in line with planned FTE reductions
2015 2016-18
0
39
105
0
158
255
101
178
227
10
155
217
146
196
234
165
179
171
159
207
103
178
8
56
236
0
140
174
220
219
Cost reduction programme remains on track
2015 ─ 2018: Key cost saving initiatives
12
Branch transformation
Outsourcing
• Efficiency savings from outsourcing back office
activity and some corporate service activities
• Mortgages
• Corporate services
• Other back office functions
Digital
• Ongoing transformation and rationalisation of the
branch network
• Channel shift enabling efficiency benefits and
increased revenue
• Digital catch up
• STP – loans
2015 2016-18
Enterprise Services /
Separation
• IT separation and remediation
Regulatory • Ongoing delivery of regulatory requirements
Non-cost reduction projects

0
39
105
0
158
255
101
178
227
10
155
217
146
196
234
165
179
171
159
207
103
178
8
56
236
0
140
174
220
219
Historical underinvestment has led to numerous inefficiencies across the bank
Legacy inefficiencies
13
Opportunity to streamline the Bank and to drive planned cost savings
EXAMPLE 4: Finance
• 5 General Ledgers
• c. 17k monthly reconciliations requires high level of
manual intervention
• Process automation and consolidation of data driving
efficiencies
EXAMPLE 1: Core bank
• Loan apps take 7 - 10 days to process vs today’s
less than 24 hours (often instant) industry
benchmark
• Straight through loan processing (STP) on a digitised
base required
EXAMPLE 2: Core bank
• Mortgage application to offer is currently 20 days
(was 30-40 days) vs 7 - 15 days in rest of the market
• Lean work ongoing to see where opportunities to
remove inefficiencies or changes to credit process
required
EXAMPLE 3: Core bank
• 2 savings platforms across the bank including legacy
Britannia
• Requires consolidation to remove IT cost, terms and
conditions etc
EXAMPLE 5: Target Operating Model (TOM)
• Will deliver a clear operating model with defined accountabilities, with process and service alignment to customer
requirements and an appropriate governance structure
• This maximises efficiencies , eliminates duplication and focuses on revenue growth, customer acquisition and
customer retention

0
39
105
0
158
255
101
178
227
10
155
217
146
196
234
165
179
171
159
207
103
178
8
56
236
0
140
174
220
219
Core bank
Liam Coleman – Director, Retail & Commercial Bank
Section 4

0
39
105
0
158
255
101
178
227
10
155
217
146
196
234
165
179
171
159
207
103
178
8
56
236
0
140
174
220
219
We have started to see a recovery in our key brand & customer
metrics and will continue to invest in The Co-operative Bank
brand.
Oct 2014
Business Re-launch
campaign re-stating our
Values & Ethics
Announce and articulate
our brand positioning
Nov 2014
Launched promotional
loan rate and fixed rate
credit card
Enhance product
propositions
Jan 2015
Launched the Bank’s
NEW Ethical Policy
Demonstration of the
Bank with tangible
evidence
Feb/Mar/ April 2015
£125 Switching
Campaign; New
Overdraft reinforcing our
point of difference
Positioning the Bank as
a credible provider of
banking services
Brand update
Improving brand metrics supported by a refreshed range of customer propositions
15
• One core acquisition brand - The Co-operative Bank (except in the intermediary mortgage market)
• A resilient brand with customer and brand metrics recovering
• Values and ethics, our key differentiator to other bank brands, continue to be associated with The Co-operative
Bank.
• Ranked 3rd in the market for both Current Account Net Promoter Score (since October 2014) and Current Account
Customer Satisfaction (since December 2013)
• .. and closing the gap to 2nd place

0
39
105
0
158
255
101
178
227
10
155
217
146
196
234
165
179
171
159
207
103
178
8
56
236
0
140
174
220
219
5.1 3.5 2.6 2.8
3.5 3.4 3.4 3.5
10.3 9.9 9.6 7.7
7.9 8.1
7.5 7.9
6.3 6.5
6.7 6.5
30-Jun-13 31-Dec-13 30-Jun-14 31-Dec-14BACB Current Term Instant ISAs & others
Deposits & funding costs
Managed reduction of high liquidity combined with a significant reduction in funding costs in 2014
Customer Deposits (£bn)
16
31.4 29.8
28.4
33.1
Fixed Term Deposit Rates
• Despite the loss of some current accounts, deposit balances were flat to full year
• Intentionally reduced the most expensive term funding to reduce excess liquidity (Term and ISA & other books)
• Fixed term deposit costs have reduced significantly over the past two years
• Further Instant Access re-pricing actions taken in Q1 2015 to reduce excess liquidity
0.00%
0.50%
1.00%
1.50%
2.00%
2.50%
Jan-13 May-13 Sep-13 Jan-14 May-14 Sep-14
1 Year Retention Rate 1 Year Acquisition Rate
Core Business numbers exclude Unity Trust Bank (UTB)
Dec-14

0
39
105
0
158
255
101
178
227
10
155
217
146
196
234
165
179
171
159
207
103
178
8
56
236
0
140
174
220
219 0.70%
0.90%
1.10%
1.30%
1.50%
1.70%
1.90%
06 O
ct
20 O
ct
03 N
ov
17 N
ov
01 D
ec
15 D
ec
12 J
an
26 J
an
09 F
eb
23 F
eb
09 M
ar
23 M
ar
06 A
pr
20 A
pr
04 M
ay
Top 6 Rate Platform
Mortgage lending
2015 2014
• Selective competitive retail market pricing in
a price driven market
• Improvements to onboarding processes
• Further process re-engineering underway
• Plans to outsource mortgage operations to
improve capability and reduce costs
• Liquidity management the priority in H1
• MMR reshapes the customer experience
• Competitive positioning in H2 led to improving
intermediary mortgage sales
• Exited 2014 with strong mortgage pipeline
• Mortgage balances reduced as a greater
number of mortgages came to the end of their
natural term or switched to a competitor
0.70%
0.90%
1.10%
1.30%
1.50%
1.70%
1.90%
06 O
ct
20 O
ct
03 N
ov
17 N
ov
01 D
ec
15 D
ec
12 J
an
26 J
an
09 F
eb
23 F
eb
09 M
ar
23 M
ar
06 A
pr
20 A
pr
Top 6 Rate Retail
Market Margins (‘True Rate’): Co-op Retail 5 Yr Fixed 60% LTV*
17 *True Rate = headline rate + product fee – swap rate
Top 6 Range = the six most competitive products (MoneyFacts)
New mortgage lending has enjoyed a strong start to the year, with the Bank making its presence felt in
a competitive market
Market Margins (‘True Rate’): Platform 5 Yr Fixed 60% LTV*

0
39
105
0
158
255
101
178
227
10
155
217
146
196
234
165
179
171
159
207
103
178
8
56
236
0
140
174
220
219
0.2
0.9
0.5
(1.6) (1.6)
(0.5)
Completions Redemptions
H1 2014 H2 2014
Mortgage lending
New mortgage lending has enjoyed a strong start to the year supported by competitive pricing and
new propositions
18
2014 Mortgage Flow (£bn)
• Mortgage applications and completions
above plan expectations in Q1 2015
• Retention remains challenging but
performance has improved year on year
• Healthy mortgage pipeline
• Competitive offer - New propositions
brought to market, including fee free
proposition and the UK's lowest ever 2
year fixed headline rate
• Service improvements to the
intermediary offering with more to come
2015
Q1 2015

0
39
105
0
158
255
101
178
227
10
155
217
146
196
234
165
179
171
159
207
103
178
8
56
236
0
140
174
220
219
Current accounts
19
2014: H2 v H1
• 16% increase in the volume of
current account sales
• 46% reduction in the volume of
current accounts closed
• 40% reduction in the volume of
accounts switching out
• Stable prime base
2015
• Continued intense competition
• Switching campaign continues
through Q2 2015
• Working with customers to
develop a new current account
proposition
• Current account franchise is
central to Core Bank plan
delivery
• Important source of funding
• Fee and NIM generator
• Offers a platform to serve more
needs over the life of the
customer relationship
Importance of current
accounts

0
39
105
0
158
255
101
178
227
10
155
217
146
196
234
165
179
171
159
207
103
178
8
56
236
0
140
174
220
219
Credit cards and overdrafts
20
New propositions refreshing the customer offer; important enabler to deepening relationships with
customers
Cards Overdrafts
• Credit Card acquisition currently ahead of
plan in Q1 2015
• Credit Card acquisition has more than
doubled since the launch of the new 3 year
Fixed card (6.9% APR) in Q4 2014
• Further developments in the pipeline
• Revitalised and simplified overdraft launched
• Annual service and unpaid item fees
removed
• Informal overdraft fees and quarterly charge
caps reduced
• Changes made in line with ethical policy
commitments

0
39
105
0
158
255
101
178
227
10
155
217
146
196
234
165
179
171
159
207
103
178
8
56
236
0
140
174
220
219
Business and Commercial Banking
2014 2015
• Strategic review of Business and
Commercial Banking
• Plan established to optimise the
business in the short term
• Product sets reviewed
• Teams restructured
• Balance sheet stabilised
• Laying foundations for the future
• Piloting new ways of working and
simplified processes eg. credit
• Selective re-setting and re-pricing
of the product range
• Co-location of relationship
manager teams in branches
With the separation of Co-operative Asset Management and Business and Commercial Banking,
2014 saw the start of the development of a true SME business

0
39
105
0
158
255
101
178
227
10
155
217
146
196
234
165
179
171
159
207
103
178
8
56
236
0
140
174
220
219
22
Achievements to date Going forward
• Branch Closures
• 2014 closure plan delivered
• 57 further closures by July 2015 to
165 (halving the estate since 2013)
• Low customer complaints and balance
attrition in line with expectations
• Customer experience and NPS scores
remain high
• Retained branch network larger than
pre-merger
• Branch Investment
• Investment in flagship branch formats
• Branch Investment
• Further investment in core branch formats in 2015
• Move to better locations on an opportunistic basis
• New capability (e.g. multi-channel appointment
booking system)
• Enabling self service and customer choice
• Increased branch ATM capability
• Investigating solutions for passbook customers
• Cash and Cheque deposit machines
• Colleague activity refocused on meeting complex
customer needs
Branch strategy
The plan for resizing and reinvesting in this key delivery channel is on track

0
39
105
0
158
255
101
178
227
10
155
217
146
196
234
165
179
171
159
207
103
178
8
56
236
0
140
174
220
219
Branch network
Retained branch network remains significantly greater than the Bank’s footprint pre-merger, with
locations in key markets across the UK
23

0
39
105
0
158
255
101
178
227
10
155
217
146
196
234
165
179
171
159
207
103
178
8
56
236
0
140
174
220
219
Branch formats
Investment in branch formats in 2015 will enhance the colleague and customer experience
24

0
39
105
0
158
255
101
178
227
10
155
217
146
196
234
165
179
171
159
207
103
178
8
56
236
0
140
174
220
219
Digital strategy
Significant recent changes to our digital offering are already delivering benefits
25
Achievements to date
• Digital transformation roadmap agreed by
the Board
• Introduction of paperless statements in Dec
2014 (current accounts, savings and loans)
with customer take-up above expectations
• Improved mobile app introduced in Q1 2015
• Internet banking online registration
capability
• Internet banking cross sales introduced Jan
2015 (Easy Click savings)
• On time and on budget delivery
• Cost saving relating to paperless statement
functionality currently 130% of target
• Mobile product applications increased
• Total digital savings sales increased since
introduction
Results

0
39
105
0
158
255
101
178
227
10
155
217
146
196
234
165
179
171
159
207
103
178
8
56
236
0
140
174
220
219
Near term digital developments
Online banking update due in Q4 2015 with a responsive and consistent design across devices
26
Other
• Agreed additional plan investment
• Simplified customer journey for product applications
• Strengthened online platform with scalable infrastructure to implement future improvements
• Further planned delivery in 2015 includes: Fixed Rate Credit Card 'easy click' functionality, E-Savings account, Migration
to new online platform, Automated processing for Online loan applications and Online search and sort functionality
Development ongoing in 2015 to enable further shift in activity from other channels
Improved webpage design

0
39
105
0
158
255
101
178
227
10
155
217
146
196
234
165
179
171
159
207
103
178
8
56
236
0
140
174
220
219
Information Technology
Steve Friedlos – Chief Information Officer
Section 5

0
39
105
0
158
255
101
178
227
10
155
217
146
196
234
165
179
171
159
207
103
178
8
56
236
0
140
174
220
219
IT Priority Drivers
28
• Day-to-day service stability for customers and staff is good
• Systems supporting customer-facing bank staff are dated but not out
of line with some competitors
• Bank IT estate was the subject of two attempted major refresh
projects 2008-2013, both abandoned
• Current estate shows symptoms of >5 years under-investment and
“bare-minimum” maintenance
Service and Stability
Outlook
Major Programmes
IT Separation & Remediation
Under-investment in IT
Reliance on Co-operative Group
• Unsustainable – Bank and Co-operative Group share systems yet are
separate entities
• Undesirable – No strategic intent for Group to be a 3rd party service
provider; Bank needs a banking-industry standard of IT service

0
39
105
0
158
255
101
178
227
10
155
217
146
196
234
165
179
171
159
207
103
178
8
56
236
0
140
174
220
219
IT Separation and Remediation
IT Separation : Decoupling shared systems and data; exiting the servicing arrangements between
Bank and Co-operative Group
Remediation : Making changes to bank software applications and IT management processes to
address identified risk vulnerabilities and to achieve compatibility with up-to-date
hardware and operating systems
TODAY
• c. 80 business applications shared between Bank and
Co-operative Group
• 7 Data Centres, arbitrary distribution of technology
between centres, limited resilience
• Obsolete platforms; Technology management
standards below banking industry norms
• Technology Risk materially outside Risk Appetite
• Complex and ageing Applications estate, increasingly
constraining business efficiency
END-2017
• Bank and Group technology fully separated
• Two professionally managed data centres; full
resilience
• Supported technology; “Industry–normal” service
standards
• Technology Risk normalised
• Foundations for high availability Digital services
• Components of a “Future State” applications estate
implemented; more to do beyond 2017…
29
Essential steps to create a standalone IT infrastructure, de-risk and strengthen Bank IT

0
39
105
0
158
255
101
178
227
10
155
217
146
196
234
165
179
171
159
207
103
178
8
56
236
0
140
174
220
219
Major Programmes (selected)
Enterprise Services Outsourcing :
• Separating shared systems from Co-operative Group
• Transitioning to IBM for the supply, hosting, maintaining and running of the Bank’s IT infrastructure
– IBM contracted to provide the technology environment required to host Bank business applications
– Data Centre provision; Mainframes, mid-range servers, storage, connectivity, associated “middleware”
– Managed service for all “run” activity – system monitoring, maintenance, batch operations
30
IT Remediation Programme :
• Correcting weaknesses in IT processes, controls and systems to bring residual IT Risk within Risk Appetite
– 30+ projects addressing IT security, resilience, integrity, stability, recoverability and obsolescence
Phoenix (Mortgage Administration) :
• Transitioning the Bank’s Mortgage Administration systems and processes to an Outsourced model
– existing systems and staff transitioned to BPO provider, subsequently re-platformed to achieve efficiencies
Digital :
• Visual and functional enhancements to existing platform (Release 1); 1st generation Mobile App
• New platform for online and mobile banking services (Release 2a onwards)
– Catch-up with customer expectations and industry benchmarks; drive adoption of “self service”
– STP for Loans; New-to-Bank onboarding; e-ID&V; channel integration; cross-sell; E2E digitisation; digital revenues

0
39
105
0
158
255
101
178
227
10
155
217
146
196
234
165
179
171
159
207
103
178
8
56
236
0
140
174
220
219
Outlook
Transitioning the IT focus from Separation and Remediation to Strategic…
31
Desktop Technology
Refresh
Rem
edia
tio
n f
ocu
s
Str
ateg
ic f
ocu
s
2014 2017 2016 2015 2018
ESO “Wave 1”
implemented IT Separation
Completed
IT Remediation
Programme initiated IT Remediation Programme
Complete
Enterprise Services
Outsourcing Proposition
ESO Agreement
with IBM
Networks
separated
New Digital
Platform 2a
Digital
Release 2b
Digital
Release 1
“Future State”
evolution…
“Future State”
definition
Laying the foundations for future bank technology

0
39
105
0
158
255
101
178
227
10
155
217
146
196
234
165
179
171
159
207
103
178
8
56
236
0
140
174
220
219
Conduct & risk management
Chris Page – Chief Risk Officer
Section 6

0
39
105
0
158
255
101
178
227
10
155
217
146
196
234
165
179
171
159
207
103
178
8
56
236
0
140
174
220
219
Delivering redress & remediation
33
PPI
Provision:
£352m
• Will be substantially completed under current regulatory parameters by Q3 2015
• c. 67k of cases already redressed (c. 16k remaining)
• Future regulatory actions and scope remain a risk
Mortgages
Provision:
£127m
• Low complexity mortgage issues – c. 400k issues to address (>10% already redressed)
• Scope of forbearance (high complexity) redress still to be completed
• Planned customer redress to be substantially complete by end of 2015
• Remains an area of intense regulatory scrutiny
CCA
Provision:
£162m
• c. 240k customers identified – redress commenced with high volume solution testing due in Q2
• Initial focus has been on open loans and secondly on closed loans
• Planned Customer redress to be substantially progressed by end of 2015
• Extracting high volumes of data from archives remains difficult
Packaged
accounts
Provision:
£17m
• Steadily increasing number of complaints from late 2014
• 4 risk cohort characteristics have been identified but population sizes have not been confirmed
• Proactive remediation to commence in Q3 2015
Planned conduct remediation activities to be substantially progressed in 2015
Mitigating
future
conduct
risk
• Annual product reviews under current regulatory parameters conducted on most retail on-sale products
– reviews still to be conducted on BACB and selected off-sale products
• Regulatory assurance monitoring
• Enhanced oversight from Internal Audit
PPI provision reflects lifetime E2E provisions (as at Dec 31, 2014)
CCA, Mortgages and Packaged Accounts provisions are same as 2014 year end as no redress paid in 2013/14

0
39
105
0
158
255
101
178
227
10
155
217
146
196
234
165
179
171
159
207
103
178
8
56
236
0
140
174
220
219
Threshold conditions
Bank is actively addressing deficiencies in regulatory requirements
2014 Annual Report and Accounts - p26 Summary
• Capital – meets current Pillar 1
requirements. Turnaround plan will deliver
ICG compliance by 2018
• CRR – risk modelling improvements
underway
• Solo consolidation – timetable agreed with
regulator to address issues
• Technology – investment underway to
address IT resilience
34

0
39
105
0
158
255
101
178
227
10
155
217
146
196
234
165
179
171
159
207
103
178
8
56
236
0
140
174
220
219
Risk management framework
Still facing substantial risks but progress continues – successfully reducing Bank risk will reduce capital
requirements over time
Key focus areas 2014 Annual Report and Accounts - p28-32
• Execution risk of implementation of
strategic plan – Revitalised TOM with
reinforced SYSC and risk management
framework to mitigate emerging/future risk
• Regulatory risk from increased scrutiny and
FCA type issues – proactive re-energised
risk management with E2E remediation
• Operational / IT risk from outdated
systems/channels – reduced costs through
prioritisation and rebuilding capability
through investment in people, IT and
processes
35
0
39
105
0
158
255
101
178
227
10
155
217
146
196
234
165
179
171
159
207
103
178
8
56
236
0
140
174
220
219
Non-core bank
Grahame McGirr - Managing Director of COAM
Section 7

0
39
105
0
158
255
101
178
227
10
155
217
146
196
234
165
179
171
159
207
103
178
8
56
236
0
140
174
220
219
Non-core — achievements to date
Deleveraged ahead of target through 2013 and 2014
37 1 CRD IV Credit RWAs (fully loaded rules basis)
2 Includes hedge risk provision but excludes other accounting adjustments
Non-core Net Loans2 - Other (£bn)
3.0 2.2 1.7 1.2
1.5 1.1
0.9 0.8
1.1 1.1
1.1 1.0
1.2 1.2
1.1 0.9
H1 13 H2 13 H1 14 H2 14CRE Corporates PFI Other
Non-core Credit RWAs1 - Other (£bn)
2.5 1.7 1.6 1.3
1.7 1.2 0.9 0.8
1.2 1.2 1.1 1.0
0.8 0.8
0.7 0.5
H1 13 H2 13 H1 14 H2 14CRE Corporates PFI Other
6.2 4.9
4.3 3.6
6.8 5.6
4.8 4.0
Key achievements since inauguration
• Sale of Illius Portfolio (Property) completed November 2014
• SPA for REAF (Renewable Energy) sale signed in December 2014
• Revalued the entirety of the Commercial Real Estate portfolio
• Exceeded deleverage target by c.£700m during 2014
• Dealt with the majority of the customers on a consensual basis, ensuring positive outcomes

0
39
105
0
158
255
101
178
227
10
155
217
146
196
234
165
179
171
159
207
103
178
8
56
236
0
140
174
220
219
Optimum securitisation
On 6 May 2015, closed the inaugural £1.5 billion whole structure securitisation of part of Optimum -
Warwick Finance Residential Mortgages Number 1 Plc
Optimum Gross Customer Balances (£bn)
2.1 2.0 2.0 1.9
2.6 2.5 2.4 2.3
0.7 0.6 0.6 0.6
1.9 1.9 1.8 1.7
30-Jun-13 31-Dec-13 30-Jun-14 31-Dec-14
Buy to let Non-conforming Prime Self-cert
7.0 6.5 6.8
38
• Backed by a pool of Optimum mortgages
originated by Platform Funding Limited (PFL)
and GMAC-RFC Limited (GMAC)
• Maintained 5% retention in the transaction,
satisfied through a random selection of loans
• Largest fully marketed placement of U.K. Non-
Conforming RMBS paper post-crisis
• Upsized to a final issuance of £1.5bn from
£1.2bn with Bank retaining 65% of Class A
• Received strong investor interest with all classes
oversubscribed
• c. +0.9% pro forma impact on 31 December
2014 CET1 ratio
7.3
Plan for Optimum to be substantially disposed of by 2018 through a series of transactions,
subject to market conditions
Key highlights

0
39
105
0
158
255
101
178
227
10
155
217
146
196
234
165
179
171
159
207
103
178
8
56
236
0
140
174
220
219
What is next?
39
CRE
Net loans: £1.2bn
RWAs: £1.3bn
• Substantial deleverage of CRE portfolio planned for 2015
• Driven significantly by non-performing workouts
• Larger value assets deleveraged during 2014, high volume of refinancing/workouts
required with a portfolio sale of smaller assets being assessed
Corporates
Net loans: £0.8bn
RWAs: £0.8bn
• Modest deleverage Corporate portfolio planned for 2015
• Driven by rebanking and non-performing workouts
• High number of small value assets, being assessed on an individual borrower
basis to negotiate exit ahead of contract
PFI
Net loans: £1.0bn
RWAs: £1.0bn
• Significant deleverage PFI portfolio planned for 2015
• Strong value of the pipeline of agreed transactions
• Sales settle on an individual basis and not as part of a portfolio sale
Other
Net loans: £0.9bn
RWAs: £0.5bn
• Includes Housing Association
• Modest deleverage planned for 2015
• Long dated contracts on low margins make refinancing negotiations difficult
Optimum
Net loans: £6.3bn
RWAs: £3.5bn
• Working with investment banks to determine timing, structure and quantum in
order to preserve commercial flexibility
Continuing focus on deleveraging the non-core portfolio - however, execution risks remain across the
residual portfolio
Note: All loans and RWAs data as of December 31, 2014
0
39
105
0
158
255
101
178
227
10
155
217
146
196
234
165
179
171
159
207
103
178
8
56
236
0
140
174
220
219
Liquidity
Ashley Lillie – Treasurer
Section 8

0
39
105
0
158
255
101
178
227
10
155
217
146
196
234
165
179
171
159
207
103
178
8
56
236
0
140
174
220
219
Liquidity holdings
41
• Primary Liquidity reflects current PRA definition of Liquid
Assets, and includes Bank of England reserve account,
gilts/T-bills and Multilateral Development Bank bonds
• Primary liquidity reduced in H2 2014, and while it will
vary depending on cashflows, is expected to typically
reduce over time as maturing wholesale is repaid and
retail deposits (particularly fixed deposits) reduce
Liquidity profile remains prudent
Secondary Liquidity
Primary Liquidity (£bn)
5.1 5.1 5.8 4.5
1.1 1.9 1.8
2.1
30-Jun-13 31-Dec-13 30-Jun-14 31-Dec-14
Secondary Liquidity (£bn)
2.8 4.2 4.5 5.6
30-Jun-13 31-Dec-13 30-Jun-14 31-Dec-14Cash at central banks (counts as Primary Liquidity)
Primary Liquidity
• Secondary Liquidity largely comprises assets eligible
for discounting with central banks. This has increased
as the Bank continued its programme of positioning
available mortgages, loans and retained positions

0
39
105
0
158
255
101
178
227
10
155
217
146
196
234
165
179
171
159
207
103
178
8
56
236
0
140
174
220
219
Liquidity Risk Appetite (LRA)
42
• Liquidity risk appetite framework has inherent flexibility
• Flexibility allows the management to adjust its appetite in line with its susceptibility to different stress, broadly defined as marketwide,
idiosyncratic, and a combination of both
• As the Bank position changes, the probability of a larger combined stress occurring changes. Flexibility within the LRA framework allows
ALCO and the Board to most appropriately reflect the liquidity risks faced by the Bank. Liquidity risk appetite is calibrated against the
most applicable stress in the current or forecast conditions
Structural Liquidity defined by the Bank’s risk
appetite and influenced by factors including:
• Regulatory requirement
• Bank’s financial position
• Market’s liquidity position
• Credit ratings
• Assets pipeline
• Term maturity concentrations
• Level of payments flows
• Non-sticky deposits
Prim
ary
Liq
uid
ity
To
tal L
iqu
idity
Re
so
urc
es
Now Longer Term
0
39
105
0
158
255
101
178
227
10
155
217
146
196
234
165
179
171
159
207
103
178
8
56
236
0
140
174
220
219
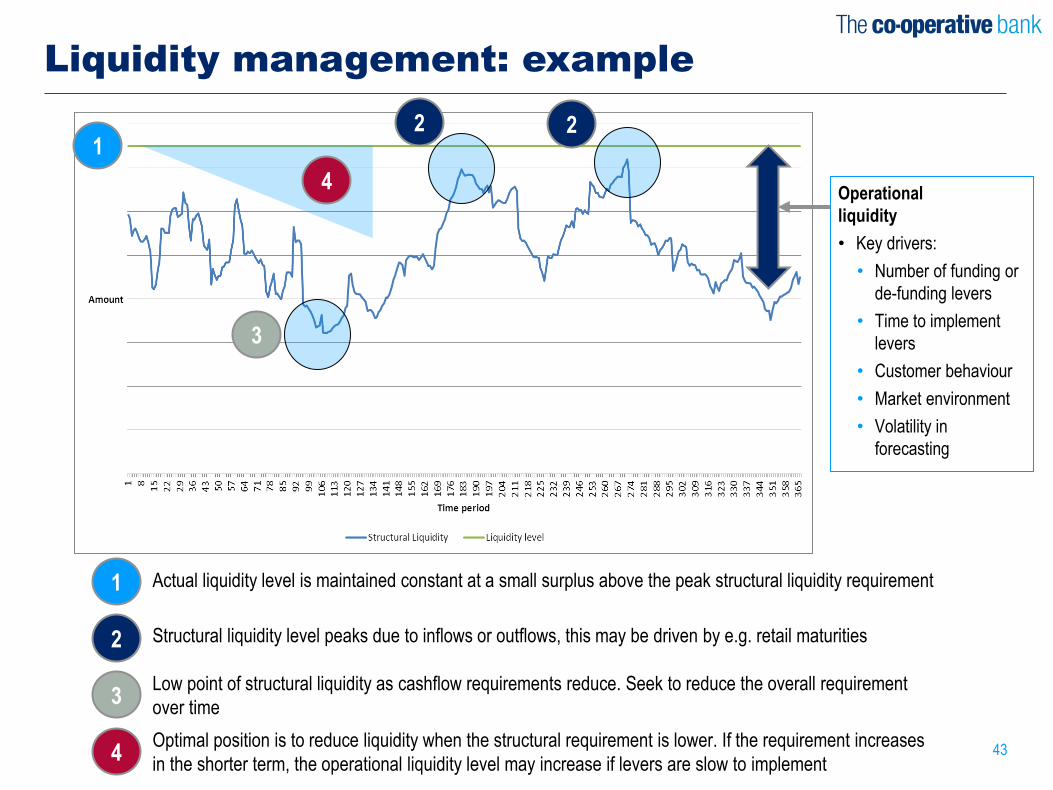
Liquidity management: example
43
Operational
liquidity
• Key drivers:
• Number of funding or
de-funding levers
• Time to implement
levers
• Customer behaviour
• Market environment
• Volatility in
forecasting
1
2
3
4
Actual liquidity level is maintained constant at a small surplus above the peak structural liquidity requirement
Structural liquidity level peaks due to inflows or outflows, this may be driven by e.g. retail maturities
Low point of structural liquidity as cashflow requirements reduce. Seek to reduce the overall requirement
over time
Optimal position is to reduce liquidity when the structural requirement is lower. If the requirement increases
in the shorter term, the operational liquidity level may increase if levers are slow to implement
1 2 2
4
3

0
39
105
0
158
255
101
178
227
10
155
217
146
196
234
165
179
171
159
207
103
178
8
56
236
0
140
174
220
219
Reducing cost of surplus liquidity
44
Targeting a reduction in liquidity over time as bank resilience improves
• Key levers to lower liquidity levels over
time:
• Reduction in retail deposits – focused on
fixed term deposits
• Repayment of maturing wholesale funding
• Improving capital resilience will allow
relaxation of risk appetite thus lowering
liquidity levels
• Constrained in use of other assets:
• Limited choices given stress scenarios and
additional capital requirements
• Overall market risk
• 90 day duration assets – reserve account
vs CDs at LIBOR
Fixed Term Deposit Costs
0.00%
0.50%
1.00%
1.50%
2.00%
1 Year Retention Margin 1 Year Acquisition Margin

0
39
105
0
158
255
101
178
227
10
155
217
146
196
234
165
179
171
159
207
103
178
8
56
236
0
140
174
220
219
UK regulatory overview
Daniel Mundy – Director of Strategic Planning, Performance &
Analytics
Section 9

0
39
105
0
158
255
101
178
227
10
155
217
146
196
234
165
179
171
159
207
103
178
8
56
236
0
140
174
220
219
Current regulations – capital
Pillar 1 requirements will increase due to regulatory changes i.e. implementation of Basel III buffers. Bank’s Pillar 2 requirements
are expected to decrease due to actions to reduce risk. Without these actions overall capital requirements would increase
1.81%
46
2014 2019(2014 risk profile)
2019(Bank expected
risk profile)
MREL CPB
Pillar 2A PLAC
Pillar 1 buffers Pillar 1 pre buffers
Total Pillar 1
(pre buffers) 8%
Total Pillar 1
(inc buffers) 10.5% to 16% (depending on size of buffers)
PLAC 17% (can include bail-inable non regulatory capital)
Pillar 2 A (operational risk etc.)
CPB (macro stress)
MREL 8% of liabilities (can include bail-inable non regulatory
capital)
1. Graphs for illustration only. All metrics within the graph are assessed against RWAs, with exception of MREL which is measured against liabilities
2. Calculation of RWAs may change over time as a result of changes to regulatory policy or its interpretation
Resolvability not yet a primary
focus, but will be introduced
via MREL and PLAC
requirement, and requirement
to ensure sufficient bail-inable
capital
MREL requirement is linked to
balance sheet size not risk
profile
Primary PRA focus is on:
• 7% CET1 ratio (NB: currently above minimum of 4.5% European requirement)
• Pillar 2A – revising approach and reducing Bank risk
• Risk reduction – PRA measuring the Bank against £7.5bn2 RWAs by end 2017
Bank is not part of the Bank of England 2015 stress tests, but may be re-included from 2016. However it is still subject to other stress
test requirements
Pill
ar 1
P
illar
2
Total Pillar 1 8%
Pillar 2A
CPB
Minimum Capital Requirements1 Current market view is ~12% capital ratio is
sufficient. Potentially rising to ~ 20% in 2019
post implementation of buffers and PLAC /
MREL requirements

0
39
105
0
158
255
101
178
227
10
155
217
146
196
234
165
179
171
159
207
103
178
8
56
236
0
140
174
220
219
Impact of future regulations
Resolvability / Capital Buffers
Ring-fencing – ring-
fencing of non-trading
book activities for
Banks with retail /
SME deposits >
£25bn
Generally expected to increase capital requirements
47
Systemic Risk Buffer –
Ring-fenced Banks to
hold capital buffer of
between 0 to 3%, and
leverage ratio buffer of
between 0 to 1.05%
MREL – EU Banks to hold additional capital that is
eligible to be converted to regulatory capital in
event of recovery or resolution. MREL requirement
is measured against liabilities
Credit Risk
– Reduced reliance on external credit ratings with
risk weights determined through risk factors e.g.
CET1 ratio for banks, LTV for retail mortgages
- Capital ratio floor based on the standardised
approach
Securitisation – recalibration resulting in
increase in risk weights e.g. senior AAA positions
increased from current 7% to between 15% to
20% risk weight
Regulators at early stage of reviewing
frameworks for other areas – e.g. credit risk
models, derivatives, operational risk
PLAC – UK ring-fenced banks to hold additional
capital that is eligible to be converted to regulatory
capital in event of recovery or resolution. PLAC
requirement is measured against RWAs
Calculation of Capital Requirements Co-operative Bank Response
• Capital plan is forward looking
and focused on resolvability
requirements, risk reduction
and future legislation:
- rebuilt capital base through
CET1 raising
- deleveraging of high risk
portfolios e.g. Optimum
and other COAM assets
• Regulator dialogue and
negotiations:
- Regarding ICG compliance
& monitor of RWA
forecasts rather than CPB
compliance
- MREL compliance at end
of plan rather than 2016,
resulting in the Bank not
required to issue additional
senior secured debt in
2015
• Member of British Bankers
Association steering group on
regulation and other joint
regulatory bodies

0
39
105
0
158
255
101
178
227
10
155
217
146
196
234
165
179
171
159
207
103
178
8
56
236
0
140
174
220
219
Appendix

0
39
105
0
158
255
101
178
227
10
155
217
146
196
234
165
179
171
159
207
103
178
8
56
236
0
140
174
220
219
Change in regulatory landscape
Pre 2008
49
FSA (Financial Services
Authority)
Less intrusive regulation.
Minimal one to one firm
dialogue
1 UK regulator
FSA
More intrusive regulation.
Regular dialogue with
individual firms
Increased information
requirements
PRA (subsidiary of the Bank of
England) - Prudential regulation
Other arms of the Bank of
England, include the Financial
Policy Committee (FPC) which
sets policy to reduce systemic
risks to protect and enhancing
the resilience of the UK financial
system
FCA
Conduct regulation
2008 - 2012 2013 onwards 2014 onwards
2 UK regulators Policy driven by Europe /
worldwide
Legislation mainly European –
national regulators (e.g. PRA)
have less flexibility to set
requirements, but have to
regulate firms against EU
requirements
- Regulation set through EU e.g.
MREL is an EU initiative
Basel Committee - increasing
assessment of compliance
Basel Committee increasing their
reviews of national compliance
with regulatory frameworks it has
set.
INCREASED COMPLEXITY

0
39
105
0
158
255
101
178
227
10
155
217
146
196
234
165
179
171
159
207
103
178
8
56
236
0
140
174
220
219
Other current regulations
50
Leverage Ratio
• Measure of Tier 1 capital against assets + % of off balance
sheet
• Current minimum requirement of 3%, expected to rise by 2019
for ring-fenced banks (retail and SME deposits > £25bn), but
actual requirement not yet finalised
• Penalises lower risk assets (same capital required to be held
for leverage ratio for all assets), as not risk sensitive
Large Exposures
• 25% total capital threshold for lending to counterparty groups
• Exposures > 10% of total capital are deemed to be large
exposures and are reportable to the PRA
• Threshold may move to being against Tier 1 capital, rather
than total capital in future
• Regulators considering implementing lower threshold (15%)
between globally important banks, which may then be filtered
to a lower level (e.g. domestically important banks)
Liquidity
• Current requirement to meet liquid asset buffer (Pillar 2
requirement); no Pillar 1 requirement
• LCR introduces Pillar 1 requirement for sufficient high quality
liquid assets to survive a stress scenario lasting for 30 days.
80% requirement from October 2015, 90% in 2017 then 100%
from 2018
• NSFR introduces Pillar 1 requirement for more stable sources
of funding using a time horizon of one year. It will be
introduced from 2018

0
39
105
0
158
255
101
178
227
10
155
217
146
196
234
165
179
171
159
207
103
178
8
56
236
0
140
174
220
219
Common regulatory abbreviations
51
CET1 Common Equity Tier 1 - The highest quality of capital. Mainly consists of share capital / premium and retained earnings
AT1 Additional Tier 1 – Other high quality capital. Usually consists of preference shares. For the Bank contains some elements of minority
interests. CET1 + AT1 = Tier 1
Tier 2 Lower, subordinated form of capital, but still meets requirements for regulatory capital. Tier 1 + Tier 2 = total regulatory capital
Pillar 1 Capital required to be held against credit, operational and market risk
Pillar 2A Capital required to be held for risks not captured by Pillar 1 e.g. concentration risk, pension risk, additional operational risk.
Pillar 1 + Pillar 2A is also known as ICG (Individual Capital Guidance)
CPB Capital Planning Buffer – buffer to ensure Pillar 1 + Pillar 2A requirements can be met under a stress. Also known as Pillar 2B
Capital
Conservation Buffer
A Basel III capital buffer. Phased in from 2016 at 0.625% per annum, until maximum of 2.5% in 2019. PRA has effectively implemented
now through 7% CET1 requirement
Countercyclical
Buffer
A Basel III capital buffer. Used to build up a buffer in the good times to be released in the bad times. Based on location of exposures.
Currently 0% in the UK. Set by jurisdiction up to max of 2.5%
SRB Systemic Risk Buffer – buffer applied to ring-fenced banks up to max of 3%. Implemented from 2019
MREL Minimum Requirement for Eligible Liabilities - requirement for ring-fenced Banks to hold instruments that either meet definition of
regulatory capital or can be converted into regulatory capital against a % (TBC) of liabilities
PLAC Primary Loss Absorbency Capacity – requirement for ring-fenced Banks to hold instruments that either meet definition of regulatory
capital or can be converted into regulatory capital up to 17% of RWAs
RWAs Risk Weighted Assets – Pillar 1 calculation of risk, largely dependent on riskiness of underlying loans
PRA Prudential Regulation Authority – UK Prudential Regulator. The Bank is jointly regulated by the PRA and FCA (Financial Conduct
Authority). The PRA is part of the Bank of England
LCR Liquidity Coverage Ratio – Basel III liquidity ratio focussing on 30 day outflows. Implemented from October 2015
NSFR Net Stable Funding Ratio - Basel III liquidity ratio focussing on 1 year time horizon. Implemented from 2018

0
39
105
0
158
255
101
178
227
10
155
217
146
196
234
165
179
171
159
207
103
178
8
56
236
0
140
174
220
219
Conduct background
52
PPI
• Mis-selling of payment protection insurance including inappropriate sales practices or reward structures
• Current regulatory expectation and industry practice is that customers to whom banks made pre-2005 sales of PPI do not need to be
proactively contacted
• Potential impact of recent Plevin vs Paragon Supreme Court decision which deals with the disclosure of commission amounts for sales of
single premium PPI. This has potentially industry wide impact and is currently under review. Could open further cohorts of PPI redress
across the industry. Financial Ombudsmen Service (FOS) is considering impact of Plevin on its approach to PPI complaints referred to it
Mortgages
• 1st workstream - various mortgage related issues needing refunds:
• Inappropriate charging of fees such as Early Repayment Fees and late payment fees
• Incorrectly charged 1st ever mortgage payment for selected mortgages, by only collecting interest and not the capital meaning that
customers paid more over the life of the loan
• Certain customers did not receive T&Cs which allowed fee tariff to be increased over time
• Considers how arrears payments have been autocapped with compound interest
• 2nd workstream - reviewing instances of over forbearance on closed customer files and customer detriment in respect of live mortgages
where the treatment of customers in arrears may not have been appropriate
CCA
• Consumer Credit Act regulates consumer lending and governs the way in which banks provide consumer credit (e.g. unsecured loans,
credit cards). Requirements are highly technical and depending on the nature of the breach, the bank may no longer enforce the loan
without a court order and/or customer is not liable to pay interest or arrears charges on the loan until compliance is restored
• Bank has Identified instances of non compliance in relation to statement issuance and wording and also in relation to the issuance of
Notice of Sums in Arrears
• If statement is not fully technically compliant interest cannot be charged until compliance is restored and statement issued showing the
correct amount of interest and principal
• Restoration of compliance requires data extraction, interest and principal recalculation over extended periods
Packaged
accounts
• Identified potential conduct risks in relation to the misselling of packaged accounts - an industry issue
• Provision to reimburse customers for premiums previously paid for packaged current account benefits relating to four separate cohorts of
customers (Over 80s; dual insurance cover; non-UK residents and inactive accounts)
• Not been in response to a specific decision by the regulator but where the Bank considers that customer detriment may have arisen

0
39
105
0
158
255
101
178
227
10
155
217
146
196
234
165
179
171
159
207
103
178
8
56
236
0
140
174
220
219
Items that continue to be the focus of investor questions
Selected accounting policies (i)
53
Fair Value Amortisation
• £292.9m unrecognised DTAs as of 31 December 2014 (note 22 in the ARA) –
predominantly comprised of unutilised carryforward tax losses carried forward and
separate to the Group Tax Receivable
• Will continue to build as the bank makes losses in 2015 and 2016
• Recognition will depend upon the Board having a high level of confidence in future
profitability, stability and resilience
• Treatment of bank carryforward losses in the UK changed in April 2015 – losses
incurred post April 2015 have to be utilised first with losses prior to April 2015 being
utilised once those losses have been exhausted. Even then, those losses can only
be applied to 50% of taxable profit in any one year
Deferred Tax Assets
• At the time of the merger with Britannia in 2009, Leek note securitisations were
brought on to the balance sheet as liabilities below par. This created a credit in the
merger reserve account (retained earnings) and a debit in carrying value
• As the notes redeem to par, generates a fair value amortisation unwind as per
p234 of the ARA, which is a below the line item on the income statement
• Note that the Fair Value Amortisation line item in the management income
statement reflects total bank fair value amortisation not just the Leek notes
• Note that the deferred tax liabilities offset part of the Leek note unwind from a
balance sheet perspective

0
39
105
0
158
255
101
178
227
10
155
217
146
196
234
165
179
171
159
207
103
178
8
56
236
0
140
174
220
219
Items that continue to be the focus of investor questions
Selected accounting policies (ii)
54
Group Tax Receivable
• £126.8m Group Tax Receivable as of December 31 2014
• Bank surrendered a portion of its 2012 and 2013 tax losses to Group, in return for
payment. The arrangement is that Group will only pay Bank for these losses when
they materialise into actual cash tax savings for Group, which, with Group’s own
losses situation, is forecast to spread out over a long period of time. In addition, the
utilisation is also dependent upon tax rules around capital allowances. Therefore,
the Bank is scheduled to receive what it is owed by Group in instalment payments
over a number of years. Each year end, Group provides Bank with a forecast of
how much it is expecting to pay on each instalment date, and this will change year
on year depending on Group’s own tax profile
• As this forecast payment schedule runs out over a long period of time, the Bank
has to discount the amounts receivable in its accounts to reflect the fact that it will
not have the benefit of the amounts for a long time, as opposed to a receivable due
in the very near future which would be worth more in real terms

0
39
105
0
158
255
101
178
227
10
155
217
146
196
234
165
179
171
159
207
103
178
8
56
236
0
140
174
220
219
Items that continue to be the focus of investor questions
Selected accounting policies (iii)
55
Risk Weights
Expected Loss Shortfall
• Residential mortgages currently have a c. 6% risk weighting which is consistent
with other UK banks. The introduction of a 15% risk weight floor is under
discussion but implementation and/or timing is uncertain
• Risk weights of securitisations are also due to change under Basel Committee
proposals due for implementation by 2018 (e.g. retained AAA moving from 7% to
20%)
• £191.5m deduction to CET1 capital as of December 31, 2014
• This is the amount that the regulatory expected loss (EL) calculation is greater than
the provisions made by the bank
• The Bank does utilise the IRB methodology for calculating EL. Worth noting that
every bank’s impairments will differ from the regulatory EL
• The Bank’s EL shortfall is sizeable reflecting the large non-core book; particularly
Corporate and CRE. EL shortfall will reduce over time as non-core deleverages
and accordingly reduce the deduction to capital

0
39
105
0
158
255
101
178
227
10
155
217
146
196
234
165
179
171
159
207
103
178
8
56
236
0
140
174
220
219
Disclaimer
Important Notice
The information, statements and opinions in this document do not constitute or form part of any offer or invitation to sell or issue, or any solicitation of any offer to purchase or
subscribe for any shares or any other securities nor shall it (or any part of it) or the fact of its distribution, form the basis of, or be relied on in connection with, any contract therefor.
Forward Looking Statements
This document contains certain forward looking statements with respect to the business, strategy and plans of The Co-operative Bank and its current goals and expectations relating
to its future financial condition and performance. Statements that are not historical facts, including statements about The Co-operative Bank’s or its directors’ and/or management’s
beliefs and expectations, are forward looking statements. By their nature, forward looking statements involve risk and uncertainty because they relate to events and depend upon
circumstances that will or may occur in the future. Factors that could cause actual business, strategy, plans and/or results to differ materially from the plans, objectives, expectations,
estimates and intentions expressed in such forward looking statements made by the Bank or on its behalf include, but are not limited to: general economic and business conditions in
the UK and internationally; inflation, deflation, interest rates and policies of the Bank of England, the European Central Bank and other G8 central banks; fluctuations in exchange
rates, stock markets and currencies; changes to The Co-operative Bank’s credit ratings; changing demographic developments, including mortality and changing customer behaviour,
including consumer spending, saving and borrowing habits; changes in customer preferences; changes to borrower or counterparty credit quality; instability in the global financial
markets, including Eurozone instability and the impact of any sovereign credit rating downgrade or other sovereign financial issues; technological changes; natural and other
disasters, adverse weather and similar contingencies outside The Co-operative Bank’s control; inadequate or failed internal or external processes, people and systems; terrorist acts
and other acts of war or hostility and responses to those acts; geopolitical, pandemic or other such events; changes in laws, regulations, taxation, accounting standards or practices;
regulatory capital or liquidity requirements and similar contingencies outside The Co-operative Bank’s control; the policies and actions of governmental or regulatory authorities in the
UK, the European Union, the US or elsewhere; the implementation of the EU Bank Recovery and Resolution Directive and banking reform, following the recommendations made by
the Independent Commission on Banking; the ability to attract and retain senior management and other employees; the extent of any future impairment charges or write-downs
caused by depressed asset valuations, market disruptions and illiquid markets; market relating trends and developments; exposure to regulatory scrutiny, legal proceedings,
regulatory investigations or complaints; changes in competition and pricing environments; the inability to hedge certain risks economically; the adequacy of loss reserves; the actions
of competitors, including non-bank financial services and lending companies; and the success of The Co-operative Bank in managing the risks of the foregoing.
The ability of the Bank to implement its revised plan and to achieve the results set out in the plan requires the regulators’ continued acceptance of the plan and entails particular
challenges including (but are not limited to): ability to execute a substantial re-engineering of the Bank’s operating model and a very large and complex IT remediation programme;
ability to achieve targeted cost savings; ability to retain customers and deposits; the timing and quantum of impacts to capital from the Bank’s asset reduction exercise; meeting its
planned improvements in net interest margin; a possible deterioration in the quality of the Bank’s asset portfolio; unplanned costs from (for example) conduct risk matters; ability to
maintain the Bank’s access at an appropriate cost to liquidity and funding and the ability of the Bank to raise further capital assumed in its revised plan. Additional risks and
uncertainties are included in the Bank’s Annual Report and Accounts for the financial year ended 31 December 2014.
Any forward-looking statements made in this document speak only as of the date they are made and it should not be assumed that they have been revised or updated in the light of
new information of future events. Except as required by the Prudential Regulation Authority, the Financial Conduct Authority, the London Stock Exchange plc or applicable law, The
Co-operative Bank expressly disclaims any obligation or undertaking to release publicly any updates of revisions to any forward-looking statements contained in this document to
reflect any change in The Co-operative Bank’s expectations with regard thereto or any change in events, conditions or circumstances on which any such statement is based.
56