Embed Size (px)
Citation preview

1
Investor Day
THURSDAY, JUNE 9, 2016

JOHN MACDONALD PRESIDENT & CEO

Forward-Looking Statements
3
This presentation contains forward-looking information within the meaning of applicable Canadian securities laws (“forward-looking statements”). Statements other than statements of historical fact
contained in this presentation may be forward-looking statements, including, without limitation, management’s expectations, intentions and beliefs concerning anticipated future events, results,
circumstances, economic performance or expectations with respect to Enercare Inc. (“Enercare”), including Enercare’s business operations, business strategy and financial condition. Forward-looking
statements may include words such as “anticipates”, “believes”, “budgets”, “could”, “estimates”, “expects”, “goal”, “intends”, “may”, “outlook”, “plans”, “strive”, “target” and “will”, although not all forward-
looking statements contains these words.
Some of the specific forward-looking statements in this presentation include, but are not limited to, statements with respect to the following:
• Enercare’s strategic priorities, including future product rollouts, geographic expansion and customer initiatives and the impact on Enercare’s business of the implementation of those strategic
initiatives;
• accretion or other financial enhancements anticipated to arise as a result of the acquisition of SEHAC Holdings Corporation (“Service Experts”) (the “Service Experts Acquisition”) and the impact on
Enercare’s business of the Acquisition;
• Enercare’s growth initiatives in Home Services and Sub-Metering;
• Enercare’s estimated 2016 Canadian income taxes, prospective U.S. tax efficiencies and initiatives and the estimated tax savings from those efficiencies and initiatives; and
• Enercare’s 2016 target capital expenditures, target range of IRR from those expenditures and sources of capital.
These forward-looking statements may reflect the internal projections, expectations, future growth, results of operations, performance, business prospects and opportunities of Enercare and are based on
information currently available to Enercare and/or assumptions that Enercare believes are reasonable. Actual results and developments may differ materially from results and developments discussed in
the forward-looking statements, as they are subject to a number of risks and uncertainties. In developing these forward-looking statements, certain material assumptions were made. These forward-looking
statements are also subject to certain risks. These factors include, but are not limited to:
• actual future market conditions being different than anticipated by management; and
• the failure to realize the anticipated benefits of the Acquisition, strategic initiatives and tax efficiencies.
Material factors or assumptions that were applied to drawing a conclusion or making an estimate set out in forward-looking statements regarding Enercare’s strategic priorities, growth initiatives and the
Acquisition include:
• the view of management regarding current and anticipated market conditions;
• industry trends remaining unchanged;
• the financial and operating attributes of Enercare and Service Experts as at the date hereof and the anticipated future performance of Enercare and Service Experts;
• assumptions regarding foreign exchange rates, income tax rates and commodity prices;
• the extent to which the Service Experts Acquisition is accretive, which may be impacted by the realization and timing of synergies and the operating performance of Enercare and Service Experts;
• assumptions regarding the volume and mix of business activities remaining consistent with current trends;
• assumptions regarding non-recurring transaction costs estimated to be incurred by Enercare in connection with the Service Experts acquisition; assumptions regarding future selling, general and
administration costs estimated to be incurred by Enercare, including in connection with the running of Service Experts; and
• the number of common shares outstanding and remaining constant.
Material factors or assumptions that were applied to drawing a conclusion or making an estimate set out in forward-looking statements regarding income taxes in 2016 and U.S. efficiencies are found on
the slides titled “Understanding our 2016 Canadian Income Taxes” and “Pursuing Prospective U.S. Tax Efficiencies”.
Material factors or assumptions that were applied to drawing a conclusion or making an estimate set out in forward-looking statements regarding capital expenditures in 2016, target IRR ranges and
sources of capital are found on the slide titled “Self-Funding Our Significant Growth in 2016”.
Readers are cautioned that this list of material factors or assumptions is not exhaustive. Although forward-looking statements contained in this presentation are based upon what management believes are
reasonable assumptions, there can be no assurance that actual results will be consistent with these forward-looking statements. Accordingly, readers should not place undue reliance on such forward-
looking statements and assumptions as management cannot provide assurance that actual results or developments will be realized or, even if substantially realized, that they will have the expected
consequences to, or effects on, Enercare. These forward-looking statements are subject to a number of risks and uncertainties that could cause actual results or events to differ materially from current
expectations, including the matters discussed in Enercare’s most recently filed Management’s Discussion and Analysis and in its current Annual Information Form. These forward-looking statements are
subject to change as a result of new information, future events or other circumstances in which case they will only be updated by Enercare where required by law. These forward looking statements speak
as of the date of this presentation.

VISION To be the premier provider of essential
home and commercial services and energy
solutions in North America

5
Evolution of Enercare 1950s - 1999
1999 - 2002
2002 - 2011
2011 - 2015
2015 -
HOME SERVICES
• WATER HEATER
• FINANCIAL
INTEREST
• WATER HEATER SERVICE
• CUSTOMER RELATIONSHIPS
• PROTECTION PLAN & HVAC SALES
2016
2014

6
OHCS: Transformational and Accretive
(1) See “Non-IFRS Financial and Performance Measures” found in Enercare’s MD&A dated May 12, 2016.
(2) Normalized Distributable Cash and Normalized Distributable Cash per common share exclude transaction costs and synergies, and have been normalized by
$19 million in 2015 to account for timing differences in taxes paid related to the acquisition of Direct Energy’s Ontario Home and Small Commercial Services
business (“OHCS”). Gives effect to the 2014 bought deal offering, excluding the over-allotment option.
INTEGRATED
• New brand platform
• New products
• New geographies
TRANSFORMED
• IT
• Culture
• Employees
ACHIEVED • Enhanced service
• Strong organic growth
• Acquisitions
31%
2015 Normalized
Distributable Cash per
common share(1)(2)

7
Service
Experts
Service Experts: A Scalable North American Platform
(1) See “Non-IFRS Financial and Performance Measures” found in Enercare’s MD&A dated May 12, 2016.
(2) Normalized Pro Forma Distributable Cash per common share exclude transaction costs and synergies and have been normalized by $19 million in 2015 and 2016 to
account for timing differences in taxes paid related to the acquisition of Direct Energy’s Ontario Home and Small Commercial Services business (“OHCS”). Gives effect
to the 2016 bought deal offering, excluding the over-allotment option.
2016 Normalized Pro
Forma Distributable Cash per common
share(1)(2)
25%
Enercare Customer Locations Service Experts Locations EENA Commercial National Accounts

8
Evolution of Sub-metering
2008 2010 2012 2013 2014 2015 2016
Acquisition
of
Stratacon
Inc.
Acquisition
of Enbridge
Electric
Connections
Launched
Water
Metering
Product
Acquisition of
Triacta Power
Technologies
Inc.
Launched
Thermal
Metering
Product
Launched
Gas
Metering
Product
Enercare Connections is the largest
private sub-metering company in Canada

9
Listening to Our Investors and Analysts
Based on our preliminary analysis, we believe
we can achieve cost synergies of approximately
5 to 8 cents per share by the end of 2017
Growth Strategy &
Drivers of
Growth
Visibility Aspirational Goals &
Guidance
Synergies Service Experts
Acquisition

10
Enercare S&P/TSX Total Return Index S&P/TSX Small Cap Total Return Index
332
74
112
5-Year Total Return
235
91 115
3-Year Total Return
116
87 92
1-Year Total Return
179
85 101
2-Year Total Return
Return on $100 Investment Over Respective Time Periods
$100
Enercare’s 5-year return is in the top 10% of the
S&P TSX Composite Index
Top TSX Performer

11
$0.65 $0.66 $0.67 $0.68 $0.70 $0.73 $0.84 $0.92
Enercare’s Annualized Dividend per Common Share
+2% +2%
+2%
+2%
+4%
+16%
+42% since 2011
Paid out more than $250(1) million in dividends to our
shareholders since 2011
Returning Significant Capital to Shareholders
+10%
(1) Dividends paid from January 2011 until May 31, 2016.

12
Today’s Agenda
14:00 Welcome & Introductory Remarks John Macdonald, President and CEO
14:15 Sub-metering John Piercy, SVP & General Manager
Kevin Neild, Director Revenue Assurance & Customer Operations
14:45 Home Services Jenine Krause, Chief Operating Officer
15:15 Brand Marketing Lorne Solway, Chief Marketing Officer
15:30 BREAK
15:45 Service Experts Scott Boxer, Chief Executive Officer
16:30 Financial Overview Evelyn Sutherland, Chief Financial Officer

13

14 14
THURSDAY, JUNE 9, 2016

KEVIN NEILD Director Revenue Assurance
& Customer Operations

16
Sub-metering: Gaining Momentum
1. Rising electricity prices drive awareness & demand for sub-metering
2. A growing number of regulatory regimes mandate or support utility sub-metering, which drives significant change in consumption behaviour
3. Compelling business case for property managers & owners – enhancing value of real estate assets
Utility sub-metering is the implementation of a system that
allows a landlord, property developer, firm, condominium association,
homeowners association, or other multi-occupant property to bill
occupants for individual measured utility usage

17
Sub-metering Demand Driven by Rising Electricity Prices
7.5 7.9
8.8 9.1
10.1
11
12.1
6.5 6.8
7.5 7.8
8.6
9.4
10.3
2010 2011 2012 2013 2014 2015 2016
Higher Tier Lower Tier
~8.3 % CAGR tiered
price increase
During the same period CPI had a CAGR of 1.5%, and
Ontario Rent increases had a CAGR of 2.4%
Historical Tiered Rates per Kwh (cents)

18
1.1 TWh/year in electricity savings by full
deployment* or the equivalent of 94,848
homes’ electricity use for 1 year(3)
158 MW – Summer Peak Demand Reduction
by full deployment* or the equivalent to 1,500
average cars(4)
Significant Conservation Benefit & Change in Behaviour(1)
Tenants who pay for their
own electricity consume
40% less on average
What is the conservation potential if Ontario were to introduce sub-
metering for all multi-residential/bulk metered residential properties?
(1) Evaluation of the impact of Sub-metering on Multi-residential Electricity Consumption and the Potential Economic and Environmental
Impact on Ontario prepared by Navigant Consulting Ltd. For Enercare dated January 8, 2016
(2) Based on five year rollout, as per Navigant Report in 2016.
(3) According to the US Environmental Protection Agency’s Greenhouse Gas Equivalencies Calculator
(4) 1 HP = 0.746 kW, so 158 MW is equal to approximately 210,000 HP. An average car (Toyota Corolla for example) has an estimated
engine power of 140 HP and 158 MW gas equivalent power to 1,500 Toyota Corollas.
This is 5 times the net annual savings
of the province’s entire 2014 Consumer
Initiatives Portfolio for conservation(2)

19
Enercare
Individual
Meter
Readings
Bulk
Utility
Line
Sub-metering provides a compelling value proposition
for our clients: cost reductions and energy
conservation benefits
Compelling Business Case - Retrofit

20
Long-Tail Business with Long Duration Contracts Chart Is For Illustrative Purposes Only. Based On An Assumed ‘Typical’ Building*
$(150,000)
$(100,000)
$(50,000)
$-
$50,000
$100,000
$150,000
$200,000
$250,000
$300,000
$350,000
YR1 YR2 YR3 YR4 YR5 YR6 YR7 YR8 YR9 YR10 YR11 YR12 YR13 YR14 YR15 YR16 YR17 YR18
$ C
DN
ECI’s Capital Investment in Meter Hardware & Installation
Net
Revenue
Average length of sub-metering
contract is 18 years
* New Construction 120 units, Net Revenue fee of $20/unit, Capital Cost $800/unit. 18-year average contract life
5.7-Year
Payback
Cash flow Capital
Retest and reseal the meters
Annual Cash flow

21
Integrated Product & Services Offering
Electrical 84.0%
Water 11.7%
Thermal 4.1%
Gas 0.2%
Contracted Units by Service Type – Q1 2016
Solution Includes: financing, hardware, installations, billing
services, customer care & regulatory upkeep
Ontario 94.8%
Alberta 5.0%
Saskachewan 0.2%
Geographies Served Q1 2016

22
Integrated Net Revenues Add to EBITDA Growth
Multi-commodity invoices provide
higher EBITDA / invoice
$19
$17
$14
$12
Electricity Thermal Gas Water
Retrofit New Construction
*Weighted Average, Net Revenue billed/service in May 2016.
Net Revenues*

23
Attractive Market Size and Existing Base (as of Q1 2016)
46% 213,422 54%
New Construction Units Total Number of
Contracted Units
Retrofit Units
Estimated unmetered
units remaining in Ontario**
Estimated units
constructed in Ontario*
*CMHC Housing Market Outlook Ontario Edition, Q2 2016: ~40,000 additional units to be added per year in both 2016 and 2017
** Based on Enercare’s building database using known buildings with estimated number of units (as at Q1 2016)
Sub-metering Services Business Model

24
93
132
156 166
185
205
213
77
94
115
136
151 155 159
50 57
71 82
96 103
107
2010 2011 2012 2013 2014 2015 Q1 2016
Contracted Installed Billing
Unit Continuity (In thousands) 17% CAGR
15% CAGR
16% CAGR
Strong embedded revenues in contracted
units pipeline: 2 to 1 versus billing units
Achieving Scale in Sub-metering

25
A+
Accredited Business
eBilling
34% penetration
OESP
Working Committee
Record Performance in 2015
15% Sub-metering
Revenue
89% Sub-metering
EBITDA
Strong Business Results & Operational Excellence

JOHN PIERCY SVP & General Manager
Sub-metering

27
Contracted
services
growth
Billable
unit
conversion
New
products
New
markets
Economies
of scale
Growth Drivers

Setting Ourselves Apart From the Competition
28
Integrated Design,
Installation & Operations
High Quality Standards
On-time Installations
Regulatory Experts
In-House
Exceptional Customer
Care
Multi-commodity Offerings
Investment Grade Public
Company
Industry Leadership

29
Offering a “Whole Building” Solution
ELECTRIC
THERMAL
GAS WATER
4 Services
4 Admin Fees
1 Bill

30
• Geoexchange
• Geographic Expansion
• Retrofit
• New Construction
• Multi Commodities
Growth Drivers
Drive penetration in existing segments . . . Enter new growth markets
Common infrastructure, including sales,
installations, billing, customer care and servicing
Residential
• Commercial Installations
• Meter Data Management
Triacta Meter Sales
• Canada
• United States
Commercial

31
Sales 20%
Technical 39% Billing
17%
Care 24%
Sub-Metering Employees (excluding Triacta)
Strong Customer Oriented & Technical Organization
Organized to capitalize on
growth opportunities
(100,000)
(75,000)
(50,000)
(25,000)
-
25,000
50,000
75,000
100,000
0
20
40
60
80
100
120
140
160
2013 2014 2015
FTEs Adjusted EBITDA per FTE
Adjusted EBITDA per FTE
$56,238
$86,348
$112,420

32
Strategic Acquisition of Triacta
• Enercare was Triacta’s largest customer
• Triacta has the most advanced
multi-residential sub-metering technology
• Acquisition reduced Enercare’s capital
cost and secured our supply chain
• Allows us to invest in technology that
give us new technical features
• Provides entry point into other geographies
• Creates opportunities for product expansion

33
Leading The Pack
Direct
internet
connectivity
Multi-protocol
out of the box
10-year
seal
period
Software
configurable
Regulatory
approvals for
billing
Direct
factory
support
Triacta’s Competitive Advantages

34
Currently OEM for global
electrical hardware suppliers
Installed in 11 countries & 30 states
and provinces in North America
Growth opportunity in U.S.
as regulations drive demand
New generation meters to be
developed in 2016
Technology Leadership & Growing Market Potential
Triacta PowerHawk Metering System


Home Services THURSDAY, JUNE 9, 2016
37

JENINE KRAUSE Chief Operating Officer
Home Service

Our Platform
39
Employees
Home Services Franchisees
~800 ~450
Service Coverage
Footprint Locations
92% of Ontario 6 Offices
Channels
Franchisees Dealers Contractors
7 36 45

40
Flexible Multi-Channel Operating Model
Maximizes Geographic Coverage
• Operating primarily in GTA,
Southwestern Ontario,
Niagara and Ottawa
• Residential and
commercial customers;
retrofit and new build
• Certified technicians
• Strong sales expertise
• Strong focus on safety
• Operating in GTA, and
Ottawa under long-term
contracts
• Fully branded Enercare
• Residential customers
• Receive royalty on sales
• Access to sales and
technical training and
support
• Must meet Enercare
service, quality and safety
standards
• Established local service
providers in smaller
markets
• Co-branded with Enercare
• Residential customers
• Sales incentives, install
and service fees
• Marketing support provided
• Access to sales and
technical training and
support
• Must meet Enercare
service, quality and safety
standards
Corporate Franchisee Dealers

41
Successfully Completed Integration of OHCS* Acquisition
IT Integration
Customer Operations
Employee
Service
Delivery
New
Products
Enhanced
Service
Offerings
Strong Organic
Growth
Transformed
Achieved Growth
Integrated
Launched several new
products
Rolled-out new service
metrics
Logistics roll out
Employee engagement
Re-established
relationship with the union
Repatriated call centres to
Canada
IT integration
Accelerated rentals
Attrition improvement
Dealer growth
* OHCS refers to the acquisition of Direct Energy’s Ontario Home and Small Commercial Services business.

42
Winning & Growing: Where We Are Today
Strong financial results
Exceptional customer
service
Winning in a competitive
market
Growing products &
services across Ontario

43
Protecting our Business
2002- Present
1M customers billed by Enbridge,
mitigates credit risk as we are entitled
to receive payment in 21 days for
99.51% of cases
2009-Present
Customer education programs
2010-Present
The Buyout Contract: 68% of net book
value is protected by a buyout contract
January 1, 2014
Enhancements to the
Open Bill Access Program
April 1, 2015
Bill 55-The Stronger Protection
for Ontario Consumers Act

44
Rental Units Provide Base for Cross Selling
1.1 Million
Rental Units
Two-thirds of HVAC
units are from protection plan
relationships
543,000
Protection Plans
Other
Products
Opportunity to cross-sell
other products including
plumbing and duct cleaning
4,391
HVAC Units
Installed
Cross-selling
is a key driver of
Enercare’s future
growth
80% of protection plan
customers are cross sold
from the water heater
relationship
Large water heater and
HVAC rental unit base
provides significant
platform for cross-selling
Cross-selling to increase lifetime
value of a customer
45
Increased HVAC Rental Units by 72%
1,750
2,545
4,295
3,013
1,378
4,391
Rental Sale Total
HVAC Transaction Mix
Rental vs Sale
Q1 2016 Q1 2015
$16.18
$24.35 $25.15 $28.63
$40.05
$45.78
Q1 2014 Q1 2015 Q1 2016
Average Monthly Rental
Rate Changes
Additions Attrition
Difference
$12.45
Difference
$15.70
Difference
$20.63
A rental product added to the
portfolio in Q1 2016 was worth
1.7x that of a unit lost to attrition

46
6% 7% 3% 4%
44% 33%
44%
46%
3%
3% 7%
2007 2015
Rental Portfolio Revenue
Increasing Rental Units Margin and Value
Other
Tankless
CV
HVAC
Electric
Product
Gross
Margin $
(excluding other
products
category)
Home Services
revenue is gradually
shifting to higher
margin products
Highest Margin
Lowest Margin
PV

47
The long-term EBITDA
impact of an HVAC rental unit
is ~2.5x that of the short-term
EBITDA on an outright sale
11%
25%
53%
69%
89%
75%
47%
31%
2013 2014 2015 Q1 2016
Split Between HVAC Rentals & Sales
Rentals Sales
Rationale for renting vs. owning
• Peace of mind
• No upfront costs
• Predictable monthly payments
• Preventative maintenance every 1-2 years
• Repairs, parts and labour included
• Priority service
HVAC Evolution: Rental vs. Out Right Sale

48
Long-Term Benefits of Growing HVAC Rental Base
2015 2016 2017 2018 2019 2020 2021 2022 2023
Illustrative Example Only*
of CAGR of HVAC Revenue Assuming 10,000 new units per annum at $80 per month
*This is an illustrative example only and not a forecast.
HVAC rental unit strategy is expected
to provide significant compounded annual growth
over the long-term
($Millions) 2015 2016 2017 2018 2019 2020 2021 2022 2023 Total
Revenue 10 20 30 40 50 60 70 80 90 450
Capital Outlay 50 50 50 50 50 50 50 50 50 450

49
High Return Products
Water Heaters
2015 Capital IRR
$64M* 16% - 21%
HVAC
2015 Capital IRR
$33M* 13% - 20%
*Water heater capex includes new customers and exchange while HVAC capex includes only new customers

50
Revenue per Contract
Focusing on Higher Margin Protection Plans
Q1 2016 Protection Plan Unit Continuity
14,000
Additions
16,000
Attrition
543,000
Contracts
Upselling to HVAC and higher value
products is a key element
of our protection plan strategy
2,000
HVAC Sales
& Rentals
Jan to April
2015
Jan to April
2016

51
Delivering Excellent Customer Service:
A Cornerstone of Customer Loyalty
Delivering Excellent Service
• Focusing on the metrics that matter
• Requesting immediate customer feedback
• Investing in technology for technicians and agents
• Measuring every front line customer facing employee
2014 2015 Q1 2016
Source: Enercare Net Promoter Score Database, April 2016
Improvements in Net Promoter Scores

52
Best Advice
• Understand what
the customers
needs
• Recommend the
right solution for
the customer
• Provide advice on
how the customer
can save money by
maximizing
efficiency
• Safe Installation
aligned with safety
standards
• Ongoing product
maintenance
• Recommend
additional products
as needed
Excellent Service Delivery
Best Technicians
Products Service, Quality & Breadth
Customer
Requirements
Energy
Efficiency Safety
Additional
Products
Best advice is the key to get more of our
products in our customers homes

53
Customer Acquisition Through Channel Investment
Sales expansion to new channels will extend our
reach of products and services in the marketplace
18% Alternate channels will
continue to grow
• Inbound
• Field Cross-sell
• Outbound
• Online & Digital
82% Traditional channels generate
the majority of sales
• Inbound
• Field
• Builder
Traditional Channels Alternate Channels

54
What’s Next
3+ Years
Geographic & Product Growth
Expand customer base
through dealer strategy
Continue growth across Canada,
launch new products that complement
existing services
Whole Home
Grow Rental Continuity
Become trusted service advisor,
deliver multi-product value offering
and increase our share of the household
Innovation
Mobile application launch Lead in connected home; leverage strengths in
service delivery to build customer value
2017 2016

55
• Support our
existing
business
• Build on our
strengths in
heating, cooling
and plumbing
• Continue to
build value in
the whole
home offer
Excellent Service Delivery
Best Technicians
Products Service, Quality & Breadth
Untapped Opportunity: Dealer Expansion & Product Growth
Footprint Expansion
New Product Introduction

56
Pursuing Whole Home
Connected Home Hub
(coming soon)
Furnace or Boiler
Water Heater
Plumbing Air
Quality
Duct
Cleaning
Air
Conditioning
Electrical
(coming soon)
Water Treatment

57
Innovation: Connected Home


Marketing THURSDAY, JUNE 9, 2016

LORNE SOLWAY Chief Marketing Officer

61
Brand Video

62
BRAND PROMISE
BRAND POSITIONING
BRAND STRATEGY
BRAND VISION
Building Our Brand Platform


IS NOW


66
Rebranding Objectives

67
Extensive Rebranding

68

<1% Nov 2014
20% Nov 2015
Dramatically Increased Consumer Awareness
Source: Vision Critical Brand Tracking Study (Wave 2), November 2015
69

43
31 35
28 29
18
Enercare’s Customer Ratings Are Higher
Than Its Key Competitors
Positive Brand Perception
HVAC Water Heaters
Enercare Brand A Brand B Enercare Brand A Brand B
Source: Vision Critical Brand Tracking Study (Wave 2), Nov 2015 70

71
2014 2015 Q1 2016
Rising Net Promoter Scores
Source: Enercare NPS Database, Apr 2016
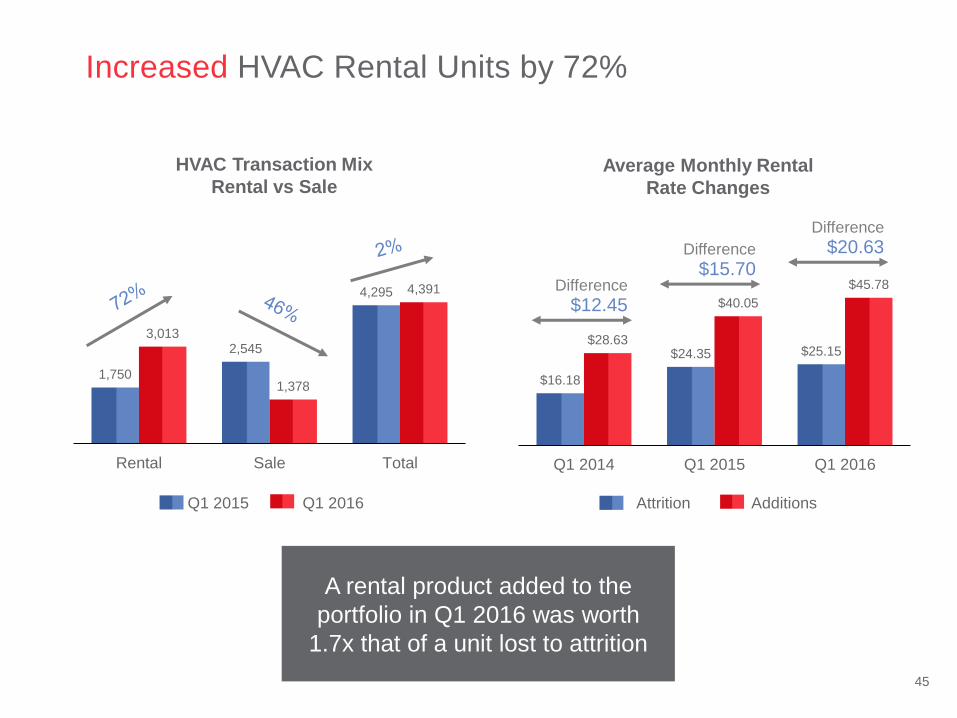
Awareness Scores
Have Improved
Dramatically – Next Up
Is Brand Consideration
2. Brand
Consideration
1. Brand
Awareness
3. Brand Usage
Driving Brand Consideration To Be The Chosen Provider
72

Knowing What Our Customers Want
Easy To Do
Business With
1 Get appointment quickly
2 Fix problem on first visit
3 24/7 Service
4 Emergency after-hours
calls
5 Resolve issue
A Company
I Can Trust
Care About
Its Customers
1 Safe & proper equipment install
2 Reputable professional service
3 Honest in all dealings
4 Stand behind product/services
5 Fair prices
1 Not left without HVAC service
2 Explains work being done
3 Extends equipment life vs sell
4 Offers helpful advice
5 Respects my home
Easy, Trust & Care
underpin our efforts to increase NPS and drive sales
73
Should we outline each of these boxes

74
Creative
Platform
Evolution
New
Cause
Platform
Deeper
Segmentation
&
CRM
Digital
Enablement
Strengthen Our Brand, Build Awareness & Drive Sales

Humanizing our Brand
75

76
Launching our Fresh Start Program

77
Do It For Me Stability Seekers Energy Efficiency
Relevant offers, content and communications drive
higher response rates and return on investment
The Future: Deeper Segmentation & CRM

78
Leading an Industry Transformation

79
Customer Mobile App – Fast & Easy Appointment Scheduling
Driving Sales & Lowering Costs Through Technology

80
Additional Enhancements To Further Drive Sales


82
Service Experts
THURSDAY, JUNE 9, 2016

SCOTT J. BOXER Chief Executive Officer
Service Experts LLC

84
79%
15%
4% 2%
Residential Service,Maintenance & Replacement
Commercial Service,Maintenance & Replacement
ResidentialNew Construction
CommercialNew Construction
SERVICE
REPLACEMENT
2015 Revenue Mix
Leading Provider of HVAC Services
In 2015, Service Experts had more than 645,000 customer
appointments and over 215,000 maintenance plans, serving
over 2,000 homes and businesses each day

85
Residential Service & Replacement Commercial Service & Replacement
81% US $291
11% US $40
7% US $23
1% US $5
SERVICE
79% US $342
15% US $67
4% US $16
2% US $7
Growth Strategy is Paying Off
Strong revenue growth
underlie Service Experts’ attractive free cash flow
2015 Revenue Mix(1)
(US$ millions)
(1) Revenue mix percentages have been normalized to exclude discontinued operations.
Residential New Construction Commercial New Construction
2012 Revenue Mix(1)
(US$ millions)
Total Revenue = US$359 million Total Revenue = US$432 million
7% CAGR
Constant Currency
SERVICE
REPLACEMENT REPLACEMENT

86
Complimentary & Scalable North American Platform
90 locations across US and Canada
29 states and 3 Canadian provinces
41 centers in top 100 MSAs (US)
Locations in 4 of the top Canadian cities
2,800 employees (94% in field)
Enercare Customer Locations
Service Experts Locations
EENA Commercial National Accounts

87
Focused Evolution of Service Experts
2016 2013 2004-5 2000 1996
Lennox Combines
Service Experts and Lennox Retail
(100+125 = 225)
American Capital Acquires
Service Experts from Lennox
(96)
A roll-up of HVAC contractors with strong local
brands across the U.S. and Canada
Enercare Acquires
Service Experts
(90)
Refocus to Service
and Replacement
(125)
Roll-up of U.S.
Contractors
(IPO’d with 12)

88
2010 2011 2012 2013 2014 2015
Revenue (US$ millions)
Dramatic 3-Year Turnaround
Adjusted EBITDA
(US$ millions)
$40
-$40 2010 2011 2012 2013 2014 2015
$500
$300

89
Loss of Accountability Restored Accountability at All Levels
What Happened: 2010-2012
Accumulation of Poor Decisions
• Created a top heavy structure
– field area centralization
– eliminated local P&Ls
– eliminated local GMs
• Corporate driven strategies vs. field
• Eliminated local brands
• Disruption of sales incentive plan
– variable to fixed/variable commission
– talent defection
What Did We Do: 2013 to Present
Made Significant & Permanent Changes
• A flattened structure
– eliminated 80+ field area managers
– restored local P&Ls
– brought back local GMs
• Field support philosophy
• Restored local legacy names (50+ years)
• Restored 100% commissioned sales
• Industry-leading supply agreements
• Strong executive management team
Making The Turnaround Happen
New executive management team brought in
to steer major turnaround

90 [ 90 ]
Steadily Increasing Customer Satisfaction Ratings
Structural
Reorganization
Branding Shift
Customer Satisfaction Ratings (based on ~50K surveys per year)
Service Experts’ customer satisfaction
ratings are at record high levels
2013 New executive
management team

91
Recessionary
Period
HVAC Industry Overview*
• U.S. Market ~ US$82 billion with 3.4% growth 2015-2020 / replacement growth > 6%
• Positive macro factors: confidence, unemployment, housing activity and green regulations
• Possible deraillers: political uncertainty, inflation and weather
105
110
115
120
125
130
135
140
2000 2002 2004 2006 2008 2011 2013 2015
Release of
pent-up
demand
Catch-up on Deferred Replacement
(Pent-up Demand)
Replacement Cycle from Mid-2000
Housing Boom
~9.2 million
homes added
from 2003 to 2007
Growing Housing Stock . . . With Benefit of Significant Pent-Up Demand
3%
4%
5%
6%
7%
8%
9%
10%
2000 2002 2004 2006 2008 2010 2012 2014 2016 2018
% Installed Base Replaced Avg % Replaced
Favourable Outlook for Large & Growing U.S. Market
* Source: Public filings, Company websites, management estimates
IBISWorld Industry Report 23822a Heating & Air-Conditioning Contractors in the U.S. – November 2015
In m
illio
ns

92 Source: Public filings, Company websites, management estimates
IBISWorld Industry Report 23822a Heating & Air-Conditioning Contractors in the U.S. – November 2015
Fragmented and Competitive Landscape
U.S. Canada Regional & Local
Various Regional &
Local Operations
Company-
Owned
Company-
Owned Franchise Franchise
Company-
Owned Company-owned
Revenue:
~$400M
Revenue:
~$700M
Revenue:
~$200M Revenue: n/a
Revenue:
~$500M Revenue: up to $100M
90 locations 70 locations 187 locations 211 locations 19 locations 100,000+ locations
Co-branding National/
Co-branding
Mixed
Branding
Mixed
Branding
National
Branding Local branding
Minimal non-
HVAC services
offered
Plumbing Plumbing
Electric
Plumbing
Electric
Re-model
Home
Protection
Various other non-HVAC
services offered
Service Experts’
Main
Competition

93
Long-Term Business Model Built on Trust
Equipment
Sales
Ancillary
Sales/
Services
Demand
Service
Inspection
& Tune-up
Services
SERVICE
PLANS
50%
50% 50%
50%
75% 75%

94
Expanding through acquisition and
investment
Acquire
strategic
actionable
assets
Expand
service
offerings
Let’s Talk Growth
Search engine optimization (SEO)
Increase average ticket of customer base
Increase outbound marketing effort
Expand National Accounts sales strategy
Executing our core business model to
drive organic growth

95
Driving Engagement Through Effective SEO Marketing
Website Redesign: Primary Goals
Improve user experience
Responsive design
Automated, local website
Robust SEO strategy: traffic to site
Drive online reviews
Key Metric 2015 Change
%
Total Center Visits +104%
Organic Center Visits (SEO) +35%
Center Online Appointments +124%
Non-Center Appointments (.com/.ca) +37%
Online Chat - NEW n/a
Calls from Websites +62%
Google search:
75% of key words on page one
96
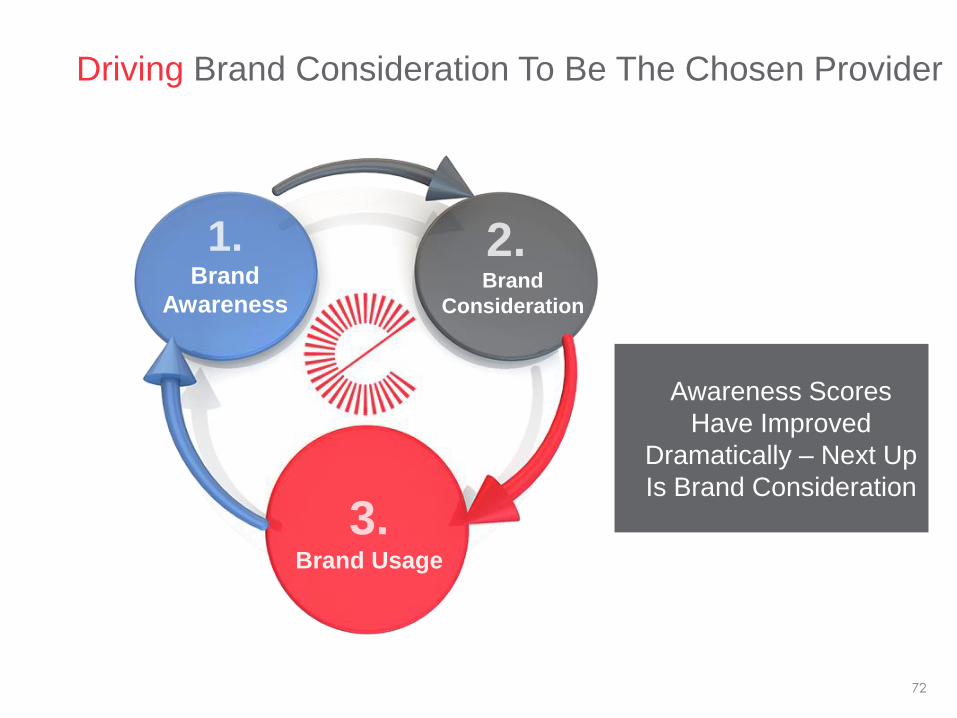
2014A 2015A 2016E
81%
63%
16%
22%
3% 15%
Industry Service Experts
Good Better Best
37%
Higher
End
19%
Higher
End
Increasing Revenue from Our Customer Base
(1) OEM management estimates
(1)
Differentiated High-end Sales Mix
Drive Larger Average Ticket Higher end sales
Good, better, best selling
Best in class long-term financing
Increase Tune-Up Business Expand outbound sales center & drive
recurring business from
non-service plan customers
Outbound Sales Strategy (# of outbound calls)

97
Double-Digit Revenue Growth in National Accounts
Overview
Acquired Engineering Excellence
National Accounts in 2014
Support retail commercial sites in all
50 States, Puerto Rico and Canada
through 750 contractors/self-perform (with
our own technicians)
Growth Initiatives
Penetrate existing accounts:
Top 9 accounts over 17,000 opportunities
Service new accounts
Convert to self-perform
– 5 States to 12
– more attractive to customers
Planned change out of rooftop units
Customer A ~ 60 500
Customer B ~ 200 1,500
Customer C ~ 250 1,400
Customer D ~ 300 500
Customer E ~ 200 2,000
Customer F ~ 150 3,000
Customer G ~ 50 300
Customer H ~ 150 600
Customer I ~ 50 9,000
Total ~ 1,400 ~ 19,000
Client # of Locations
Under Contract
Total Locations
(Approximate)

98
Typical Profile of Acquisition Current Pipeline
Many M&A Opportunities in Highly Fragmented Industry
Highly Fragmented Industry
with Actionable Opportunities
1. Tuck-ins (1 – 2013, 5 – 2014, 3 – 2015)
2. New geographies (1 – 2015)
3. National Accounts Services (1 – 2014)
All HVAC/Plumbing (Service/Replacement)
25-45 Years 10+ Years in Business
All Strong Brand/Reputations
US$10-$40 Million > US$5 Million Revenue
Up to 17K Agreements Strong Service Agreement Base

99
Expanding Our Service Offering
Provides labor
coverage to
complement
manufacturer
parts coverage
Cross-sell
plumbing to
existing customer
base
Training
technicians &
sales consultants
to be holistic
house expert
Large,
underserved
segment in U.S.
Creating options
ULTIMATE LABOR
PROTECTION
PLAN
PLUMBING
HOME
PERFORMANCE
CONTRACTING
RENTAL
MODEL
Significant opportunity to leverage
existing customer base

100
• UBER-like Customer Interactions
• On Time – Right Tech – Right Parts
• Mobile Workforce Optimization
• Eliminate Non-Value Add Functions
– Visibility of Parts Availability
– Automate Back Office Functions
• Enhance Business Intelligence
– Customer + Equipment + History
Focused on Advancing Technology
to Drive Future Sales & Lower Costs
Operational
Efficiency
Transforming
Customer Experience

101
1.1 Million Rentals
545,000 Repair &
Maintenance
Plans
19,000 HVAC Units
Installed
Related
Products &
Services Plumbing
Duct Cleaning
Indoor Air Quality
Energy Audits
700,000 Customer
Appointments
Untapped Value and Organic Growth Potential(1)
(1) Operating statistics for year ended December 31, 2015
215,000+
Maintenance
Plans
645,000
Customer
Appointments
Related
Products &
Services Plumbing
Duct Cleaning
Indoor Air Quality
Energy Audits
33,000 HVAC Units
Installed
Future Rentals
Roll-out schedule for HVAC rental units
Canada – 2016
United States – 2017


103
Financial Overview
THURSDAY, JUNE 9, 2016

EVELYN SUTHERLAND CFO

105
158 165 162 169 183
235
272
2010 2011 2012 2013 2014 2015 PF2015
207 255 276 299
363
564
1,119
2010 2011 2012 2013 2014 2015 PF2015
Total Revenue C$ millions
Acquisition Adjusted EBITDA(1)
C$ millions
Outstanding Growth
(1) See “Non-IFRS Financial and Performance Measures” in Enercare’s MD&A dated May 12, 2016.
(2) Refer to Enercare’s prospectus dated March 22, 2016 for detailed calculations.
(2) (2)

106
188 187 186 189
242
426
2010 2011 2012 2013 2014 2015
Major Catalysts for Future Growth
1 HVAC rentals
2 Improved customer retention
3 New products
4 New geographies
5 Tuck-in acquisitions
First full year with OHCS*
Growth and Evolution of Home Services
Home Services
Revenue C$ millions
* OHCS refers to the acquisition of Direct Energy’s Ontario Home and Small Commercial Services business..

107
$104 $107
Q1 2015 Q1 2016
Home Services Revenue (C$ millions)
~$9.2
+2%
+11%
$9.2 deferral
of revenue in
Q1 2016 due
to HVAC
rental
initiative
Successfully Growing Long-Term Recurring Revenues
The long-term EBITDA* impact of an
HVAC rental unit is ~2.5x that of the
short-term gain on an outright sale
* See “Non-IFRS Financial and Performance Measures” in Enercare’s MD&A dated May 12, 2016.
11%
25%
53%
69%
89%
75%
47%
31%
2013 2014 2015 Q1 2016
Split Between HVAC Rentals & Sales
Rentals Sales

108
Major Catalysts for Future Growth
1 Contracted unit growth
2 Billable unit conversion
3 Operating leverage
4 New products and services
6
15 18 19
22
31
2010 2011 2012 2013 2014 2015
Building Out Sub-metering
Sub-metering
Net Revenue* C$ millions
*Net revenue is a Non-IFRS measure and is calculated using revenue less commodity flow through charges.

109
Understanding Our 2016 Canadian Income Taxes
Deferral of partnership
income
OHCS(1) partial
tax year
Standard current taxes
Original estimate for 2016 Canadian
incomes taxes: C$46-C$53M(2)
(1) OHCS refers to the acquisition of Direct Energy’s Ontario Home and Small Commercial Services business.
(2) Tax guidance is expected to be updated in conjunction with our Q2 2016 earnings release in August 2016, to reflect the acquisition of Service Experts.

110
Pursuing Prospective U.S. Tax Efficiencies
C$26M-$33M
of Annual
Deductions
338 Election(1)
• Allows for full tax basis on US purchase price
• Estimated value of US$65 million on a net present value basis
• Creates approximately C$24-$28 million of tax shield in the US for 15 years
Transfer Pricing(2)
• Providing for the reimbursement of expenses incurred in Canada and charged to the US (tax rate of 26.5% vs. 39.6%)
• Estimated annual cross charge will be between C$2–$5 million
(1) Estimates are subject to change pending the finalization of the purchase price allocation. The estimate is based on a purchase price of C$388 million for Service Experts’ US operations
and a purchase price allocation of an intangible and goodwill value of C$389 million, which for US tax purposes are 100% deductible, straight-line over 15 years. The exchange rate used
was $0.778.
(2) Based on an estimate of corporate expenses incurred to mange and benefit the US operations of Service Experts.

111
Capex Target Range for 2016 IRR Achieved in 2015
HVAC rentals $30M - $40M 13%-20%(3)
Sub-metering growth $10M – $20M 10%-16%(4)
In-house financing $1M - $5M –
Water heater additions $25M – $30M 16%-18%(3)
Water heater
exchanges
$30M – $40M 18%-21%(3)
Corporate $3M – $6M –
Building $12M – $16M –
Total Range $111M – $157M(2) 10%-21%
Cash from Ops
85%
Debt 15%
Sources of Capital
Self-Funding Our Significant Growth in 2016(1)
Uses of Capital – C$ (excluding Service Experts)
(1) Excludes acquisitions.
(2) The target range of capital spend for Home Service is largely based on the number and type of equipment originated (assumed to be approximately 25,000 water heater and water treatment rental
additions, 50,000 water heater exchanges and 10,000 HVAC rental additions) and the mix between rental, sales and financing arrangements similar to actual results experienced in the last 6
months of operations. The target range for capital spend in Sub-metering is based on the number and type of metering equipment installed during the year assumed to be approximately 17,000
units. Corporate capital includes IT software and hardware, furniture and fixtures and other capital projects. The building relates to a new head office to be purchased in Q2 of 2016.
(3) Based on 2015 actual average revenue and cost of goods sold per unit and sales, general and administration (“SG&A”) expenses which were allocated based on the number of incidents or number
of active units, depending on the nature of the expense, over a useful life of 16 years, with revenue price increases of 2.5% per year and expense inflation assumed at 2.25% per year and with a
tax rate of 26.5%.
(4) Based on 2015 actual contracted sales and their respective net revenue per suite, capital cost per suite and based on actual average SG&A costs per billable service for 2015, over an initial meter
seal period of 10 years, a contract length of 18 years, an expense inflation rate of 2.25% per year, price increase inflation of 2.5% per year and with a tax rate of 26.5%.

112
Actual
December 31, 2015
Strong Balance Sheet
BBB+ S&P (DBRS: BBB High)
3.5% Weighted Average
Interest Rate
3.1% Weighted Average
Interest Rate
3.2x Leverage Profile
3.7x Leverage Profile
9.0x(3)
Interest Coverage
8.7x(3)
Interest Coverage
BBB S&P
(DBRS: BBB High/negative)
3.1% Weighted Average
Interest Rate
3.5x(2)(3)
Leverage Profile
8.7x(4)
Interest Coverage
Original Pro Forma
December 31, 2015
(1) Revised Pro Forma balance sheet metrics reflect the cash raised from the over-allotment from the equity issuance, the excess cash as a result of the stronger than expected US/CAD
exchange rate and the reduction in the line of credit from this excess cash.
(2) Calculated using Debt divided by Acquisition Adjusted EBITDA (for a definition, please refer to the Non-IFRS Financial and Performance Measures section in Enercare’s Q1 2016 MD&A
dated May 12, 2016). Pro Forma Acquisition Adjusted EBITDA excludes transaction costs and synergies. Please refer to Enercare’s prospectus dated March 22, 2016 for a definition and
reconciliation of Pro Forma Acquisition Adjusted EBITDA.
(3) Debt excludes pension, other post-employment benefit (OPEB) liabilities and capital lease obligations.
(4) Calculated using Acquisition Adjusted EBITDA (for a definition of this Non-IFRS measure, please refer to the Non-IFRS Financial and Performance Measures section in Enercare’s Q1 2016
MD&A dated May 12, 2016) and excludes the balances associated with OPEB and capital lease obligations.
BBB S&P
(DBRS: BBB High/negative)
Revised Pro Forma
December 31, 2015(1)

113
Creating Value for Shareholders
Investing in growth
Increasing our
distributable cash
Returning capital through dividends and buying back our shares


115
Investor Day
THURSDAY, JUNE 9, 2016