Embed Size (px)
Citation preview
Jennie-O Turkey Store
Hormel Foods Corporation
Mike Tolbert, President
Investor Day2007
October 9, 2007

Hormel Foods Corporation
2007 Turkey Industry Ranking
CompanyMillion LW Lbs.
2007Changevs 2006
Butterball, LLC 1,375 +26Jennie-O Turkey Store 1,290 +25Cargill 961 EvenHouse of Raeford 250 EvenPerdue, Inc. 256 +7Virginia Poultry Growers Coop. 225 EvenFoster Farms 244 +21Bil Mar (Sara Lee) 220 EvenFarbest Foods, Inc. 280 +67Prestage Foods 236 +26Kraft Foods, Inc 213 +8 SURVEY TOTALS 7,151 307WATT PoultryUSA - Feb 07 (+4%)

Hormel Foods Corporation
New Competitive Environment
Butterball acquired by Maxwell Farms/Smithfield Foods; Aug 2006

Hormel Foods Corporation
Effect of Pounds Slaughtered on Price (2-year price cycles)
-0.6
-0.4
-0.2
0
0.2
0.4
0.6
0.8
95-97 97-99 99-01 01-03 03-05 05-07Live Weight Gain (Billion Lbs) Breast Meat Price Change ($/Lb)
Correlation used to equate to at least a $.10 lb change in breast meat prices for every 100 MM change in live lbs….is this a short term deviation, or have the market dynamics changed?

Hormel Foods Corporation
Live Production Expansion
6779
6043
3704
3077
2277 7096
6960
12591158
743507301231160
0
1000
2000
3000
4000
5000
6000
7000
8000
1975 1980 1985 1990 1995 2000 2005
Total Industry LW lbs JOF/TTS/J-OTS LW lbs
2005200019951990198519801975
17.7%16.6%11.0%8.4%8.1%7.5%7.0%J-OTS
5.2%3.9%3.0%3.5%2.7%2.4%TTS
11.5%7.0%5.4%4.6%4.8%4.6%JOF
MM LBSMM LBS

Hormel Foods Corporation
Macroeconomic Indicators
Cold storage up 3% vs last year and 1% under the 5-year averageTotal slaughter pounds, head killed and poult placements all up 4%Live weight per head flat versus year agoExport volume +5%, dollars +16%
Driven by Mexico and China
Industry continues to struggle with livability (-1.2%)

Hormel Foods Corporation
Livability Initiatives
Goal:Improve livability from 82% to 85%
improves bottom-line by $12 MM.
Four key processes have been identified that will provide improvements in livability.
BreedingHatchingBroodingFinishing
Hormel Foods Corporation
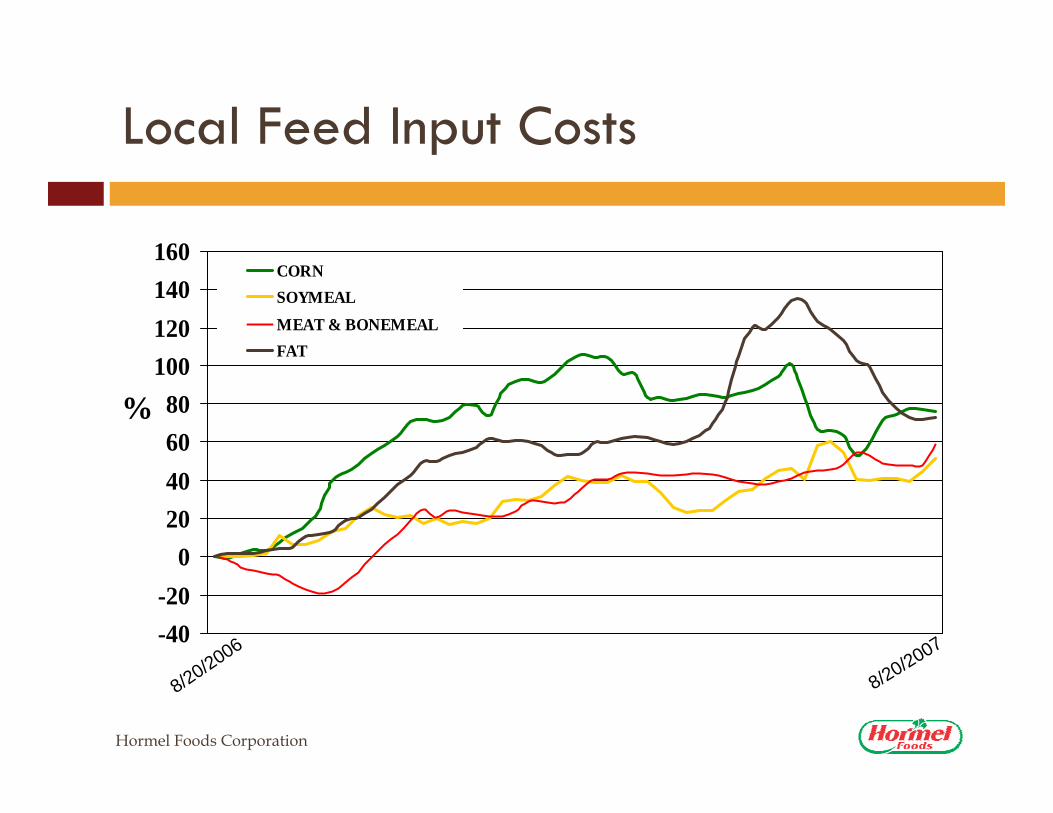
Local Feed Input Costs
-40-20
020406080
100120140160
CORNSOYMEALMEAT & BONEMEALFAT
8/20/2006
8/20/2007
%

Hormel Foods Corporation
Why did corn prices jump?
Ethanol usage growth
Accelerating Demand!
Grain Market Risk Management
0
5
10
15
20
25
30
35
2000 2006 2007 2008
% of corn crop used for Ethanol
19801982
19841986
19881990
19921994
19961998
20002002
20042006
2008*
0
500
1,000
1,500
2,000
2,500
3,000
3,500
4,000
4,500
5,000
5,500
6,000
Corn Used for Ethanol
MM
Bus
hels
Market RISK!

Hormel Foods Corporation
Outlook
2007 corn crop largest everCurrent price $3.43 per bushel
Market is already thinking of 2008What crops will get the acreage?
CornSoyWheat
Weather

Hormel Foods Corporation
Hormel’s Expectations forJennie-O Turkey Store
Generate Value-Added Volume Growth“Growth Area” of storeUnderdeveloped proteinReduce exposure to commodity swings
Improve Margin Contribution50 basis points per year improvement
Be Judicious with New Capital
Hormel Foods Corporation
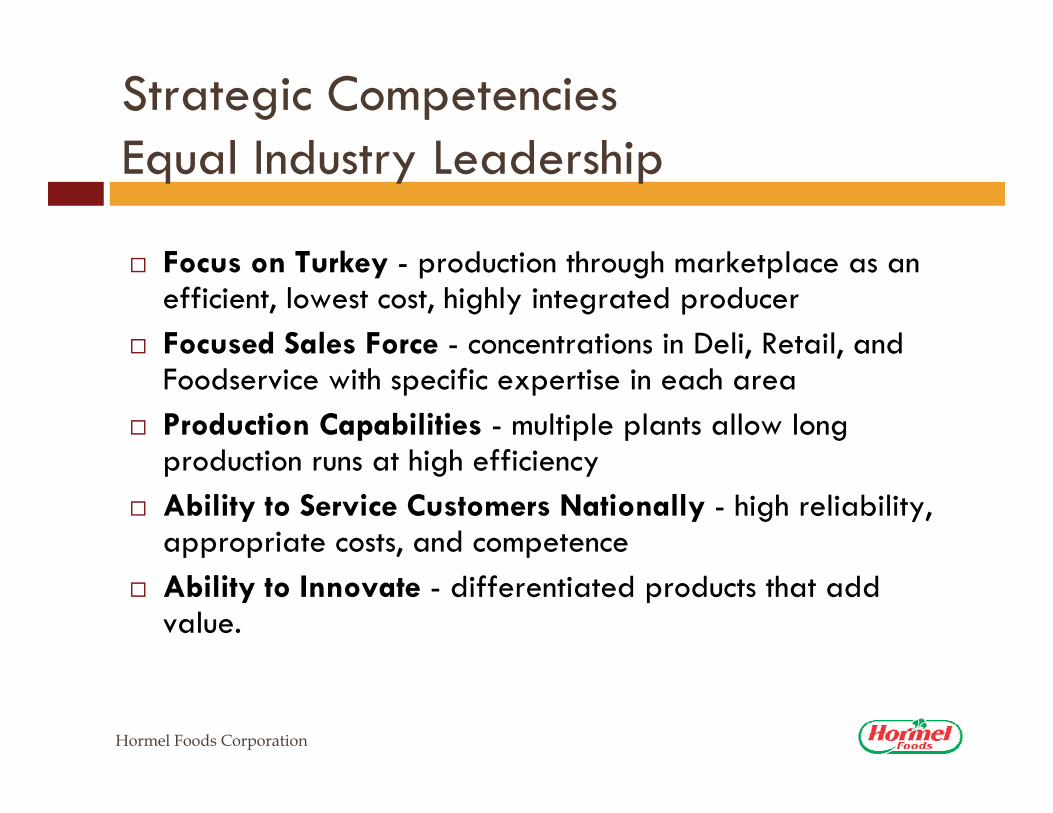
Strategic Competencies Equal Industry Leadership
Focus on Turkey - production through marketplace as an efficient, lowest cost, highly integrated producerFocused Sales Force - concentrations in Deli, Retail, and Foodservice with specific expertise in each areaProduction Capabilities - multiple plants allow long production runs at high efficiencyAbility to Service Customers Nationally - high reliability, appropriate costs, and competenceAbility to Innovate - differentiated products that add value.

Hormel Foods Corporation
Jennie-O Turkey Store Initiatives
Leverage new R&D Pilot Plant and Product Lifecycle Management process to expand sales of new products Use the JENNIE-O TURKEY STORE brand to go after a premium position in whole birds.Challenge live production, operations, and distribution areas to deliver a zero total annual cost increase (net of feed costs) between 2007 and 2008.Raise the bar on food safety by implementing USDA-approved interventions on all ready to eat products …qualifying for “Level II” status.

Hormel Foods Corporation
Agristats Heavy Tom Cost per Live Wholesome Pound
Difference: $.01/lbValue: $10.3 MM
$0.40
$0.38
$0.38
$0.38
$0.39
$0.39
$0.40
$0.40
Industry Jennie-O Turkey Store
Dol
lars
per
Liv
e W
hole
som
e L
b.
Heavy Tom>40 lb Live WeightJune 2006 - May 2007

Hormel Foods Corporation
Value Added vs Commodity Net Sales Split
* Restated to 52-week
64%65% 64%
68% 70%
36% 35% 36% 32% 30%
$0$100$200$300$400$500$600$700$800$900
$1,000
2003 2004* 2005 2006 2007 est.
Value Added Commodity
-10.1%9.6%9.4%-2.4%Commodity8.9%4.2%13.8%6.1%Value Added
200620052004*2003
-0.3%8.6%
2007 est.
Percentage of Growth Over Previous Year

Hormel Foods Corporation
Retail and FoodserviceTotal Burger Volume
2003 2004 2005 2006 2007 est.MM LBS MARGIN PER LB

Hormel Foods Corporation
Portfolio
Healthier alternatives to traditional offerings
Retail, FoodserviceGround turkeySausages and BratsBurgersBaconFranks
Deli, FoodserviceMultiple 98% fat free optionsLow sodium/No salt added, sliced

Hormel Foods Corporation
Oven Ready Boneless& Bone-In Breasts
Fully Cooked Turkey Brats
Fully CookedTurkey Meatballs
Fully CookedTurkey Sausages
Crunchy Dogs
Ongoing Emphasis on Innovation and Healthy Alternatives
PREP CHEF™
ARTISAN ROASTED™Turkey Breast
Scooby Doo Franks

Hormel Foods Corporation
2003 2004 2005 2006 2007 est.
Continued Success inNew Product Development
CAGR29%

Hormel Foods Corporation
Communication
Television
National Print
Online

Hormel Foods Corporation
The Biggest Loser Promotional Video

Hormel Foods Corporation
Health and WellnessConsumer Spectrum
Mid-Level46%
Uninvolved29%
Core25%
No Diet,Not Active
20%
No Diet,Active
9%
Small Portions,
Active13%
Own Diet,Active
22%
Right Foods,Active11%
Diets,SupplmtActive +
9%
Diets,Organics Active +
16%

Hormel Foods Corporation
Fresh Tray Pack & MarinatedCreative Brief
GET Engaged cooks
TO Use Jennie-O Turkey Store products to expand their cooking repertoire
BY SAYING You won’t believe what you can do with turkey when you use Jennie-O Turkey Store fresh products.

Hormel Foods Corporation
Fresh Communications Support
POPPrint
Sampling Program
Online
TV
Health Club Program

Hormel Foods Corporation
“Mannequin”

Hormel Foods Corporation
Fresh Tray Pack & Marinated Advertising
Hormel Foods Corporation
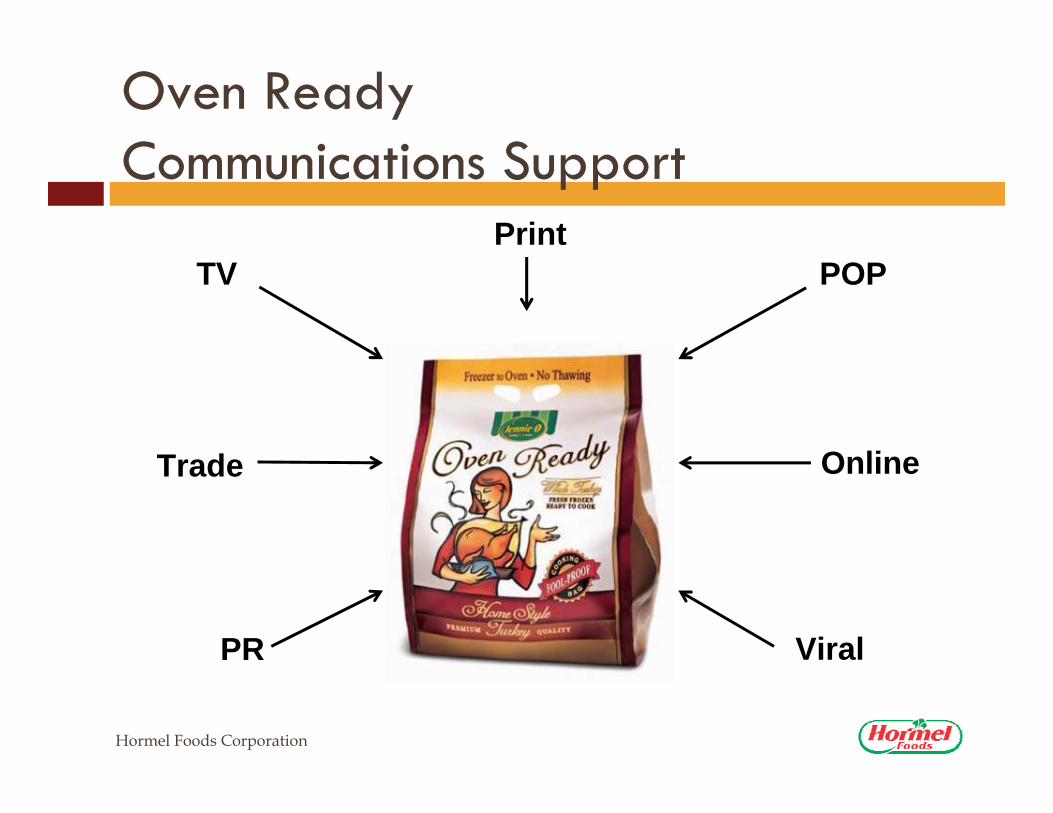
Oven Ready Communications Support
TV POPPrint
Trade Online
ViralPR

Hormel Foods Corporation
“Aprons Away”

Hormel Foods Corporation
Oven Ready TV Creative
“Aprons Away” :30 Spot
Message: Oven Ready Turkey liberates you from the hassles of preparing a Thanksgiving turkey

Hormel Foods Corporation
“Turkey Wrestling”

Hormel Foods Corporation
Value Added Price Increases0.
02 0.03
0.11
0.13
0.02
0.07
0.08
0.17
0.03
0.02
0.05
0.16
0.02
0.05 0.09
0.15
$0.00
$0.02
$0.04
$0.06
$0.08
$0.10
$0.12
$0.14
$0.16
$0.18
Retail Foodservice Deli Value Added
Q1 Q2 Q3 2008

Hormel Foods Corporation
Summary
Profitability in 2008 will improve based on full year impact of price increases implemented in 2007.
Ongoing commitment to margin integrity and pricing leadership isparamount!
Our strategies have us positioned to expand the turkey protein, the JENNIE-O TURKEY STORE brand, and enterprise accomplishments going forward
Low cost and vertical integrationMarket and channel expertiseSingular focus on expanding the turkey protein to everyday/all meal occasion through great taste, innovation, and adding value.

Hormel Foods Corporation
Jennie-O Turkey Store
Q&A