Embed Size (px)
Citation preview
Investor Booklet
August 2019

2
Legal Disclaimer
This presentation includes forward-looking statements within the meaning of Section 27A of the Securities Act of 1933 and Section 21E of the Securities and Exchange Act of 1934. All statements other than statements of historical facts included in this presentation regarding, among other things, our prospects, plans, financial position and business strategy, may constitute forward looking statements. These statements are based on the beliefs and assumptions of our management and on the information currently available to our management at the time of such statements. Forward-looking statements generally include discussions and descriptions other than historical information. These forward-looking statements can generally be identified as such because the context of the statement will include words such as "trend," "may," "annualized," "should," "outlook," "project," "intend," "seek," "plan," "believe, "anticipate," "expect," "estimate," "potential," "continue," "goal," or "opportunity," the negatives of these words, or similar words or expressions. The forward-looking statements made herein are only made as of the date of this presentation and we undertake no obligation to publicly update such forward looking statements to reflect subsequent events or circumstances. Although we believe that the expectations reflected in these forward-looking statements are reasonable, these expectations may not prove to be correct. All subsequent written and oral forward-looking statements attributable to us or persons acting on our behalf are expressly qualified in their entirety by the cautionary statements included in this document. These forward-looking statements are subject to risks and uncertainties that are discussed in greater detail in the Company’s filings with the Securities and Exchange Commission, including our Annual Reports on Form 10-K and Quarterly Reports on Form 10-Q, that may cause actual results to differ materially.

3
Company OverviewContinental is a leading, high margin manufacturer of gypsum wallboard and complementary finishing products
• Market position: Leader in core geographic regions
• Plants: 3 drywall manufacturing facilities (owned)2 joint compound facilities (owned) 1 joint venture paperboard liner facility
• Manufacturing: 3.4 billion square feet; operated at 83% capacityutilization in 2018
• Key financials: Total revenue of $518.2 mm(LTM 6/30/2019) Adj. EBITDA1 of $143.4 mm (27.7% margin)
• Headquarters: Herndon, Virginia
2018 Sales Breakdown by Country
Geographic Footprint
Palatka, FL
Silver Grove, KY
Buchanan, NY
Herndon, VA
Lynchburg, VA
Chambly, Quebec
Canada North Central North East South East
Corporate Wallboard Plants Joint Compound
Paperboard Liner
United States95%
Canada5%
(1) Non-GAAP measure. See the appendix to this presentation for a reconciliation thereof to the relevant GAAP financial measure and the legal disclaimer page of this presentation for a discussion of why it is useful to investors.

4
Solid Platform for Generating Strong Shareholder Returns
Attractive Market Position
• Over 55% of US wallboard demand in our addressable markets
• Plants strategically located close to end markets for freight and service advantage
• Strong customer relationships and growing markets driving revenue growth Sustainable
Platform for
EBITDA and
Cash Flow
GenerationStrategic Raw Material Supply
• Primary and secondary gypsum supply contracts furnish ample gypsum for long-term horizon
• Seven Hills joint venture provides a captive, low cost paper supply
• Readily available natural gas hedged for ~50% of rolling energy needs
Low-Cost, Efficient Capacity
• Invested in state-of-the-art capacity, creating some of the fastest industry line-speeds
• Bison Way lean manufacturing eliminating waste and improving cost position
• Technology and automation investments driving efficiencies and lowering costs
Strict Capital Deployment
• Strategic capital program focused on high return projects
• Strong financial position with Net Debt / LTM EBITDA1 ratio steady at 1.1x as of June 30, 2019
• Repurchased over $200M of shares since January 1, 2015
(1) Non-GAAP measure. See the appendix to this presentation for a reconciliation thereof to the relevant GAAP financial measure and the legal disclaimer page of this presentation for a discussion of why it is useful to investors.
5
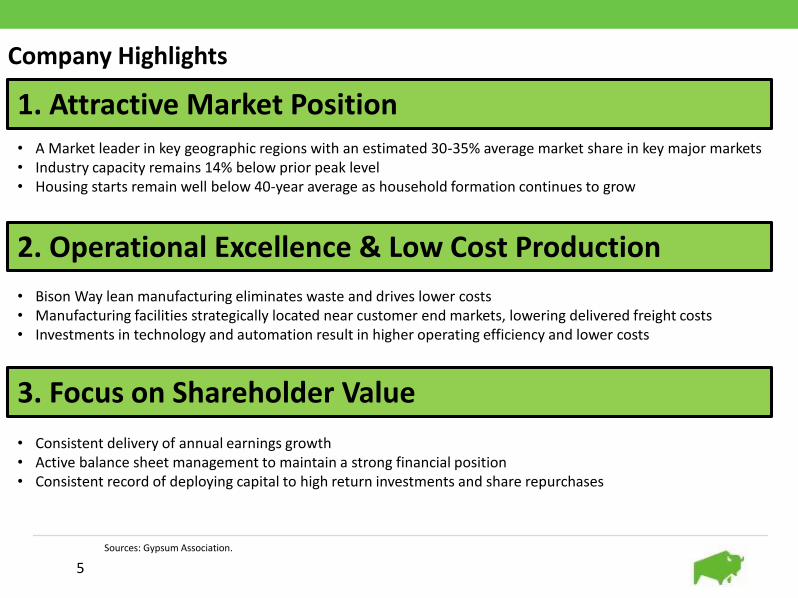
Company Highlights
2. Operational Excellence & Low Cost Production
1. Attractive Market Position
3. Focus on Shareholder Value
• Bison Way lean manufacturing eliminates waste and drives lower costs• Manufacturing facilities strategically located near customer end markets, lowering delivered freight costs• Investments in technology and automation result in higher operating efficiency and lower costs
• A Market leader in key geographic regions with an estimated 30-35% average market share in key major markets• Industry capacity remains 14% below prior peak level • Housing starts remain well below 40-year average as household formation continues to grow
• Consistent delivery of annual earnings growth• Active balance sheet management to maintain a strong financial position• Consistent record of deploying capital to high return investments and share repurchases
Sources: Gypsum Association.

6
1. ATTRACTIVE MARKET POSITION & GROWTH PROSPECTS

7
Attractive Market Opportunity with Favorable Demand TrendsHousing starts have rebounded from lows but still remain below long-run average
US Population(mm)
179.3
Long Term Average Housing
Starts at 1.4mm per Annum3
203.2
Period
Housing Starts
(in thousands)
Housing Starts 2018(1)
(in thousands)
Percentage
Difference
Peak (2) 2,357 1,247 89%
Long-Term Average (3) 1,432 1,247 15%
Average Cyclical Low (4) 1,035 1,247 (17%)
Source: US Census Bureau.
(1) Average of monthly housing starts, as reported by the
US Census Bureau through December 2018.
(2) Peak occurred in 1972.
(3) Average of annual housing starts from 1959 through
2018.
(4) Calculated as the average of 1960, 1966, 1975, 1982,
1991 and 2009 annual housing starts.
226.5 248.7 281.4 320.1
0
500
1,000
1,500
2,000
2,500
3,000
1958 1960 1962 1964 1966 1968 1970 1972 1974 1976 1978 1980 1982 1984 1986 1988 1990 1992 1994 1996 1998 2000 2002 2004 2006 2008 2010 2012 2014 2016 2018
Actual Housing Starts Long-term Average
Housin
g S
tart
s (
000's
)

8
Wave of Millennial Demand Set to Enter Home Buying Market (2)
…and PositiveGrowth
Indicators Remain
ExpectedNew Housing
Starts Continue to Grow In Line
with GDP…
____________________(1) U.S. Census Bureau, RISI Economic Outlook and Wall Street Research.(2) CoreLogic via Bank of America(3) Fred Economic Data via Freddie Mac
Interest Rates Remain Near Historic Lows since 1989 (3)
U.S. Housing Starts (1)
(New Housing Starts in thousands)
0510152025303540
4.2
4.3
4.4
4.5
4.6
4.7
4.8
21 22 23 24 25 26 27 28 29 30 31 32 33 34 35 36 37
Number of Million Persons in 2017 by AgeHome-Purchase Loan Applications per 1,000 Persons
Majority of millennials are aged between 26-27
Growth Fundamentals Remain in U.S. Housing Market
906
554 587 609 781
925 1,003 1,112 1,174 1,203 1,250 1,230 1,260
-
500
1,000
1,500
2008 2009 2010 2011 2012 2013 2014 2015 2016 2017 2018 2019E 2020E
0.0%
2.0%
4.0%
6.0%
8.0%
10.0%
12.0%
4.2% Current Rate
6.4% 30 Year Average

9
Wallboard Demand Highly Correlated to Improving Housing Starts
Source: Gypsum Association (wallboard demand) and U.S. Census Bureau (housing starts).
0.0
500
1,000
1,500
2,000
0
5
10
15
20
25
30
35
40
1990 1992 1994 1996 1998 2000 2002 2004 2006 2008 2010 2012 2014 2016 2018
Wallboard Demand New housing starts (thousands)
(BS
F)
(th
ou
san
ds)

10
R&R and Commercial Provide Firm Base of ActivityR&R Provides Additional Support to Construction Demand(RMI Index - Quarterly)
Commercial Construction Stable with Strong Upside(million sq. ft.)
Pent-up demand from underspending expected to continue to drive growth
15
20
25
30
35
40
45
50
55
60
2001 2002 2003 2004 2005 2006 2007 2008 2009 2010 2011 2012 2013 2014 2015 2016 2017 2018
0
400
800
1,200
1,600
2,000
1990 1992 1994 1996 1998 2000 2002 2004 2006 2008 2010 2012 2014 2016 2018E

11
Industry Dynamics Remain Favorable
Industry Capacity Rationalized
(Billions of sq. ft.)
CBPX Capacity Utilization and Mill-Net Price Still Below Peak
(CBPX Mill-Net price per thousand sq. ft., MSF)
1997 Industry Capacity Share
5%
4%
4%
Republic
31%
22%19%
5%
Briar3%
2%
26%10%
22%
16%
12%
2018 Industry Capacity Share
10%4%
Source: Management estimates, Gypsum Association and public corporate presentations.
39.6
34.0
2008 2018
87%
65%60%
54% 53% 55% 58%63%
66% 67%
79% 81% 83%
$187
$129
$96 $104 $99 $98
$124
$146 $155 $154
$144 $147 $154
2006 2007 2008 2009 2010 2011 2012 2013 2014 2015 2016 2017 2018

12
2. OPERATIONAL EXCELLENCE & LOW COST PRODUCTION

13
Mission of The Bison Way
Create a Competitive Advantage by
Operating Our Business More Efficiently Than Our Competitors
Extending Our Low Cost Position
Capitalizing on Growth Opportunities
Delighting Our Customers

14
Significant Energy Consumption Reduction
40
45
50
55
60
65
70
1.8
1.9
2
2.1
2.2
2.3
2.4
2.5
2.6
2.7
2007 2008 2009 2010 2011 2012 2013 2014 2015 2016 2017 2018
Gas Usage Electric Usage
Context
Energy Costs One of the largest cost items in the manufacturing process
Energy Reduction 18% since 2007
Per MSF

15
Freight Optimization Supports Low Cost Leadership
234
236
238
240
242
244
246
248
250
2016 2017 2018
Miles per Load
Miles per Load
Context
Freight Cost Largest Cost Item on P&L
Miles per Load 4% reduction since 2016
Shipping Radius 250 - 300 miles

16
High Return Projects Driving Out Costs
• High return capital investments partially offset the inflationary environment• Target internal rates of return of 20% • Projects range across many areas, including raw materials, freight, plant
efficiency, and customer service excellence• Strong track record of performance since inception and anticipation of incremental
savings of $3M in 2019
$ in millions 2017 2018 2019E Totals
High Return Capital Spend $11 $17 $15
Incremental Savings $4 $3 15%-20% Average IRR
Annual Savings $4 $7 $11Cumulative
Savings

17
Secure Long-Term and Cost Competitive Gypsum SupplySecure Long-Term Supply
• CBP long-term agreements provide exclusive rights to synthetic gypsum over 10-25 years
• Existing synthetic gypsum contracts and natural gypsum fines achieve all of current production needs and capable of supplying all of needs at full capacity
• Significant synthetic gypsum remains untapped and more wallboard grade gypsum coming on-line
• 10 million tons of unused synthetic gypsum in 2017 (1) (represents approximately 12.5 BSF of wallboard production) – equivalent to roughly all the wallboard produced from synthetic gypsum in 2018
• Estimate 2.5-3 million annual tons of wallboard grade synthetic gypsum to come on-stream on the Ohio River network over next 5 years, outpacing production announced to go off-line (2)
• Abundant supply of natural gypsum fines provides a secure alternative to synthetic gypsum and forecasted to be 15% of CBP gypsum usage in 2019
Cost Competitive Supply
• Existing agreements provide a base price with escalation provisions
• Estimate delivered gypsum costs escalate at a CAGR of 3% to 5% from 2019-2029
• Net annual price increase of less than 1% required to offset estimated gypsum cost increase over that same time period
(1) Source: American Coal Ash Association
(2) CBP estimates for synthetic gypsum production from coal fired power plants along the Ohio River network within a 300 mile radius of the Silver Grove, KY
wallboard plant

18
3. FOCUS ON SHAREHOLDER VALUE

19
$311
$402 $425 $422 $461
$489 $528
2012 2013 2014 2015 2016 2017 2018
Improving Top Line with Plenty of Headroom for GrowthVolume(millions of square feet, mmsf)
Total Capacity: 3,300 mmsf 564 mmsf of head room
Mill-Net Price Per MSF
Capacity Utilization
Total Net Sales($ in millions)
1903
2161 2180 2199
2560
26662736
65%
66% 67% 79%
81% 83%8300%
2012 2013 2014 2015 2016 2017 2018
$124
$146 $155 $154
$144 $147 $154
2012 2013 2014 2015 2016 2017 2018

20
Disciplined Financial Management and Cash Flow Generation
Adjusted EBITDA1
($ in millions)
% Adj. EBITDA Margin
Total Capex($ in millions)
Capex as a % of Net Sales
Net Debt1
($ in millions)
Net Debt / Adj. EBITDA1
(1) Non-GAAP measure. See the appendix to this presentation for a reconciliation thereof to the relevant GAAP financial measure and the legal disclaimer page of this presentation for a discussion of why it is useful to investors.
$125M $134M $136M$151M
29.7%
29.0%
27.8%
28.6%
26.0%
27.0%
28.0%
29.0%
30.0%
0
50
100
150
200
2015 2016 2017 2018
2.4% 2.5%
4.5%
5.8%$10M$12M
$22M
$31M
$-
$10
$20
$30
$40
0.0%
2.0%
4.0%
6.0%
8.0%
2015 2016 2017 2018
$280M
$220M $197M$151M
2.2x1.6x 1.5x
1.1x
0.0%
1.0%
2.0%
3.0%
0
100
200
300
2015 2016 2017 2018

21
Capital Deployment Focused on Shareholder Returns
• Invested $25M in capital investments for high return projects since 2017
• Consistent track record of share repurchases since inception of $300M program.
• As of June 30, 2019, $111M remains on $300M share repurchase plan
• Share repurchases have had an accretive impact of $0.14 on EPS for YTD 2019

22
MANAGEMENT TEAM

23
Experienced and Highly Aligned Management Team
Dennis Schemm Senior VP, CFO
Jay BachmannPresident, CEO
David BriggsSenior VP, Sales
Bruce Major Senior VP, Manufacturing and Supply Chain
• Leads the Company since its divestment from Lafarge SA with >20 years of building materials industry experience
• Prior positions
• Chief Financial Officer, USA (Lafarge NA)
• Senior Vice President Finance - Investor Relations (Lafarge SA)
• Senior Vice President Controller (Lafarge NA)
• Joined the Company in 2015 with >20 years of manufacturing experience
• Prior positions
• Vice President of Global Finance for Armstrong Flooring (Armstrong Worldwide)
• Director of Global Financial Planning and Analysis (Gilbarco, a Danaher Company)
• Senior Financial Roles (Monsanto Company)
• Promoted in 2017 with >20 years of building materials industry sales experience
• Prior positions
• General Manager Southeast (CBP)
• General Manager Southeast (Lafarge NA Gypsum Division)
• Regional Sales Manager (Dietrich)
• Joined the Company in 2016 >20 years in gypsum operations and manufacturing management
• Prior positions
• Vice President Manufacturing (Lafarge NA Cement U.S.)
• Senior Vice President Manufacturing (Lafarge SA Gypsum Division)
• Vice President Manufacturing (Lafarge NA Gypsum Division)

24
APPENDIX

25
Recent Operating and Financial PerformanceQ2 2019
vs.
($ in millions) 2017 2018 Q2 2018 Q2 2019 Q2 2018
Mill-Net Price ($/MSF) $146.92 $153.83 $153.88 $143.77 -6.6%
Wallboard Volume (MMSF) 2,666 2,736 722 678 -6.1%
Total Net Sales $489 $528 $139 $124 -10.8%
Operating Income $90 $107 $31 $19 -38.7%
Adjusted EBITDA1 $136 $151 $41 $33 -19.5%
% Margin 27.8% 28.6% 29.7% 26.5% -320 bps
Depreciation and Amortization $46 $44 $11 $10 -9.1%
Capital Expenditures $22 $31 $7 $6 -14.3%
(1) Non-GAAP measure. See the appendix to this presentation for a reconciliation thereof to the relevant GAAP financial measure and the legal disclaimer page of this presentation for a discussion of why it is useful to investors.
26
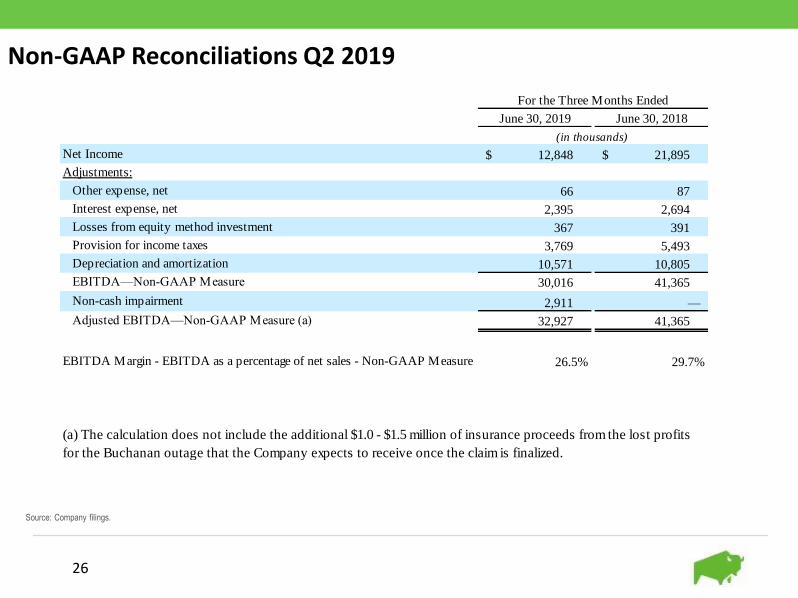
Non-GAAP Reconciliations Q2 2019
Source: Company filings.
June 30, 2019 June 30, 2018
Net Income 12,848$ 21,895$
Adjustments:
Other expense, net 66 87
Interest expense, net 2,395 2,694
Losses from equity method investment 367 391
Provision for income taxes 3,769 5,493
Depreciation and amortization 10,571 10,805
EBITDA—Non-GAAP Measure 30,016 41,365
Non-cash impairment 2,911 —
Adjusted EBITDA—Non-GAAP Measure (a) 32,927 41,365
EBITDA Margin - EBITDA as a percentage of net sales - Non-GAAP Measure 26.5% 29.7%
For the Three Months Ended
(in thousands)
(a) The calculation does not include the additional $1.0 - $1.5 million of insurance proceeds from the lost profits
for the Buchanan outage that the Company expects to receive once the claim is finalized.

27
Non-GAAP Reconciliations 2015-2018
Source: Company filings.

28
Net Debt Reconciliation
Source: Company filings.