Embed Size (px)
Citation preview

© MERCER 2016 0
H E A L T H W E A L T H C A R E E R
N O R T H C A R O L I N A S U P P L E M E N T A L R E T I R E M E N T P L A N S F E B R U A R Y 1 5 , 2 0 1 7 Liana Magner, CFA Kelly Henson Will Dillard, CFA
I N V E S T M E N T S T R A T E G Y D I S C U S S I O N

© MERCER 2016 1
C O N T E N T
• DC Trends and Investment Structure
• Active vs. Passive
• Liquidity Sleeves
• Brokerage Window
• Retirement Income
• Benchmark Review
• ETF Discussion
• Appendix

© MERCER 2016 2
K E Y TA K E AWAY S F R O M S U B - C O M M I T T E E M E E T I N G
Category Action Rationale Next Steps
Plan Structure
Consolidate the style specific domestic equity options into two core offerings (large cap and SMID cap) in order to reduce style biases across participant base.
Value bias exists, particularly among the Small/Mid Cap options. Consolidation could also reduce confusion among participants and improve asset allocation
North Carolina IMD and Mercer to work on the construction of the underlying Large and Small/Mid Cap Funds
Liquidity Sleeve
Consider adding liquidity sleeves to all active funds to manage daily cash flows in the funds and lower fund costs
Currently, participant cash flows are hitting the manager accounts. Adding an index component to each of the funds would limit the need for managers to hold or raise cash unexpectedly.
North Carolina and IMD to work on the target liquidity sleeve
allocation in each active Fund.
Brokerage Window
Do not offer a brokerage window in the Supplemental Retirement Plans
Only small percentage of participants actually use brokerage windows. They also come with higher fees, administrative complexities and regulatory concerns
None
Use of ETFs
Do not utilize ETF’s in the Supplemental Retirement Plans, although they may be an option for the 403 (b) Plan, which is limited to mutual funds
ETF’s are less cost effective (can’t use NC’s Scale) and can provide administrative complexities for the Supplemental Retirement Plans record-keeper and custodian
None
© MERCER 2016 3
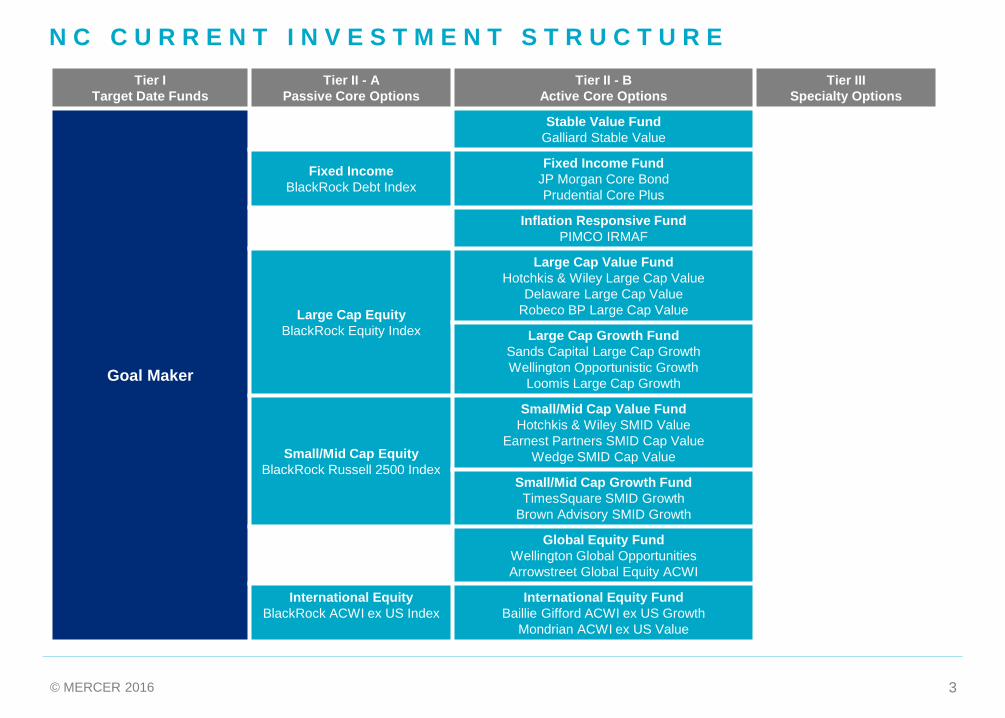
N C C U R R E N T I N V E S T M E N T S T R U C T U R E Tier I
Target Date Funds Tier II - A
Passive Core Options Tier II - B
Active Core Options Tier III
Specialty Options
Goal Maker
Stable Value Fund Galliard Stable Value
Fixed Income BlackRock Debt Index
Fixed Income Fund JP Morgan Core Bond Prudential Core Plus
Inflation Responsive Fund PIMCO IRMAF
Large Cap Equity BlackRock Equity Index
Large Cap Value Fund Hotchkis & Wiley Large Cap Value
Delaware Large Cap Value Robeco BP Large Cap Value
Large Cap Growth Fund Sands Capital Large Cap Growth Wellington Opportunistic Growth
Loomis Large Cap Growth
Small/Mid Cap Equity BlackRock Russell 2500 Index
Small/Mid Cap Value Fund Hotchkis & Wiley SMID Value
Earnest Partners SMID Cap Value Wedge SMID Cap Value
Brokerage Window
Small/Mid Cap Growth Fund TimesSquare SMID Growth
Brown Advisory SMID Growth
Global Equity Fund Wellington Global Opportunities Arrowstreet Global Equity ACWI
International Equity BlackRock ACWI ex US Index
International Equity Fund Baillie Gifford ACWI ex US Growth
Mondrian ACWI ex US Value

© MERCER 2016 4
N C R E C O M M E N D E D I N V E S T M E N T S T R U C T U R E
Tier I Target Date Funds
Tier II - A Passive Core Options
Tier II - B Active Core Options
Tier III Specialty Options
Goal Maker
Stable Value Fund Galliard Stable Value
Fixed Income BlackRock Debt Index
Fixed Income Fund JP Morgan Core Bond Prudential Core Plus
Inflation Responsive Fund PIMCO IRMAF
Large Cap Equity BlackRock Equity Index Large Cap Equity Fund
Small/Mid Cap Equity BlackRock Russell 2500 Index Small/Mid Cap Equity Fund
Brokerage Window
Global Equity Fund Wellington Global Opportunities Arrowstreet Global Equity ACWI
International Equity BlackRock ACWI ex US Index
International Equity Fund Baillie Gifford ACWI ex US Growth
Mondrian ACWI ex US Value
Consolidates style specific options into
blended approach

© MERCER 2016 5
U N D E R S TA N D I N G N O R T H C A R O L I N A’ S PA R T I C I PA N T B E H AV I O R S *
Category Measure Score Comments
Diversification
Large number of single fund balance holders (over 33% of non-GoalMaker participants) Targeted communication opportunity
High allocation to Stable Value Fund across all age groups for participants outside of the GoalMaker Funds
Targeted communication opportunity
Strong use of GoalMaker Program (over 59% of participants)
Review glidepaths of the program to make sure they are appropriate.
Style Bias Value bias among the mid/small cap options Consolidating style options to core lends to a more balanced style exposure
Market Cap Bias NC participants exhibit a smaller capitalization bias relative to the Russell 3000 benchmark
Streamlining US equity options simplifies choices and lends to better asset allocation decisions
Home Country Bias
NC participants are significantly underweight non-US equity (by 30% in most age groups)
Home country bias has benefited participants recently, but portfolio theory supports global approach. Targeted communication opportunity
Conservative Allocation
Younger NC participants outside of the Goalmaker program generally have a very conservative allocation
Targeted communication opportunity on the importance of capital appreciation and compounding returns over time
No Action Required Consideration Action Required
* Full demographic analysis available upon request

© MERCER 2016 6 © MERCER 2016 6
DC TRENDS AND INVESTMENT STRUCTURE

© MERCER 2016 7
D C L I T I G A T I O N B E C O M E S G R O W T H I N D U S T R Y
• Explosion in DC litigation heightens risk for plan fiduciaries ‒ More law firms are pursuing DC litigation ‒ Litigation is moving down stream to smaller plans ‒ Solicitation of plan participants has increased
• Recent lawsuits expand areas of litigation, including ‒ Fee sharing arrangements between managed-account provider and recordkeeper ‒ Offering, and (paradoxically) not offering a stable value fund ‒ Offering inappropriate investment class (e.g., sector fund) ‒ Excessive fees related to custom target-date funds ‒ Higher-priced share classes for proprietary funds accessed though brokerage window ‒ Delaying implementation of investment fee reductions
Committees should ensure that process, oversight, training, execution and documentation are all functioning at the highest level.
GuideSpark Financial Wellness survey, February 8, 2016

© MERCER 2016 8
B U I L D I N G A S U C C E S S F U L D C P R O G R A M F O C U S O N B E T T E R P A R T I C I P A N T O U T C O M E S
$0
$200,000
$400,000
$600,000
$800,000
$1,000,000
$1,200,000
$1,400,000
Savings at Retirement
25 bps Fee ReductionIncrease Return 1%Base Case
Base Case Assumptions: Starting salary $40,000 at age 25, Balance at age 65, 2.5% annual salary increase, 9% total annual contribution, 7% return assumption, 75bps fees
Wealth Accumulation
Many levers beyond investment returns
Holistic DC plan management services with the goal of better financial
outcomes for Plan participants

© MERCER 2016 9
B E S T P R A C T I C E S F O R D C P L A N S
The choice of investment vehicle can materially impact fees.
Plan sponsors should benchmark and negotiate investment fees regularly.
Alternatives to mutual funds should be considered as they increasingly become available to DC Plans.
Review investment lineup to ensure that it meets the needs of participants- offering a streamlined approach with diversified choices.
Mercer’s Investment Philosophy
Streamlined Line up Broad use of institutional vehicles
Best in class managers Use of custom, multi-manager funds
Customize to employee profile Disaggregated fees
Evaluate target date fund to ensure that approach and glidepath is appropriate for participant base.
Use participant demographics to inform changes to the line up and offerings.

© MERCER 2016 10
D C P L A N S T A T I S T I C S
S O U R C E : 2 0 1 6 D C P L A N S P O N S O R D E F I N E D C O N T R I B U T I O N S U R V E Y – M E G A P L A N S ( > $ 1 B ) ; 5 8 T H A N N U A L P S C A S U R V E Y O F P R O F I T S H A R I N G A N D 4 0 1 ( K ) P L A N S ( R E F L E C T I N G 2 0 1 4 P L A N E X P E R I E N C E - P L A N S W I T H > 5 , 0 0 0 P A R T I C I P A N T S
2016 PLANSPONSOR DC Survey
PSCA Annual Survey
Average number of investment options offered 18.9 16.0
Median number of investment options offered 15.0
Median number of passive investment options offered 4.0
% of Plans offering alternative investments 6.0% 8.8%
% of Plans offering ETFs 6.0% 0.0%
% of Plans offering a lifetime income option 9.5%
Average number of investment options held by participants
4.2
Median number of investment options held by participants 4.0
% of Plans who re-enrolled participants not invested in default
3.6%
% of Plans using annual re-enrollment campaigns 25.8%
% of all Plans offering brokerage window 18.7%
% of mega Plans offering brokerage window 49.6%
Plans using automatic enrollment 63.7% 69.7%
Plans offering auto escalation (of those that offer AE) 72.2% 66.7%

© MERCER 2016 11
I N V E S T M E N T S T R U C T U R E P H I L O S O P H Y
Disengaged
• Rarely reviews portfolio
• No engagement in investment allocation decisions
• Lacking in investment knowledge, interest and/or time to proactively manage investments
• Wants professional assistance managing investment exposure over time
• Reviews overall investment allocation occasionally
• Wants control over major shifts in allocation
• Limited engagement on implementation, rebalancing and other shorter-term issues
• Frequently reviews portfolio
• Utilizes full range of investment options
• Wants to control all key investment allocation decisions
“Do it for me” Investor
“Guide me” Investor
“Let me do it” Investor
B E H A V I O R A L F I N A N C E - O N E S I Z E D O E S N O T F I T A L L

© MERCER 2016 12
A L T E R N A T I V E 1 : S E G M E N T E D A C T I V E E Q U I T Y O P T I O N S Do it for me Guide me Let me do it
Tier I Target Date Options
Tier II Passive Core Options
Tier III Active Core Options
Tier IV Specialty Options
Target Date Funds
Capital Preservation
Diversified Fixed Income
Diversified Fixed Income
Real Assets
US Large Cap Equity US Large Cap Equity
US SMID Cap Equity
US SMID Cap Equity
World ex-US Equity
World ex-US Equity
One fund per category allows for focus on asset allocation through building blocks.

© MERCER 2016 13
A L T E R N A T I V E 2 : C O N S O L I D A T E A C T I V E E Q U I T Y T O O N E G L O B A L O P T I O N
Do it for me Guide me Let me do it
Tier I Target Date Options
Tier II Passive Core Options
Tier III Active Core Options
Tier IV Specialty Options
Target Date Funds
Capital Preservation
Diversified Fixed Income
Diversified Fixed Income
Real Assets
Large Cap Equity
Global All Cap Equity Small/Mid Cap Equity
World ex-US Equity
Brokerage Window (Optional)
Maintains asset class building blocks within the index tier. Consolidates active equity into one custom global portfolio.

© MERCER 2016 14
A C T I V E V S P A S S I V E C O N S I D E R A T I O N S
Alternative 1: Passive Only
Guide me
Tier II Passive Core Options
Diversified Fixed Income
Real Assets
US Large Cap Equity
US SMID Cap Equity
World ex-US Equity
• For those clients who prefer an alternative approach to active versus passive management, we explore alternative options.
Alternative 2: Active Options in Less Efficient Markets
Guide me
Tier II Passive Core Options
Tier III Active Core Options
Capital Preservation
Diversified Fixed Income
Diversified Fixed Income
Real Assets
US Large Cap Equity
US SMID Cap Equity
US SMID Cap Equity
World ex-US Equity
Emerging Markets
Alternative 3: Blended Options
Guide me
Tier II Core Options
Diversified Fixed Income
Real Assets
US Large Cap Equity
US SMID Cap Equity
World ex-US Equity

© MERCER 2016 15
A C T I V E V S P A S S I V E C O N S I D E R A T I O N S
Guide me
Tier II Passive Core Options
Tier III Active Core Options
Capital Preservation
Diversified Fixed Income
Diversified Fixed Income
Real Assets
US Large Cap Equity US Large Cap Equity
US SMID Cap Equity
US SMID Cap Equity
World ex-US Equity
World ex-US Equity
• In the context of DC plans, we do believe there is benefit in providing plan participants with a choice between active and passive management in the major asset categories that predominantly cover the investable landscape. This building block approach provides participants with: – A low cost, index choice within each asset category – A managed choice with the potential opportunity for value added at a higher fee
• The below construct is most prevalent within Mercer’s client base.

© MERCER 2016 16 © MERCER 2016 16
ACTIVE VS. PASSIVE

© MERCER 2016 17
N O R T H C A R O L I N A A C T I V E O F F E R I N G S
Guide me
Tier III Active Core Options
Diversified Fixed Income
Large Cap Growth
Large Cap Value
Mid/Small Cap Value
Mid/Small Cap Growth
World ex-US Equity
Global Equity
• Even though there are fewer market opportunities and the median active manager performance has trailed the market benchmark, North Carolina has been able to construct their large cap investment funds with high tracking error managers that complement one another. Additionally, North Carolina has negotiated an attractive fee schedule given assets.
• Mercer believes that there are more market opportunities in the mid/small cap market and historically active managers have been able to add alpha over the benchmark.
• Historically global equity managers have had trouble adding alpha net of fees, although NC Fund has had success due to strong performance of underlying managers and the lower negotiated fees
• US fixed income managers have been able to add value historically and we believe there are market opportunities given the cap weighted construction of the Barclays Aggregate Index (Treasury and Agency debt represents over one third of the index).

© MERCER 2016 18
I N V E S T M E N T P H I L O S O P H Y O F A C T I V E T I E R
FTSE RAFI Fundamental Index, 13.3%
FTSE RAFI Low Vol Index,
13.3%
S&P 500 Index, 13.3%
LCV Manager 2, 15.0%
LCV Manager 1, 15.0%
LCG Manager 2, 15.0%
LCG Manager 1 , 15.0%
Sample Blended Large Cap Equity Fund
What is the Active Tier Philosophy?
1) How active should the active options be?
2) Would a blended approach be preferred over a fully active portfolio?
3) Should there be a different philosophy depending on each markets’ efficiency?
4) Is there a target fee budget or target risk budget?
Hotchkis & Wiley LCV,
16.7%
Boston Partners LCV,
16.7%
Delaware LCV, 16.7%
Sands LCG, 16.7%
Loomis LCG, 16.7%
Wellington LCG, 16.7%
Sample Fully Active Large Cap Fund
© MERCER 2016 19
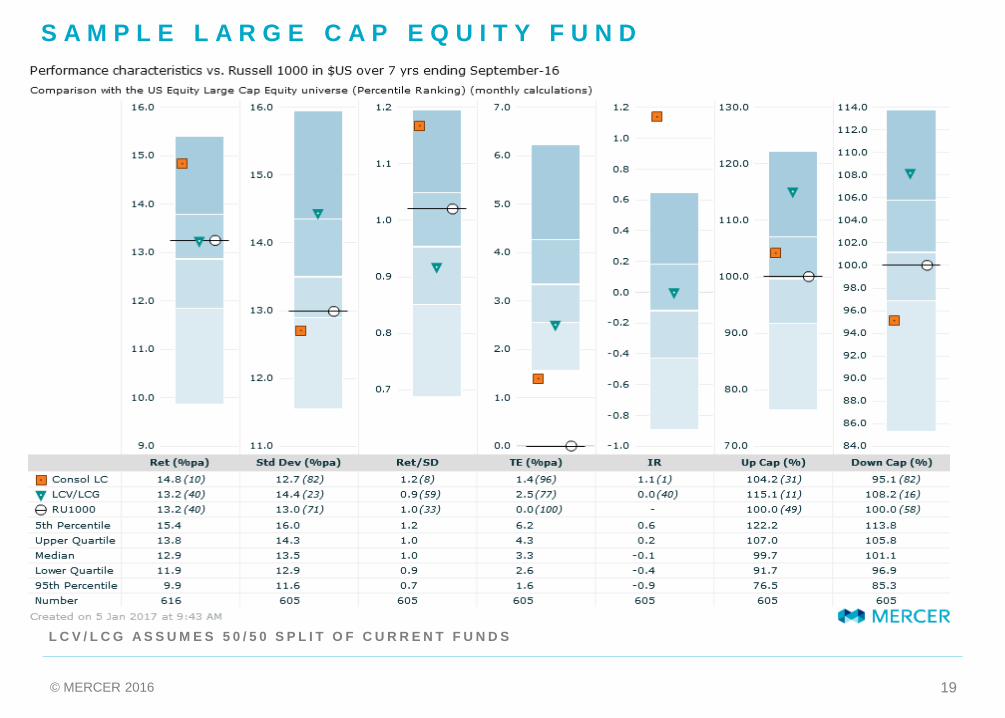
S A M P L E L A R G E C A P E Q U I T Y F U N D
L C V / L C G A S S U M E S 5 0 / 5 0 S P L I T O F C U R R E N T F U N D S

© MERCER 2016 20
S A M P L E L A R G E C A P E Q U I T Y F U N D E X P E C T E D R E T U R N S – ( 1 0 Y E A R A S S U M P T I O N S )
Weight Passive
Compound Return
Active Net Rtn
Active Risk (TE) Info Ratio Fee Total Risk
(SD)
Total Net Return
(Comp Geo)
S&P 500 Index 13.3% 6.7% 0.00% 0.0% 0.00 0.01% 18.06% 6.65% FTSE RAFI 1000 Index 13.3% 6.7% 0.20% 2.0% 0.10 0.08% 18.53% 7.23% MSCI US Low Vol Index 13.3% 6.8% 0.50% 5.0% 0.10 0.08% 14.62% 7.02% LCV Manager 1 15.0% 6.7% 0.75% 5.0% 0.15 0.50% 18.74% 7.30% LCV Manager 2 15.0% 6.7% 0.60% 4.0% 0.15 0.31% 18.50% 7.19% LCG Manager 1 15.0% 6.7% 1.28% 8.5% 0.15 0.52% 19.96% 7.63% LCG Manager 2 15.0% 6.7% 0.60% 4.0% 0.15 0.41% 18.50% 7.19% Total 100.0% 6.7% 0.29% 1.3% 0.23 0.28% 17.57% 6.99%
Weight Passive
Compound Return
Active Net Rtn
Active Risk (TE) Info Ratio Fee Total Risk
(SD)
Total Net Return (Comp Geo)
Hotchkis LCV 16.7% 6.7% 0.8% 5.00% 0.15 0.50% 18.7% 7.3% Delaware LCV 16.7% 6.7% 0.6% 4.00% 0.15 0.30% 18.5% 7.2% Sands LCG 16.7% 6.7% 1.3% 8.50% 0.15 0.52% 20.0% 7.6% Loomis LCG 16.7% 6.7% 0.6% 4.00% 0.15 0.40% 18.5% 7.2% Wellington LCG 16.7% 6.7% 0.6% 4.00% 0.15 0.35% 18.5% 7.2% Boston Partners LCV 16.7% 6.7% 0.6% 4.00% 0.15 0.34% 18.5% 7.2% Total 100.0% 6.7% 0.34% 2.28% 0.15 0.40% 18.2% 6.98%
Sample LC Portfolio
50/50 split of LCG/LCV Funds
Risk adjusted return projected to be higher for the proposed LC portfolio, given the lower overall risk of the portfolio.
*Projected fees based target weights and 9/30/16 assets of the Large Cap Growth and Value Funds, using NC’s negotiated fee schedules

© MERCER 2016 21
F E E S A V I N G S C A N H A V E A L A R G E I M P A C T O N R E T I R E M E N T S A V I N G S O V E R A L I F E T I M E
$1,051,972
$293,944
$30,130
$-
$200,000
$400,000
$600,000
$800,000
$1,000,000
$1,200,000
$1,400,000
$1,600,000
Savings at Retirement
12 bps in fee savings1% increase in returnBase Case
Base Case Assumptions: Starting salary $40,000 at age 25, Balance at age 65, 2.5% annual salary increase, 9% total annual contribution, 7% return
• Over a participants lifetime, saving 12 basis points annually can make a big dollar impact at retirement (30K)

© MERCER 2016 22
G U I D I N G P R I N C I P L E S M E R C E R ’ S B E L I E F S
• We believe that the success of active management at the investor level is driven by three interconnected considerations:
• That is, active management should be pursued in markets (if any) which offer the opportunity for the skilled investment manager to better forecasts and results provided its insights can be implemented fully, cost-effectively and the investor’s governance structure and behaviours conform to certain standards.
1
• R A W M A R K E T P O T E N T I A L F O R O U T P E R F O R M A N C E
2
• I N V E S T M E N T M A N A G E R I S S U E S
3
• I N V E S T O R D E C I S I O N A N D P R O C E S S I S S U E S

© MERCER 2016 23
M A R K E T P O T E N T I A L F A C T O R S T O C O N S I D E R
B R E A D T H I N S I G H T D I V E R S I F I C A T I O N
P R I N C I P L E W I D E P O O L O F I N V E S T M E N T O P P O R T U N I T I E S
A V A I L A B I L I T Y O F B E T T E R I N F O R M A T I O N O R B E T T E R J U D G E M E N T O V E R T H E A V A I L A B L E I N F O R M A T I O N
N O T O V E R L Y D E P E N D E N T O N S I N G L E S E C T O R S O R S E C U R I T I E S
D R I V E R S
• Breadth of market – Number of investible securities
• Market liquidity – Ideally, a market should have sufficient liquidity that positions can be efficiently implemented – Not be so liquid as a result of efficiency that any price discrepancy has disappeared too quickly to be captured by active management
• Information flow – What is the quality of the available information/ research on a security? – How fast and widely is that information disseminated?
• Degree of institutionalization – What level of sophistication does a ‘typical’ investor exhibit in a particular marketplace, do they have access to quality research or information on a security?
• Non profit maximising participants – For example, regulations, taking positions to meet other goals (e.g. liability driven investors)
• Efficient trading – Do highly efficient trading and settlement systems exist in the market in order to effectively capture opportunities?
• Low correlation – Level of differentiation in stocks/sectors in a market, that is, low correlation amongst securities in a market is ideal from an active management perspective
• Market structure / concentration – Ideally, a market should not be highly concentrated in a small number of large names, so positions taken by active managers are more symmetric in nature

© MERCER 2016 24
A C T U A L D E L I V E R Y O F O U T P E R F O R M A N C E E Q U I T Y M A R K E T S
• The following tables show the historical excess returns of the median manager across equity markets over the 1,3,5 and 10 years to 31 December 2015, on both a gross and net of fees basis.
• ‘Chain linked’ annual medians have been used to reduce survivorship bias issues.
• To highlight evidence of ‘alpha’ we have ranked the 10 year excess historical performance of each asset class on the following basis:
A L P H A R A N K I N G ( % P A )
H I G H Greater than 2.00%
G O O D 1.00% to 2.00%
M E D I U M 0.50% to 1.00%
S O M E 0.00% to 0.50%
L O W Less than 0.00%
• The results on a gross and net of fee basis indicate: – The median developed global equity manager has
modestly outperformed the index on a gross of fees basis in the long term. Fees have eroded the alpha gained over the 10 year period to December 2015
– US large cap equity managers have provided some evidence of outperformance, gross of fees, over time. However, there is no evidence of outperformance net of fees, across any periods analysed
– Strong evidence of outperformance by the median small cap manager over the 10 year period
– The median emerging market manager has provided evidence of outperformance over the 10 years gross of fees. However, high fees have eroded most the alpha gained, with net results behind over the 10 year period

© MERCER 2016 25
E Q U I T Y M A R K E T S : A C T I V E M A N A G E R R E L A T I V E P E R F O R M A N C E , G R O S S O F F E E S
1 ‘Chain linked’ median manager annual return versus index in $US to 31 December 2015. Indices used are provided in the Appendix 2 Evidence of skill grading (“alpha ranking”) based on rolling 10 year median of universe and index returns 3 Based on Mercer’s Global Asset Management Fee Survey 2014 for a $100m mandate. $US Segregated vehicles have been used where available
A S S E T C L A S S
M E D I A N V E R S U S I N D E X ( G R O S S O F F E E S ) 1 ( % P A ) T Y P I C A L
F E E H U R D L E 3
A L P H A R A N K I N G 2
1 Y E A R
3 Y E A R S
5 Y E A R S
1 0 Y E A R S
Global Equity 0.40 -0.17 -0.50 0.38 0.66 S O M E
Global ex-US Equity 0.60 0.32 0.46 0.94 0.65 M E D I U M
US Large Cap Equity 0.30 0.19 0.04 0.08 0.50 S O M E
Global ex-US Small Cap Equity 4.40 3.18 2.95 1.69 0.89 G O O D
US Small Cap Equity 2.30 1.82 2.00 1.03 0.79 G O O D
Emerging Markets Equity 1.00 1.36 1.02 0.74 0.88 M E D I U M

© MERCER 2016 26
E Q U I T Y M A R K E T S : A C T I V E M A N A G E R R E L A T I V E P E R F O R M A N C E , N E T O F F E E S
1 ‘Chain linked’ median manager annual return versus index in $US to 31 December 2015. Results obtained by deducting the average manager fee shown on previous slide 2 Evidence of skill grading (“alpha ranking”) based on annual rolling 10 year relative returns
A S S E T C L A S S
M E D I A N V E R S U S I N D E X ( N E T O F F E E S ) 1 ( % P A )
A L P H A R A N K I N G 2
1 Y E A R
3 Y E A R S
5 Y E A R S
1 0 Y E A R S
Global Equity -0.26 -0.83 -1.16 -0.28 L O W
Global ex-US Equity -0.05 -0.33 -0.19 0.29 S O M E
US Large Cap Equity -0.20 -0.31 -0.46 -0.42 L O W
Global ex-US Small Cap Equity 3.51 2.29 2.06 0.80 M E D I U M
US Small Cap Equity 1.51 1.03 1.21 0.24 S O M E
Emerging Markets Equity 0.12 0.48 0.14 -0.14 L O W

© MERCER 2016 27
A C T U A L D E L I V E R Y O F O U T P E R F O R M A N C E F I X E D I N C O M E M A R K E T S
• The following tables show the historical excess returns of the median manager across fixed income markets over the 1,3,5 and 10 years to 31 December 2015, on both a gross and net of fees basis.
• ‘Chain linked’ annual medians have been used to reduce survivorship bias issues
• To highlight evidence of ‘alpha’ we have ranked the 10 year excess historical performance of each asset class on the following basis:
• The results on a gross and net of fee basis indicate: – Evidence of historic alpha in all aggregate bond
markets, gross of fees, and after fees – Evidence of historic outperformance by the median
non-government global, and US fixed income managers.
– Evidence of historical alpha in high yield debt gross of fees, but only modest alpha, net of fees, over the 10 year period
– Little evidence of historical alpha in emerging market debt, gross and net of fees
A L P H A R A N K I N G ( % P A )
H I G H Greater than 1.00%
G O O D 0.50% to 1.00%
M E D I U M 0.25% to 0.50%
S O M E 0.00% to 0.25%
L O W Less than 0.00%

© MERCER 2016 28
F I X E D I N C O M E M A R K E T S : A C T I V E M A N A G E R R E L A T I V E P E R F O R M A N C E , G R O S S O F F E E S
1 ‘Chain linked’ median manager annual return v index in $US to 31 December 2015. Indices used are provided in the Appendix 2 Based on Mercer’s Global Asset Management Fee Survey 2014 for a $100m mandate. $US Segregated vehicles have been used where available 3 Evidence of skill grading (“alpha ranking”) based on annual rolling 10 year relative returns
A S S E T C L A S S
M E D I A N V E R S U S I N D E X ( G R O S S O F F E E S ) 1 ( % P A )
T Y P I C AL
F E E H U R D L E 2
A L P H A R A N K I N G 3
1 Y E A R
3 Y E A R S
5 Y E A R S
1 0 Y E A R S
Global Fixed 0.20 0.38 0.68 0.64 0.35 G O O D
US Fixed 0.20 0.38 0.48 0.63 0.28 G O O D
US Government 0.40 -0.02 -0.41 -0.15 0.23 L O W
Global Non-Government 0.50 0.76 0.70 0.95 0.35 G O O D
US Non-Government 0.50 0.56 0.67 0.74 0.29 G O O D
Global High Yield 2.10 1.71 1.05 0.68 0.50 G O O D
Emerging Markets Debt -1.00 -0.84 -0.21 0.15 0.55 S O M E

© MERCER 2016 29
F I X E D I N C O M E M A R K E T S : A C T I V E M A N A G E R R E L A T I V E P E R F O R M A N C E , N E T O F F E E S
1 ‘Chain linked’ median manager annual return versus index in $US to 31 December 2015. Results obtained by deducting the average manager fee shown on previous slide 2 Evidence of skill grading (“alpha ranking”) based on annual rolling 10 year relative returns
A S S E T C L A S S
M E D I A N V E R S U S I N D E X ( N E T O F F E E S ) 1 ( % P A ) A L P H A
R A N K I N G 2 1 Y E A R
3 Y E A R S
5 Y E A R S
1 0 Y E A R S
Global Fixed -0.15 0.03 0.33 0.29 M E D I U M US Fixed -0.08 0.10 0.20 0.35 M E D I U M Global Government 0.00 0.51 0.67 0.36 M E D I U M US Government 0.17 -0.25 -0.64 -0.38 L O W Global Non-Government 0.15 0.41 0.35 0.60 G O O D US Non-Government 0.21 0.27 0.38 0.45 M E D I U M Global High Yield 1.60 1.21 0.55 0.18 S O M E Emerging Markets Debt -1.55 -1.39 -0.76 -0.40 L O W

© MERCER 2016 30
I M P A C T S L I M I T S O N M A N A G E R S ’ B E S T I D E A S P O R T F O L I O S
• Investment ideas have a limited capacity for investment.
A L P H A C A P A C I T Y
• Historically, many investment products have often been over-diversified due to: − A limited market for concentrated best ideas portfolios (until more recent years) − Managers’ business models require a range of mandates to meet market needs − Managers are incentivised to ration best ideas portfolios
P R O D U C T D E S I G N
• Assets under management drives revenue, profitability and market-value of investment management firms. – A manager just needs to avoid underperforming to risk termination and reduction in assets under management
• Performance based fees, if well structured, can provide a better alignment between the manager and the client.
I N C E N T I V E S T R U C T U R E

© MERCER 2016 31
E Q U I T Y M A R K E T S C O N C L U S I O N
Asset class
Market opportunity
(ex ante)
Actual manager results
(ex-post)1
Active management
conviction Rationale Preference
US Large Cap Low Low Low
• High institutional ownership, the availability of information, greater number of analyst coverage and liquidity makes the large cap market efficient
• No evidence of historic alpha by the median US large cap manager over periods analysed, net of fees
For passive management (in particular alternative indexation), unless investor has ability to use high tracking error mandates and has robust governance structure
Small Cap High High High
• Inefficient market due to less available information, fewer market participants and lower institutional ownership
• Long data history available showing strong evidence of added value by active managers
Clear preference for active management
Global Emerging Markets
High Low Medium
• Relatively inefficient and highly volatile markets provide opportunity
• Alpha has generally been added by active managers gross of fees, but results after the high fees in the sector are modest or negative over all periods.
• However, even passive managers typically modestly underperform in this sector
For active management if: • Investors have strong
conviction in managers’ skill
• Attractive manager fees can be negotiated (compared to the typically high fees in the sector)
1 Based on “alpha ranking” score of fixed income markets on annual rolling 10 year relative returns to 31 December 2015

© MERCER 2016 32
F I X E D I N C O M E M A R K E T S C O N C L U S I O N
Asset class Market
opportunity (ex ante)
Actual manager results
(ex-post)1
Active management
conviction Rationale Preference
Fixed Income (broad based)
Medium Medium Medium • Evidence of added value by active managers, net of fees, across all markets except Europe
For active management if: • Investors have strong conviction
in managers’ skill • Manager fees are reasonable
and targets are aligned
Credit Medium Medium Medium
• Offers active management potential for the skilled investor able to anticipate downgrades, defaults, misclassifications
• Asymmetry of risk of sector also favours active management
• Evidence of added value by active managers, gross of fees, though alpha eroded by fees in the UK
For active management if: • Investors have strong conviction
in managers’ skill • Manager fees are reasonable
and targets are aligned
Global High Yield High Some Medium
• Less efficient market should provide opportunities for active managers
• Some evidence that the median manager has added value after fees. Passive managers tend to underperform the index by a material margin in this sector
For active management if: • High conviction in managers’
skill • Attractive fees relative to
sector norms
Emerging Market Debt
High Low Medium
• Offers high raw market potential for outperformance; fewer market participants than developed and low overall correlations to other asset classes
• Long data history available showing little evidence of added value by active managers
For active management if: • Investors have strong conviction
in managers’ skill
1 Based on “alpha ranking” score of fixed income markets on annual rolling 10 year relative returns to 31 December 2015

© MERCER 2016 33 © MERCER 2016 33
LIQUIDITY SLEEVES

© MERCER 2016 34
L I Q U I D I T Y S L E E V E S
• Historically, fund transfer requests were satisfied through Prudential and they used a line of credit to facilitate participant moves
• After the move to BNY Mellon as the custodian, investment managers are having to sell securities in certain situations in order to fund the participant flows
• Mercer believes that a liquidity sleeve will help enable investment managers maintain full market exposure
• Liquidity sleeve will help manage portfolio trading to eliminate the need for forced selling, minimize transaction costs and the associated performance drag

© MERCER 2016 35
C U S T O M F U N D C O N S T R U C T I O N
Hotchkis & Wiley, 33.3%
Delaware , 33.3%
Robeco, 33.3%
NC LCV Target Allocation
Hotchkis & Wiley, 31.7%
Delaware , 31.7%
Robeco, 31.7%
Liquidity Buffer, 5.0%
NC LCV Target Allocation with Liquidity Buffer
• Adding in a liquidity buffer can help reduce transaction costs associated with participant cash flows and rebalancing
• This will also enable the underlying investment managers to remain fully invested
• Should eliminate cash drag of the underlying investment managers
• A buffer of 5% is generally our starting point but could be reduced depending on typical flows within each specific Fund.

© MERCER 2016 36 © MERCER 2016 36
BROKERAGE WINDOW
© MERCER 2016 37
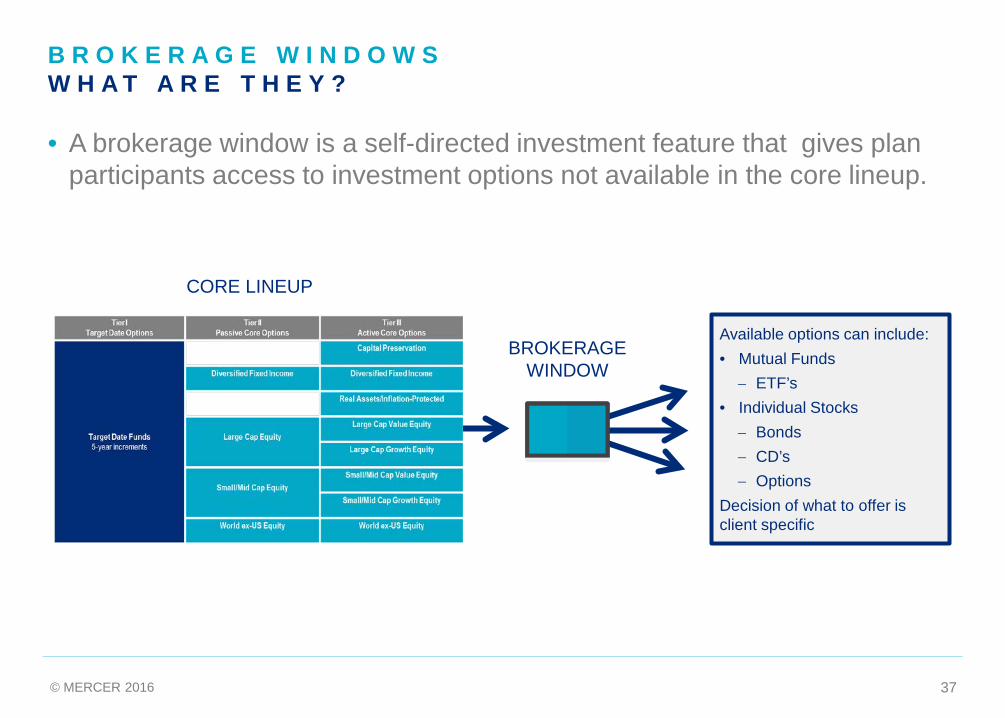
B R O K E R A G E W I N D O W S W H A T A R E T H E Y ? • A brokerage window is a self-directed investment feature that gives plan
participants access to investment options not available in the core lineup.
CORE LINEUP
BROKERAGE WINDOW
Available options can include: • Mutual Funds
− ETF’s • Individual Stocks
− Bonds − CD’s − Options
Decision of what to offer is client specific

© MERCER 2016 38
B R O K E R A G E W I N D O W S D I F F E R E N T T Y P E S
• Open-ended window – virtually unlimited funds
• Limited choice – Committee selects specific funds to be made available
• Brokerage window that is limited to investing in mutual funds
• May invest in mutual funds and ETFs but not in individual securities
• Range of mutual funds available is virtually unlimited
• Range of ETFs available may not be as extensive
M U T U A L F U N D W I N D O W
H Y B R I D W I N D O W
O P E N V S L I M I T E D C H O I C E
Brokerage window investments: • May include individual stocks, bonds, CD’s, Options, ETFs, and/or Mutual Funds
through a broker assigned by the recordkeeper • Can restrict classes of securities, or individual securities – such as company stock • Breadth of window varies by recordkeeper

© MERCER 2016 39
B R O K E R A G E W I N D O W S A D V A N T A G E S / D I S A D V A N T A G E S
Brokerage Window
Mutual Fund Window
Hybrid Window
Advantages
Access to wide array of investment options Appeals to sophisticated participants and those who want greater choice No major litigation involving brokerage window investment losses to date Some windows allow intraday trading Investing in “pooled” funds counters risks with investing in single securities Fees tend to be lower than in fully open brokerage window
Disadvantages Investment risk is greater in individual securities and non-diversified funds
Fiduciary obligations, risks and oversight responsibilities are less clear May increase plan auditing fees Can present challenges when transitioning recordkeepers Investment fees typically higher as retail investors (retail fees for mutual funds, individual security commissions, etc.)
Once offered, may be difficult to eliminate or freeze Plan sponsor may need to select which ETFs to offer

© MERCER 2016 40
B R O K E R A G E W I N D O W S M E R C E R V I E W
In most cases, Mercer recommends limiting investments to mutual funds and exchange traded funds (ETF’s),
and excluding individual stocks, bonds, options and master limited partnerships
(MLP’s).
Offering a brokerage window is a fiduciary decision and as such several considerations must be addressed:
• Fees • Underlying investment offerings • Restrictions • Compliance • Communications
Self-Directed Brokerage Windows have come under scrutiny recently by the DOL. Mercer expects to see more regulation in the future, not
less.
Mercer does not recommend all clients offer a Brokerage Window. However, they may be suitable for
some clients. The decision to offer a brokerage window should be based on each
Plan’s unique situation and participant demographics.
Plan sponsor may want to consider setting limits on the amount of
assets that can be transferred into the brokerage window.

© MERCER 2016 41 © MERCER 2016 41
R E T I R E M E N T I N C O M E

© MERCER 2016 42
R E T I R E M E N T T O P E M P L O Y E E C O N C E R N
Sources: Online interviews of 1,506 current 401(k) participants in June 2013, Mercer Workplace Survey, November 2013 and 2014 Retirement Confidence Survey, EBRI Issue Brief, No. 397, March 2014
© MERCER 2016 43
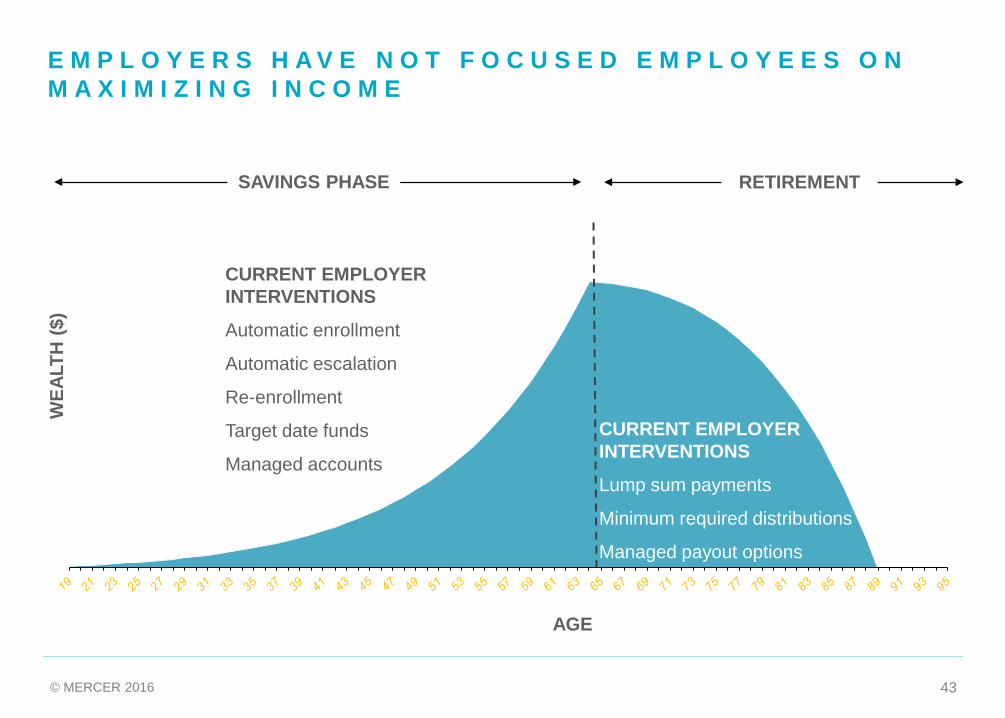
E M P L O Y E R S H A V E N O T F O C U S E D E M P L O Y E E S O N M A X I M I Z I N G I N C O M E
SAVINGS PHASE RETIREMENT
CURRENT EMPLOYER INTERVENTIONS
Automatic enrollment
Automatic escalation
Re-enrollment
Target date funds
Managed accounts
CURRENT EMPLOYER INTERVENTIONS
Lump sum payments
Minimum required distributions
Managed payout options
WEA
LTH
($)
AGE

© MERCER 2016 44
S O L V I N G F O R T H E R E T I R E M E N T T R I L E M M A T H E C H A L L E N G E R E M A I N S
INITIAL INCOME
PARTICIPATION IN UPSIDE
PROTECTION FROM RISK
ACCESS TO CAPITAL
Current retirement income solutions struggle to solve for the competing retiree objectives

© MERCER 2016 45
E M P L O Y E E S A R E L O O K I N G F O R O P T I O N S H O W T O A D D R E S S I N C O M E C H A L L E N G E S
Source: AllianceBernstein Research Survey, Inside the Mind of Plan Participants and Sponsors, 2012
What do employees want most from their DC Plans?
Want steady income stream 67%
Want protection of principal 47%
Want ability to withdraw part or all of savings without penalty or fees
41%
Want well-diversified mix of investments 39%
But only 6.1% of retiring employees elected an annuity according to GAO study, so maybe flexibility to withdraw is more important than steady income stream
Yet Advisors seem to be busy: Sold nearly $230BN last year mostly variable annuities
© MERCER 2016 46
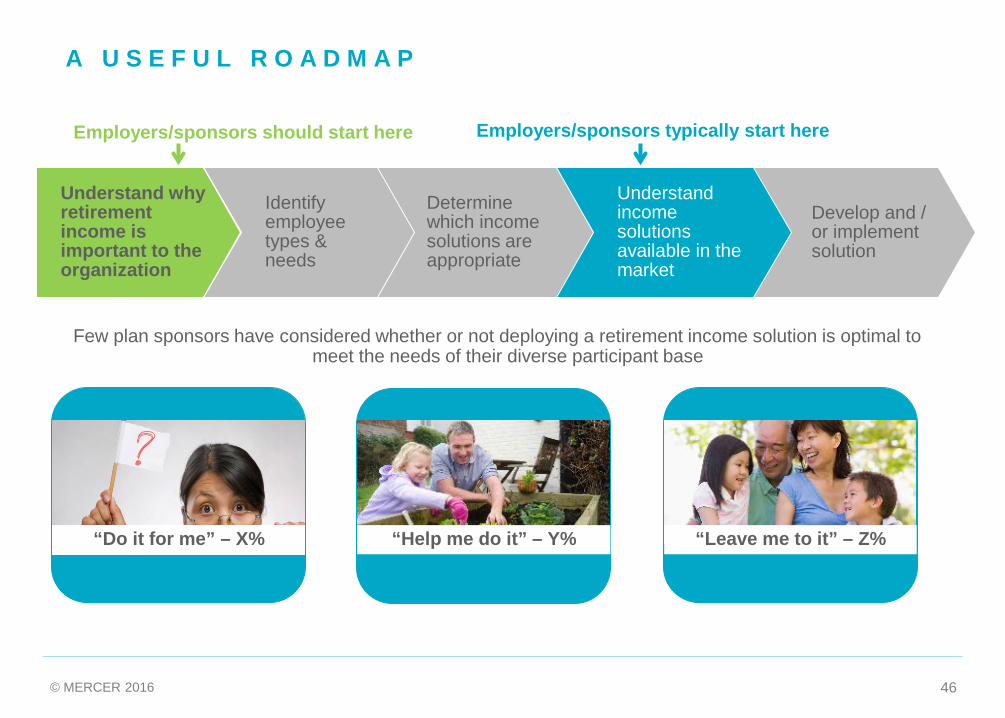
A U S E F U L R O A D M A P
Understand why retirement income is important to the organization
Employers/sponsors should start here
Few plan sponsors have considered whether or not deploying a retirement income solution is optimal to meet the needs of their diverse participant base
“Do it for me” – X% “Help me do it” – Y% “Leave me to it” – Z%
Determine which income solutions are appropriate
Identify employee types & needs
Develop and / or implement solution
Understand income solutions available in the market
Employers/sponsors typically start here
© MERCER 2016 47
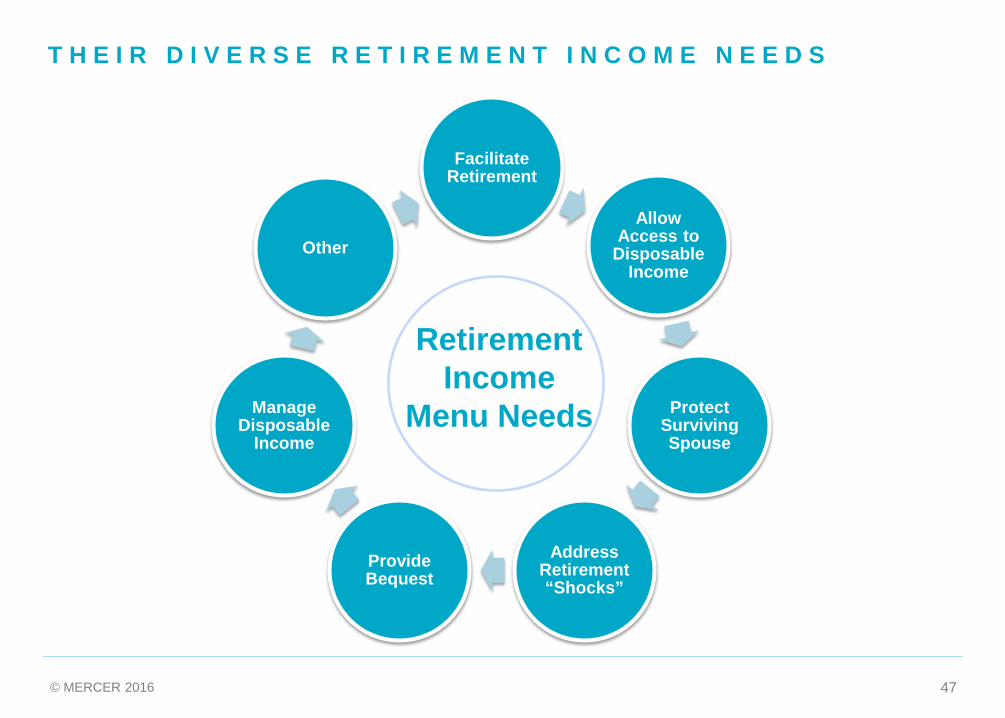
Facilitate Retirement
Allow Access to
Disposable Income
Protect Surviving Spouse
Address Retirement “Shocks”
Provide Bequest
Manage Disposable
Income
Other
Retirement Income
Menu Needs
T H E I R D I V E R S E R E T I R E M E N T I N C O M E N E E D S

© MERCER 2016 48
I N C O M E N E E D S S H I F T T H R O U G H O U T R E T I R E M E N T
“Active” Retiree (~65-75)
“Passive” Retiree (~75-85)
“Late in Life” Retiree (~85+)
• Still physically active
• Want to travel – holidays, see grandchildren
• High (as possible) income needs
• Less physically active but generally healthy
• More likely to be “stay at home”
• Income needs reduce
• Less physically active, increased health issues
• May need long-term care assistance
• Increased income needs due to health and long-term care
LATE IN LIFE ACTIVE INCOME MAY REDUCE IN REAL TERMS
© MERCER 2016 49
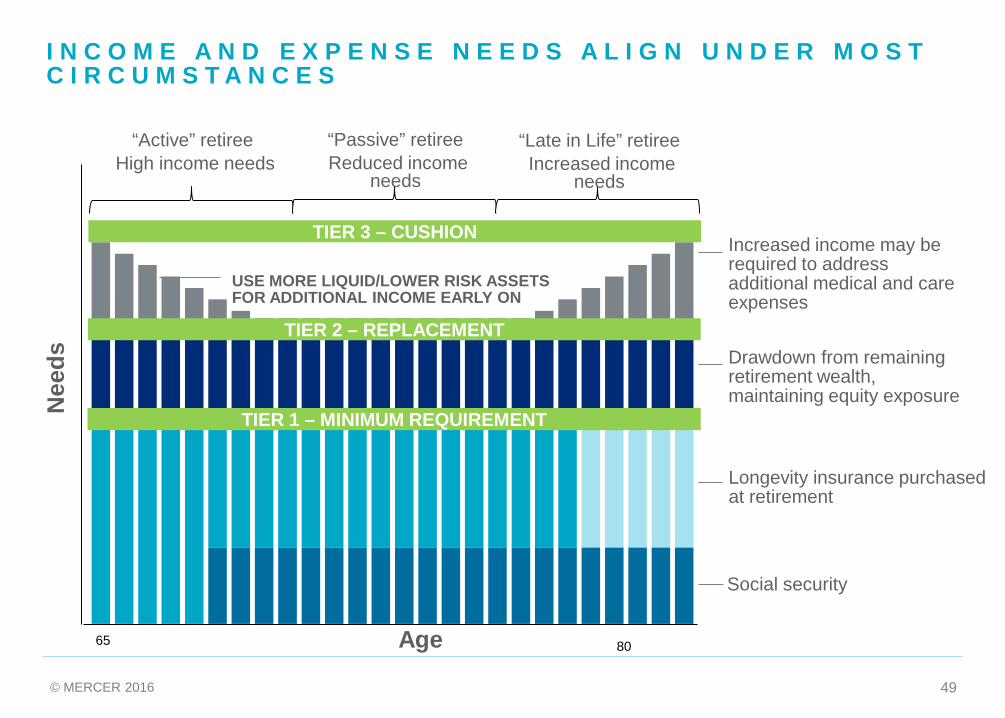
TIER 2 – REPLACEMENT
TIER 1 – MINIMUM REQUIREMENT
TIER 3 – CUSHION
Social security
Longevity insurance purchased at retirement
Drawdown from remaining retirement wealth, maintaining equity exposure
USE MORE LIQUID/LOWER RISK ASSETS FOR ADDITIONAL INCOME EARLY ON
Increased income may be required to address additional medical and care expenses
Nee
ds
Age 65
I N C O M E A N D E X P E N S E N E E D S A L I G N U N D E R M O S T C I R C U M S T A N C E S
“Active” retiree High income needs
“Passive” retiree Reduced income
needs
“Late in Life” retiree Increased income
needs
80

© MERCER 2016 50
R E T I R E M E N T I N C O M E P R I N C I P L E S
50
Construct Engage Execute
Build a solid income floor
Design to the “U”
Leverage buying power
Know your fiduciary position
Offer flexibility through an Income
Menu
Provide assistance
Avoid too rapid drawdown
Integrate workforce planning
Put all wealth to work
Manage through the life cycle
Manage market and longevity risks

© MERCER 2016 51
A N D T H E E V O L U T I O N A R Y N A T U R E O F T H E I R E N G A G E M E N T
Analysis conducted by Mercer suggests participants become more engaged in their retirement planning as they near retirement; it is important to know where your participants fall on this spectrum
Age
% o
f Par
ticip
ants
0%
20%
40%
60%
80%
100%
20 30 40 50 60
Leave me to itHelp me do itDo it for me

© MERCER 2016 52
Do it for me Help me do it Leave me to it
Investment Structure and Elections
Target Date Funds (‘TDF’)
Core Options & Managed Accounts
Specialty Options
Retirement Income Solutions
Purchase into DB Plan Annuity with DC Assets
Income Advice Service
Social Security Optimization
Tool
Simple Planning and Projection
Tools
Target Date Fund with Annuity Component
Managed Account with
Income Component
Annuity Bidding Service
(SPIA, DIA, Longevity Annuity)
Minimum Required
Distributions
Installment Payments
Design-Based Accumulation
Annuity Strategy
Hybrid Strategies
(GMWB) / In-Plan Annuities
Managed Payout
Lump Sum Payment
SPIA = Single Premium Immediate Annuity; DIA = Deferred Income Annuity
R E T I R E M E N T I N C O M E M E N U
= current NC options = most commonly available

© MERCER 2016 53 © MERCER 2016 53
B E N C H M A R K R E V I E W

© MERCER 2016 54
B E N C H M A R K R E V I E W
Characteristics of a valid benchmark1:
1) Specified in advance
2) Appropriate – Benchmark is consistent with the manager’s investment style
3) Measurable – The benchmark’s return is readily calculable on a reasonably frequent basis
4) Unambiguous – Identities and weights of securities are clearly defined
5) Reflective of current investment options – The manager has current knowledge of the securities in the benchmark
6) Accountable: The manager is aware and accepts accountability for the constituents and performance of the benchmark
7) Investable: It is possible to simply hold the benchmark
1) CFA Institute Investment Series

© MERCER 2016 55
B E N C H M A R K R E V I E W – A C T I V E O P T I O N S
Active Investment Options Current Benchmark
North Carolina Fixed Income Fund Barclays Aggregate Index
JPMorgan Core Fixed Income Barclays Aggregate Index
Prudential Core Plus Fixed Income Barclays Aggregate Index
North Carolina Inflation Sensitive Fund PIMCO IRMAF Index
PIMCO Inflation Responsive Multi Asset PIMCO IRMAF Index
North Carolina Large Cap Value Fund Russell 1000 Value Index
Hotchkis & Wiley Large Cap Value Russell 1000 Value Index
Delaware Large Cap Value Russell 1000 Value Index
Boston Partners Large Cap Value Russell 1000 Value Index
North Carolina Large Cap Growth Fund Russell 1000 Growth Index
Sands Large Cap Growth Russell 1000 Growth Index
Wellington Opportunistic Growth Russell 3000 Growth Index
Loomis Sayles Large Cap Growth Russell 1000 Growth Index

© MERCER 2016 56
B E N C H M A R K R E V I E W
Active Investment Options Current Benchmark
North Carolina SMID Value Fund Russell 2500 Value Index
Hotchkis & Wiley SMID Cap Value Russell 2500 Value Index
EARNEST Partners SMID Cap Value Russell 2500 Value Index
WEDGE SMID Cap Value Russell 2500 Value Index
North Carolina SMID Growth Fund Russell 2500 Growth Index
TimesSquare SMID Cap Growth Russell 2500 Growth Index
Brown Advisory SMID Cap Growth Russell 2500 Growth Index
North Carolina International Equity Fund MSCI ACWI ex US Index
Baillie Gifford ACWI ex US Growth MSCI ACWI ex US Index
Mondrian ACWI ex US Value MSCI ACWI ex US Index
North Carolina Global Equity Fund MSCI ACWI Index
Wellington Global Opportunities MSCI ACWI Index
Arrowstreet Global Equity ACWI MSCI ACWI Index
North Carolina Stable Value Fund T-Bills + 1% Index
Galliard 3 Year Constant Maturity Yield and T-Bills +1.50%

© MERCER 2016 57
B E N C H M A R K R E V I E W
• North Carolina’s Investment Management Agreements (IMA) with each underlying investment manager specifies the benchmark and performance objective
• Current benchmarks are measurable, unambiguous and the investment managers have knowledge of the securities in the universe
• The equity indices utilized by the investment managers and investable and can be replicated
• There are two instances when the underlying investment manager benchmark does not match the fund level benchmark (Wellington Opportunistic Growth and Galliard Stable Value)
• In Mercer’s Performance Evaluation Reports, the Wellington Opportunistic Growth strategy is benchmarked against the Russell 3000 Growth Index
• We believe this is the appropriate index for the strategy, given that it is constructed in three different sleeves: large cap, mid cap, and small cap. The allocation to each sleeve is determined by the composition of large, mid and small companies within the Russell 3000 Growth Index.
• Given the composition of the Russell 3000 Growth Index (over 80% of Index is comprised of large cap securities), we believe the Wellington strategy still fits within the context of the Large Cap Growth Fund but it should be benchmarked against the Russell 3000 Growth Index.

© MERCER 2016 58
G A L L I A R D S T A B L E V A L U E B E N C H M A R K
• Investment Objective – Provide safety of principal and secondary objective is to maintain consistency of returns with minimal volatility, while maintaining a stable credited rate of interest
• Galliard believes the appropriate benchmark is the 3 Year Constant Maturity Treasury (CMT) Yield, in order to maintain a consistent return stream, volatility and duration
• 3 Year CMT Yield is not an investable benchmark but there are no investable benchmarks that get the same accounting treatment as stable value contracts.
• Each underlying short and intermediate sub-advisor is benchmarked against an appropriate investable benchmark
• Mercer believes that the 3 Year CMT Yield should be used as the primary benchmark based on the most recent IMA and discussion with Galliard but also believes 3 Month T-Bills + 150 bps should be shown as a secondary benchmark
Strategy 3 MONTH YTD 1 YR 3 YR 5 YR
North Carolina Stable Value Fund 0.51% 1.44% 1.92% 1.86% 2.15%
3 Year Constant Maturity Treasury Yield 0.21% 0.70% 0.98% 0.93% 0.73%
ML 3 Month T-Bill + 150 bps 0.47% 1.37% 1.79% 1.63% 1.61%
Performance as of 9/30/16
© MERCER 2016 59 © MERCER 2016 59
E T F D I S C U S S I O N

© MERCER 2016 60
N O R T H C A R O L I N A E T F R E V I E W
North Carolina Investment Options
Inception Date
IM Expense
Since Inception
Net Return
Since Inception Tracking
Error
ETF Alternative IM Expense
Net Return (from Inception Period
of NC Fund)
Since Inception Tracking Error (from Inception
Period of NC Fund)
NC Fixed Income Passive 09/10 0.02% 3.35% 0.21% iShares Core US Aggregate Bond 0.05% 3.30% 0.08%
NC Large Cap Passive 03/09 0.01% 16.59% 0.07% iShares Core S&P 500 0.04% 16.63% 0.03%
NC SMID Cap Passive 03/09 0.01% 18.05% 0.13% iShares Core S&P Mid-Cap
ETF1 0.07% 18.28% 2.24%
NC International Passive 03/09 0.03% 9.39% 1.81% iShares MSCI ACWI ex US 0.33% 9.07% 0.55%
1) iShares Core S&P Mid-Cap ETF is benchmarked against the Russell MidCap Index rather than the Russell 2500 Index for the NC SMID Cap Passive Fund
• Mercer confirmed that Prudential does not currently offer ETF’s as available options within a 403 (b) Plan currently. There are some ETF’s that wouldn’t be allowed because they are not “regulated investment companies” under IRC Section 851 (a).

© MERCER 2016 61 © MERCER 2016 61
APPENDIX

© MERCER 2016 62
I M P O R T A N T N O T I C E S © 2016 Mercer LLC. All rights reserved.
This contains confidential and proprietary information of Mercer and is intended for the exclusive use of the parties to whom it was provided by Mercer. Its content may not be modified, sold or otherwise provided, in whole or in part, to any other person or entity, without Mercer’s prior written permission.
Mercer does not provide tax or legal advice. You should contact your tax advisor, accountant and/or attorney before making any decisions with tax or legal implications.
The findings, ratings and/or opinions expressed herein are the intellectual property of Mercer and are subject to change without notice. They are not intended to convey any guarantees as to the future performance of the investment products, asset classes or capital markets discussed. Past performance does not guarantee future results. Mercer’s ratings do not constitute individualized investment advice.
Information contained herein has been obtained from a range of third party sources. While the information is believed to be reliable, Mercer has not sought to verify it independently. As such, Mercer makes no representations or warranties as to the accuracy of the information presented and takes no responsibility or liability (including for indirect, consequential or incidental damages), for any error, omission or inaccuracy in the data supplied by any third party.
This does not constitute an offer or a solicitation of an offer to buy or sell securities, commodities and/or any other financial instruments or products or constitute a solicitation
For the most recent approved ratings of an investment strategy, and a fuller explanation of their meanings, contact your Mercer representative.
For Mercer’s conflict of interest disclosures, contact your Mercer representative or see www.mercer.com/conflictsofinterest.
Returns for periods greater than one year are annualized. Returns are calculated gross of investment management fees, unless noted as net of fees.
Mercer universes: Mercer’s universes are intended to provide collective samples of strategies that best allow for robust peer group comparisons over a chosen timeframe. Mercer does not assert that the peer groups are wholly representative of and applicable to all strategies available to investors.

© MERCER 2016 63


