Embed Size (px)
Citation preview

1
INVESTMENT OPPORTUNITIES IN MALAYSIA
Programm
Informationsveranstaltung, Dezentrale Energieversorgung in
Malaysia
Zarina SaadDirector
MIDA Munich13 September 2016
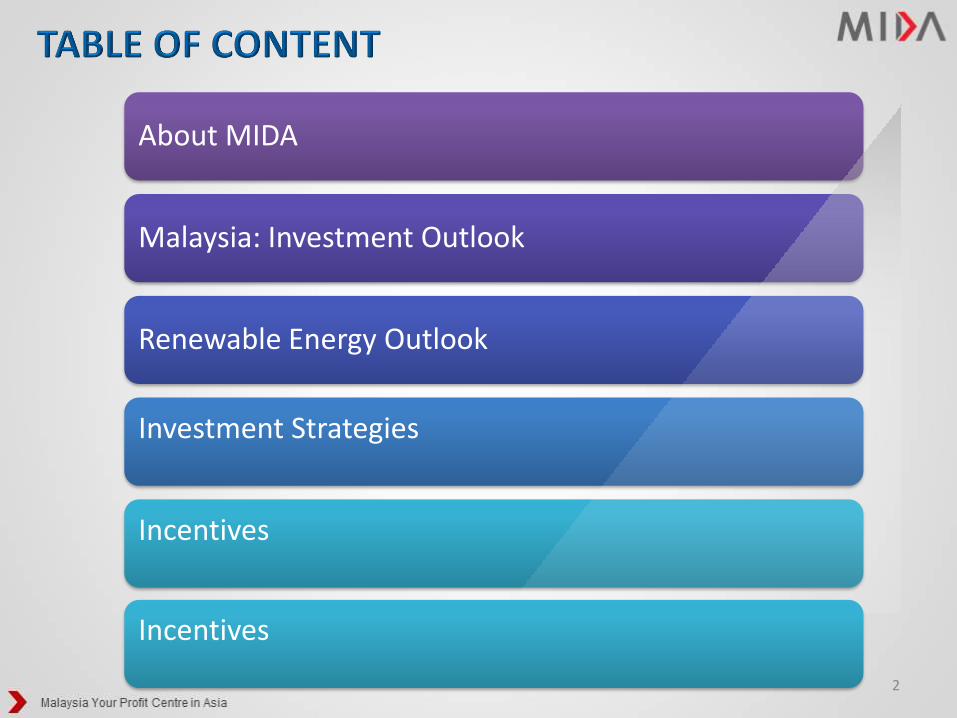
About MIDA
Malaysia: Investment Outlook
Renewable Energy Outlook
Investment Strategies
Incentives
2
Incentives

Who Are We?
3
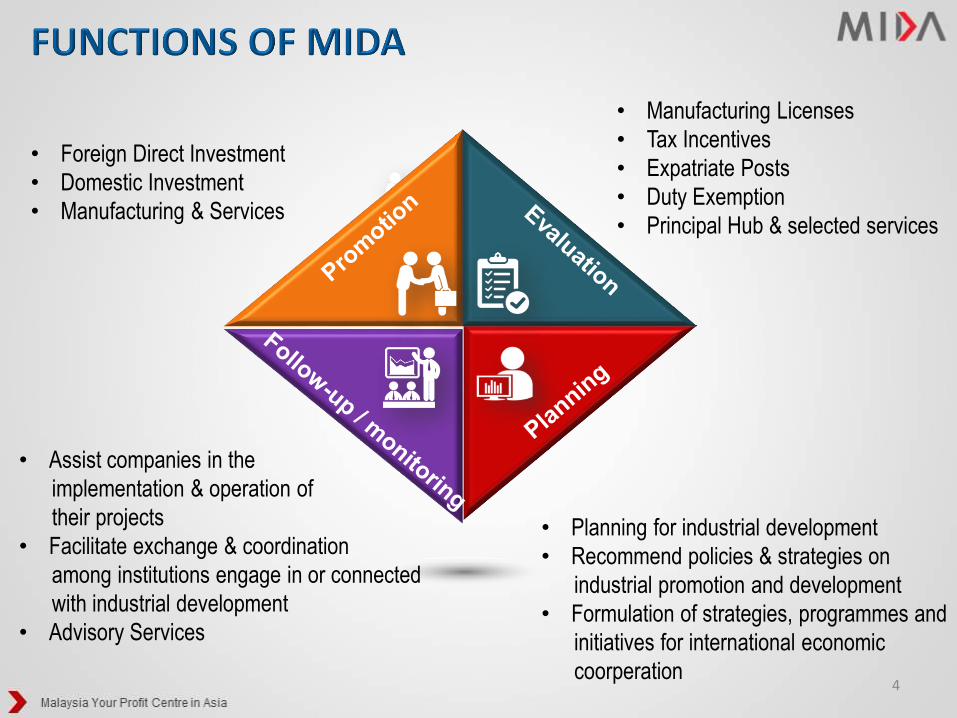
First point of contact for investors who intend to set up projects in the manufacturing
and services sectors in Malaysia
Malaysian Industrial Development Authority - Established in 1967 under Act of Parliament, 1965
The principal Malaysian Governmentagency responsible for the promotion ofinvestments and coordination ofindustrial development and selectedservices sectors in the country
4
Follow-up /
Monitoring
• Foreign Direct Investment
• Domestic Investment
• Manufacturing & Services
• Manufacturing Licenses
• Tax Incentives
• Expatriate Posts
• Duty Exemption
• Principal Hub & selected services
• Assist companies in the
implementation & operation of
their projects
• Facilitate exchange & coordination
among institutions engage in or connected
with industrial development
• Advisory Services
• Planning for industrial development
• Recommend policies & strategies on
industrial promotion and development
• Formulation of strategies, programmes and
initiatives for international economic
coorperation

Tokyo
Osaka
Seoul
Taipei
ShanghaiGuangzhou
MalaysiaSingapore
Sydney
Mumbai
Dubai
Stockholm
Frankfurt
Munich
Milan
Paris
London
Boston
New York
ChicagoSan Jose
Los Angeles Houston
23 Overseas Centres
Beijing
5
MIDA Munich
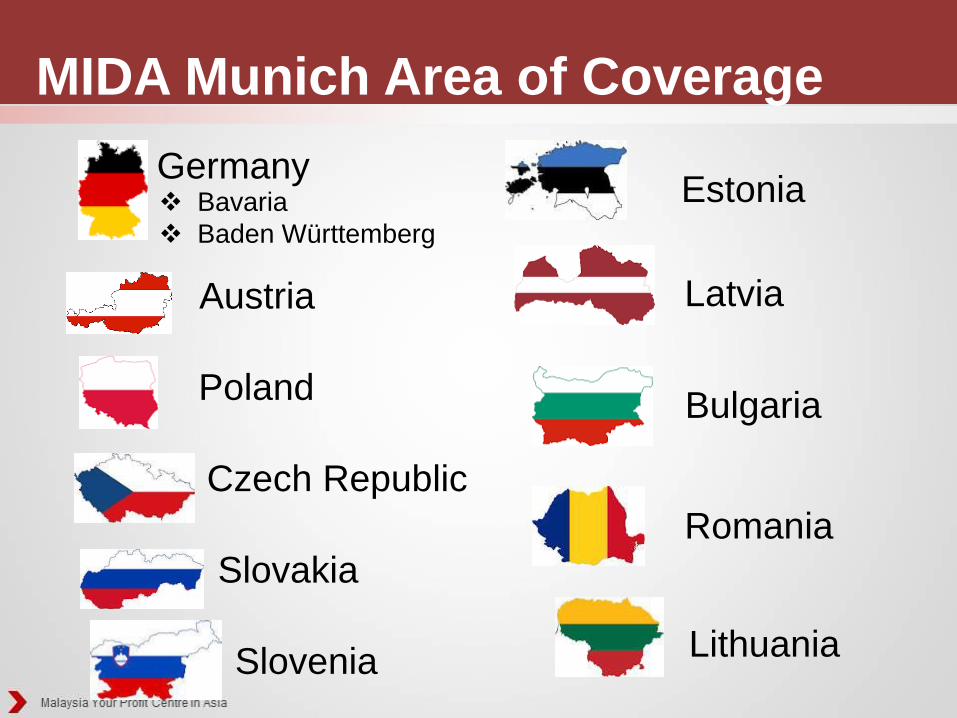
MIDA Munich Area of Coverage
Austria
Bavaria
Baden Württemberg
Germany
Poland
Czech Republic
Slovakia
Slovenia
Estonia
Latvia
Bulgaria
Romania
Lithuania

Headquarter
KL Sentral, Kuala Lumpur
Johor Bahru
Melaka
Seremban
Selangor
Ipoh
Penang
Alor Setar
Kota Bharu
Kuala
Terengganu
KuantanKota Kinabalu
Kuching
7
Malaysia : Economy and Investment Outlook
9
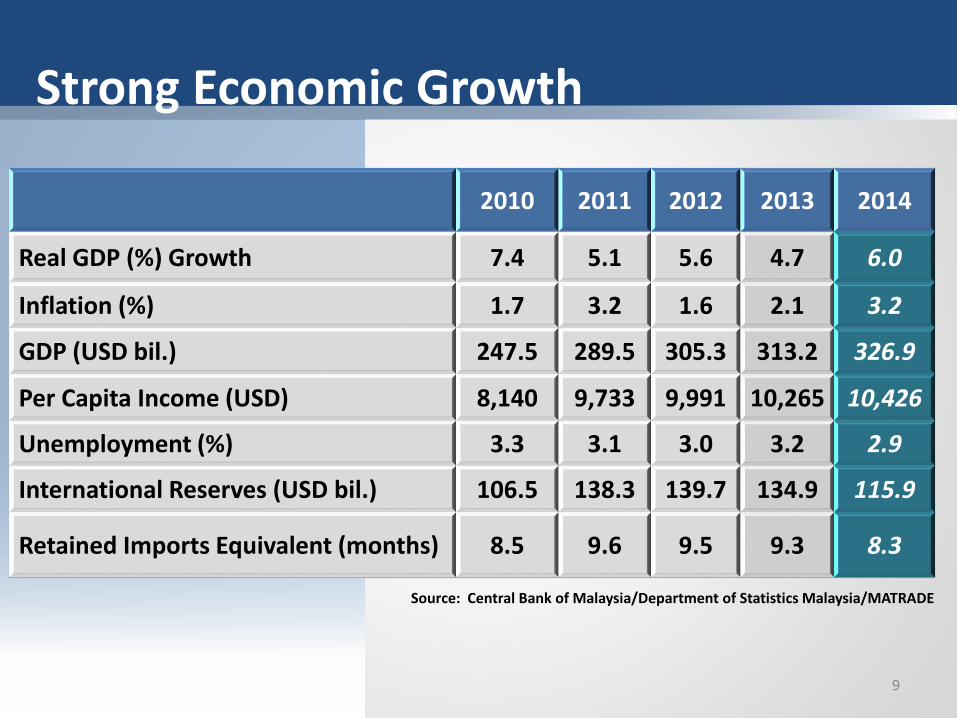
Strong Economic Growth
2010 2011 2012 2013 2014
Real GDP (%) Growth 7.4 5.1 5.6 4.7 6.0
Inflation (%) 1.7 3.2 1.6 2.1 3.2
GDP (USD bil.) 247.5 289.5 305.3 313.2 326.9
Per Capita Income (USD) 8,140 9,733 9,991 10,265 10,426
Unemployment (%) 3.3 3.1 3.0 3.2 2.9
International Reserves (USD bil.) 106.5 138.3 139.7 134.9 115.9
Retained Imports Equivalent (months) 8.5 9.6 9.5 9.3 8.3
Source: Central Bank of Malaysia/Department of Statistics Malaysia/MATRADE

0
10
20
30
40
50
60
70
2012 2013 2014
10
9.816.7
US
Bill
ion
Approved Investment in the Economy
18.1
Foreign Direct Investment (FDI) constitutes 25-30% of the total investments approved.
46.6
60.8
65.5
36.8
44.1
47.4
Foreign Domestic
11Source: MIDA 11
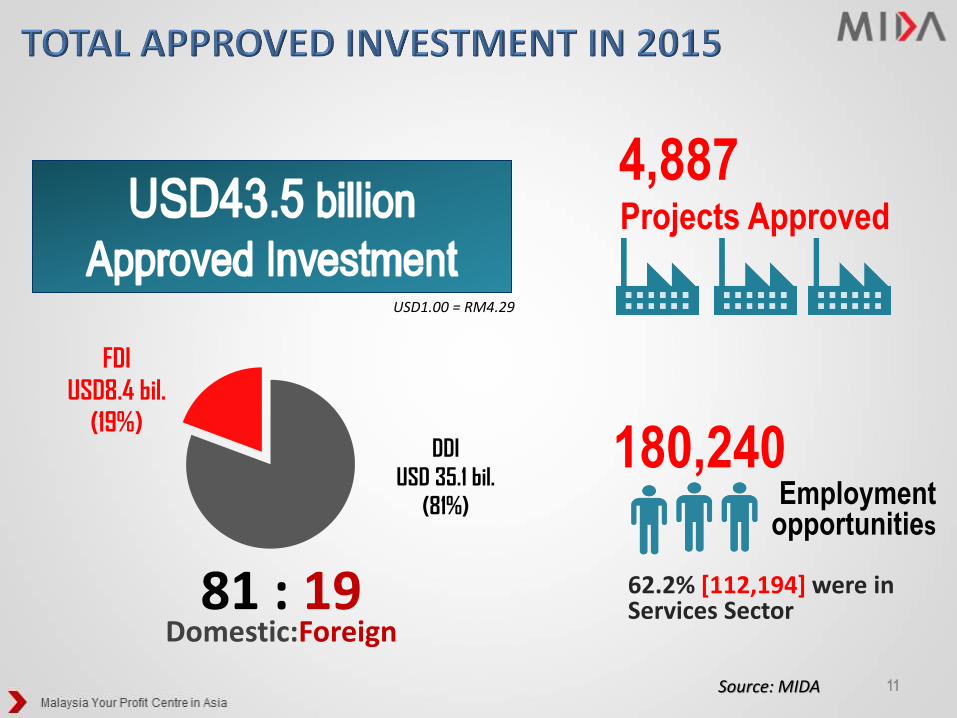
4,887Projects Approved
USD1.00 = RM4.29
180,240Employment
opportunities
62.2% [112,194] were in Services Sector81 : 19
Domestic:Foreign
FDI
USD8.4 bil.
(19%)DDI
USD 35.1 bil.
(81%)

-
0,2
0,4
0,6
0,8
1,0
1,2
12
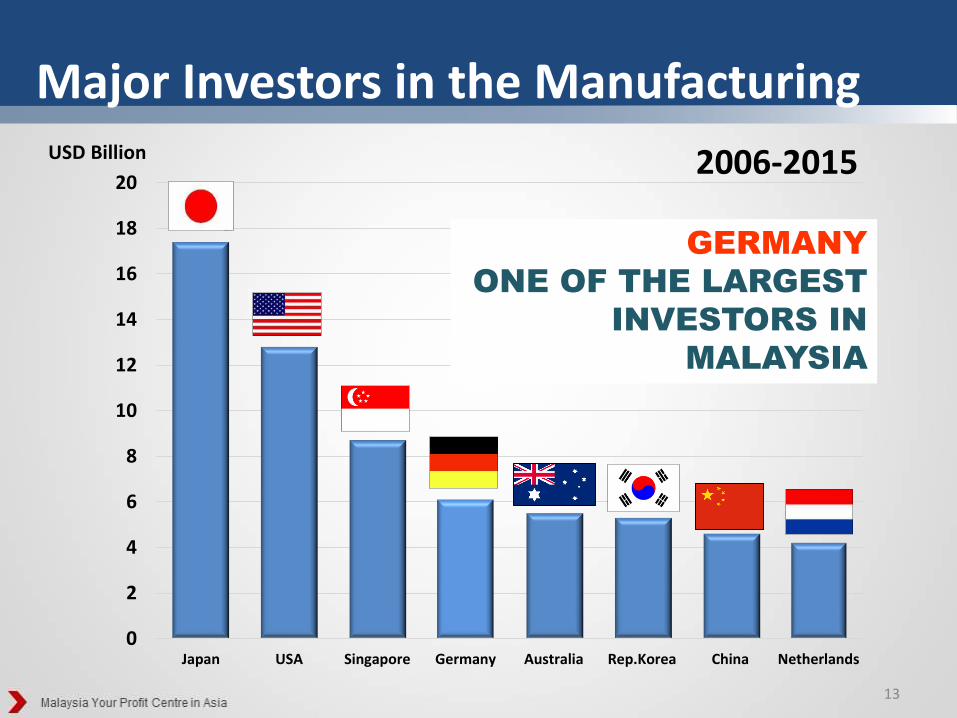
USD Billion
0.7
1.00.9
0.4
0.3 0.3 0.3 0.30.2 0.1
0
2
4
6
8
10
12
14
16
18
20
Japan USA Singapore Germany Australia Rep.Korea China Netherlands
13
Major Investors in the Manufacturing
2006-2015USD Billion
GERMANY
ONE OF THE LARGEST
INVESTORS IN
MALAYSIA

14
Major Investors From EU in the Manufacturing
2006-2015
0
1
2
3
4
5
6
7
Germany Netherlands UK Spain France Italy Norway
USD Billion
GERMANY
THE LARGEST
INVESTOR FROM EU

Electrical & Electronics, Basic Metal Products, Chemical Products , Petroleum Products (Inc.
Petrochemicals) and Non Metallic Mineral industries contribute the lion’s share of approved
foreign investments for the period 2007-2014
Investment by Industries
Electrical & Electronics
Basic Metal Products
Chemical Products
Petroleum Products
Non Metallic Mineral Products
Food Manufacturing
Machinery & Equipment
Transport Equipment
Fabricated Metal Products
Others
USD26.7 bil.
USD14.1 bil.USD9.7 bil.
USD5.6 bil.
USD4.1 bil.
Total Foreign Investment Approved : USD77.6 Billion

16
MNCs in Malaysia

17
German Companies in Malaysia

18
Manufacturing operations in Malaysia
Major German Companies

19
Major German Companies
Manufacturing operations in Malaysia
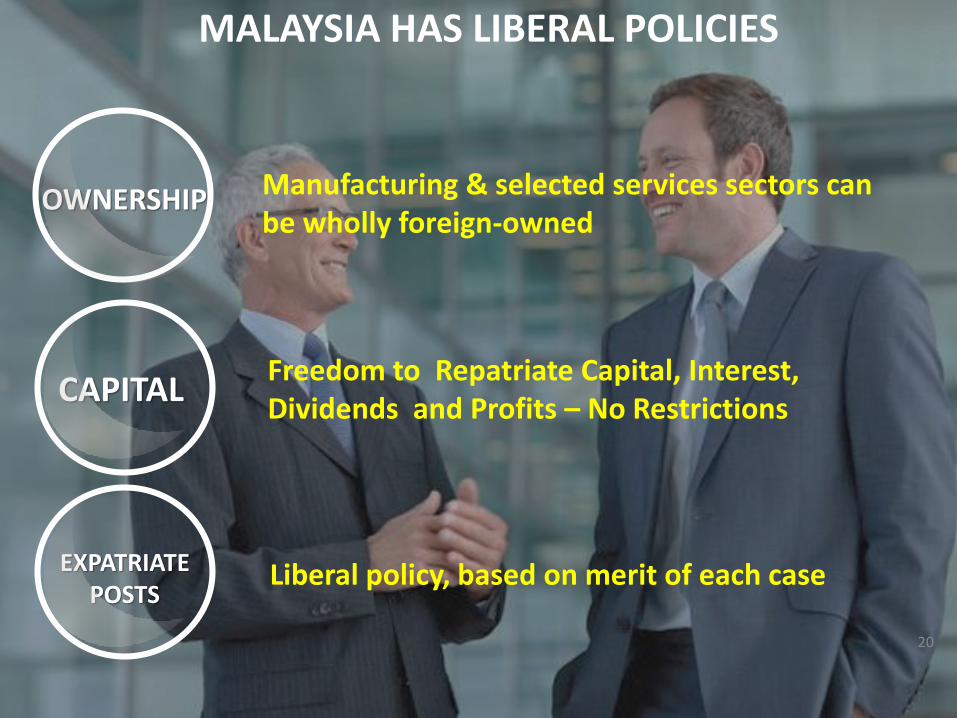
MALAYSIA HAS LIBERAL POLICIES
20
Freedom to Repatriate Capital, Interest, Dividends and Profits – No Restrictions
Manufacturing & selected services sectors can be wholly foreign-owned
OWNERSHIP
CAPITAL
EXPATRIATE POSTS
Liberal policy, based on merit of each case

World’s Perspective

global offshoring destination(A.T. Kearney Global Services Location Index™ 2016)
protecting investors(World Bank Doing Business 2015 Report)
IMD world talent rankings(IMD's World Competitiveness Yearbook 2015)
most competitive economy in overall performance (IMD's World Competitiveness Yearbook 2015)
in ease of doing business (World Bank Doing Business 2015 Report)
most competitive nation in the world (WEF's Global Competitiveness Report 2015-2016)
22
most attractive investment destination(Baseline Profitability Index (BPI) 2015)

Liberal Investment Policies
Harmonious Industrial RelationsQuality of Life
Good Track Record
STRATEGIC LOCATION
Banking System
23
Well Developed Infrastructure/
Connectivity
Pro-businessGovernment
Political and Economic Stability
Young, Trainable and Educated Labour Force

RENEWABLE ENERGY (RE) OUTLOOK
25
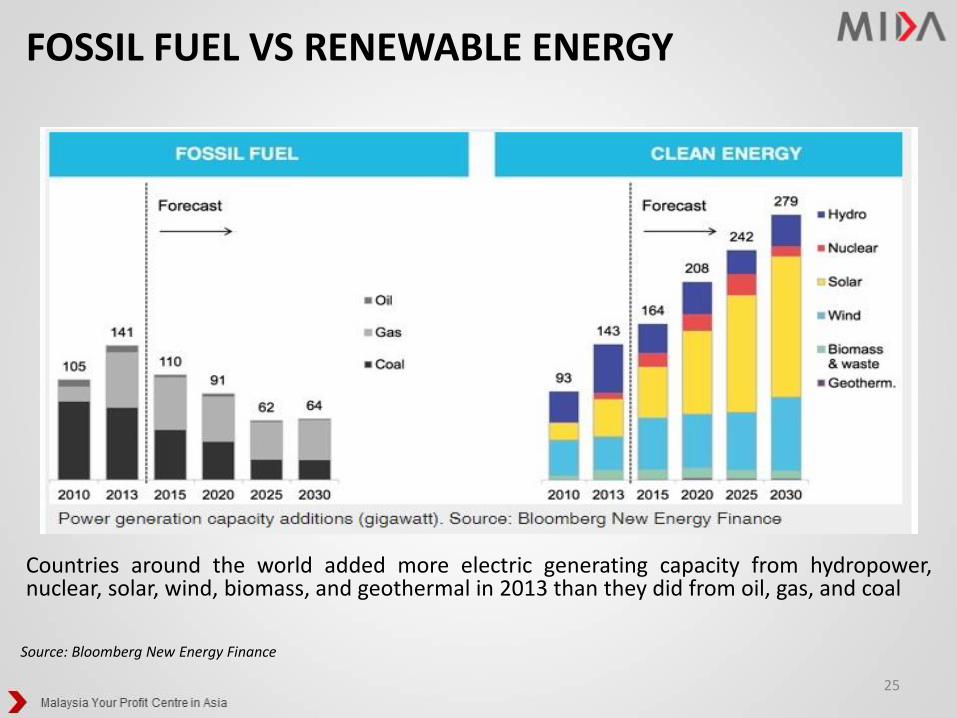
Source: Bloomberg New Energy Finance
Countries around the world added more electric generating capacity from hydropower,nuclear, solar, wind, biomass, and geothermal in 2013 than they did from oil, gas, and coal
FOSSIL FUEL VS RENEWABLE ENERGY

COMPARISON ON RE POLICIES IN ASEAN (AS OF 2015)
Source: ACE, 2015
27
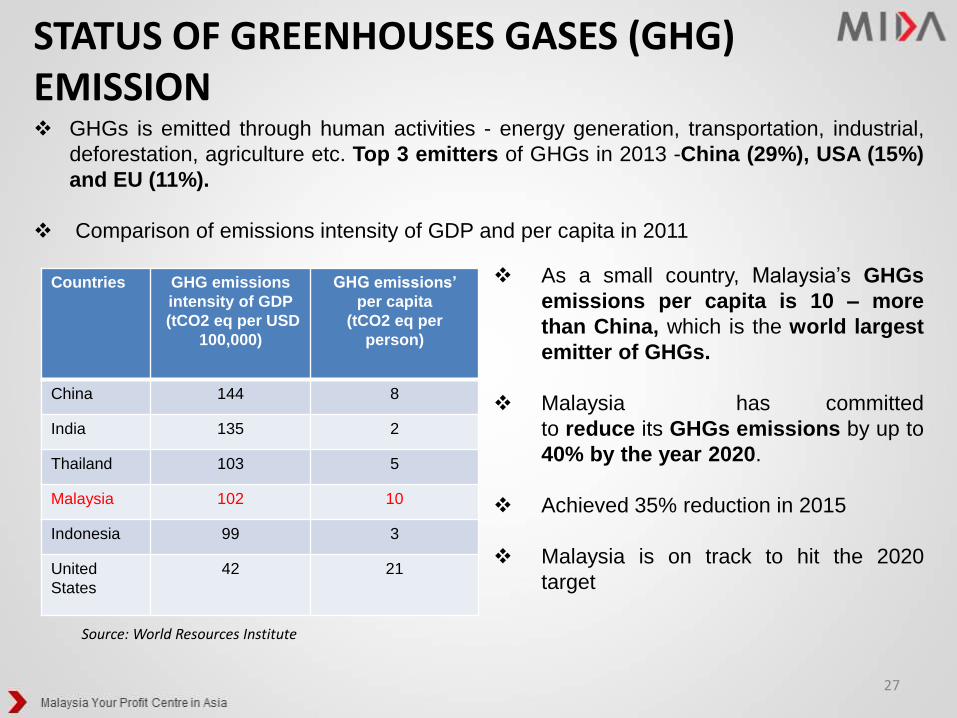
STATUS OF GREENHOUSES GASES (GHG) EMISSION GHGs is emitted through human activities - energy generation, transportation, industrial,
deforestation, agriculture etc. Top 3 emitters of GHGs in 2013 -China (29%), USA (15%)
and EU (11%).
Comparison of emissions intensity of GDP and per capita in 2011
As a small country, Malaysia’s GHGs
emissions per capita is 10 – more
than China, which is the world largest
emitter of GHGs.
Malaysia has committed
to reduce its GHGs emissions by up to
40% by the year 2020.
Achieved 35% reduction in 2015
Malaysia is on track to hit the 2020
target
Countries GHG emissions
intensity of GDP
(tCO2 eq per USD
100,000)
GHG emissions’
per capita
(tCO2 eq per
person)
China 144 8
India 135 2
Thailand 103 5
Malaysia 102 10
Indonesia 99 3
United
States
42 21
Source: World Resources Institute

28
MALAYSIA’S INITIATIVES TO GO GREEN
SAVE Programme, MEPS
Components
of a
Green
Economy
Five-Fuel Diversification Policy,
NREPAPRenewable Energy
Energy Efficient
Building
Transport
3R Programme
Tax Incentives,
GTFS, FiT
Retrofitting of Govt. buildings, GBI
rating tool
Biodiesel B5, NAP2014, Electric Mobility
Waste Management

INVESTMENT STRATEGIES
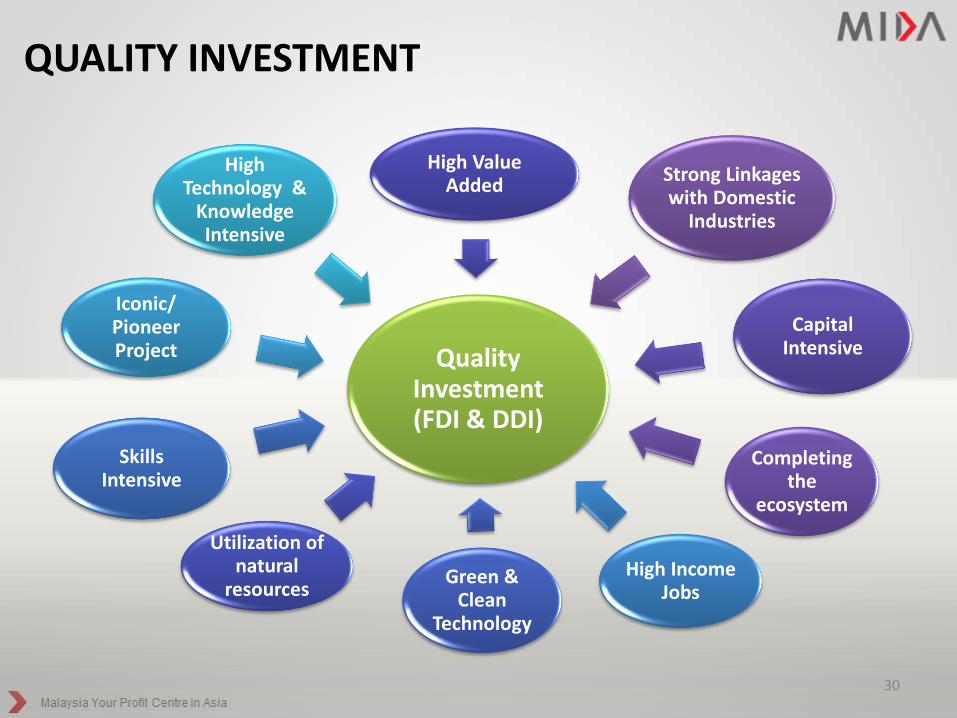
Quality Investment (FDI & DDI)
Strong Linkages with Domestic
Industries
Completing the
ecosystem
Capital Intensive
High Value Added
Utilization of natural
resourcesGreen &
Clean Technology
Skills Intensive
High Income Jobs
Iconic/ Pioneer Project
High Technology &
Knowledge Intensive
QUALITY INVESTMENT
30

ECOSYSTEM APPROACH
Promote the entire value chain of industry clusters
31
Strengthen & complete the ecosystem

R&D,
Design
Solar Wafer/
Cells
Solar
Modules
System
Integrator
Polysilicon
/ Ingot
Metal
Silicon
APPROVED & IN VARIOUS STAGES OF IMPLEMENTATION
Imex SemiconImex Semicon
Cosmos
Petroleum &
Mining
EXAMPLE: SOLAR INDUSTRY ECOSYSTEM

ST
RA
TE
GIC
LE
VE
L
RENEWABLE ENERGY ECOSYSTEM
POLICIES
PR
OJ
EC
T L
EV
EL
SU
PP
OR
TIN
G
EN
VIR
ON
ME
NT
RE STAKEHOLDERSAUTHORITIES /
AGENCIES
PROJECT IMPLEMENTATION
SOLAR
BROADER ENABLING
ENVIRONMENT
(infrastructure, industry
network, talent)
SERVICE PROVIDERS
Eg.
- Ditrolic
- Gading Kencana
- Solar Plus
FINANCIERS
Eg.
- GTFS (MGTC)
- Commercial Banks
MANUFACTURERS (Machinery and Equipment)- Domestics:
RE Solar – PV Modules e.g. First Solar, MSR, EndauPV Industries,Panasonic Energy
- Inverter– Mounting, cables, conduits, structures– Transformer
RE Biomass / Biogas – Gas engines e.g. MTU Services, Sime DarbyIndustrial, UMW Synergistic Generation
– Boilers e.g. BoilerMech, Borsig BoilerSystem, Enco Boiler, Mackenzie Industries
RE Mini Hydro - Powerhouse to house the electromechanicalequipment and all its auxiliary equipment includingcontrol room, Transformer
- Various international
BIOMASS BIOGAS SMALL HYDRO
RESOURCES
- Sunlight irradiance
- Rivers
- Palm oil plantation /
millers.
DEVELOPERS
Eg.
- Cypark Resources
- Felda
- BioXcell
RESEARCH ANDDEVELOPMENT
(study on Geothermaland Wind maps)

INCENTIVES

MAJOR INCENTIVES
35
MAJOR INCENTVES
TAX INCENTIVES
FEED-IN TARIFF
SCHEME
GREEN TECHNOLOGY
FUNDING SCHEME

Pioneer Status
Income tax exemption ranging from 70% & 100% for a period
of 5 & 10 years
Investment Tax Allowance
60% & 100% on qualifying capital expenditure for 5 years
Reinvestment Allowance
60% on qualifying capital expenditure for 15 consecutive years
Import Duty Exemption
For raw materials/components and machinery and equipment
Incentives
MAJOR INCENTIVES
36
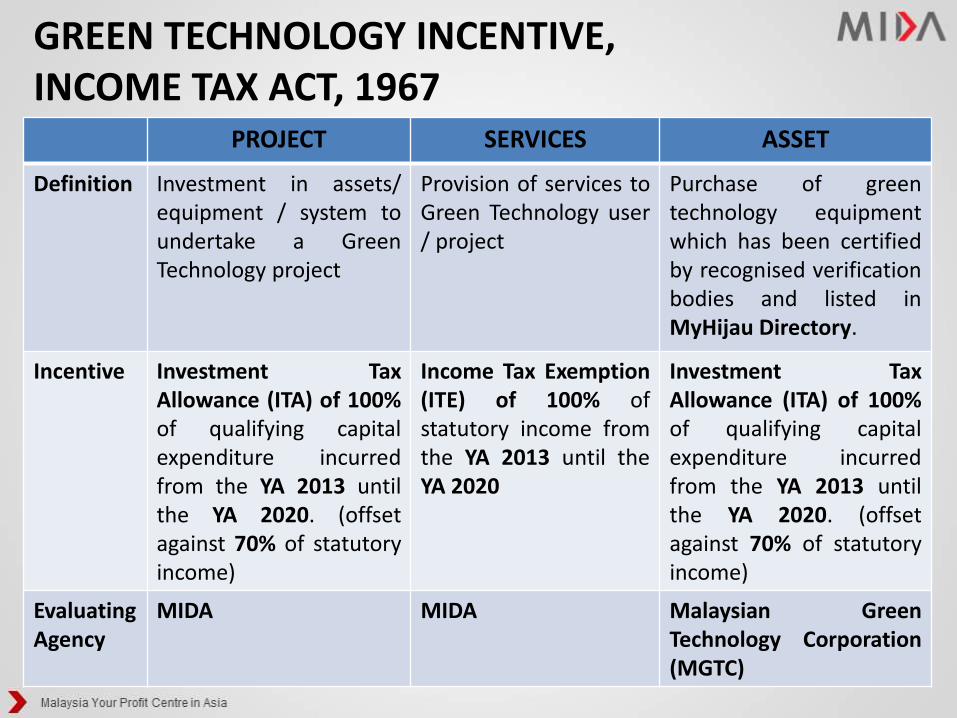
GREEN TECHNOLOGY INCENTIVE, INCOME TAX ACT, 1967
PROJECT SERVICES ASSET
Definition Investment in assets/equipment / system toundertake a GreenTechnology project
Provision of services toGreen Technology user/ project
Purchase of greentechnology equipmentwhich has been certifiedby recognised verificationbodies and listed inMyHijau Directory.
Incentive Investment TaxAllowance (ITA) of 100%of qualifying capitalexpenditure incurredfrom the YA 2013 untilthe YA 2020. (offsetagainst 70% of statutoryincome)
Income Tax Exemption(ITE) of 100% ofstatutory income fromthe YA 2013 until theYA 2020
Investment TaxAllowance (ITA) of 100%of qualifying capitalexpenditure incurredfrom the YA 2013 untilthe YA 2020. (offsetagainst 70% of statutoryincome)
Evaluating Agency
MIDA MIDA Malaysian GreenTechnology Corporation(MGTC)

PROMOTED INDUSTRIES
Energy
• Renewable Energy
• Energy Efficiency
Building
• Green Building
• Green Data Centre
Integrated Waste Management
• Waste recycling
• Waste recovery
• Waste treatment
Supporting Services
• Certification & verification bodies
• Green Township
• Electric Vehicle Services

RENEWABLE ENERGY (RE)
Commercial & industrial business entities which undertake generation
of energy using RE sources:
*Solar
Biomass
Biogas
Mini-Hydro
Geothermal
Feasibility study, system design &
advisory & consultancy, testing &
commissioning
Project Services
* Exception : Solar project under FiT Scheme

Free Trade Agreements

Market Access offered by Malaysia
14 Free Trade
AgreementsMARKET
3.0 Billion Population

42
Malaysia’s Involvement in FTAs
Regional ASEAN Free Trade Area (AFTA)
ASEAN-China FTA
ASEAN-India FTA [Trade in Goods]
ASEAN-Republic of Korea FTA
ASEAN-Japan Comprehensive
Economic Partnership (AJCEP)
[Trade in Goods]
ASEAN-Australia-New Zealand FTA
Trans-Pacific Partnership (TPP)Bilateral Malaysia-Turkey FTA
Malaysia-India Comprehensive
Economic Cooperation Agreement
(MICECA)
Malaysia-Japan Economic
Partnership Agreement (MJEPA)
Malaysia-New Zealand FTA
(MNZFTA)
Malaysia-Australia FTA (MAFTA)
Malaysia-Chile FTA (MCFTA)
Malaysia-Pakistan Comprehensive
Economic Partnership Agreement
(MPCEPA)
Bilateral Malaysia-EU
Regional Regional Cooperation
Economic Partnership
(RCEP) [Japan, China,
Korea, Australia, New
Zealand and India]
Bilateral Malaysia-Bangladesh
Malaysia-Gulf
Cooperation Council
(GCC)
Malaysia-European Free
Trade Association
(EFTA)
Concluded Under Negotiations
Under Initiation

Malaysia’s Concluded FTA – AFTA
• Potential market of 600 million in ASEAN
• Already zero tariffs for 99% of products
• ASEAN Economic Community and Single Market by 2015
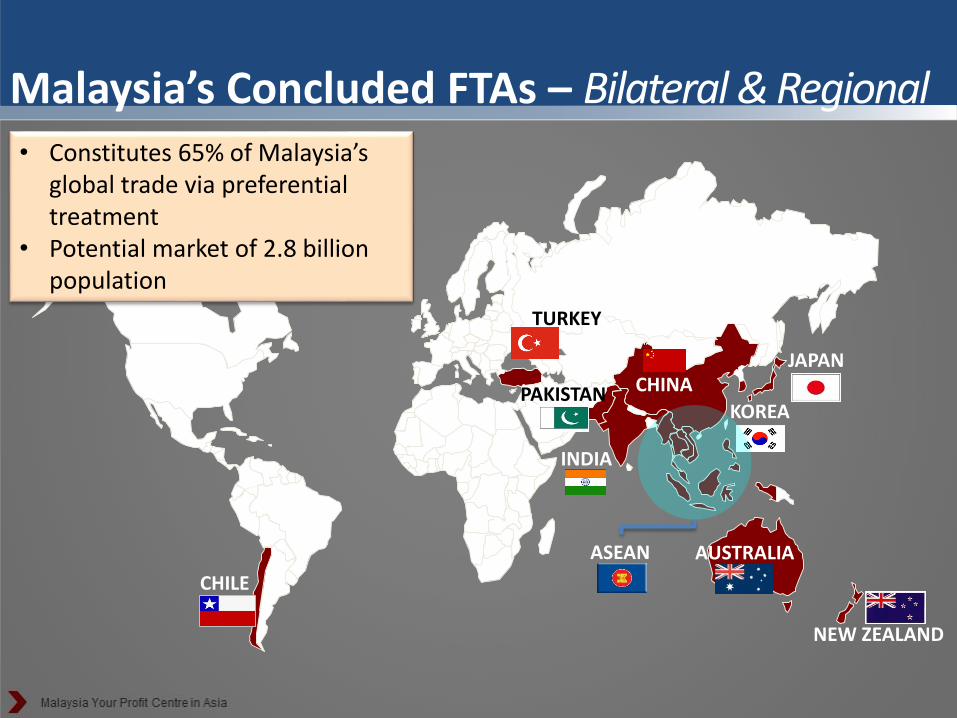
Malaysia’s Concluded FTAs – Bilateral & Regional
INDIA
PAKISTAN CHINA
ASEAN
KOREA
JAPAN
AUSTRALIA
NEW ZEALAND
CHILE
• Constitutes 65% of Malaysia’s global trade via preferential treatment
• Potential market of 2.8 billion population
TURKEY

Population 625 million
- Youth 60%
GDP USD2,398 billion
GDP Growth 5.1%
GDP per capita USD3,837
Total Trade USD2,511 billion
- Intra-ASEAN USD608 billion
- Ratio to GDP 104.7%
Total FDI USD122.4 billion
- Intra-ASEAN USD21.8 billion
Tourist Arrivals 89.3 million
- Intra-ASEAN 39.9 million
ASEAN – AT A GLANCE
- www. mida.gov.my - INVEST IN MALAYSIA > YOUR PROFIT CENTRE IN ASIA
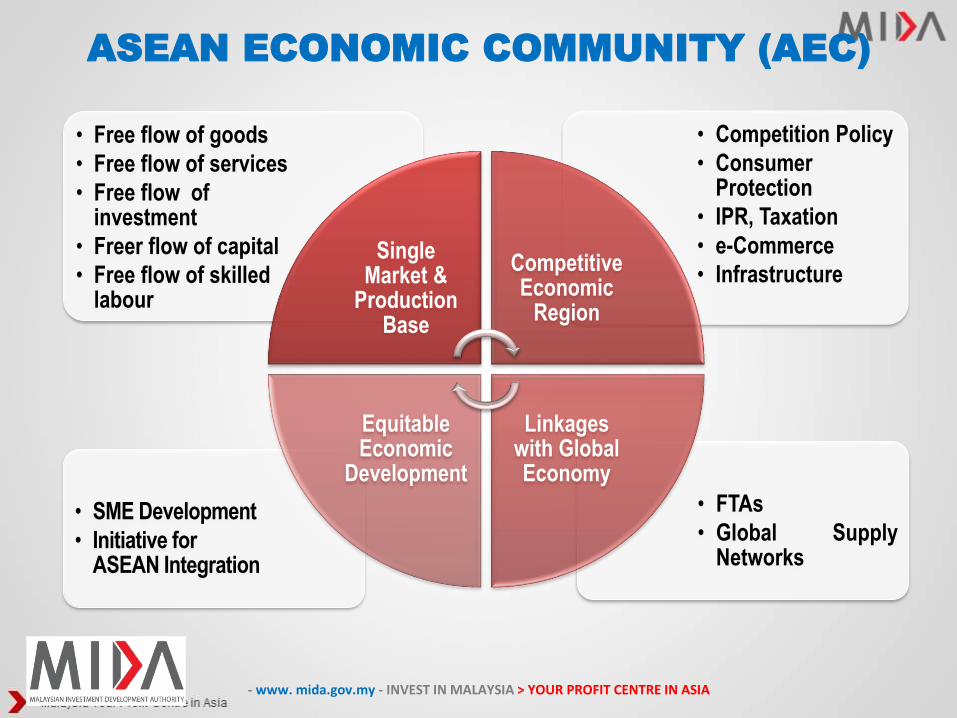
• FTAs
• Global SupplyNetworks
• SME Development
• Initiative for ASEAN Integration
• Competition Policy
• Consumer Protection
• IPR, Taxation
• e-Commerce
• Infrastructure
• Free flow of goods
• Free flow of services
• Free flow of investment
• Freer flow of capital
• Free flow of skilled labour
Single Market &
Production Base
Competitive Economic
Region
Linkages with Global Economy
Equitable Economic
Development
ASEAN ECONOMIC COMMUNITY (AEC)
- www. mida.gov.my - INVEST IN MALAYSIA > YOUR PROFIT CENTRE IN ASIA

3rd largest market in the world
Population in million
JAPAN
128
EU
502
INDIA
1,195
CHINA
1,340
USA
310
ASEAN
625
7th largest economy in the world
GDP 2013 in US$ trillion
Brazil
ASEAN
United Kingdom
France
Germany
Japan
China
United States 16.8
9.2
4.9
3.7
2.8
2.7
2.4
2.2
Fast growing economy
Real GDP Growth 2013 (%)
7.7
5.2
5.0
Japan
United States
India
ASEAN
China 7.7
5.2
5.0
2.2
1.6 Source: ASEANStat, IMF, WB
- www. mida.gov.my - INVEST IN MALAYSIA > YOUR PROFIT CENTRE IN ASIA
ASEAN: GROWING THROUGH ECONOMIC
INTEGRATION

Thank you
For more information
Visit: www.mida.gov.my
Zarina SaadDirectorMalaysian Investment Development Authority6th Floor, BürkleinhausBürkleinstraße 1080538 MunichGermanyTel: +49 89 203 0043 0Fax: +49 89 203 0043 15E-mail: [email protected]