Embed Size (px)
Citation preview

A New Generation in Strategy Consulting
Investment Consulting Associates (ICA)
Jersey’s Role as International Financial Centre: Facilitating and Enhancing Foreign Direct Investment
Investment Consulting Associates HQ, Amsterdam
H.J.E. Wenckebachweg 210 1096 AS Amsterdam The Netherlands P: +31 20 217 0115
Investment Consulting Associates, Massachusetts
2345 Washington St, Unit 201 Newton Lower Falls, Massachusetts 02462 USA P: +1 617 314 6527
Report 1 Principles and Trends
April 2015
www.ic-associates.com www.locationselector.com www.icaincentives.com

A New Generation in Strategy Consulting ii

A New Generation in Strategy Consulting iii
Table of Contents
List of Figures .................................................................................................................................................... iv
List of Tables ...................................................................................................................................................... iv
Table of Acronyms .............................................................................................................................................. v
Chapter 1 - Principles and Trends of Offshoring and Foreign Direct Investment ................................................... 1
1.1 Introduction ................................................................................................................................................. 1
1.2 Background................................................................................................................................................... 1
1.2.1 FDI made by corporate investors .......................................................................................................... 2
1.2.2 FDI made by High Net Worth Individuals .............................................................................................. 3
1.2.3 Greenfield FDI ....................................................................................................................................... 3
1.3 Understanding the Attractiveness of IFCs for FDI ........................................................................................ 4
1.3.1 Reasons for using IFCs for FDI ............................................................................................................... 7
1.3.2 Nature of services and investment vehicles IFCs provide ................................................................... 10
1.4 The Attractiveness of Jersey as an IFC for Facilitating FDI ......................................................................... 11
1.5 Activities of Jersey’s IFC.............................................................................................................................. 15
1.6 FDI Trends .................................................................................................................................................. 18
1.6.1 Global Trends ...................................................................................................................................... 18
1.6.2 Investments by High Net Worth Individuals ....................................................................................... 26
1.6.3 Closing Remarks concerning Global FDI .............................................................................................. 29

A New Generation in Strategy Consulting iv
List of Figures Figure 1 Scheme of Foreign Direct Investment (top) and Foreign Indirect or Portfolio Investment (bottom) .......................... 2
Figure 2 The position of FDI international finance jurisdictions in the current economic context ............................................ 5
Figure 3 IFC Cycle in attracting, adding-value and redirecting FDI............................................................................................. 6
Figure 4 Position of an IFC as intermediary of FDI ..................................................................................................................... 7
Figure 5 The five conducts determining the attractiveness of IFCs ........................................................................................... 8
Figure 6 Outlook for Real GDP Growth Rates, World and Select Regions (2013 – 2015F) ....................................................... 19
Figure 7 Forecasted Share of FDI outflows by group of countries ........................................................................................... 19
Figure 8 History of global inward and outward FDI, 1970-2013 .............................................................................................. 20
Figure 9 UNCTAD’s Top 20 FDI Source Economies 2013 and rank 2012 (US$ billion) .............................................................. 22
Figure 10 UNCTAD’s Top 20 FDI Host Economies 2013 and rank 2012 (US$ billion) ............................................................... 23
Figure 11 Plot of HNWI population growth against total growth in wealth ............................................................................ 28
List of Tables Table 1 Regional breakdown of FDI outflows 2011 – 2013 (US$ billion) ................................................................................. 21
Table 2 Breakdown of FDI components for developed countries ............................................................................................ 24
Table 3 Breakdown of FDI for developing countries ................................................................................................................ 25
Table 4 Number of HNWIs (in millions) ................................................................................................................................... 26
Table 5 Top 25 HNWI Population Ranking 2013 (in thousands) .............................................................................................. 27
Table 6 Wealth distribution by region 2008 - 2013 ................................................................................................................. 27
Table 7 Breakdown of HNWIs segments by population and wealth ........................................................................................ 28
Table 8 Asset breakdown of HNWIs wealth worldwide (2013 – 2014) .................................................................................... 29
Table 9 Asset breakdown by region (Q1 2014) ........................................................................................................................ 29
Table 10 Top 20 Source economies for HNWIs and FDI and destination economies for FDI, 2013 ......................................... 30

A New Generation in Strategy Consulting v
Table of Acronyms
Acronym Definition
AIM Alternative Investment Market
APEC Asia-Pacific Economic Corporation
BEPS Base Erosion and Profit Shifting
BVI British Virgin Islands
CDIS Coordinated Direct Investment Survey
CIS Commonwealth of Independent States
CISE Channel Islands Securities Exchange
CIT Corporate Income Tax
CRS Common Reporting Standard
CSP Customer Service Provider
DTA Double Taxation Agreement
DTC Double Taxation Convention
EIM European Investment Monitor
EU European Union
FATCA Foreign Account Tax Compliance Act
FATF Financial Action Task Force
FDI Foreign Direct Investment
FII Foreign Indirect Investment
FPI Foreign Portfolio Investment
FTSE Financial Times Stock Exchange
GBP Great Britain Pound
GCC Gulf Cooperation Council
GDP Gross Domestic Product
GFCI Global Financial Centres Index
GILD Global Investment Locations Database
HNWI High Net Worth Individual
IBC International Business Company
ICA Investment Consulting Associates
ICT Information and Communications Technology
IFC International Financial Centre
IMF International Monetary Fund
IOSCO International Organization of Securities Commissions
JFL Jersey Finance Limited
JFSC Jersey Financial Services Commission
LSE London Stock Exchange
M&A Merger and Acquisition
MNC Multinational Corporation
NASDAQ National Association of Securities Dealers Automated Quotations
OECD Organisation for Economic Co-operation and Development
Res. Non-Dom. Resident Non-Domiciled
SFM Specialist Fund Market
SIE Small Island Economy
TIEA Tax Information Exchange Agreement
UK United Kingdom
UNCTAD United Nations Conference on Trade and Development
US United States
US$ United States Dollar
VAT Value-Added Tax
WIR World Investment Report

A New Generation in Strategy Consulting 1
Chapter 1 - Principles and Trends of Offshoring and Foreign Direct Investment
1.1 Introduction
Jersey Finance Limited (JFL) has commissioned Investment Consulting Associates (ICA) to produce an
evidence-based research paper on Jersey’s competitiveness to attract and to mobilise foreign direct
investment (FDI). Founded in 2001, JFL is a non-profit making organisation funded by members of
the local finance industry and the States of Jersey government and its main task is to represent and
promote Jersey as a well regulated and global International Financial Centre (IFC).
ICA assessed Jersey’s international position as an intermediary of FDI, specifically geared towards
the contribution of its finance industry in terms of attracting, pooling and redirecting flows of FDI.
The objectives of this study are:
• Understand the context and features of the network of international financial centres in
which Jersey operates;
• Examine the role of international financial centres and their network in terms of facilitating
global flows of FDI;
• Clarify Jersey’s attractiveness as an international financial centre for its role as intermediary
of FDI by assessing the activities performed and services provided by Jersey’s international
finance industry;
• Evaluate global and regional trends in the landscape of FDI to identify FDI market
opportunities;
• Position Jersey as a facilitator of inbound and outbound FDI as well as Greenfield FDI
statistics;
• Provide a breakdown of the activities and services of Jersey’s finance industry and relate
them to international sources and destinations of FDI; and
• Determine Jersey’s contribution to global economic developments as a result of its outward
FDI flows.
1.2 Background
The international finance industry has been recognised as an attractive economic development
strategy by many small island economies (SIEs) located in the Caribbean (Cayman Islands, The
Bahamas, and the Netherlands Antilles), the Pacific (Vanuatu), the Indian Ocean (Mauritius), and the
periphery of the European Union (the Channel Islands, Isle of Man, Cyprus, Malta, and Madeira).
In the latter group, Jersey emerged in the 1960s as a major International Financial Centre (referred
to as “IFC” from here onwards) within the present global financial system. Jersey's success as an
island IFC raises competitive questions of how the island contributes to economic development as
facilitator for intermediary flows of foreign direct investment (FDI) and how the island compares to
other IFCs.
A careful understanding and scoping of the meaning of “FDI” is required to be able to determine
Jersey’s role in attracting inward and hosting outward FDI flows. The next sections will further
outline the different definitions of FDI and concludes by scoping the definition that will be used to
assess Jersey’s position in the global arena for FDI.

A New Generation in Strategy Consulting 2
1.2.1 FDI made by corporate investors
The process of investing consists of two parties: the investment is made by a company or entity in
one country (i.e. “direct investor”) into a company or entity based in another country (i.e. “direct
investment enterprise”). OECD’s definition states that the foreign investor must own at least 10% or
more of the voting stock or ordinary shares of the company into which the investment is made. FDI
is associated with new investments as well as the takeover and transfer of existing tangible assets,
including stakes in other companies. This implies a lasting interest between the direct investor and
the direct investment enterprise based on the transaction of (voting) power. In other words: the
establishment or acquisition of foreign assets, aimed at generating additional revenue, that is
associated with obtaining a long-term degree of ownership or management control of the foreign
entity. IMF and UNCTAD use similar definitions and UNCTAD’s annual World Investment Reports are
based on these global inward and outward FDI flows as well as FDI stocks.
It is this degree of power that distinguishes FDI from Foreign Indirect Investment (“FII” - also referred
to as portfolio investments). As opposed to FDI, Foreign Indirect Investment is primarily engaged
with investing in equities listed on a foreign stock exchange or, in other words, transferring the
ownership of securities from an entity based in one country to an entity based abroad. This includes
financial institutions purchasing a foreign country’s securities, bonds or shares. As such, the investor
does not exercise a degree of direct control or management. Goals tend to be more short-term and
are limited to achieving capital gains.
Figure 1 Scheme of Foreign Direct Investment (top) and Foreign Indirect or Portfolio Investment (bottom)
Source: Investment Consulting Associates – ICA (2014)
Figure 1 visualises the difference between FDI on the one hand and FII on the other hand, where
Company A represents the direct investor whilst Company B represents the direct investment
enterprise.
Country
X
Company A
Country
Y
Company B
Assets
Institution B Institution A
Interest and Dividends
Securities, Bonds and Shares
Corporate Profit and Earnings

A New Generation in Strategy Consulting 3
FDI can take several forms: establishing a foreign branch, subsidiary or associate company; acquiring
shares of an overseas company; or by means of a merger or joint venture between two foreign
companies. Strategically FDI comes in three types:
Horizontal FDI: the investment made abroad involves the same activity which is undertaken
at home;
Vertical FDI: the investment abroad involves another activity than the one(s) undertaken at
home. This usually encompasses both upstream (e.g. material suppliers) and downstream
(e.g. distributors) activities on the company’s supply chain; and
Conglomerate: the investment abroad involves a completely different activity than the
one(s) undertaken at home and is usually associated with entering new market and a new
industry simultaneously in order to diversify its production portfolio.
1.2.2 FDI made by High Net Worth Individuals
The sources mentioned in the previous section focus on the corporate transactions, but do not take
into account High Net Worth Individuals (HNWIs) and internationally mobile and expatriate “mass
affluent.” Like corporate investors, HNWIs undertake investment decisions and use legal investment
vehicles to optimise their international investment revenues.
Although there is no precise definition of how wealthy somebody must be to fit into this category,
“High Net Worth” is generally quoted in terms of liquid assets over a certain figure. The most
commonly quoted figure for membership in the high net worth "club" is $1 million (approx.
£630,000) in liquid financial assets. An investor with less than $1 million (approx. £630,000) but
more than $100,000 (approx. £63,000) is considered to be "affluent," or perhaps even "sub-HNWI."
The upper-end of HNWI is around $5 million (approx. £3.2 million), at which point the client is then
referred to as "very HNWI." More than $50 million (approx. £31.9 million) in wealth classifies a
person as "ultra HNWI". This growing group of HNWIs is increasingly engaging in global FDI and
therefore actively seeking for international trust and banking services: services that are dominantly
present in IFCs such as Jersey.
1.2.3 Greenfield FDI
According to the Lexicon of the Financial Times, FDI is defined as “the investment from one country
into another,1” which is mostly undertaken by businesses rather than by governments, institutions,
or private individuals. This definition of FDI is more strict and traditional in the sense that it only
includes the establishment of physical operations such as manufacturing plants, distribution centres,
financial shared service centres, and regional headquarters. When such operations are set up from
scratch it is perceived as “Greenfield FDI” whilst modernising or reconfiguring existing facilities is
termed “Brownfield FDI.”
Various proprietary databases provide a useful means for assessing the global landscape of
Greenfield FDI projects. Examples of such databases are the European Investment Monitor (EIM),
the Global Investment Locations Database (GILD), fDiMarkets.com and a more industry-orientated
New Plant Database.
1 Financial Times Lexion (2014)
A New Generation in Strategy Consulting 4
Thus, rather looking at capital flows of FDI between one country and another, this data is presented
at a firm level and focuses on physical operations. As companies can raise capital locally, phase their
investment over a period of time, or channel their investment through different countries to benefit
from their business climate and competitive advantages, the data demonstrated with these sources
are different than the official UNCTAD, OECD and IMF data on FDI flows.
The data presented is also a more accurate reflection of the benefits of the real investments
companies are making in their overseas subsidiaries, and how this stimulates the global and local
economy in terms of invested capital and number of jobs created.
Concluding, economic developers refer to FDI in terms of new production or logistics facilities, while
financial practitioners for example use the acronym for investment flows comprised of equity
investment, intra-company loans, investment funds and other forms of cross-border capital flows.
The latter definition will be leading given the context and nature of this report. Passive capital -
which is pooled in an IFC, put into an investment vehicle and at some point transferred into real
assets in another jurisdiction - is beyond the scope of this definition. However, when another
definition of FDI is referred to (e.g. only Greenfield FDI or HNWI FDI) or used to measure FDI (e.g.
UNCTAD, IMF, OECD or fDiMarkets.com), it is explicitly notified.
1.3 Understanding the Attractiveness of IFCs for FDI Understanding the uniqueness of IFCs in terms of transferring FDI requires a distinction between FDI
flowing exclusively to and from onshore jurisdictions as opposed to FDI flowing to and from offshore
and international financial centres. The roots of the definition of “offshore” and “onshore” can be
traced back to the special constitutional relationship which existed between the UK and a number of
overseas territories, particularly the Channel Islands and the Isle of Man.
British companies and individuals investing in a company or transferring money to an account in
these jurisdictions, invested “off the shore.” The term gradually became associated with making a
cross-border investment in a jurisdiction offering certain benefits over the home jurisdiction (e.g. tax
advantages, simplified business start-up procedures). In order to distinguish from other types of
financial centres, such jurisdictions were termed “offshore” or “international financial centre” (IFC).
The current definition of IFCs adheres to the principle that these jurisdictions offer unique and
customised fiscal, institutional and regulatory regimes vis-à-vis home “onshore” jurisdictions.
A considerable number of small island jurisdictions across the Caribbean, the Mediterranean, and
the South Atlantic, Indian and Pacific Oceans, as well as the Antarctic are considered to be IFCs. IFCs
in the Pacific and Caribbean were established as a means to encourage economic development after
their independence from the UK in the 1960s. The finance industry was perceived as one of the few
approaches to economic development for small island nations as it would have a relatively low
impact on local resources whilst simultaneously delivering high gains contrary to more traditional
industries such as agriculture and tourism. During the period of neoliberalism in the 1980s, whereby
financial markets were increasingly liberalised and capital controls abolished, the demand for
financial services provided by IFCs increased considerably.
It should come as no surprise that this demand has only accelerated due to the intertwined process
of globalisation and financialisation, which both revolve around the decreasing significance of
national boundaries for people, trade and capital. The coevolution of financialisation (which implies

A New Generation in Strategy Consulting 5
increasing importance of the finance industry in the operations of the global economy) and
globalisation (the increase in cross-border economic activities) has led to an increased scope and
depth of global financial integration.
This global financial integration has enabled the development of so-called “investment vehicles”,
which are defined as “legal entities used by investors to organise their international corporate
footprint”2. Examples of such investment vehicles include trusts, offshore companies and
international business companies (IBCs), which effectively are a form of offshore companies. As
organisational backbone, investment vehicles allow the internationalisation of corporate networks,
thereby organising companies along the lines of cross-border intra-firm structures linked by FDI.
Therefore, these cross-border intra-firm flows are included in the FDI definition used throughout this
report.
IFCs, as key providers of investment vehicles and supporting financial services, increase the scope
and flexibility of capital, taking the role of hubs in corporate networks spanning across various
onshore and international finance jurisdictions. Companies organising their intra-firm structure by
means of IFC’s investment vehicles are perceived as foreign direct investors since they transfer (part
of) their assets across borders albeit via an intervening jurisdiction (i.e. IFC).
This phenomenon challenges the traditional notion of FDI, which is associated with real and physical
operations of multinationals (i.e. Greenfield). The increasing scale, scope, speed, and impact of such
complex international intra-firm structures through a network of IFCs further fuelled globalisation
and financialisation. This is because the advanced financial services of an IFC are instrumental in
facilitating global FDI flows and closes the virtuous circle (as visualised in Figure 2). This can be
characterised as “cumulative causational” as the structure reinforces its cycle continuously.
Figure 2 The position of FDI international finance jurisdictions in the current economic context
Source: Investment Consulting Associates – ICA (2014) based on Haberly and Wójcik (2013)
2 Haberly, D. and Wójcik, D. (2013) “Regional Blocks and Imperial Legacies: Mapping the Global Offshore FDI Network”, Working Papers in Employment, Work and Finance, No. 13-07
Globalisation & Financialisation
Global Financial
Integration
Investment Vehicles and
Services
International Intra-Firm Structures
Global FDI Offshore Network

A New Generation in Strategy Consulting 6
In short, IFCs - through their advanced financial services enabling the formation of investment
vehicles - operate in a global network of FDI. Indeed, investment vehicles allow multinationals to be
organised as cross-border intra-firm structures through which assets are controlled and transferred.
IFCs intermediate flows of FDI by means of their financial services providers and products (i.e.
investment vehicles). This leads to two possible roles for IFCs:
1. IFCs act as a channel and re-distribution function in that they attract, pool and direct flows
of FDI (e.g. equity, intra-company loans) between source and destination jurisdictions,
enabling international patterns of FDI; and
2. IFCs also act as a channel and re-distribution function in that they attract, pool and direct
flows of FDI (e.g. re-invested earnings) between destination and source jurisdictions,
increasing the global volume and profitability of FDI.
Figure 3 conceptualises this process. The first function is shown by the blue arrow towards the IFC,
containing FDI from source countries A, B and C. The value-adding in the IFC is executed through its
activities such as banking, trusts, funds and capital markets, which, in turn, attract Greenfield FDI to
the IFC (e.g. foreign banks). After the FDI has been pooled, it is ready to be directed as outward FDI
to destination countries X, Y and Z. As the IFC shifts the pattern of FDI and assets from countries A, B
and C to countries X, Y and Z.
FDI in other countries are expected to deliver profits and earnings, which are in turn re-directed to
source countries through the IFC. These earnings may be re-invested and eventually lead to an
increased volume of global FDI, visualised by the larger green arrow of inward FDI. In all, this cycle
enhances the profitability of FDI, thereby pushing the elasticity of the return on investment and
generating flows of FDI that are likely to have not existed in absence of the IFCs and the favourable
regulatory and fiscal climate they offer.
Figure 3 IFC Cycle in attracting, adding-value and redirecting FDI
Source: Investment Consulting Associates – ICA (2014)

A New Generation in Strategy Consulting 7
1.3.1 Reasons for using IFCs for FDI
In addition to advanced financial services and complex investment vehicles, IFCs provide an
environment in which international business can be conducted without risks of double taxation, or a
legislative and administrative bias in favour of the “home” jurisdiction. Their regulatory and
supervisory frameworks are more tailor-made to the requirements of their specific clientele, and can
provide a safe location for those conducting business in unstable and risky countries.
One of the crucial elements of FDI is the safe transfer of assets (i.e. capital, funds, ownership) from
the direct investor to the direct investment enterprise through cross-border intra-firm structures.
After all, FDI encompasses the takeover of existing tangible assets (M&As, joint-ventures) or the
establishment of a new operating facility (Greenfield), which requires capital.
This is where IFCs play their critical role. IFCs provide advanced financial services combined with a
solid institutional investment climate in which facilitating, administering and managing effective
cross-border transfers of assets can be assured.
Figure 4 Position of an IFC as intermediary of FDI
Source: Investment Consulting Associates – ICA (2014)
This structure permits IFCs to function as geographical brokers of FDI - connecting jurisdictions that
have a deficit of FDI to those with a surplus of potential FDI. By (re)distributing flows of FDI, IFCs
increase the scope of and flexibility of global capital and act as financial intermediaries or “carriers of
capital”, harbouring FDI in transit and redistributing flows of FDI.
According to UNCTAD’s 2013 World Investment Report (WIR), investments routed through IFCs
continue at historically high levels and account for a six percent share in global FDI flows, amounting
up to almost $80 billion (£51.3 billion) in 20123. Other sources4 claim a higher share, even up to
thirty percent. However, this variety of statistics must be treated with caution and may be
communicated in a certain way to underline various perceptions towards IFCs (e.g. organisations
that relate IFCs to tax injustice). Please note that capital invested by HNWIs are not part of the FDI
definition by UNCTAD. According to independent sources, the total capital of HNWIs in IFCs
3 UNCTAD (2013) “World Investment Report” 4 Amongst others, Christensen (2012)
Profits and Earnings
Country
X
Company A
Country
Y
Company B
Assets
IFC
IFC Services &
Activities

A New Generation in Strategy Consulting 8
accounted for 19%.5 Assuming an equal FDI volume would imply a 12.5% share of global FDI held by
IFCs.
Generally, IFCs provide a stable institutional and regulatory environment, better functioning
financial markets, tax-neutral solutions and legal neutrality, attracting investors and their
investments from all over the world. The integral attractiveness of IFCs can be conceptualised by five
dimensions or “conducts”, as Figure 5 below demonstrates:
1. Doing Business Conduct: general prerequisite and geo-political requirements for hosting IFCs
(e.g. time zone, connectivity, infrastructure);
2. Fiscal Conduct: customs union, fiscal autonomy, tax regimes (e.g. Corporate Income Tax,
withholding taxes, tax neutrality);
3. Regulatory Conduct: regulatory supervision, regulatory development, international
standards (e.g. specialised services, expertise, administration of financial transactions, low
administrative burden);
4. Reputational Conduct: image and relationship between political and legal framework; and
5. Transparency Conduct: confidentiality and compliance rules (e.g. automatic exchange of
information). Figure 5 The five conducts determining the attractiveness of IFCs
Source: Investment Consulting Associates – ICA (2014) based on Karhunen et al (2011)
The attractiveness of an IFC is determined by the interaction between these five conducts and is
reliant upon the nature and purpose of assets channelled through the particular IFC.
FDI passing through IFCs seems to be driven by other determinants than onshore, traditional FDI.
Traditional location determinants on which foreign investors base the location selection of their
investment might include the quality of the labour force, labour costs, utility costs, natural resource,
infrastructure and the regulatory framework. Location determinants for FDI passing through IFCs are
5 Aerni et al. (2008); Becerra et al. (2010); Capgemini and Merril Lynch (2010)

A New Generation in Strategy Consulting 9
more complex to disentangle than the determinants for onshore FDI since these are directly related
to the financial services and investment vehicles offered in the IFC. As such, they emphasise the very
difference in nature between the onshore “direct” and offshore/IFC “intermediary” FDI. When
investigating FDI location determinants of IFCs more in-depth, inward FDI needs to be distinguished
from outward FDI as FDI can be “pushed” from the source country and/or “pulled” towards the
destination country, respectively. Of course, it should be noted these location determinants interact
with each other.
Location determinants of FDI passing through IFCs Location drivers of investing via an IFC rather than investing directly are generally related to the
existence of low- or no-tax schemes and the advanced financial services present in IFCs. IFCs might
offer beneficial structures with regards to Corporate Income Tax (CIT) and withholding taxes.
Withholding taxes are taxes levied on interest, dividend and royalties directed to foreign entities or
individuals. Double Taxation Agreements (DTAs) are implemented to avert taxation of the same
income by different jurisdictions.
However, some DTAs provide for automatic exchange of information. These will become less
relevant given the development and implication of the Common Reporting Standard (CRS), which is
the new global information standard for the automatic exchange of information developed by the
OECD. The legal basis for exchange of data is the Convention on Mutual Administrative Assistance in
Tax Matters, hosted by the OECD and the Council of Europe. Its origin can be traced back to the US’
Foreign Account Tax Compliance Act (FATCA) implementation agreements. Nearly 50 jurisdictions
had joined this task force and committed to the early adoption of the CRS by September 2014.
The automatic exchange of information could potentially discourage the flows of FDI to and from
IFCs. Due to the introduction of the CRS, it is however less likely automatic exchange of information
is perceived a factor which could potential hinder FDI.
In addition to factors which pull FDI to IFCs, assets are pushed away from source countries as a result
of a weak institutional framework and poor rule of law. Firms seek for alternative ways to mitigate
risks of domestic institutional constrictions, including6:
Underdeveloped or complete lack of intellectual property rights protection;
Poor enforcement of commercial laws;
Non-transparent judicial system and lack of independent judiciary;
Ineffective financial market intermediaries;
Political instability;
Unpredictable regulatory changes and regulatory uncertainty;
Governmental interference;
Bureaucracy; and
Corruption in public service and government sectors.
6 Karhunen, P., Ledyaeva, S., Kosonen, R., and Whalley, J. (2013) “Round-trip investment between offshore financial centres and Rusia: An empirical analysis”
A New Generation in Strategy Consulting 10
IFCs compensate for these institutional impediments by offering a well-regulated, tax neutral and
politically stable investment climate with dedicated financial infrastructure, ensuring consistency,
reliability and enforceability of legal codes. Although not the case in Jersey, the choice for a certain
IFC is furthermore affected with some IFCs providing additional secrecy and confidentiality laws.
1.3.2 Nature of services and investment vehicles IFCs provide
IFCs have developed to meet the increasing demand of global business and (wealthy) internationally
footloose individuals with regards to facilitating cross-border transactions of assets through intra-
firm structures and investment vehicles.
Perhaps the most essential amenity is the fact that capital and savings secured in offshore vehicles
may be exempted from Corporate Income Tax, VAT, sales tax and/or capital gains, inheritance or
estate tax. The most common shape offshore companies take is the form of an “international
business company” (IBC).
In addition, the nature of services IFCs typically deliver to international companies are associated
with:
Investment vehicles: investment vehicles provided by IFCs are used for a wide range of
purposes and activities, including shipping registry, registration of motor vehicles, managing
intellectual property rights and real estate, protection of assets, managing and
administrating investment funds and captive reinsurance;
Jurisdictional neutrality: being independent of the home jurisdictions of the various parties
of the transactions adds little or no additional cost. This facilitates, for instance, the
establishment of joint ventures;
Administrative convenience and minimum red-tape: a neutral location for administrative
tasks permits the business or individual to remain footloose without the risk of additional
taxation or costs as the foreign investor is allowed to take on the national identity (i.e.
citizenship) of the IFC;
Tax neutrality: for services such as fund and asset management, it is crucial investors are not
burdened with double taxation (i.e. only taxed in their domicile jurisdiction). IFCs allow
assets to be attracted, developed and/or distributed across borders without any additional
taxation;
Regulatory specialisation: small jurisdictions such as IFCs have the advantage of being able to
concentrate resources on regulating specific types of financial services effectively (as
opposed to larger countries which have to allocate their resources to a wider range of
sectors and industries). The result is regulation customised to financial sector activities and
services;
Country risk mitigation: due to a stable and consistent institutional framework, assets can be
harboured and protected from potential loss, damage or confiscation resulting from socio-
political instable and insecure locations; and
Domestic taxation regimes: no- or low-tax provisions for residents, businesses and
registered entities can be provided in IFCs. Local employment in high-end financial services
generates high levels of local prosperity which in turn permits low taxation on domestic
incomes, profits and sales.

A New Generation in Strategy Consulting 11
1.4 The Attractiveness of Jersey as an IFC for Facilitating FDI As indicated previously, the attractiveness of an IFC is determined by the interaction of the doing
business conduct, fiscal conduct, regulatory conduct, reputational conduct and transparency
conduct. This conceptualisation can be applied to Jersey to investigate its attractiveness for hosting
its IFC. These five conducts collectively determine the attractiveness – or proposition - of Jersey as
an international financial cluster of advanced financial services and skilled financial and legal
professionals for the purpose of facilitating FDI.
Doing Business Conduct Jersey has certain unique geo-political attributes which serve as prerequisites for hosting an IFC.
Jersey’s proximity to one of the major financial centres in the world - the City of London - is crucial as
flows of capital to and from IFCs seem to be organised in regional networks where such centres act
as a capital hub. Jersey’s labour force is native English-speaking and has a sophisticated ICT
infrastructure as well as air transportation infrastructure with frequent UK and European
connections.
In terms of its geographic position, Jersey is conveniently situated in the Greenwich time zone. The
location within this time zone enables Jersey-based businesses and institutions to operate
simultaneously with Asian countries and countries in the Middle East in the (early) morning whilst
sharing the workday with clients based in the Americas in the afternoon. During a workday, an area
stretching from the USA’s West Coast to Hong Kong can be covered.
In addition to its geographic position, this conduct reflects the general governance in a country i.e.
the traditions and institutions by which authority in a country is exercised. It provides a picture of
the general doing business climate and perception to (foreign) investors of this business climate. This
includes, amongst others, the level of corruption, absence of violence and war, political stability,
effectiveness of local administration and the extent to which the rule of law is respected. All of such
elements determine the general environment in which business can be conducted. Clearly, this
overlaps with other conducts (i.e. regulatory and reputational conduct) but it should be stressed the
interaction between the five conducts determines the overall attractiveness.
Fiscal Conduct Replacing traditional French currency, British sterling became the legal currency in Jersey in 18347.
Jersey is in a currency union with the UK but has maintained monetary sovereignty to issue its own
currency, which is at par with the British pound sterling. The Jersey Treasury functions as monetary
authority and acts independently from the Bank of England although Jersey’s monetary policy is
closely aligned with the UK’s monetary policy.
This currency union based on a major and stable global currency is of unambiguous importance for
any high-quality IFC. For the investor’s perspective, risks are mitigated as a result of a currency union
with a major trading currency, which enables them to operate and invest in a relatively risk-free
financial space. For Jersey, on the other hand, the link with a major global currency prevents other
local industries and businesses to be crowded out by the financial services. In the absence of a link
with a major global currency, the local currency would appreciate heavily as a result of a strongly
7 Lamin, B. (2006) “Monetary and exchange-rate agreements between the European Community and Third Countries”, European Economy European Economy Economic Papers, No. 255

A New Generation in Strategy Consulting 12
increased demand for its local financial services. A strong local currency vis-à-vis currencies of
trading countries implies a weaker competitive position for local manufacturing and exporting
industries as well as the tourism industry. This seriously affects the competitiveness and export
position of the local industries, gradually leading to a decline of these activities.
With a currency union in place, local industries might eventually still be crowded out by the IFC but
the IFC has a longer time window to gradually expand into the local economy without serious direct
economic consequences and unemployment.
Despite the currency union, as is the case for other Crown Dependencies, Jersey is self-governing,
self-legislating, self-administering and self-financing, and therefore enjoys full fiscal autonomy.
Jersey’s fiscal policies have remained stable over the last century. Introduced in 1928 at a rate of
2.5%, personal income tax has eventually been raised to 20% whilst the standard CIT rate is 0%
(though financial service companies are taxed at 10%). The combination of steady inflows of capital
from UK individuals and businesses from the 1960s onwards and a relatively minimal welfare state
have resulted in a continuous budget surplus for Jersey without the need to redevelop fiscal policies.
This ensured the continuity of its favourable low tax rates.
Finally, Jersey’s tax neutrality does not mean companies can establish a tax structure which implies
lower effective tax rates than companies would face in other countries as the company remains
obliged to be taxed on its local assets.
Regulatory Conduct Small island jurisdictions often face constraints in terms of a minimal pool of qualified labour, lack of
regulatory expertise and a small civil service. On the other hand, such small jurisdictions possess the
advantage of developing customised rules and regulation and devote resources to support advanced
financial services just because of their small scale.
Jersey, having decades of experience in offering financial services, has a labour force of over 12,500
(i.e. or 22.2% of Jersey’s total workforce8) specialised employees, including policy-makers and civil
service providers. The fact that Jersey has a long-standing tradition as host of financial services
suggests a coevolution of a dedicated regulatory framework and experienced workforce to support
the ever-increasing substance of the financial cluster. The financial cluster present in Jersey would
never have developed without such a regulatory conduct.
The Jersey Financial Services Commission (JFSC) – made up of 135 employees (of which 100 direct
supervisory regulators) - is an asset in this context as it is responsible for the regulation, supervision
and development of the financial services sector in Jersey. The JFSC functions as the supervisory
body for the financial services industry which is subject to regulatory oversight of anti-money
laundering standards.
The JFSC was founded in 1998 after an investigation into the architecture of financial services
regulation in the Crown Dependencies commissioned by the UK government.
The Financial Services (Jersey) Law 1998 stipulates its mandates and core objectives, ensuring a
degree of independence from the government and statutory footing for its own decisions. The JFSC
8 States of Jersey Statistics Unit (2013) “Jersey in Figures 2013”
A New Generation in Strategy Consulting 13
is concerned with regulating, licensing and supervising Jersey’s finance industry to ensure a fit and
modern financial services industry. The JFSC also runs the registry for company incorporations and
licenses regulated entities.
The JFSC is an important driver in enhancing Jersey’s attractiveness as an IFC (i.e. its proposition) as
new regulations allow for new bodies of incorporations and investment vehicles. Once an IFC has
secured its leading position in a specific segment or activity it is likely to remain the leading
jurisdiction. Jersey’s Foundation’s Law that passed in 2009, allowing for the incorporation of Jersey’s
Foundations, and Trust Law in 1984, protecting investors using trust vehicles, are examples of
improved regulatory leadership, putting Jersey ahead of the curve.
To adhere to these responsibilities, the JFSC has subscribed to a number of international standards
(e.g. the FATF, IOSCO, Basel Committee on Banking Supervision, OECD Global Forums on
Transparency and Exchange of Information for Tax Purposes and IMF assessments) to ensure the
scale, quality and legitimacy of Jersey regulation for the finance industry. Jersey is committed to
international standards of regulation and co-operates closely with the UK Regulatory Authorities and
authorities of other countries according to standards defined in bilateral agreements. JFSC will look
to improve the competitiveness of its domestic financial services providers by actively representing
their interests though this function is secondary to its core function.
Reputational Conduct Jersey’s reputation can be related to its sound, politically stable and well-regulated investment
climate, based on common law and certainly interacts with the previous conducts. Jersey’s 400-year
old constitution is based on a non-party political system. This implies that the international financial
industry and investors are not affected by the shifts in political parties and associated ideologies,
providing a stable, predictable and consistent policy regime. Rather than associated with political
parties, politicians act as individuals and represent various areas of interest.
This structure is a strong differentiator which favours Jersey over other IFCs which have more
complex and multiple parties’ political systems. The absence of an “opposition” or a wide range of
other political parties benefits the efficiency and speed of policy-making, which in turn is beneficial
to the IFC on the whole.
With regards to its legal framework, following Jersey’s Commonwealth roots, the legislation in Jersey
is based on common law (as opposed to civil law), which is practiced on the European continent.
Common law enables the establishment of certain investment vehicles (e.g. trusts) and is blended
with modern commercial principles, resulting in an established and well-respected legal framework.
Confidence, rule of law and certainty are secured through an independently operating and
experienced judiciary system founded on a significant body of well-reasoned case laws. Jersey’s legal
sector has been significantly supportive of the financial services industry and its clientele.
In a way, the JFSC protects Jersey’s IFC reputation since the JFSC may decline an application to
create a Jersey-based company. By means of this function, the JFSC has the ability to step in on
reputational risk ground in case a potential investor or client is considered not right for a particular
purpose. By doing so, the JFSC preserves the image and reputation of Jersey as it functions as
“gatekeeper” to ensure credible, transparent and trustworthy financial services providers.

A New Generation in Strategy Consulting 14
Transparency Conduct No form of entity (private, corporate or institutional) is exempted from access for the purpose of
information exchange in the event of a (suspected) crime. In Jersey, no banking secrecy laws exist. In
fact, with the implementation of the “Proceeds of Crime Law” in 1999, tax evasion in Jersey is
considered a crime. To adhere to this law, Jersey-based providers of financial services must report in
each and every case a transaction that is considered to be “suspicious.”
Jersey authorities know who the ultimate beneficiary owners are as these must be identified and
reported. The respective CSP must hold relevant details on the ultimate beneficiary owners since
this is a regulatory requirement. Jersey is characterised by its “compliant confidentiality”: it aims to
protect legitimate client data and information unless it hinders to exchange information as agreed
on in approximately 36 treaties and Tax Information Exchange Agreements (TIEAs) through the
OECD’s programme of Tax Information Exchange Agreements. It is a regulatory requirement that the
corporate service provider (CSP) must hold relevant details on the ultimate beneficiaries, who must
be identified and reported. Finally, Jersey has been a vanguard in voluntary tax transparency and has
been whitelisted by the OECD following the G20 Summit in April 20099 as substantially adhering to
and implementing international tax standards.
Overall Attractiveness: Jersey’s Proposition as IFC These five conducts collectively define and explain the competitiveness of Jersey as a cluster of
advanced financial services and skilled financial and legal professionals. Its international financial
industry can be typified as a centre with substance and critical mass in the breadth and depth of its
financial services in order to attract, pool and redirect cross-border FDI.
Jersey has the characteristics of a small island IFC, but also possesses the critical mass and a far-flung
cluster of advanced financial services to act as a major player on the international FDI market. Jersey
is positioned at the crossroads of small island IFCs and larger IFCs. Whilst other IFCs may have higher
levels of booked values, Jersey has higher levels of value-added and a wide range of financial and
supportive services actually present in Jersey’s cluster.
Jersey’s appeal to the world is that its “audience” (i.e. international investors) can use the island to
finance a broad range of activities, including FDI. Jersey is well-known for its tax neutrality. A Jersey-
based investment vehicle or structure itself is likely to attract no tax. Revenues generated elsewhere
might be taxed based on foreign tax liabilities though the Jersey-based vehicle or structure will not
be taxed due to the zero percent taxation regime. There might be tax liabilities all around the world
but the basic core structure is untaxed. This marginal benefit can become significant over time in
that the investment vehicle or structure which is used becomes financially efficient. Jersey’s tax
neutrality combined with well-developed company law and courts with good experience of
judgment in commercial matters and with investor protection regulation contribute to Jersey’s
attractiveness.
The difference between Jersey and other IFCs is based on individual products (e.g. Jersey’s
foundation law). Traditionally, Jersey has been stronger in the personal investment wealth
management and HNWIs space due to Jersey being the world leader in trust law. Jersey was the first
jurisdiction worldwide to have enacted a law dedicated to trusts and the protection of its users.
9 UK Parliament (2012) “Tax in Developing Countries: Increasing Resources for Development”
A New Generation in Strategy Consulting 15
Guernsey, for instance, specialised much faster than Jersey on captive insurance. Similar IFCs
specialising in the exact same financial services and investment vehicles are not needed. Different
products sets allow every IFC to offer slightly different services, which in turn minimises the (direct)
competition. In other words, thought leadership and innovation in the regulatory environment is
one of the key drivers for new business. Jersey’s Trust Law (1984) and Foundations Law (2009) are
examples of how regulatory innovation put Jersey’s IFC ahead of the curve of competitive centres as
it obtained the “first mover advantage”.
1.5 Activities of Jersey’s IFC
The previous section elaborated on the attractiveness of Jersey as an IFC. Jersey’s international
financial industry is instrumental in facilitating and transferring global flows of FDI. The island’s
robust legislation allows for the creation of trusts and other asset and investment management and
pooling vehicles, which makes it attractive to individuals, businesses and institutions with cross-
border asset portfolios. Since the functions and activities performed by Jersey’s IFC overlap, it is
difficult to disentangle sub-sectors and derive data. After all, these services are complementary to
each other and function as facilitators and multipliers of flows of FDI. Nevertheless, as of 2011, the
finance industry on Jersey has attracted over £1.2 trillion of wealth, on top of which Jersey has
enabled a total market capitalisation of £270 billion, which is distributed among the following
finance activities as follows10:
1. Banking;
2. Trusts settled by private individuals;
3. Trusts settled by companies and institutions;
4. Investment funds;
5. Capital markets; and
6. Greenfield FDI.
The last “activity” is not considered to be a dedicated service provided by Jersey’s finance industry.
Rather, it reflects the outcome of the other five activities, which - embodied in Greenfield FDI – is
present on Jersey as well as funded through Jersey. They provide additional substance in the form of
new banks, trust/company services providers, lawyers and accountants and add further credibility to
Jersey’s global position as a well-regulated IFC.
The services offered by Jersey’s finance industry encourage the physical establishment of foreign
financial services providers on the island, but also fund Greenfield FDI elsewhere through its
favourable fiscal and regulatory framework. As these activities are carried out by Jersey’s
international financial industry and add value to the cross-border transfer of assets and liabilities, it
is necessary to further examine the specifications of these activities. However, it should be stressed
Jersey’s IFC as a collective supports and facilitates the process of attracting, pooling and
redistributing FDI since these five services overlap and interact with each other.
Ad 1. Banking: £200 billion Jersey’s banking industry consists of deposits from expatriate “mass affluent” and internationally
footloose “high net worth individuals,” as well as from associated corporate and institutional clients.
10 The source for the figures used in section 1.5 is Capital Economics (2013) “Jersey’s Value to Britain”

A New Generation in Strategy Consulting 16
Supporting Jersey’s trusts, funds and services industries, the banking industry also explicitly
incorporates corporate banking. The deposits and funding are not lent to customers on Jersey but
are instead channelled upstream to their parent companies, mostly located in the City of London.
Nevertheless, Jersey’s banking industry is represented by a wide variety of banks, from branches and
subsidiaries of the major British clearers through retail and private banks to the treasury functions of
major international finance houses.
Ad 2. Trusts settled by private individuals: £400 billion Trusts are used by private individuals as well as corporates and institutions and their size and
importance for Jersey’s economy is fairly equal. This industry assists clients in the establishment and
operation of trusts and other asset-holding vehicles. This relates to creating legal instruments under
which one person (i.e. settlor) can transfer the legal ownership of all or part of their assets to a
second (i.e. trustee), while ensuring that the assets remain for their benefits or the benefit of some
other third party (i.e. beneficiary). It is important that any structure is properly established and
professional advice is sought in each jurisdiction which affects the settlor, the beneficiaries and the
trust fund. The following examples outline some of the practical ways in which trusts can be used:
Asset Management A settlor capable of handling his or her own investments may be concerned about the ability
of his or her heirs to do so after the settlor's death. A trust can be established and the settlor
can reserve investment powers during his or her lifetime. On the death of the settlor, either
a person nominated by the settlor or the trustees may assume responsibility for the
investment of the trust fund.
Forced Heirship Assets held in a trust can be distributed in any manner that the settlor desires. An individual
from a country with rigid legal or religious inheritance laws may wish to arrange for an
unequal distribution of assets among his or her heirs. By establishing a trust in a jurisdiction
outside that country, the desired distribution plan can often be formulated and
implemented.
Avoidance of Probate Formalities Assets owned by an individual usually pass on death in accordance with the terms of a will. If
the assets are held in a wide variety of countries it may be necessary to obtain a grant of
probate to the will in each country where assets are located. This can be particularly
troublesome, expensive and time-consuming. In addition, there may be estate duties and
taxes payable before the estate can be settled and the assets distributed to the heirs of the
deceased. However, if such assets are owned by a trust, they can be held for the benefit of
succeeding generations in accordance with the terms of the trust instrument. The death of
the individual should have no detrimental consequences for the continued operation of the
trust.
Privacy, Confidentiality and Anonymity Trusts are generally created by a private document to which the settlor and the trustees are
the only parties. The trust instrument does not have to be filed with any public body in
Jersey. Beneficiaries of a trust may be entitled to certain information regarding the trust.

A New Generation in Strategy Consulting 17
Prevention of Division of Assets An individual who has built up a sizeable private company may have some children who are
interested in the running of the business and some who are not. The individual may wish to
benefit the children equally but would not like any of them to be able to dispose of their
interest in the family company to non-family members. Such arrangements can be achieved
through the use of a trust. Family assets may also take the form of works of art or real estate
which, by their nature, cannot be divided but from which a number of individuals benefit.
Such property can be held in trust for the beneficiaries without disturbing the underlying
property.
Establishing trusts is typically associated with common law jurisdictions with strong historical ties to
the United Kingdom. Trusts can be created under common law as this is perceived as “obligation”
rather than “ownership,” which is a common distinction under civil law. These trusts attract capital
from private individuals and families residing in countries where civil law is applicable or where the
formation of trusts is not facilitated.
Another type of asset-holding vehicle is a foundation, which can be established under Jersey’s
Foundations Law (2009). As foundations are incorporated, they have a separate legal personality and
must be established with one or more lawful objects. Permissible objects might include, for example,
benefiting a particular person or class of persons or carrying out a specific purpose or holding a
particular asset. Objects can be charitable, non-charitable or a combination of both.
Ad 3. Trusts settled by companies and institutions: £450 billion Non-family trusts - such as trusts for corporate and institutional purposes - complement Jersey’s
private individuals’ trust industry. It is difficult to estimate the exact size of the non-family trusts as
Jersey’s trust management firms do not disclose this type of information. Indeed, considerable
overlap exists between Jersey’s trust management firms which carry out trust business for private
individuals and corporate and institutional clients.
Nevertheless, the attractiveness of Jersey for establishing trusts for corporate and institutional
purposes relates to unique Jersey laws. In addition to the competitive strengths of Jersey in terms of
its regulated trust industry, reputation and financial services profile, Jersey trusts offer unlimited
duration and the ability to establish “non-charitable purpose trusts.” This type of trust was
established as the first type of trust with an indefinite duration and was developed as a holding
vehicle with the objective to hold shares of companies. (It should be noted that more and more IFCs
are proclaiming trust structures with an indefinite duration.)
Ad 4. Investment funds: £200 billion Jersey’s IFC administers and, to a lesser extent, manages investment funds. As an IFC, Jersey’s tax
neutrality enables the formation of investment vehicles, which has resulted in a wide array of fund
structures. This includes everything from highly-regulated funds for the general public to un-
marketed expert funds. In terms of FDI, funds are leveraged in order to pool contributions from
investors in multiple countries without the risk of double taxation. These contributions are in turn
invested in assets around the world, whose accumulated returns are transferred back to the
investors through Jersey.

A New Generation in Strategy Consulting 18
Ad 5. Capital markets: £270 billion In relation to its stable investment climate, rule of law and well-developed legal land regulatory
systems, corporate entities seeking to list in order to raise capital chose to do this via Jersey. Jersey
is used to list on London’s stock exchange, the FTSE 100. In fact, Jersey has the greatest number of
companies registered outside the UK listed on the AIM. Over a hundred companies registered in
Jersey are listed on worldwide stock exchanges. Together with Guernsey, Jersey features a security
exchange, the Channel Islands Securities Exchange (CISE), which was established in 1998. In 2009,
legislation was passed allowing Jersey-based companies to be listed on Hong Kong’s Stock Exchange,
significantly widening the geographical scope of Jersey’s market capitalisation opportunities.
Ad 6. Greenfield FDI: £8.35 billion Through the delivery of bespoke products, services and investment vehicles, these finance activities
in Jersey are carried out by highly experienced professionals within the largest workforce of any
small island IFC. Jersey has developed a critical-mass cluster of advanced financial services, including
leading lawyers, accountants, bankers and other professionals, supporting and enabling complex
cross-border FDI transactions and adding considerable value to international capital markets and
flows.
Despite the relatively low absorptive of Jersey given its limited size, this cluster of advanced financial
services is demonstrated by the physical presence of numerous international banks, lawyers,
accountants by means of the establishment of actual operating facilities on Jersey: Greenfield FDI.
On the other hand, Jersey’s IFC and its favourable regulatory and fiscal climate also provide the
opportunity to fund Greenfield FDI elsewhere.
Apart from and in addition to the various activities that are carried out by Jersey’s IFC, it is necessary
to understand the global context of flows of FDI to have a more comprehensive picture of the role
Jersey takes in intermediating flows of FDI.
1.6 FDI Trends Understanding worldwide and regional FDI trends can shine light on which global networks of FDI
Jersey operates within. Therefore, the next section examines trends in flows of FDI.
1.6.1 Global Trends
UNCTAD’s 2014 edition of their World Investment Report states that “cautious optimism returns to
global FDI.” In contrast, the financial globalisation has stalled and a deeper analysis finds that the
financial crisis continues to have lingering and profound effects.11 Undeniably, the worst has passed
and there are signs of recovery and marginal growth. The strong correlation between GDP growth
and FDI suggests a positive upward trend. Yet, this growth is unevenly distributed among developing
and developed economies, as indicated in Figure 6.
Figure 6 also shows that each region positively contributes to global real GDP growth in 2015.
Western Europe is expected to pick up again, albeit, at a much lower rate compared to other
regions. GDP growth rate is increasing to 4% in the Middle East and North Africa, while Asia Pacific
remains the leading region with growth rates in excess of 6%.
11 McKinsey Global Institute (2013) “Financial globalization: Retreat or Reset? Global Capital Markets 2013.

A New Generation in Strategy Consulting 19
Figure 6 Outlook for Real GDP Growth Rates, World and Select Regions (2013 – 2015F)
Source: Capgemini Financial Services Analysis (2014), Economist Intelligence Unit (2014), Concensus Forecasts (2014)
In 2013 and 2014, investors from developing and transition economies continued their expansion
abroad, due to opportunities for faster economic growth and investment liberalisation – as well as
rising income streams from the high level of commodity prices. Last year these investors accounted
for 39% of world outflows, compared to only 12% fifteen years ago. In contrast, corporate investors
from the developed economies continued their wait and see approach with investments remaining
at a similar low level of 2012. Using a linear forecast model suggests a break-even point in 2018.
Figure 7 Forecasted Share of FDI outflows by group of countries
Source: UNCTAD (2014) modified by Investment Consulting Associates – ICA (2014)
0
1
2
3
4
5
6
7
World Asia Pacific (excl.Japan)
Sub-SaharanAfrica
Latin America Middle East andNorth Africa
North America Eastern Europe Western Europe
Rat
e o
f gr
ow
th
2013 2014 2015
1,1PP

A New Generation in Strategy Consulting 20
Figure 8 History of global inward and outward FDI, 1970-2013
Source: UNCTAD (2014) modified by Investment Consulting Associates – ICA (2014)
Based on the GDP growth rates and validated by the FDI outflows by group of countries there is one
irreversible trend showing a continuous decline of FDI outflows from developed countries. Taking
into account its share implies that developed economies contributed $861 billion (£548 billion) while
developing economies generated the remaining part of $550 billion (£350 billion).
In absolute terms, the total global FDI flows by corporate investors increased from $1.33 trillion
(£0.85 trillion) in 2012 to $1.41 trillion (£0.9 trillion) in 2013. Three major events over the past four
decades have caused a shock effect on total global FDI flows. The first event – the so-called dot-com
bubble - took place late 1990’s and escalated in 2000. This period was marked by the founding and
(in many cases) spectacular failure of a group of new Internet-based companies. In addition, this
period also suffered from one of the largest accounting scandals of all times, leading to the
bankruptcy of Enron and its accountant Arthur Andersen in October of 2001.
After the devastating effects of 9/11, a period of spectacular growth commenced that ended
abruptly in the summer of 2007. During this time, the total volume of annual outward FDI flows
recorded a $2.27 trillion (£1.45 trillion) peak. The bursting housing market in the United States with
banks going bankrupt initiated the worst financial crisis since the Great Depression. A steep decline
well into 2009 was followed by a resilient recovery in 2011, however this was followed by a “double
dip” which made everyone once more aware of fragile economic conditions.
Table 1 shows the absolute volume of outward FDI flows by region and major economies as well as
the growth rate for 2013. Investments from the largest investor, the United States, dropped almost
8% to $338 billion (£215 billion) in 2013, despite the growing level of reinvested earnings abroad12.
FDI outflows from the EU rose by 6% to $252 billion (£160 billion); those from Europe as a whole
increased by 10% to $330 billion (£210 billion), with a strong performance of countries such as
Poland and the Czech Republic. However, Europe came from levels above $650 billion (£400 billion)
only three years ago.
12 UNCTAD Global Investment Trend Monitor No. 16, 28 April 2014
-500000
0
500000
1000000
1500000
2000000
2500000
19
70
19
71
19
72
19
73
19
74
19
75
19
76
19
77
19
78
19
79
19
80
19
81
19
82
19
83
19
84
19
85
19
86
19
87
19
88
19
89
19
90
19
91
19
92
19
93
19
94
19
95
19
96
19
97
19
98
19
99
20
00
20
01
20
02
20
03
20
04
20
05
20
06
20
07
20
08
20
09
20
10
20
11
20
12
20
13
US$
mill
ion
World inward
World outward
Poly. (World outward)
Dot-com bubble
Financial crisis
Double dip
Recovery?
Post 9/11Recovery

A New Generation in Strategy Consulting 21
Table 1 Regional breakdown of FDI outflows 2011 – 2013 (US$ billion)
Region / Economy 2011 2012 2013 Growth rate 2012 - 2013 in %
World 1,709 1,349 1,410 5.1
Developed economies 1,215 853 858 0.6
Europe 653 300 330 10.3
European Union 585 238 252 5.9
United States 387 367 338 -7.8
Japan 108 123 135 10.3
Developing economies 420 443 460 4.0
Africa 5 13 21 57.1
North Africa 2 3 6 76.5
Other Africa 4 10 15 50.7
Latin America and the Caribbean 110 124 112 -9.7
South America 28 22 18 -18.9
Central America 13 23 11 -52.9
Caribbean 69 79 83 5.3
Developing Asia13 304 305 327 7.4
West Asia 22 19 32 64.6
East Asia (Incl. China) 213 222 238 6.9
South Asia (Incl. India) 13 9 2 -73.8
South-East Asia 56 54 55 2.1
Transition economies 74 54 100 85.2
Source: UNCTAD (2014)
Noteworthy is Japan’s accumulative growth rate of 25%, with FDI outflows increasing from $108
billion (£68.8 billion) in 2011 to $135 billion (£86.0 billion) in 2013. In this period the Japanese
economic policy adopted became known as “Abenomics.” Abenomics refers to the economic policies
advocated by Shinzō Abe, Japan’s Prime Minister, and is based upon "three arrows" of fiscal
stimulus, monetary easing and structural reforms14. The Economist characterised the program as a
"mix of reflation, government spending and a growth strategy designed to jolt the economy out of
suspended animation that has gripped it for more than two decades.” His policy stimulates domestic
economic growth and - as a result - encourages outward FDI flows too.
Investments from Africa increased by 57% in 2013, mainly as a result of significant investment flows
from South Africa and Nigeria. South African investors invested in telecommunications, mining and
retail while those from Nigeria focused largely on financial services. Intra-African investments also
rose significantly during the year. With $21 billion (£13.4 billion) in 2013, Africa’s total FDI outflow
volume is still relatively small (i.e. 1.5% of total global outward FDI flows).
MNCs from Latin America and the Caribbean decreased their investments abroad in 2013 by 10% to
$112 billion (£71.3 billion), mainly on account of a 36% drop in investments from Central and South
America. The fall of investment from this sub-region was largely attributable to a decline in cross-
border M&As and a strong increase in loan repayments to parent companies by Brazilian and Chilean 13 Developing Asia refers to the 45 members of the Asian Development Bank 14 "Definition of Abenomics". Financial Times Lexicon. Retrieved 28 January 2014

A New Generation in Strategy Consulting 22
foreign affiliates abroad. Colombian MNCs, in contrast, bucked the region's declining trend and more
than doubled their cross-border M&As in industries such as energy, food, banks and cement.
Investments from MNCs registered in Caribbean countries ─ mainly in two IFCs, the British Virgin
Islands and Cayman Islands ─ increased by 5% in 2013, constituting about three-quarters of the
region's total investments abroad. This shows that even in a downward trend, regional IFCs
performed strongly.
In 2013 investments by MNCs based in transition economies increased by 85%, reaching $100 billion
(£63.7 billion). Most FDI projects, as in the past years, were carried out by Russian MNCs followed by
those from Kazakhstan and Azerbaijan, two CIS countries. The value of cross-border M&A purchases
by MNCs from the region rose more than seven times, mainly as a result of the acquisition of TNK-BP
Ltd (British Virgin Island) by Rosneft, even though the number of cross-border M&A deals dropped in
2013 compared to 2012. Announced greenfield investments also rose, by 87%, to $19 billion (£12.1
billion). This level of FDI is expected to fall considerably in 2014 as a result of the economic sanctions
that were imposed by the United States and the European Union in response to the tensions in the
Ukraine and Crimea earlier that year.
Figure 9 UNCTAD’s Top 20 FDI Source Economies 2013 and rank 2012 (US$ billion)
Source: UNCTAD (2014) modified by Investment Consulting Associates – ICA (2014)
14
18
19
22
24
26
27
31
32
33
37
43
58
60
69
92
95
101
135
338
0 50 100 150 200 250 300 350 400
Taiwan (22)
Norway (16)
United Kingdom (11)
Luxembourg (35)
Ireland (17)
Spain (168)
Singapore (20)
Republic of Korea (12)
Italy (26)
Sweden (13)
Netherlands (69)
Canada (7)
Germany (5)
Switzerland (9)
British Virgin Islands (6)
Hong Kong (3)
Russian Federation (8)
China (4)
Japan (2)
United States (1)
Developed
Developing

A New Generation in Strategy Consulting 23
After the United States and Japan - and up one position compared to 2012 - is China. Investments
from Chinese (as part of East Asia) corporate investors climbed by 15% to an estimated $101 billion
(£64.3 billion) due to a surge of cross-border M&As. High-profile examples include the $19 billion
(£12.1 billion) CNOOC-Nexen deal in Canada and the $5 billion (£3.2 billion) Shuanghui Smithfield
Foods deal in the United States, so far the largest overseas deals made by Chinese firms in oil and
gas and food industries respectively.
With $60 billion (£38.2 billion), Switzerland is the largest outward investor in Europe, propelled by a
doubling of reinvested earnings abroad. Countries that recorded a large decline in 2012 (including
Italy, the Netherlands and Spain) saw their outflows rebound sharply. In contrast, investments by
MNCs from France, Germany and the United Kingdom saw a substantial decline, falling by $40 billion
(£25.5 billion) to -$2.6 billion (-£1.7 billion), by $22 billion (£14.0 billion) to $58 billion (£36.9 billion),
and by $16 billion (£10.1 billion) to $19 billion (£12.1 billion), respectively. MNCs from France and
the United Kingdom undertook significant equity divestment abroad.
Figure 10 UNCTAD’s Top 20 FDI Host Economies 2013 and rank 2012 (US$ billion)
Source: UNCTAD (2014) modified by Investment Consulting Associates – ICA (2014)
17
17
18
20
24
27
28
30
36
37
38
39
50
62
64
64
77
79
124
188
0 20 40 60 80 100 120 140 160 180 200
Colombia (16)
Italy (20)
Indonesia (14)
Chile (11)
Netherlands (19)
Germany (17)
India (13)
Luxembourg (19)
Ireland (10)
United Kingdom (8)
Mexico (15)
Spain (12)
Australia (6)
Canada (9)
Brazil (4)
Singapore (5)
Hong Kong (3)
Russian Federation (7)
China (2)
United States (1)
Developed
Developing

A New Generation in Strategy Consulting 24
In terms of the destination of global FDI, the United States remains the largest receiver of FDI,
attracting over $188 billion (£123 billion) of FDI, a 17% increase compared to 2012. The United
States is followed by China, which hosted $124 billion (£81 billion) of FDI in 2013. Noteworthy is the
case of Russia. In terms of ranks, it jumped from the seventh rank in 2012 to the third in 2013 with a
total FDI inflow of $79 billion (£52 billion), surpassing Hong Kong, Singapore, Brazil, Australia and
Canada. Again, as stressed earlier, this level of FDI is expected to fall over the coming years as a
result of the international sanctions. Indeed, over 2014, FDI flows to Transition Economies (including
Russia) halved to $45 billion15 (£29.5 billion). FDI flows to Russia are estimated to have decreased by
70%, representing a total value of $19 billion (£12.5 billion).
Hong Kong and Singapore, both successful in attracting regional headquarters of MNCs (aggregated
nearly 1,400 in Hong Kong in 2013), saw its inflows rising to $77 billion (£51 billion) and $64 billion
(£42 billion). India experienced an increase of 17% in its FDI inflows, attracting $28 billion (£18
billion) in 2013. Latin American countries such as Brazil and Chile saw declines of their FDI inflows
with two percent and 29%, respectively, despite a strong performance of Brazil in attracting FDI into
its primary sector. On the opposite, FDI flows to Colombia increased by eight percent to $17 billion
(£11 billion), largely due to cross-border M&As in the electricity and banking industries.
The picture in Europe is twofold. FDI Inflows to Germany – which had recorded an exceptionally low
volume in 2012 – rebounded sharply to $27 billion (£18 billion), as did inflows to Italy and Spain,
with the latter becoming the largest European recipient in 2013 with $39 billion (£26 billion). On the
other hand, France and the United Kingdom experienced a steep decline in their FDI inflows. Often,
large swings in intra-company loans were a significant contributing factor.
A breakdown for each of the three FDI components (i.e. equity, reinvested earnings and other
capital) shows a high volatility. Prior to the financial crisis, equity outflows dominated and
contributed half to global FDI flows. About one-third of global FDI flows contained reinvested
earnings, while the remaining part consists of other capital flows.
Table 2 Breakdown of FDI components for developed countries
Developed country MNCs 2007 2008 2009 2010 2011 2012 2013 Pre-Post crisis change
Equity outflows 52% 48% 49% 46% 44% 38% 23% -56%
Reinvested earnings 35% 22% 46% 53% 46% 62% 67% 91%
Other capital (intra-company loans)
13% 30% 5% 1% 10% 1% 10% -23%
Source: UNCTAD (2014) modified by Investment Consulting Associates – ICA (2014)
A remarkable reconfiguration took place since 2007, both in developed and in developing countries.
Internationally operating companies reinvested their earnings on a much bigger scale, at the
expense of intra-company loans and to a lesser extent equity outflows. As the stock of FDI in the
global economy becomes more mature, new investment is more likely to be sequential. In other
words, additional investment will be made to existing investments and possibly influenced by
strategic considerations, such as trying to pre-empt or imitate industry leaders. In addition to these
15 UNCTAD (2015) “Global Investment Trends in 2014 and Prospects for 2015”

A New Generation in Strategy Consulting 25
types of investment, incremental FDI is also more likely to take place as a result of the reinvested
earnings of the foreign affiliates of existing MNCs.
Table 3 Breakdown of FDI for developing countries
Developing country MNCs 2007 2008 2009 2010 2011 2012 2013 Pre-Post crisis change
Equity outflows 47% 40% 53% 53% 45% 31% 44% -6%
Reinvested earnings 32% 37% 57% 40% 45% 46% 55% 72%
Other capital (intra-company loans)
21% 23% -10% 7% 10% 23% 1% -95%
Source: UNCTAD (2014) modified by Investment Consulting Associates – ICA (2014)
Little has been written in international business literature regarding the empirical importance of
reinvested earnings, or what factors govern the decision of whether income earned at a foreign
location is repatriated to the parent in the home country, or whether it is reinvested at the foreign
location. However, six major factors seems to influence this decision: macroeconomic factors
affecting investment opportunities in the host country; the profitability of foreign investment;
exchange rates; different systems of corporate governance; the tax treatment of repatriated foreign
income (intra-firm dividends); and the use of dividend policy as a means of managerial control. Tax-
neutral IFCs play an important role in this decision-making process.
Exhibit 1 Global outward FDI flows by region, 2013
NB Size of the bubble represents the size of outward FDI flows in billion US$
NB Width of lines shows total value of cross-border investments between regions (as % percentage of Global GDP)16
Source: McKinsey (2014) and UNCTAD WIR (2014) modified by Investment Consulting Associates – ICA (2014)
Their role is reconfirmed when considering their global position in cross-border investment flows as
presented in Exhibit 1. The size of the bubbles in the different countries represent the size of the
outward FDI flows in 2013 (all in billions US$). As a proxy for inter-regional outward FDI flows at this
16 According to McKinsey Study (2014). Global GDP in 2014 is estimated at $77.6 trillion

A New Generation in Strategy Consulting 26
aggregated level, statistics from McKinsey’s Financial Globalization study have been to assess the
role of IFCs.
The width of the lines show the total cross border investments between regions as a percentage of
the world’s global GDP. Between the United States and Europe the line indicates a volume of 10% or
more, suggesting at least $7.7 trillion (£4.9 trillion) in short- and long-term investment in both
directions. Assuming that the same percentages apply for outward FDI flows (as part of the total
cross border investments), implies that IFCs facilitate $80 – $100billion (£51.3 – £64.1 billion) in
outward FDI annually. In other words, the importance of IFCs in terms of facilitating outward FDI
flows is on par with Russia and twice the amount of Africa and GCC countries combined.
1.6.2 Investments by High Net Worth Individuals
As with corporate investors, private investors are on the look-out for new investment opportunities.
It is interesting to analyse if and to what extent there is a similar pattern between both types of
investors noticeable. A first conclusion is that the number of HNWIs increased significantly in 2013.
With a growth rate of nearly 15%, this is the second largest annual increase since 2000.
Table 4 Number of HNWIs (in millions)
Region 2008 2009 2010 2011 2012 2013 % change 2012 - 2013
Africa 0.1 0.1 0.1 0.1 0.1 0.1 3.7%
Latin America 0.4 0.5 0.5 0.5 0.5 0.5 3.5%
Middle East 0.4 0.4 0.4 0.5 0.5 0.6 16.0%
Europe 2.6 3.0 3.1 3.2 3.4 3.8 12.5%
Asia Pacific 2.4 3.0 3.3 3.4 3.7 4.3 17.3%
North America 2.7 3.1 3.4 3.4 3.7 4.3 15.9%
World 8.6 10.1 10.8 11.1 11.9 13.7 14.7%
Source: World Wealth Report (2014)
In parallel with global FDI outflows by corporate investors, the highest growth in HNWI population
(17.3%) was recorded in Asia Pacific with which it closed the gap with North America. In both regions
there are 4.3 million millionaires. A second similarity is the strong position of Japan. The country
records more than 2.3 million HNWIs and welcomed 425,000 new HNWI in 2013 alone. China, with
strong annualised HNWI population growth of 15.8% between 2008 and 2013, helped fuel Asia-
Pacific’s increase. India remains far behind with a marginal increase of 2,000 HNWIs in 2013.
Within Europe, it is Germany and the UK with double digit growth rates that drive the continent’s
overall growth in the HNWI population to 3.83 million. Other strong European performers are
Switzerland, France, Italy, and the Netherlands. Table 5 shows the trend in HNWI population for the
remaining top 25 countries.
The overall population of HNWIs can be considered a proxy for the absolute wealth residing in that
country, but a breakdown by wealth is a more accurate way of benchmarking countries as a source
of FDI by private individuals.

A New Generation in Strategy Consulting 27
Table 5 Top 25 HNWI Population Ranking 2013 (in thousands)
Country 2013 2012 Delta
World 13,700 11,940 1,706
U.S. 4,006 3,436 570
Japan 2,327 1,902 425
Germany 1,130 1,015 115
China 758 643 115
United Kingdom 527 465 62
France 472 430 42
Switzerland 330 282 48
Canada 320 298 22
Australia 219 207 12
Italy 203 175 28
South Korea 175 160 15
Netherlands 173 149 24
Brazil 172 165 7
Spain 161 145 16
Russia 160 154 6
India 155 153 2
Saudi Arabia 151 129 22
Mexico 130 131 -1
Kuwait 125 103 22
Hong Kong 124 114 10
Norway 120 108 12
Taiwan 112 95 17
Argentina 109 102 7
Austria 108 99 9
Singapore 105 101 4
Source: World Wealth Report (2014)
In terms of total investable wealth, 2013 was a record year with HNWI wealth reaching $52.6 trillion
(£33.5 trillion), an increase of almost 14% compared to 2012. Strong performing regions are the
Middle East, North America and Asia Pacific, while Europe is on par with the world’s average growth
rate. Two regions lagging behind are Latin America and Africa.
Table 6 Wealth distribution by region 2008 - 2013
Region 2008 2009 2010 2011 2012 2013 % change 12 – 13
Africa 0.8 1.0 1.2 1.1 1.3 1.3 7.3%
Middle East 1.4 1.5 1.7 1.7 1.8 2.1 16.7%
Latin America 5.8 6.7 7.3 7.1 7.5 7.7 2.1%
Europe 8.3 9.5 10.2 10.1 10.9 12.4 13.7%
Asia Pacific 7.4 9.7 10.8 10.7 12.0 14.2 18.2%
North America 9.1 10.7 11.6 11.4 12.7 14.9 17.1%
World 32.8 39.1 42.8 42.1 46.2 52.6 13.9%
Source: World Wealth Report (2014) modified by Investment Consulting Associates – ICA (2014)

A New Generation in Strategy Consulting 28
When the country’s HNWI population growth is plotted against its total growth in wealth, it allows to
assess and evaluate the top- and under-performers. Clearly, with Hong Kong, China, Taiwan, India,
Singapore, South Korea and Japan all situated in the upper right quadrant it is not surprising that
Asia Pacific will take the lead in the next decade. A mixture of European and South American
countries are bundled in the lower left quadrant indicating a below average growth in both size and
wealth volume.
Figure 11 Plot of HNWI population growth against total growth in wealth
Source: World Wealth Report (2014)
The wealth is unevenly distributed among the three categories of HNWIs. The most wealthy HNWIs,
so-called ultra-HNWIs are clearly outnumbered by the other two categories (i.e. only 0.9% of total),
yet this group accounts for 34.6% of the total global wealth. The annual population growth among
all three types of HNWIs is evenly distributed and ranging between 14.6 and 15.6%. The wealth
growth is mostly attributable to the second group of HNWIs with a compound annual growth rate of
10.2% and a growth rate last year of 15.2%.
Table 7 Breakdown of HNWIs segments by population and wealth
Population Wealth
Category Number of individuals
(2013)
Number of individuals
(2012)
CAGR (08-13)
Growth (12 - 13)
CAGR (08-13)
Growth (12 - 13)
% of HNWI Wealth
>30 mln US$ 128K 111K 10.50% 15.60% 9.90% 12.00% 34.60%
5 - 30 mln US$ 1,230K 1,069K 10.10% 15.20% 10.20% 15.20% 22.30%
1 - 5 mln US$ 12,371K 10,795K 9.80% 14.60% 9.90% 14.70% 43.10%
Source: World Wealth Report (2014)
Finally, assessing how this wealth is composed provides further insights in the needs of HNWIs. An
asset breakdown in 2014 reflects the decreased attention toward wealth preservation (in the form
of cash), yet with 26.6% still representing the largest share of HNWI holdings. Combined allocations
to cash and equities declined by 2.8 percentage points to 51.4% from 54.3% in 2013. At the same
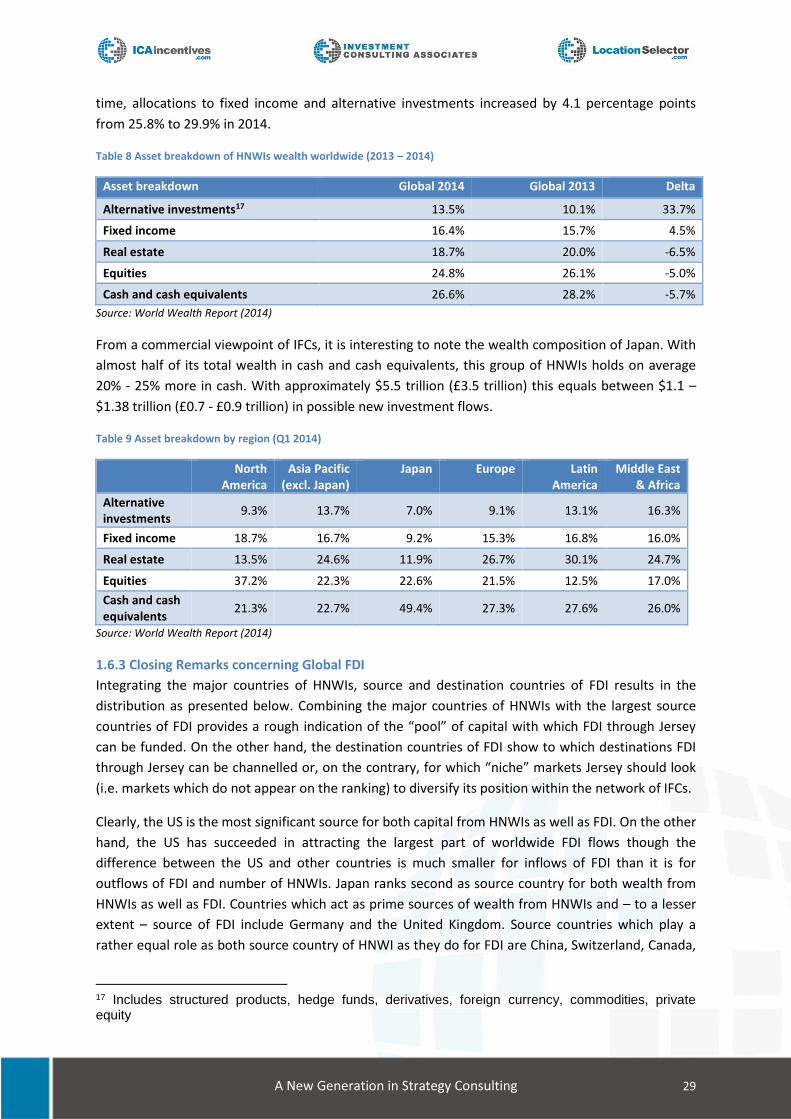
A New Generation in Strategy Consulting 29
time, allocations to fixed income and alternative investments increased by 4.1 percentage points
from 25.8% to 29.9% in 2014.
Table 8 Asset breakdown of HNWIs wealth worldwide (2013 – 2014)
Asset breakdown Global 2014 Global 2013 Delta
Alternative investments17 13.5% 10.1% 33.7%
Fixed income 16.4% 15.7% 4.5%
Real estate 18.7% 20.0% -6.5%
Equities 24.8% 26.1% -5.0%
Cash and cash equivalents 26.6% 28.2% -5.7%
Source: World Wealth Report (2014)
From a commercial viewpoint of IFCs, it is interesting to note the wealth composition of Japan. With
almost half of its total wealth in cash and cash equivalents, this group of HNWIs holds on average
20% - 25% more in cash. With approximately $5.5 trillion (£3.5 trillion) this equals between $1.1 –
$1.38 trillion (£0.7 - £0.9 trillion) in possible new investment flows.
Table 9 Asset breakdown by region (Q1 2014)
North America
Asia Pacific (excl. Japan)
Japan Europe Latin America
Middle East & Africa
Alternative investments
9.3% 13.7% 7.0% 9.1% 13.1% 16.3%
Fixed income 18.7% 16.7% 9.2% 15.3% 16.8% 16.0%
Real estate 13.5% 24.6% 11.9% 26.7% 30.1% 24.7%
Equities 37.2% 22.3% 22.6% 21.5% 12.5% 17.0%
Cash and cash equivalents
21.3% 22.7% 49.4% 27.3% 27.6% 26.0%
Source: World Wealth Report (2014)
1.6.3 Closing Remarks concerning Global FDI
Integrating the major countries of HNWIs, source and destination countries of FDI results in the
distribution as presented below. Combining the major countries of HNWIs with the largest source
countries of FDI provides a rough indication of the “pool” of capital with which FDI through Jersey
can be funded. On the other hand, the destination countries of FDI show to which destinations FDI
through Jersey can be channelled or, on the contrary, for which “niche” markets Jersey should look
(i.e. markets which do not appear on the ranking) to diversify its position within the network of IFCs.
Clearly, the US is the most significant source for both capital from HNWIs as well as FDI. On the other
hand, the US has succeeded in attracting the largest part of worldwide FDI flows though the
difference between the US and other countries is much smaller for inflows of FDI than it is for
outflows of FDI and number of HNWIs. Japan ranks second as source country for both wealth from
HNWIs as well as FDI. Countries which act as prime sources of wealth from HNWIs and – to a lesser
extent – source of FDI include Germany and the United Kingdom. Source countries which play a
rather equal role as both source country of HNWI as they do for FDI are China, Switzerland, Canada,
17 Includes structured products, hedge funds, derivatives, foreign currency, commodities, private equity

A New Generation in Strategy Consulting 30
Netherlands, Italy and Republic of Korea. Russia and Hong Kong do rank high as source country for
FDI but do rank relatively low as source country for HNWI wealth.
France, Australia, Brazil, India, Saudi Arabia, Mexico and Kuwait appear in the top 20 of source
countries for HNWIs but do not appear in the top-20 of main FDI source countries. The British Virgin
Islands, Sweden, Singapore, Ireland, Luxembourg, Norway and Taiwan feature in the top-20 as prime
source for FDI but do not appear in the top 20 of countries with the largest number of HNWI
population.
Table 10 Top 20 Source economies for HNWIs and FDI and destination economies for FDI, 2013
Rank Major Countries of HNWIs Source Countries of FDI Destination Countries of FDI
HNWIs Population (thousands) Outflows of FDI (US$ billion) Inflows of FDI (US$ billion)
1. United States 4,006 United States 338 United States 188
2. Japan 2,327 Japan 135 China 124
3. Germany 1,130 China 101 Russia 79
4. China 758 Russia 95 Hong Kong 77
5. United Kingdom 527 Hong Kong 92 Singapore 64
6. France 472 British Virgin Islands 69 Brazil 64
7. Switzerland 330 Switzerland 60 Canada 62
8. Canada 320 Germany 58 Australia 50
9. Australia 219 Canada 43 Spain 39
10. Italy 203 Netherlands 37 Mexico 38
11. Republic of Korea 175 Sweden 33 United Kingdom 37
12. Netherlands 173 Italy 32 Ireland 36
13. Brazil 172 Republic of Korea 31 Luxembourg 30
14. Spain 161 Singapore 27 India 28
15. Russia 160 Spain 26 Germany 27
16. India 155 Ireland 24 Netherlands 24
17. Saudi Arabia 151 Luxembourg 22 Chile 20
18. Mexico 130 United Kingdom 19 Indonesia 18
19. Kuwait 125 Norway 18 Italy 17
20. Hong Kong 124 Taiwan 14 Colombia 17
Source: World Wealth Report (2014) and UNCTAD (2014) modified by Investment Consulting Associates – ICA (2014)
A level of uncertainty persists due to questions over the sustainability of Japan’s growth and its debt
load as drivers under the current economic policy, election-year instability in many markets, rising
East-West tensions over Crimea and Ukraine, and the potential risk of deflation in Europe could
undermine the slow recovery. The Ebola outbreak, unrest in parts of the Middle East as a result of
Islamic State, and the most recent price fall of oil may further inflate economic vulnerability.
The signs of improvement, however, are still marked by diminishing austerity and strong private-
sector performance. With major economies (i.e. United States, United Kingdom, Germany, China and
Japan) driving global growth, fuelled by rising consumer and producer confidence indices, cautious
optimism is the right reflection of the current status quo, though short-term risks and incidents must
be managed carefully.