Embed Size (px)
Citation preview
Please cite this paper as:
Cilasun, S. et al. (2019), “Upgrading business investment inTurkey”, OECD Economics Department Working Papers,No. 1532, OECD Publishing, Paris.http://dx.doi.org/10.1787/537fc88b-en
OECD Economics Department WorkingPapers No. 1532
Upgrading businessinvestment in Turkey
Seyit Mümin Cilasun, Rauf Gönenç,Mustafa Utku Özmen, MehmedZahid Samancıoǧlu, Fatih Yilmaz,Volker Ziemann
JEL Classification: D25, E2, F21, O16

Organisation for Economic Co-operation and Development
ECO/WKP(2019)1
Unclassified English - Or. English
18 January 2019
ECONOMICS DEPARTMENT
UPGRADING BUSINESS INVESTMENT IN TURKEY
ECONOMICS DEPARTMENT WORKING PAPERS No. 1532
By Seyit Mümin Cilasun, Rauf Gönenç, Mustafa Utku Özmen,
Mehmed Zahid Samancıoǧlu, Fatih Yilmaz and Volker Ziemann
OECD Working Papers should not be reported as representing the official views of the OECD
or of its member countries. The opinions expressed and arguments employed are those of the
author(s).
Authorised for publication by Isabell Koske, Deputy Director, Country Studies Branch,
Economics Department.
All Economics Department Working Papers are available at www.oecd.org/eco/workingpapers.
JT03441945
This document, as well as any data and map included herein, are without prejudice to the status of or sovereignty over any territory, to the
delimitation of international frontiers and boundaries and to the name of any territory, city or area.

2 │ ECO/WKP(2019)1
UPGRADING BUSINESS INVESTMENT IN TURKEY Unclassified
OECD Working Papers should not be reported as representing the official views of the OECD or of its member countries. The opinions expressed and arguments employed are those of the author(s).
Working Papers describe preliminary results or research in progress by the author(s) and are published to stimulate discussion on a broad range of issues on which the OECD works.
Comments on Working Papers are welcomed, and may be sent to OECD Economics Department, 2 rue André-Pascal, 75775 Paris Cedex 16, France, or by e-mail to [email protected].
All Economics Department Working Papers are available at www.oecd.org/eco/workingpapers.
On 3 May 2018, the OECD Council invited Lithuania to become a Member. At the time of preparation the deposit of Lithuania’s instrument of accession to the OECD Convention was pending and therefore Lithuania does not appear in the list of OECD Members and is not included in the OECD zone aggregates.
On 25 May 2018, the OECD Council invited Colombia to become a Member. At the time of preparation the deposit of Colombia’s instrument of accession to the OECD Convention was pending and therefore Colombia does not appear in the list of OECD Members and is not included in the OECD zone aggregates.
This document and any map included herein are without prejudice to the status of or sovereignty over any territory, to the delimitation of international frontiers and boundaries and to the name of any territory, city or area.
The statistical data for Israel are supplied by and under the responsibility of the relevant Israeli authorities. The use of such data by the OECD is without prejudice to the status of the Golan Heights, East Jerusalem and Israeli settlements in the West Bank under the terms of international law. © OECD (2019) _________________________________________________________________________________________ You can copy, download or print OECD content for your own use, and you can include excerpts from OECD publications, databases and multimedia products in your own documents, presentations, blogs, websites and teaching materials, provided that suitable acknowledgment of OECD as source and copyright owner is given. All requests for commercial use and translation rights should be submitted to [email protected] ________________________________________________________________________________________

ECO/WKP(2019)1 │ 3
UPGRADING BUSINESS INVESTMENT IN TURKEY Unclassified
ABSTRACT/RÉSUMÉ
Upgrading business investment in Turkey
Starting from a low level in early 2000s, Turkey’s total capital stock has since expanded rapidly, but
the composition and quality of investment raises questions. This study focuses on business investment, as
the main driver of physical and knowledge-based capital formation and, hence, of potential output and the
material foundations of well-being. Micro data allow to distinguish four types of firms: small businesses
with a high rate of informality, medium-sized family firms, large formal corporations, and skilled start-
ups. The relative importance of the challenges facing these different types of firms varies, notably with
respect to skill shortcomings, regulatory burdens, labour costs, access to bank lending, over-leveraging and
scarce equity capital. Improving the current business environment and overcoming the fragmentation of
the business sector will be crucial to upgrade the quality of business investment and to enhance the
allocative efficiency of capital formation. This calls for promoting formality, best management practices,
the build-up of equity capital, access to long-term bank financing and other market-based financing that
can complement traditional bank lending; and a faster and more inclusive transition to the digital economy.
This working paper relates to the 2018 OECD Economic Survey of Turkey
(http://www.oecd.org/eco/surveys/economic-survey-turkey.htm).
JEL Classification: D25, E2, F21, O16
Keywords: business investment, R&D, FDI, firm-level data, Turkey
*************
Améliorer l’investissement des entreprises en Turquie
Le stock total de capital de la Turquie a commencé à augmenter rapidement depuis le début des années
2000, mais la composition et la qualité des investissements soulèvent des questions. Cette étude porte sur
l'investissement des entreprises, principal moteur de la formation de capital physique et du savoir, et donc
de la production potentielle et des fondements matériels du bien-être. Les microdonnées permettent de
distinguer quatre types d’entreprises: les petites entreprises aux taux élevés d’informalité, les entreprises
familiales de taille moyenne, les grandes entreprises formelles et les nouvelles entreprises naissantes.
L'importance relative des défis auxquels sont confrontés ces différents types d'entreprises varie, notamment
en ce qui concerne les carences en compétences, les charges réglementaires, les coûts de main-d'œuvre,
l'accès au crédit bancaire, le surendettement et les fonds propres rares. L'amélioration de l'environnement
économique actuel et la réduction de la fragmentation du secteur des entreprises seront essentielles pour
améliorer la qualité des investissements des entreprises et renforcer l'efficacité de la répartition du capital
pour la formation de capital. Cela nécessite de promouvoir la formalité, de meilleures pratiques de gestion,
la constitution de fonds propres, l’accès à un financement bancaire de long terme et à tout autre financement
basé sur le marché pouvant compléter les prêts bancaires classiques; et une transition plus rapide et plus
inclusive vers l'économie numérique.
Ce document de travail se rapporte à l’Étude économique de l’OCDE de la Turquie 2018
(http://www.oecd.org/fr/eco/etudes/etude-economique-turquie.htm).
Classification JEL: D25, E2, F21, O16
Mots clefs: investissement des entreprises, R&D, IDE, données d'entreprise, Turquie

4 │ ECO/WKP(2019)1
UPGRADING BUSINESS INVESTMENT IN TURKEY Unclassified
Table of contents
Upgrading business investment in Turkey .......................................................................................... 6
Turkey's capital stock is low but rising ................................................................................................ 7 R&D expenditures have increased but call for more supportive conditions ...................................... 14 Consolidating the digitalisation momentum ...................................................................................... 18 Reviving foreign direct investment .................................................................................................... 19 Investment dynamics differs across business types ........................................................................... 22
Very small, largely informal businesses ......................................................................................... 25 Medium-sized family firms ............................................................................................................ 29 Large, stock-market listed firms ..................................................................................................... 32 Skilled start-ups .............................................................................................................................. 35
Diversifying and strengthening the financing of investment ............................................................. 37 A three-pronged structural upgrading is in order to strengthen investment ....................................... 44 Annex 1.A. Modelling investment ..................................................................................................... 47 Annex 1.B. The drivers of investment at firm level........................................................................... 49 References .......................................................................................................................................... 50
Tables
Table 1. Drivers of investment at macroeconomic level ......................................................................... 9 Table 2. Drivers of investment at firm level .......................................................................................... 12 Table 3. R&D expenses ......................................................................................................................... 16 Table 4. Gravity model for bilateral FDI flows ..................................................................................... 21 Table 5. Determinants of machinery and equipment investment .......................................................... 25 Table 6. Determinants of the probability of reporting R&D expenditures ............................................ 26
Figures
Figure 1. Productive capital stock per worker ......................................................................................... 7 Figure 2. Machinery and transport equipment investment ...................................................................... 8 Figure 3. Gap between the statutory and the effective average tax rate on investment ........................... 9 Figure 4. How the business environment relates to machinery-equipment investment ........................ 10 Figure 5. Investment rates of listed firms .............................................................................................. 11 Figure 6. Interest rates are high and rising ............................................................................................ 14 Figure 7. Business spending on R&D is low but rising ......................................................................... 15 Figure 8. R&D investment rates of listed firms..................................................................................... 15 Figure 9. Tax subsidies for R&D are low in Turkey ............................................................................. 17 Figure 10. Turkey should catch-up more rapidly in core digital applications ....................................... 19 Figure 11. FDI inflows and stocks remain low in international comparison ......................................... 20 Figure 12. Change in FDI stocks by sector and country ....................................................................... 21 Figure 13. How the business environment correlates with foreign direct investment ........................... 22 Figure 14. Turkey's business sector is particularly fragmented ............................................................. 23 Figure 15. Labour productivity diverges across firm types ................................................................... 28 Figure 16. Machinery and equipment investments grow at uneven paces ............................................ 28 Figure 17. Probability of reporting R&D expenditures ......................................................................... 29
ECO/WKP(2019)1 │ 5
UPGRADING BUSINESS INVESTMENT IN TURKEY Unclassified
Figure 18. Medium-sized firms and high-tech start-ups are particularly leveraged .............................. 31 Figure 19. Listed firms achieve higher labour productivity .................................................................. 33 Figure 20. Bank leverage of medium-sized and listed firms is high ..................................................... 35 Figure 21. Bank loans have supported investment ................................................................................ 38 Figure 22. A valuable ecosystem for SME equity offerings ................................................................. 43
Boxes
Box 1. A dataset to shed light on firm-level investment dynamics ....................................................... 24 Box 2. A semi-formality trap in medium-sized family firms? .............................................................. 30 Box 3. Firms listed in domestic and international capital markets ........................................................ 32 Box 4. Turkey's start-up eco-system ..................................................................................................... 35 Box 5. The treasury-backed credit guarantee fund (KGF) .................................................................... 39 Box 6. The sovereign wealth fund ......................................................................................................... 41 Box 7. Building up an ecosystem for equity investing in small firms .................................................. 42 Box 8. Policy recommendations ............................................................................................................ 45
6 │ ECO/WKP(2019)1
UPGRADING BUSINESS INVESTMENT IN TURKEY Unclassified
Upgrading business investment in Turkey
By Seyit Mümin Cilasun, Rauf Gönenç, Mustafa Utku Özmen, Mehmed Zahid Samancıoǧlu,
Fatih Yilmaz and Volker Ziemann1
Introduction
Capital formation has contributed more to growth in Turkey over the longer term than in
comparable catching-up countries (Çağlar and Koyuncu, 2018[1]). The extensive revisions
to the national accounts in 2016 have made this trait even more evident. Recent analysis by
the IMF also concluded that, since 2012, aggregate investment has exceeded its
econometrically expected level (IMF, 2018[2]). However, overall the quality of capital
formation has been falling short. In particular, the contributions of total factor productivity
and information technology to economic growth remain below comparable countries
(Çağlar and Koyuncu, 2018[1]).
The allocation of investment across and within the infrastructure, housing, manufacturing
and service sectors reflects myriad demand, expected profitability, political, administrative,
tax and firm-level factors and is far from optimal. Informal and semi-formal businesses
have significantly lower regulatory and labour costs than formal firms and have a large
weight in the economy, undermining the allocative efficiency of capital expenditures. The
limited development of long-term credits and capital markets means that some investment
opportunities are foregone for lack of retained earnings. Partly as a result of skill gaps,
investment in knowledge-based and digitalisation lags. While such shortcomings are
visible in other OECD economies, this study, following up on evidence presented in earlier
OECD Economic Surveys of Turkey (OECD, 2014[3]; OECD, 2016[4]), shows that they are
particularly acute in Turkey.
The paper examines the trends and drivers of business sector investment at the
macroeconomic level, with a focus on investment in R&D and digitalisation, as well as on
foreign direct investment ‒ a vector of diffusion of global technical and managerial know-
how. It then looks at the investment performance of four different types of firms and
analyses their determinants and constraints. Drawing on OECD cross-country and country-
specific research, it concludes with policy recommendations for consolidating the strong
trend growth of investment while upgrading quality and allocative efficiency, with a view
for Turkey to move up faster in global value chains (OECD, 2016[4]).
1. Rauf Gönenç, Volker Ziemann and Mustafa Utku Özmen were respectively Head,
Economist and Secondee (from the Central Bank of Turkey) in OECD Economics Department’s
Austria-Turkey Desk when this research was carried out. Seyit Mümin Cilasun, Mehmed Zahid
Samancioğlu and Fatih Yilmaz are economists in the Central Bank of Turkey’s Structural Economic
Research Department. The authors are grateful to Turkish officials and members of the OECD
Economic and Development Review Committee for valuable comments and inputs. Special thanks
are due to Vincent Koen and Semih Tümen for precious advice, to Kurmaş Akdoǧan and
Dennis Dlugosch for technical contributions, to Béatrice Guerard for statistical and graphical inputs
as well as to Mercedes Burgos and Sisse Nielsen for their editorial assistance (all from OECD's
Economics Department). The document has benefited from numerous contributions from other
OECD directorates, including the Directorate for Science, Technology and Industry (STI) and the
Directorate for Financial and Enterprise Affairs (DAF), in particular from Mr. Serdar Çelik.

ECO/WKP(2019)1 │ 7
UPGRADING BUSINESS INVESTMENT IN TURKEY Unclassified
Turkey's capital stock is low but rising
Turkey’s per worker capital stock has picked up strongly over the past two decades,
outpacing comparable countries (Figure 1. Panel A) albeit from levels well below more
advanced OECD countries (Panel B). The pick-up in investment has been a major driver of
real GDP growth: on average, the increase in productive capital per worker has contributed
1.5 percentage points to annual potential growth since 2005, thereby accounting for nearly
a third of total growth.
The capital stock grows through public investment, mainly in infrastructure, and business
investment, mainly in land, buildings, machinery and transport equipment, intangibles but
also in infrastructure via public-private partnerships. As a share of GDP, public investment
has remained broadly stable at around 4% of GDP since the early 2000s. Business
investment, in contrast, expanded strongly from 10% of GDP at the beginning of the
century to 19% in 2006. It fell to around 13% during the global financial crisis with the
ensuing meltdown in global trade and industrial production before peaking again at 19%
by 2011. Business investment hovered between 17% and 18% of GDP between 2012 and
2016, declined in the aftermath of the failed coup attempt in summer 2016 but rebounded
in the second half of 2017.
Figure 1. Productive capital stock per worker
Constant prices, in thousand constant 2010 USD
Source: OECD Economic Outlook database.
StatLink 2 https://doi.org/10.1787/888933799188
According to the national accounts, machinery and transport equipment investment
accounts for more than 75% of business investment in Turkey. However, this aggregate
also includes investment in defence and security systems. As a result, investment in
machinery and transport equipment overstates non-construction business investment. All
in all, machinery and transport equipment investment expanded strongly between 2001 and
2005, reaching a relatively high share of GDP compared to other countries (Figure 2). Since
then, it has fluctuated around that level with increased volatility in the aftermath of the
global financial crisis and the coup attempt in summer 2016.
30
40
50
60
70
80
90
1995 2000 2005 2010 2015
A. Capital stock has been growing fast…
TUR CHL
MEX POL
0
50
100
150
200
250
300
350
400
ME
XC
HL
PO
LT
UR
GR
CP
RT
CZ
EG
BR
KO
RD
EU
ES
PIT
AN
LDC
AN
US
AF
RA
FIN
SW
ED
NK
AU
TN
OR
CH
EJP
NIR
L
B. … but its level remains relatively low2017
411

8 │ ECO/WKP(2019)1
UPGRADING BUSINESS INVESTMENT IN TURKEY Unclassified
Figure 2. Machinery and transport equipment investment
% of GDP
Source: OECD Economic Outlook database.
StatLink 2 https://doi.org/10.1787/888933799207
In an attempt to assess the determinants of productive investment across countries, a
dynamic investment equation is estimated. The baseline regression comprises several
theoretical approaches to modelling investment (Annex A). Results for both total
investment and machinery and transport equipment investment show that the coefficients
of potential drivers of investment exhibit the expected sign and are significant (Table 1).
The 𝛽-coefficients reflect the accelerator principle and are in principle adding up to 1.
Persistence, measured by 𝛽0, is slightly higher for total investment while machinery and
transport equipment investment reacts more strongly to cyclical information such as
expected GDP growth or stock market capitalisation, a proxy for expected marginal returns
on capital.
The user cost of capital is only significant, and with the expected sign, for total investment
but not for aggregate machinery and transport equipment investment. This could hint at a
dominant role of internal resources to finance business capital expenditures while housing,
and construction spending, are more prone to bank financing and respond therefore more
strongly to interest rate movements. The finding may also be driven by the fact that the
simplistic definition of user cost of capital (see Annex A) does not account for capital
allowances that are predominantly targeted to capital expenditures on machinery
investments. The wedge between the statutory and the average effective tax rate (capital
costs after deduction of the net present value of capital allowances) is particularly high in
Turkey for machinery investment (Figure 3).
0
2
4
6
8
10
12
14
16
1962 1967 1972 1977 1982 1987 1992 1997 2002 2007 2012 2017
A. In Turkey
0
2
4
6
8
10
12
14
16
GB
RU
SA
CA
NN
OR
GR
CP
RT
PO
LIS
RIT
AF
INM
EX
ES
PD
EU
FR
AN
LDD
NK
SV
KT
UR
AU
TS
WE
KO
RC
HE
CZ
EIR
L
B. In 2017 across countries

ECO/WKP(2019)1 │ 9
UPGRADING BUSINESS INVESTMENT IN TURKEY Unclassified
Table 1. Drivers of investment at macroeconomic level
Dependent variable: investment over lagged capital stock
Total investment Machinery and equipment
Explanatory variable Parameter1 (1) (2) (3) (4)
Lagged investment rate 𝛽0 0.6835*** 0.7061*** 0.6061*** 0.6231***
Real GDP growth (forecast, current) 𝛽1 0.2535*** 0.2291*** 0.3901*** 0.3849***
Real GDP growth 𝛽2 0.0325*** 0.0117 0.0151 0.0153
Stock market capitalisation 𝛾 0.0043*** 0.0050** 0.0102*** 0.0091***
User cost of capital 𝜎 -0.0146*** -0.0095* 0.0086 0.0026
Capital-output ratio 𝛼1 -0.0153*** -0.0137*** -0.0106** -0.0167***
Steady-state capital-output ratio 𝛼2 0.0012**
0.0003
Current account balance
0.0180* 0.0754***
Credit-to-GDP
-0.0053*** 0.0070*
Number of observations 431 426 342 340
Adjusted R2 (incl. fixed effects) 0.963 0.9649 0.8953 0.9037
Adjusted R2 (within) 0.8741 0.8806 0.7458 0.7656
***, ** and * correspond to statistical significance at 1%, 5% and 10% respectively.
1: Parameters from equation (4) in Annex A.
Note: Annual panel data covering 44 countries from 2000 to 2016 (machinery and equipment data only available
for a subset of 28 countries). All explanatory variables are lagged by one period unless stated otherwise. Capital
stocks are obtained through the perpetual inventory method
Source: OECD calculations based on OECD Economic Outlook database and IMF's World Bank's World
Development Indicator database.
Figure 3. Gap between the statutory and the effective average tax rate on investment
Percentage points, 2015
Source: ZEW report commissioned by the EU (Spengel et al., 2015[5]).
StatLink 2 https://doi.org/10.1787/888933799226
This may also partly explain why the share of corporate income taxes in overall tax
revenues is relatively low in Turkey (6.5% in 2016). If the low share reflects allowances
for growth-enhancing investments as much as tax evasion, this would constitute a rather
positive aspect of Turkey's tax code as it would favour investment. Indeed, the corporate
-6
-4
-2
0
2
4
6
8
10
12
14
JPN
PO
L
GR
C
IRL
GB
R
US
A
BG
R
MK
D
AU
T
NLD
SV
N
CH
E
ES
P
DE
U
LVA
LTU
RO
U
HU
N
EU
NO
R
SV
K
SW
E
CZ
E
DN
K
FIN
ES
T
FR
A
CY
P
CA
N
CR
O
ITA
PR
T
MLT
LUX
BE
L
TU
R
Machinery Intangibles

10 │ ECO/WKP(2019)1
UPGRADING BUSINESS INVESTMENT IN TURKEY Unclassified
income tax has repeatedly been identified as the form of taxation that is most detrimental
to growth and in particular to investment (Johansson et al., 2008[6]; Brys et al., 2016[7]).
The estimation results confirm the underlying theory predicting a stable desired capital-
output ratio as the negative coefficient 𝛼1 reflects mean-reversion while coefficient 𝛼2
captures the impact of changes to the long-run steady-state capital-output ratio induced by
technological, demographic or exogenous saving shocks and is expected to be positive (see
Annex A). In a variant, saving shocks are directly proxied through changes to credit-to-
GDP ratios and current account balances. This model captures reasonably well the Turkish
business sector’s investment trends in machinery and equipment over the past decade. The
high level of investment intensity has been mainly driven by buoyant demand (output
growth) and Turkey displays one of the highest country fixed effects across the sample
suggesting strong underlying capital formation dynamics.
Both the neoclassical theory and the q-theory of investment underlying the baseline
specification used in the above regressions assume frictionless markets. In reality, however,
financial, labour and product markets exhibit various degrees of market imperfection across
countries and time. To shed light on the link between market imperfections and investment,
structural indicators reflecting the business environment (the World Bank's Doing Business
indicators), the quality of governance (the World Bank's Worldwide Governance
indicators) and financial markets (from the World Bank's Global Financial developments
database) are added one by one to the baseline specification. Figure 4 displays standardised
coefficients and significance levels.
Figure 4. How the business environment relates to machinery-equipment investment
Standardised coefficients
Note: Based on baseline specification (3) in Table 1. Structural indicators (1-year-lagged) are added one-by-one.
***, ** and * correspond to statistical significance at 1%, 5% and 10% respectively.
Source: Calculations based on OECD (2018), OECD Economic Outlook (database).
StatLink 2 https://doi.org/10.1787/888933799245
The results suggest that the most relevant business environment indicators for firms’
investment decisions are the ease of getting electricity and the ease of registering property.
Both reflect administrative costs related to expanding properties and equipment. Despite a
high number of required procedures, registering property has become easier in Turkey in
******
****
*
***
**
*
*
***
-0.2 -0.1 0 0.1 0.2 0.3 0.4
Stock market total value traded to GDP (%)Bank return on assets
Mutual fund assets to GDP (%) (smoothed)Central bank assets to GDP (%) (smoothed)
Gross portfolio debt liabilities to GDP (%)Control of Corruption
Voice and AccountabilityPolitical Stability and Absence of Violence
Rule of LawGoverment Effectiveness
Regulatory QualityEnforcing contracts
Protecting minority investorsPaying taxes
Resolving insolvencyRegistering property
Dealing with construction permitsGetting credit
Starting a businessGetting electricity
Trading across borders
Fin
anci
alG
over
nanc
eD
oing
Bus
ines
s

ECO/WKP(2019)1 │ 11
UPGRADING BUSINESS INVESTMENT IN TURKEY Unclassified
recent years as the cost of transferring property has been reduced. The Coordination
Council for Improvement of the Investment Environment (YOIKK) put in force an omnibus
bill (Law No.7099 of March 2018) to further ease procedures and reduce costs in all major
doing business areas. This legislation has notably permitted the Directorate of Land
Registry to carry on various transactions electronically and improve procedures for
registering property.
The ease of getting electricity comprises the reliability of power supply and the
transparency of tariffs which may serve as a proxy for operational uncertainty underlying
investments. The procedures and costs of getting a permanent electricity connection in
Turkey (proxied by electricity access conditions in Istanbul) are still lagging behind best
international practices. In addition, interruptions and outage times are still an issue. Against
this backdrop, the Energy Market Regulation Authority has started to monitor more closely
service quality and supply security, and introduced new measures in 2017 in order to
improve them. These measures may improve Turkey’s ranking in the next vintage of
international getting electricity indicators.
Other Doing Business indicators enter the equation with the opposite and unexpected sign
(starting a business, getting credit, dealing with construction permits). The use of aggregate
investment data might mask the importance of administrative and legal obstacles and the
latter may even strengthen the incumbents' competitive position as they undermine
competition which makes new investments less risky. The negative link between
shareholder protection and investment intensity would be in line with theories suggesting
that dominant shareholders overriding minority holders’ interests may force managers into
excessive risk taking (Burkart, Panunzi and Shleifer, 2003[8]).
Figure 5. Investment rates of listed firms
Median investment rates, 2016
Note: Investment rate is defined as capital expenditures as a share of total capital at the beginning of the year.
The cleaning of the database notably prevents double-counting due to cross-listings and excludes mutual funds.
Source: Thomson/Reuters' Worldscope database. For coverage refer to Table 1.B. in Annex 1.B.
StatLink 2 https://doi.org/10.1787/888933799264
0
1
2
3
4
5
6
GRC SWE AUS CAN USA GBR BRA ISR RUS KOR FRA TUR IND ITA IDN CHN POL

12 │ ECO/WKP(2019)1
UPGRADING BUSINESS INVESTMENT IN TURKEY Unclassified
The importance of a strong rule of law and a stable political environment for investment
decisions corroborates firms' aversion to uncertainty and lack of transparency. Following
the major economic crisis in 2001/02, Turkey implemented a wide range of reforms
improving confidence in the country's institutions. However, several indicators point to a
weakening in the credibility of institutions in more recent years (OECD, 2018[9]). Resuming
the reform progress and re-establishing confidence in the quality of governance matters for
maintaining a business climate supportive of investment. Furthermore, the empirical
evidence presented in the lower panel of Figure 5 suggests that financial development and
a healthy banking sector are conducive to higher investment intensity.
The evidence based on countries' national account data shown above has shed light on
potential macroeconomic drivers of aggregate investment including aggregate demand
conditions, expected return on investment, capital costs, institutional characteristics and
financial development. The use of firm-level data allows for a more accurate and granular
exploration of these links as it accounts for the heterogeneity of firms with respect to size,
access to finance, balance sheets and income statements. Median investment rates of listed
Turkish companies are sourced from Worldscope, a standard data set frequently used for
firm-level analysis of investment, and confirm the high trend investment intensity of
Turkish business (Figure 5).
A vast theoretical and empirical literature has studied the drivers of investment at firm
level, focusing in particular on the impact of current and lagged output growth (the
accelerator mechanism), the expected profits against the cost of investment (represented by
Tobin’s Q here defined as the ratio of the enterprise value over its total capital), and of the
user cost of capital (see Annex B). Table 2 presents the results of a cross-country estimation
of these hypotheses, using data of stock market-listed firms operating in the manufacturing
sector from 18 countries (Worldscope database, see Annex Table 1.B.)
Table 2. Drivers of investment at firm level
Dependent variable: Investment rate defined as capital expenditures over total capital
All firms All firms Small High-tech Zombies Exporters TUR
Investment/capital (lagged) 0.177*** 0.122*** 0.016 0.110*** -0.037** 0.112*** 0.096***
Sales growth 0.041*** 0.023*** 0.024*** 0.024** 0.014*** 0.026*** 0.084***
Sales growth (lagged) 0.011*** 0.006** 0.006 0.005*** 0.003 0.008*** -0.008
Sales/capital (lagged) 0.007*** 0.005*** 0.006*** 0.005** 0.002 0.005*** 0.006*
Interest rate -0.023* -0.022** -0.021** -0.013 -0.004 -0.017* -0.037**
Tobins' Q 0.023*** 0.021*** 0.019*** 0.019*** 0.018*** 0.021*** 0.036***
New equity/capital 0.030*** 0.029*** 0.025*** 0.021*** 0.032*** 0.027***
Cashflow/capital 0.023*** 0.011* 0.013** -0.010 0.021*** -0.022
Leverage -0.086*** -0.067*** -0.051** -0.033*** -0.092*** -0.158***
Leverage x cashflow -0.013*** -0.016*** -0.011 -0.006 -0.015** 0.060
Number of observations 92596 55488 15149 20012 3096 33130 1116
Adjusted R2 (incl. fixed effects) 0.42 0.47 0.36 0.47 0.32 0.49 0.40
Adjusted R2 (within) 0.10 0.11 0.07 0.11 0.10 0.12 0.14
Note: All capital ratios based on total capital at the beginning of the period. Tobin's Q is the log of the ratio of the firm's
value and total capital. The presented coefficients are based on linear regressions that include firm-, country-year as well
as industry-year fixed effects. Small firms have less than USD 100 million of total assets. Zombie firms are characterised
by three consecutive interest-coverage ratios below 1. Exporters are firms with a share of international sales of above
25%. Standard errors are clustered at the country and industry-year levels.
***, ** and * correspond to statistical significance at 1%, 5% and 10% respectively.
ECO/WKP(2019)1 │ 13
UPGRADING BUSINESS INVESTMENT IN TURKEY Unclassified
Source: OECD calculations based on Thomson/Reuters' Worldscope firm-level data.
The results confirm the intuition that firm investment rates are far less persistent than
aggregate investment rates. The accelerator mechanism, the q-theory and the impact of user
costs of capital (here proxied by the firm's interest rate) are confirmed for the firm level,
irrespective of the type of firm. The issuance of new stocks is positively associated with
investment rates underlying the importance of equity capital for investment. In addition to
the aforementioned drivers of investment, internal financing (cash-flow) remains a
significant determinant of investment rates. Leverage, defined as debt over assets, is
negatively associated with investment.
The results in Table 2 suggest that among listed firms leverage is particularly penalising in
Turkey and, in addition, higher leverage is not associated with lower cash-flow sensitivity
of investment. This suggests increasing difficulties in accessing external financing for
investment project among over-leveraged firms in Turkey. Investment also tends to depend
more strongly on current demand and expected marginal return on capital, proxied by
Tobin's Q (firm valuation over capital). The results further underscore the importance of
interest rate dynamics for Turkish firms' investment rates, as bank financing is more
important than other market-based financing, including equity.
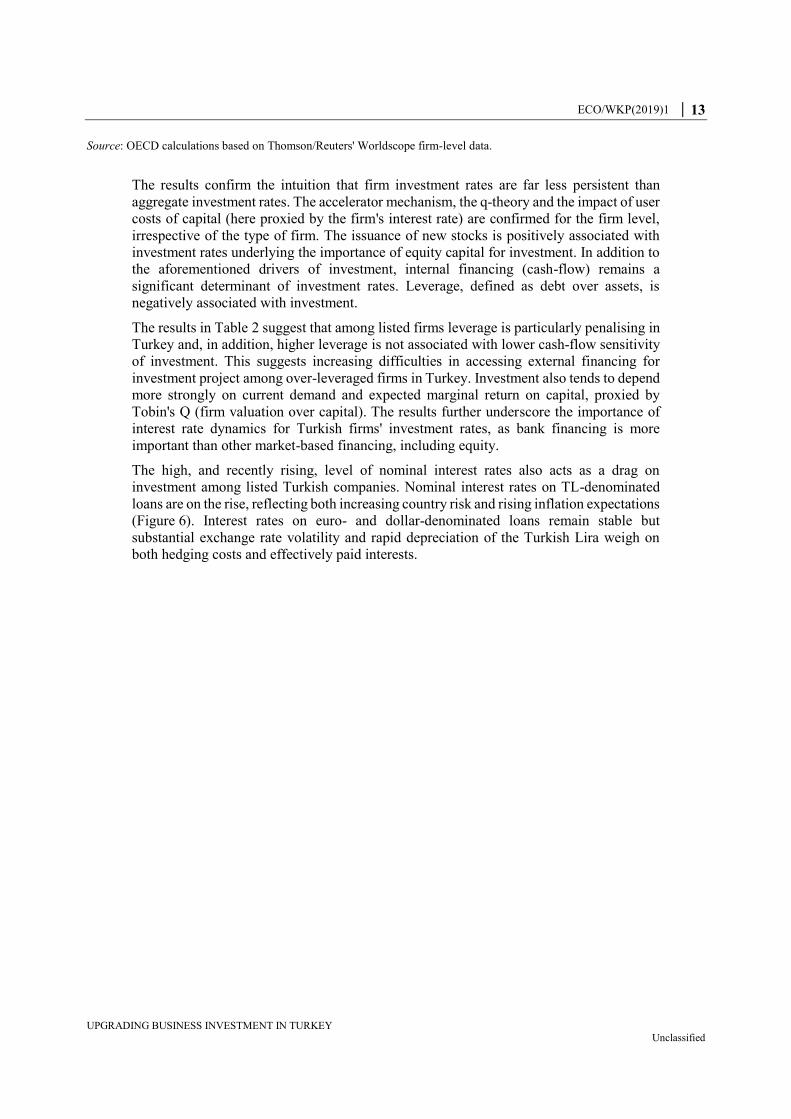
The high, and recently rising, level of nominal interest rates also acts as a drag on
investment among listed Turkish companies. Nominal interest rates on TL-denominated
loans are on the rise, reflecting both increasing country risk and rising inflation expectations
(Figure 6). Interest rates on euro- and dollar-denominated loans remain stable but
substantial exchange rate volatility and rapid depreciation of the Turkish Lira weigh on
both hedging costs and effectively paid interests.

14 │ ECO/WKP(2019)1
UPGRADING BUSINESS INVESTMENT IN TURKEY Unclassified
Figure 6. Interest rates are high and rising
Weighted average interest rates for banks' commercial loans denominated in different currencies, in %
Source: Central Bank of the Republic of Turkey.
StatLink 2 https://doi.org/10.1787/888933799283
R&D expenditures have increased but call for more supportive conditions
In contrast to overall business investment, Turkey's share of R&D expenditures in GDP is
below the OECD average. However, the share has risen fourfold since 2005 (Figure 7,
Panel A), to above the levels observed in other R&D lagging countries such as Chile,
Mexico, Greece and Slovakia and now exhibits a level comparable to the ones observed in
Poland (Panel B).
0
5
10
15
20
25
2006
2007
2008
2009
2010
2011
2012
2013
2014
2015
2016
2017
2018
A. Denominated in TRY
0
2
4
6
8
10
12
2006
2007
2008
2009
2010
2011
2012
2013
2014
2015
2016
2017
2018
B. Denominated in EUR
0
2
4
6
8
10
12
14
16
18
2006
2007
2008
2009
2010
2011
2012
2013
2014
2015
2016
2017
2018
C. Commercial loans excluding corporate overdraft account and corporate credit cards
denominated in TRY
0
1
2
3
4
5
6
7
8
9
10
2006
2007
2008
2009
2010
2011
2012
2013
2014
2015
2016
2017
2018
D. Denominated in USD

ECO/WKP(2019)1 │ 15
UPGRADING BUSINESS INVESTMENT IN TURKEY Unclassified
Figure 7. Business spending on R&D is low but rising
In percentage of GDP
Source: OECD (2018), Main Science and Technology Indicators (database).
StatLink 2 https://doi.org/10.1787/888933799302
Empirical evidence from listed companies (Worldscope) confirms the very low R&D
intensity of Turkish firms (Figure 8). The gap between advanced and emerging countries
seems to be higher among listed companies than on aggregate (Figure 7, Panel B) although
this could also reflect composition effects related to R&D reporting practices that differ
across industries. The following empirical analysis corrects for this potential bias by
controlling for industry-fixed effects.
Figure 8. R&D investment rates of listed firms
Median R&D investment rates in %, 2016
Note: R&D investment rate is defined as annual R&D expenses over total capital at the beginning of the year.
Source: Thomson Reuters' Worldscope database.
StatLink 2 https://doi.org/10.1787/888933799321
0
0.05
0.1
0.15
0.2
0.25
0.3
0.35
0.4
0.45
0.5
1995
1996
1997
1998
1999
2000
2001
2002
2003
2004
2005
2006
2007
2008
2009
2010
2011
2012
2013
2014
2015
A. In Turkey
0.0
0.5
1.0
1.5
2.0
2.5
3.0
3.5
4.0
CH
LM
EX
GR
CT
UR
PO
LP
RT
ES
PIT
AC
AN
IRL
CZ
EN
OR
GB
RN
LDF
RA
OE
CD
FIN
DN
KU
SA
DE
UA
UT
SW
EC
HE
JPN
KO
RIS
R
B. In 2016 or latest year
0
2
4
6
8
10
12
14
IDN TUR POL RUS BRA GRC IND KOR CHN GBR FRA ITA SWE CAN AUS ISR USA

16 │ ECO/WKP(2019)1
UPGRADING BUSINESS INVESTMENT IN TURKEY Unclassified
R&D expenditures may be difficult to finance with external sources for a number of
reasons. First, returns on R&D are difficult to measure and highly uncertain in nature which
makes it difficult for investors to estimate the net present value of R&D investments.
Second, external financing, in particular in the form of external equity, could make the
protection of intellectual property more difficult, reducing investment incentives. Third,
there is typically a lack of collateral which restricts access to bank finance. As a result, in
the presence of financial constraints, R&D expenditures are found to be more sensitive to
cash-flow developments (Brown, Fazzari and Petersen, 2009[10]).
Empirical investigations based on listed companies in the Worldscope dataset confirm this
hypothesis (Table 3), especially for small and financially strained firms. More generally,
R&D spending is more stable over time and less dependent on current demand or interest
rate dynamics. Similar to investment in fixed assets, equity issuance seems to be a very
consistent determinant of R&D expenditures, and over-leveraged firms invest less in R&D.
R&D expenses in Turkey do not seem to be affected by standard drivers of R&D investment
such as profitability (cash flow) or expected returns on capital (Tobin's Q). Persistence of
R&D investment rates is also much lower, indicating that R&D expenses are less stable
and predictable than in most other countries. The result could, however, also be driven by
a structural break as R&D in Turkey has expanded very rapidly in the most recent period.
Based on a longer dataset comprising Turkish manufacturing firms from 1996 to 2013,
there seems to be evidence for more persistence and a negative relationship between
financing constraints and R&D investment (Gezici, Orhangazi and Yalçın, 2018[11]).
Table 3. R&D expenses
Dependent variable: R&D investment rate defined as R&D expenses over total assets
All firms All firms Small High-
Tech Zombies Exporters TUR
R&D expenses/assets (lagged)
0.2950*** 0.3074*** 0.2585*** 0.2910*** 0.1939*** 0.2939*** 0.1971***
Sales growth 0.0021 -0.0015 -0.0034 -0.0039 -0.0061 -0.0011 0.0011
Sales growth (lagged) -0.0031 -0.0034 -0.0013 -0.0049 0.000 -0.0035 -0.0007
Sales/assets (lagged) -0.0047 -0.0078* -0.0157** -0.0157 -0.0249** -0.0056* 0.0006**
Interest rate 0.0009 -0.0018 -0.0050 -0.0026 -0.0085 -0.0045 -0.0001
Tobins' Q 0.0089* 0.0072* 0.0137** 0.0129* 0.0347*** 0.0057* 0.0003
New equity/assets
0.0203*** 0.0197** 0.0284*** 0.0392*** 0.0214*** 0.0008
Cash flow/assets
0.0069** 0.0123** 0.01 0.0261*** 0.0102 0.0007
Leverage
-0.0197*** -0.0248*** -0.0277*** -0.0522*** -0.0175*** -0.0005
Leverage x cash flow
0.0069 0.0030 0.0125 -0.0002 -0.0060 -0.0043
Number of observations 53259 52388 14508 19198 3138 31598 1066
Adjusted R2 (incl. fixed effects) 0.83 0.84 0.81 0.81 0.75 0.84 0.77
Adjusted R2 (within) 0.12 0.14 0.11 0.15 0.16 0.13 0.07
Note: All capital ratios based on total capital at the beginning of the period. Tobin's Q is the log of the ratio of the
firm's value to total capital. The presented coefficients are based on linear regressions that include firm- as well as
industry-year fixed effects. Zombie firms are characterised by three consecutive interest-coverage ratios below 1.
Exporters are firms with a share of international sales of above 25%. Standard errors are clustered at the country
and industry-year levels.
***, ** and * correspond to statistical significance at 1%, 5% and 10% respectively.
Source: OECD calculations based on Worldscope firm-level data.

ECO/WKP(2019)1 │ 17
UPGRADING BUSINESS INVESTMENT IN TURKEY Unclassified
Figure 9. Tax subsidies for R&D are low in Turkey
2017
1. Small, profitable firms (see http://www.oecd.org/sti/rd-tax-incentive-indicators.htm)
Source: OECD Science, Technology and Industry Scoreboard 2017.
StatLink 2 https://doi.org/10.1787/888933799340
FRAISLCHNSVN
IRLGBRHUN
NOR CZE
AUSNLD
BEL
JPN
KOR
AUT
PRTESPCAN
RUS
POLCHLGRC
TURMEX
ITA
0
1
2
3
4
0 0.05 0.1 0.15 0.2 0.25 0.3 0.35 0.4 0.45 0.5
Busines expenditure on R&D, % of GDP
Tax subsidy rates on R&D expenditure ¹
A. Tax subsidies for R&D, 2017
0
0.1
0.2
0.3
0.4
0.5
0.6
RU
S
BE
L
FR
A
IRL
HU
N
KO
R
AU
T
US
A
GB
R
AU
S
NO
R
SV
N
CA
N
ISL
NLD
PR
T
JPN
CZ
E
SW
E
CH
N
DN
K
ES
P
ISR
BR
A
NZ
L
ITA
GR
C
FIN
DE
U
TU
R
ES
T
ME
X
PO
L
CH
E
ZA
F
LTU
SV
K
CH
L
LVA
B. Direct government funding of business R&D2015, % of GDP
Direct government funding of BERD Indirect government support through R&D tax incentives
FRAISLCHNSVN
IRLGBRHUN
NOR CZE
AUSNLD
BEL
JPN
KOR
AUT
PRTESPCAN
RUS
POLCHLGRC
TURMEX
ITA
0
1
2
3
4
0 0.05 0.1 0.15 0.2 0.25 0.3 0.35 0.4 0.45 0.5
Busines expenditure on R&D, % of GDP
Tax subsidy rates on R&D expenditure ¹

18 │ ECO/WKP(2019)1
UPGRADING BUSINESS INVESTMENT IN TURKEY Unclassified
R&D tax subsidies have become the main tool for governments to boost R&D. Among
OECD countries, their share in total government support for business R&D expenditures
has risen from one third in 2006 to nearly half in 2015 (OECD, 2017[12]). Tax subsidies
seem to be positively associated with business expenditures on R&D, at least up to a certain
threshold of about 25% of R&D expenditures (Figure 9). In Turkey, tax credits and tax
allowances are among the lowest in the OECD, as currently documented in OECD
databases. One reason for that is that the allowance scheme is incremental, which reduces
the average allowance over the investment horizon. Second, the relief on labour costs, the
main component of R&D expenditures, is smaller than in many other countries due to a
relatively low employer social security contribution rate at 17.5%, half of which is
subsidised for R&D personnel. Furthermore, the tax code seems to discriminate against
intangible investment (Figure 3 above). Additional progress with the quantification of tax
incentives in accordance with OECD methodologies would improve their internationally
comparable monitorability.
The government can also support business R&D expenditures by direct grants. The share
of direct funding in overall government support for R&D is relatively high in Turkey.
However, all in all and in international comparison, Turkey ranks relatively low in terms
of total R&D support when measured as a share of GDP (Figure 1.9, Panel B).
Consolidating the digitalisation momentum
Turkish firms increasingly invest in digitalisation (i.e. in information and communication
technologies), though this type of investment is difficult to properly capture statistically.
Digital investment intensity rises faster than in a number of other middle-income OECD
countries, albeit mostly from lower levels. In some areas, the Turkish business sector has
done particularly well. For instance, only half of the enterprises had a website in 2010,
meaning Turkey compared unfavourably with other OECD countries; but by 2017, this
practice, backed by a new provision included in the commercial law, has increased to 73%,
putting Turkey ahead of some advanced OECD members (Figure 10, Panel A).
However, the adoption of digital applications related to core business management
functions is not as widespread as having a website. The share of firms using (functionally
important) enterprise resource planning (ERP) and customer relationship management
(CRM) software is lower than in several comparable countries (Panel B). Also, differences
in the adoption rates of technologies between enterprise types are deeper in more advanced
functions (Panel C). Both the international comparison and the firm-size divergence in
adoption rates may be related to skills gaps.
Turkey has been taking measures to promote digitalisation, for instance by facilitating the
connection of businesses to public authorities (i.e. online taxation systems). Yet, there is
ample room for additional policy action to incite firms to adopt digital technologies. In
recent OECD research, policies aiming at eliminating the skills gap as well as those
improving product market competition and labour market flexibility were shown to be
effective (Nicoletti, Andrews and Timiliotis, 2018[13]). According to econometric
estimations, Turkey’s adopting better policy practices in these domains would accelerate
the diffusion of digital technologies (Panel D). OECD also calls for adequate social and
regulatory protections for workers engaged in non-standard work practices based on digital
technologies (OECD, 2017[14]).

ECO/WKP(2019)1 │ 19
UPGRADING BUSINESS INVESTMENT IN TURKEY Unclassified
Figure 10. Turkey should catch-up more rapidly in core digital applications
% of all enterprises, excluding financial sector (10 employees or more)
1. The estimated impact shows the additional adoption probability of a given digital technology by firms
operating in sectors strongly exposed to an impact area, in comparison to firms operating in sectors less exposed
to the same impact area, induced by a policy change that would bring Turkey to the level of the best practice in
OECD countries in the respective policy domain, based on Nicoletti et al. (2018) and own calculations. As an
example, increasing the amount of ICT training provided for low-skilled employees to the level of best practice
in OECD is estimated to lead to around 10% more adoption of advanced cloud computing technologies by firms
in highly knowledge intensive sectors than those in less knowledge intensive sectors in Turkey.
2. Administrative burdens to start-ups.
3. Barriers to service sectors.
Source: Eurostat (2017), The Digital Economy and Society Index; and Nicoletti et al. (2018).
StatLink 2 https://doi.org/10.1787/888933799359
Reviving foreign direct investment
The generally high level of investment is not met with an equally high level of domestic
saving. The resulting large current account deficit is one of Turkey's major macroeconomic
challenges. Its financing requires sustainable net inflows of foreign capital, preferably in
0
10
20
30
40
50
60
70
80
90
PRT TUR HUN GRC FRA ITA ESP POL SVN CZE
A. Turkey progressed more rapidly than other countries…
Enterprises having a website
2010 2017
0
5
10
15
20
25
30
35
40
45
50
HUN TUR CZE GRC POL SVK PRT SVN FRA ITA ESP DEU
B. … but not on core uses of digitalisationEnterprises using CRM/ERP software, 2017
Customer Relationship Management (CRM)
Enterprise Resource Planning (ERP)
0
20
40
60
Small enterprises Medium enterprises Large enterprises
C. Differences between enterprise types are deeper in core functionsEnterprises using CRM/ERP software, 2017
CRM ERP
02468
1012
Knowledgeintensity
Knowledgeintensity
Knowledgeintensity
External financialdependency
Firm turnover Firm turnover Firm turnover
Training to lowskilled
Quality ofmanagerialeducation
Skill mismatch Insolvency regime Product marketregulation²
Product marketregulation³
Employmentprotectionlegilsation
Impact area:
Policy domain:
D. There is room for policy improvements to facilitate the adoption of digital technologies Estimated differential impact on adopting digital technologies¹
CRM Cloud computing Cloud computing (advanced)

20 │ ECO/WKP(2019)1
UPGRADING BUSINESS INVESTMENT IN TURKEY Unclassified
the form of foreign direct investments (FDI). FDI inflows and stocks remain currently low
in international comparison (Figure 11). Notably, the inflow of FDI originating from
Europe has declined from around USD 13 billion per year prior to the crisis to below USD
5 billion per year in 2016/17. While Europe's share in Turkey's inward FDI declined from
above 80% to around 65% over this period, Europe remains the main driver of FDI inflows
to Turkey.
Figure 11. FDI inflows and stocks remain low in international comparison
Inward FDI, % of GDP
Source: OECD (2018), OECD FDI Statistics (database).
StatLink 2 https://doi.org/10.1787/888933799378
The stock of FDI has peaked in 2010 at close to 25% of GDP and fell to just above 16.7%
of GDP in 2016 mainly on account of declining foreign equity participation in services, in
particular in banks and companies operating in information and communication (IC)
activities. The FDI stock in manufacturing was slightly more resilient over this period but
also declined by around 10%. Overall, the drop in FDI stocks in banks (-46%) and IC
companies (-66%) accounts for about 80% of the total decrease (Figure 12)
Equity participation originating from Europe and the US has substantially decreased from
2010 to 2016. Despite heavy drops, the Netherlands (mainly as a pass- through country
before reaching its final destination) remain the country with the highest FDI stock in
Turkey (USD 2.4 billion in 2016) followed by Germany (USD 1.3 billion) and Russia (USD
1 billion). Azerbaijan emerged as the 9th largest direct investor country Turkey by 2016
(USD 0.6 billion) merely driven by a major petro-industry project. Finally, the increase in
FDI from Qatar has offset a quasi-equally large decline in FDI from Saudi Arabia over the
same period.
0
1
2
3
4
2005 2007 2009 2011 2013 2015 2017
A. Inflows in Turkey
0
20
40
60
80
100
120
140
JPN
KO
RG
RC
TU
RIT
AD
EU
FIN
DN
KF
RA
NO
RU
SA
OE
CD
ME
XP
OL
ES
PA
UT
SV
KS
WE
PR
TH
UN
CZ
EB
EL
CH
LN
LDC
HE
B. Position in 2017 or latest year

ECO/WKP(2019)1 │ 21
UPGRADING BUSINESS INVESTMENT IN TURKEY Unclassified
Figure 12. Change in FDI stocks by sector and country
From 2010 to 2016, in billion USD
Note: Sectors and countries with the 5 largest gains and 5 largest losses are shown.
Source: Central bank of the Republic of Turkey.
StatLink 2 https://doi.org/10.1787/888933799397
To assess the impact of institutional factors on bilateral FDI flows, a gravity model is
estimated. Bilateral flows of FDI in 2016 are regressed on a standard set of explanatory
variables including distance, dummies for common language and common legal origin, the
levels of GDP and GDP per capita for the origin and the host country, human capital
endowments of the origin and host country as well as a dummy taking the value of 1 if a
free trade agreement between the two countries is in place and 0 otherwise (Table 4).
Similar to the empirical model used for investment rates, institutional variables as observed
in the host country are added one by one to the gravity model and Figure 13 reports the
obtained coefficients and significance levels.
Table 4. Gravity model for bilateral FDI flows
Dependent variable: log of inward FDI flow in USD million.
Distance -0.84***
Common language 1.57***
Common legal origin 0.35***
Log GDP (reporting country) 0.56***
Log GDP (counterpart country) 0.88***
Log per capita GDP (reporting country) 0.73***
Log per capita GDP (counterpart country) 0.77***
Area in sq. kms (reporting country) 0.06**
Area in sq. kms (counterpart country) -0.22***
Human capital index (Penn World Tables, reporting country) -0.57***
Human capital index (Penn World Tables, counterpart country) 0.51***
Dummy for existing free trade agreement (Source: WTO, 2015) 0.37***
Number of observations 11137
Adjusted R2 0.64
Note: Linear regression coefficients are shown. Standard errors are clustered at the year level.
***, ** and * correspond to statistical significance at 1%, 5% and 10% respectively.
Source: UNCTAD, CEPII, Penn World Tables.
-25
-20
-15
-10
-5
0
5
Info
.and
com
m.
Ban
ks
Foo
d
Met
als
Min
eral
pro
duct
s
Man
uf. n
.e.c
.
Tra
nspo
rt.
and
stor
age
Pla
stic
pro
duct
s
Who
lesa
lean
d re
tail
Cok
e an
d fu
els
A. Across sectors
-20
-15
-10
-5
0
5
10
NLD USA GBR GRC FIN SWE ESP QAT AZE RUS
B. Across countries

22 │ ECO/WKP(2019)1
UPGRADING BUSINESS INVESTMENT IN TURKEY Unclassified
The results suggest that trust in the host country's institutions affects very strongly its ability
to attract FDI inflows. Control of corruption, the effectiveness of government and the rule
of law exhibit the highest FDI inflow elasticities and the related coefficients are highly
significant. This is consistent with the recent OECD research finding that a percentage point
increase in the World Bank corruption perception index in the host country reduces FDI
from the countries having ratified the OECD Anti-Bribery Convention by between 4 and
9% (OECD, 2017[15]). Turkey’s international position has deteriorated in this area: its
ranking in Transparency International’s Corruption Perception Index fell from 53rd in 2013
to 81st in 2017. Turkey should build on OECD’s “Strategic Approach to Combating
Corruption and Promoting Integrity” to regain ground in this area (OECD, 2018[16]).
Regulatory quality and the ability to enforce contracts, as well as the capacity to resolve
potential insolvencies are also identified as important drivers of FDI inflows. The
weakening in the quality of institutions as measured by the World Bank governance
indicators since 2013 may help explain why Turkey did not recover the relatively higher
inflows observed prior to the crisis, in particular from European countries. Recent progress
in terms of enforcing contracts and insolvency procedures has been encouraging but should
be complemented with improvements in the quality of institutions.
Figure 13. How the business environment correlates with foreign direct investment
Standardised coefficients
Note: Structural indicators are added one-by-one to a standard FDI gravity model including distance, common language,
common legal origin, GDP, GDP per capita and human capital. Standardised coefficients for each indicator are shown
and
***, ** and * correspond to statistical significance at 1%, 5% and 10% respectively.
Source: Calculations based on OECD (2018), OECD Economic Outlook (database).
StatLink 2 https://doi.org/10.1787/888933799416
Investment dynamics differs across business types
The business sector is highly heterogeneous in Turkey, as highlighted in earlier OECD
Surveys (OECD, 2014[3]; OECD, 2016[4]). It includes a combination of small, low
productivity, largely informal businesses; medium-sized, family-managed and generally
only partly formal firms; and large, professionally managed formal corporations. A new
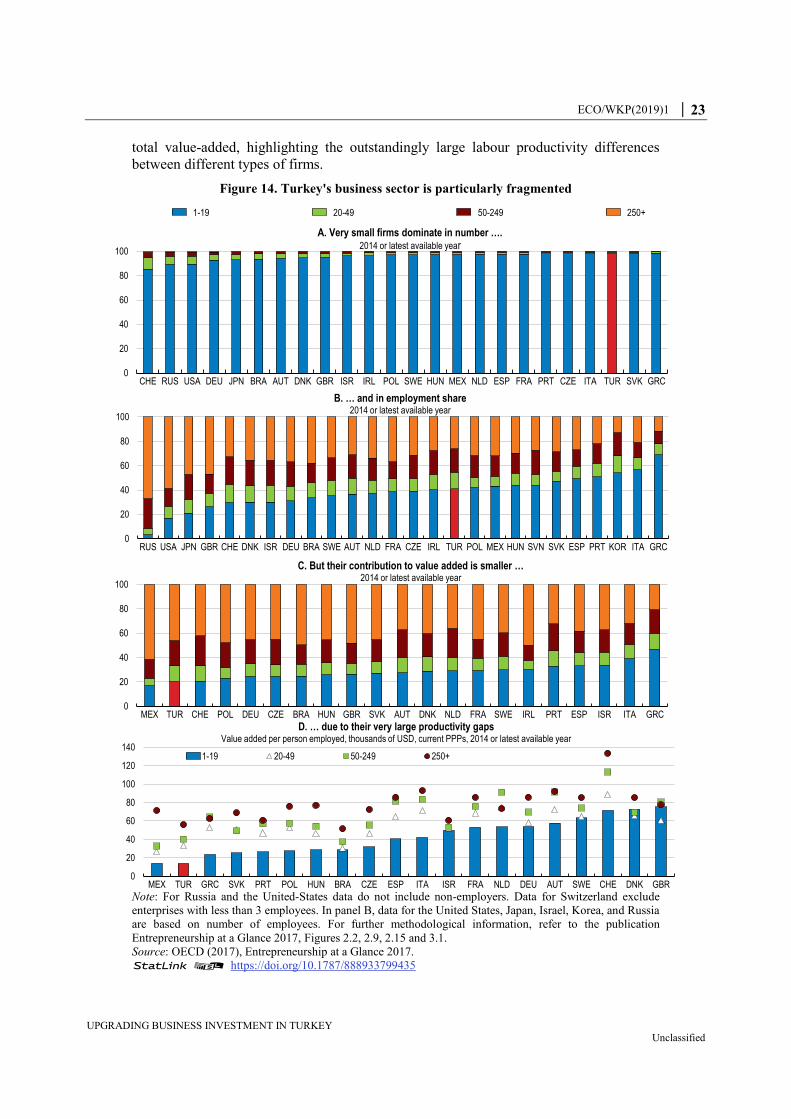
cohort of skill-intensive start-ups has also emerged. Figure 14 illustrates the segmentation
of the business sector according to standard size criteria. It shows the large weight of very
small businesses in employment, which contrasts with their significantly smaller weight in
******
****
*
****
-0.2 -0.15 -0.1 -0.05 0 0.05 0.1 0.15 0.2 0.25 0.3 0.35
Control of Corruption
Government Effectiveness
Rule of Law
Regulatory Quality
Political Stability and Absence of Violence/Terrorism
Voice and Accountability
Enforcing contracts
Resolving insolvency
Getting electricity
Trading across borders
Registering property
Protecting minority investors
Starting a business
Dealing with construction permits
Getting credit
Paying taxes
Gov
erna
nce
Doi
ng b
usin
ess
ECO/WKP(2019)1 │ 23
UPGRADING BUSINESS INVESTMENT IN TURKEY Unclassified
total value-added, highlighting the outstandingly large labour productivity differences
between different types of firms.
Figure 14. Turkey's business sector is particularly fragmented
Note: For Russia and the United-States data do not include non-employers. Data for Switzerland exclude
enterprises with less than 3 employees. In panel B, data for the United States, Japan, Israel, Korea, and Russia
are based on number of employees. For further methodological information, refer to the publication
Entrepreneurship at a Glance 2017, Figures 2.2, 2.9, 2.15 and 3.1.
Source: OECD (2017), Entrepreneurship at a Glance 2017.
StatLink 2 https://doi.org/10.1787/888933799435
0
20
40
60
80
100
120
140
MEX TUR GRC SVK PRT POL HUN BRA CZE ESP ITA ISR FRA NLD DEU AUT SWE CHE DNK GBR
D. … due to their very large productivity gapsValue added per person employed, thousands of USD, current PPPs, 2014 or latest available year
1-19 20-49 50-249 250+
0
20
40
60
80
100
CHE RUS USA DEU JPN BRA AUT DNK GBR ISR IRL POL SWE HUN MEX NLD ESP FRA PRT CZE ITA TUR SVK GRC
A. Very small firms dominate in number ….2014 or latest available year
0
20
40
60
80
100
RUS USA JPN GBR CHE DNK ISR DEU BRA SWE AUT NLD FRA CZE IRL TUR POL MEX HUN SVN SVK ESP PRT KOR ITA GRC
B. … and in employment share2014 or latest available year
0
20
40
60
80
100
MEX TUR CHE POL DEU CZE BRA HUN GBR SVK AUT DNK NLD FRA SWE IRL PRT ESP ISR ITA GRC
C. But their contribution to value added is smaller …2014 or latest available year
1-19 20-49 50-249 250+

24 │ ECO/WKP(2019)1
UPGRADING BUSINESS INVESTMENT IN TURKEY Unclassified
To preserve the strong growth of investments in the business sector while improving their
quality and efficiency, the ability of these different types of firms to upgrade their physical
and knowledge-based investments should be improved. Faster re-allocation of resources from
less productive and low-potential to more productive and high-potential firms would also
help improve the quality of capital formation. Building on the statistical regularities emerging
from a large Turkish firm-level database (Box 1), on the analyses of earlier OECD Surveys,
and on insights from the expanding firm-level research literature in Turkey (Atabek, 2018[17];
Atiyas and Bakis, 2018[18]; Çağlar and Koyuncu, 2018[1]; Taymaz, 2016[19]; Taymaz,
2016[20]), four types of firms displaying different investment dynamics were identified.
Box 1. A dataset to shed light on firm-level investment dynamics
A firm-level dataset was constructed for this Survey in co-operation with the
Structural Economic Research Department of the Central Bank of the Republic
of Turkey. The dataset drew on information from the “Enterprise Information
System” (EIS) database which consists of firm-level integrated data from eight
administrative sources, put together by the General Directorate for Productivity
of the Ministry of Science, Innovation and Industry.
In principle, EIS includes all enterprises in Turkey, from micro to large firms and
from partnerships to corporations. The dataset constructed for the survey is a
subset of the EIS database, encompassing all manufacturing firms providing
detailed balance sheets and income statements to the Revenue Administration of
the Ministry of Finance. Micro-size sole proprietorships submitting only
simplified income statements for tax purposes were excluded, since they do not
provide all the information required for the analysis, such as investment in
machinery and equipment.
After 340 000 observations were dropped due to insufficient data quality, the
final dataset for the purposes of this Survey contained 1.25 million observations
on around 260 000 manufacturing firms for the period 2006-16. In addition to
detailed balance sheets and income statements, data is available on the age,
employment, geographical location and sectoral-technological characteristics of
firms. The growth rate of their machinery-equipment and R&D investments can
be derived from their balance sheets for the period 2007-16. The remaining
imperfections in the data arising from widespread informality in employment and
financial reporting remained a challenge, but were not estimated to
fundamentally alter the observations on investment and financing trends
throughout the business sector.
The dataset includes around 96 000 firms employing 0-9 workers; 34 000 firms
employing 10-49 workers; 5000 firms employing 50-99 workers; 3500 firms
employing 100-249 workers; 1100 firms employing 250-499 workers and 800
firms employing more than 500 workers for the latest year of data availability,
2016. 165 of these firms were listed in Borsa Istanbul.
Econometric tests were then used to explore some of the links between firm-level
characteristics and the growth and composition of their investments. These estimations
were run for machinery and equipment investments (Table 5) and for the probability for a
ECO/WKP(2019)1 │ 25
UPGRADING BUSINESS INVESTMENT IN TURKEY Unclassified
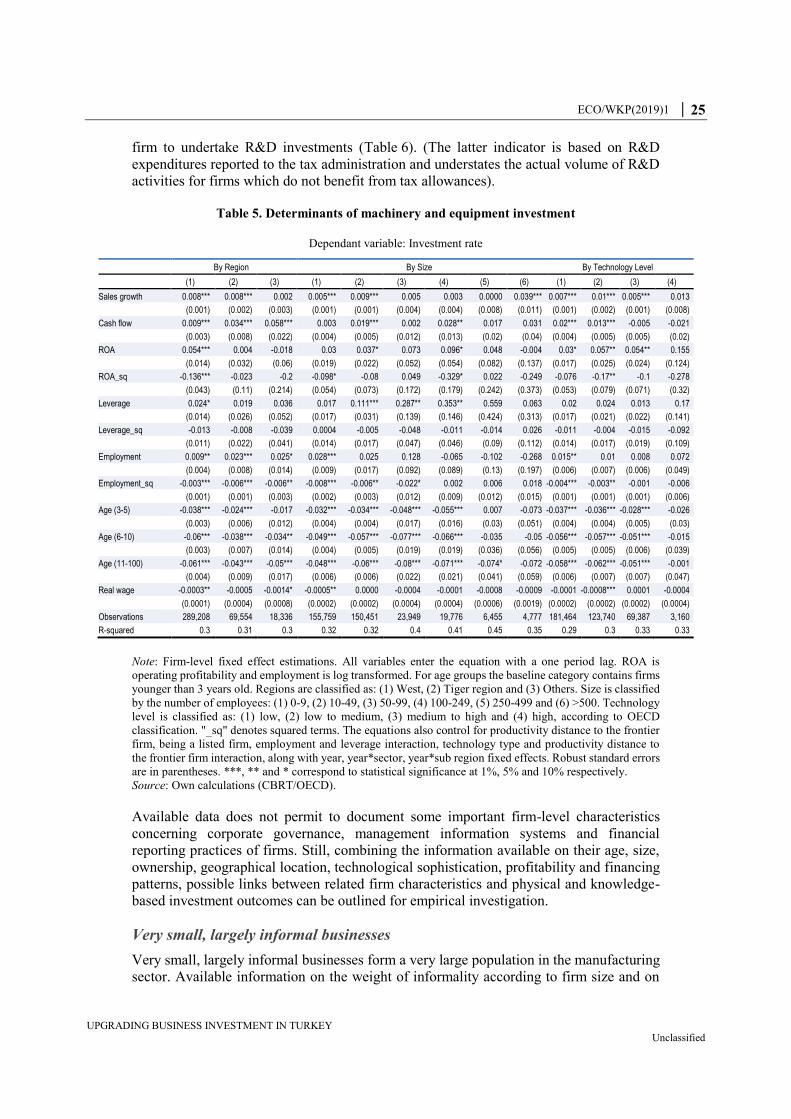
firm to undertake R&D investments (Table 6). (The latter indicator is based on R&D
expenditures reported to the tax administration and understates the actual volume of R&D
activities for firms which do not benefit from tax allowances).
Table 5. Determinants of machinery and equipment investment
Dependant variable: Investment rate
By Region By Size By Technology Level
(1) (2) (3) (1) (2) (3) (4) (5) (6) (1) (2) (3) (4)
Sales growth 0.008*** 0.008*** 0.002 0.005*** 0.009*** 0.005 0.003 0.0000 0.039*** 0.007*** 0.01*** 0.005*** 0.013
(0.001) (0.002) (0.003) (0.001) (0.001) (0.004) (0.004) (0.008) (0.011) (0.001) (0.002) (0.001) (0.008)
Cash flow 0.009*** 0.034*** 0.058*** 0.003 0.019*** 0.002 0.028** 0.017 0.031 0.02*** 0.013*** -0.005 -0.021
(0.003) (0.008) (0.022) (0.004) (0.005) (0.012) (0.013) (0.02) (0.04) (0.004) (0.005) (0.005) (0.02)
ROA 0.054*** 0.004 -0.018 0.03 0.037* 0.073 0.096* 0.048 -0.004 0.03* 0.057** 0.054** 0.155
(0.014) (0.032) (0.06) (0.019) (0.022) (0.052) (0.054) (0.082) (0.137) (0.017) (0.025) (0.024) (0.124)
ROA_sq -0.136*** -0.023 -0.2 -0.098* -0.08 0.049 -0.329* 0.022 -0.249 -0.076 -0.17** -0.1 -0.278
(0.043) (0.11) (0.214) (0.054) (0.073) (0.172) (0.179) (0.242) (0.373) (0.053) (0.079) (0.071) (0.32)
Leverage 0.024* 0.019 0.036 0.017 0.111*** 0.287** 0.353** 0.559 0.063 0.02 0.024 0.013 0.17
(0.014) (0.026) (0.052) (0.017) (0.031) (0.139) (0.146) (0.424) (0.313) (0.017) (0.021) (0.022) (0.141)
Leverage_sq -0.013 -0.008 -0.039 0.0004 -0.005 -0.048 -0.011 -0.014 0.026 -0.011 -0.004 -0.015 -0.092
(0.011) (0.022) (0.041) (0.014) (0.017) (0.047) (0.046) (0.09) (0.112) (0.014) (0.017) (0.019) (0.109)
Employment 0.009** 0.023*** 0.025* 0.028*** 0.025 0.128 -0.065 -0.102 -0.268 0.015** 0.01 0.008 0.072
(0.004) (0.008) (0.014) (0.009) (0.017) (0.092) (0.089) (0.13) (0.197) (0.006) (0.007) (0.006) (0.049)
Employment_sq -0.003*** -0.006*** -0.006** -0.008*** -0.006** -0.022* 0.002 0.006 0.018 -0.004*** -0.003** -0.001 -0.006
(0.001) (0.001) (0.003) (0.002) (0.003) (0.012) (0.009) (0.012) (0.015) (0.001) (0.001) (0.001) (0.006)
Age (3-5) -0.038*** -0.024*** -0.017 -0.032*** -0.034*** -0.048*** -0.055*** 0.007 -0.073 -0.037*** -0.036*** -0.028*** -0.026
(0.003) (0.006) (0.012) (0.004) (0.004) (0.017) (0.016) (0.03) (0.051) (0.004) (0.004) (0.005) (0.03)
Age (6-10) -0.06*** -0.038*** -0.034** -0.049*** -0.057*** -0.077*** -0.066*** -0.035 -0.05 -0.056*** -0.057*** -0.051*** -0.015
(0.003) (0.007) (0.014) (0.004) (0.005) (0.019) (0.019) (0.036) (0.056) (0.005) (0.005) (0.006) (0.039)
Age (11-100) -0.061*** -0.043*** -0.05*** -0.048*** -0.06*** -0.08*** -0.071*** -0.074* -0.072 -0.058*** -0.062*** -0.051*** -0.001
(0.004) (0.009) (0.017) (0.006) (0.006) (0.022) (0.021) (0.041) (0.059) (0.006) (0.007) (0.007) (0.047)
Real wage -0.0003** -0.0005 -0.0014* -0.0005** 0.0000 -0.0004 -0.0001 -0.0008 -0.0009 -0.0001 -0.0008*** 0.0001 -0.0004
(0.0001) (0.0004) (0.0008) (0.0002) (0.0002) (0.0004) (0.0004) (0.0006) (0.0019) (0.0002) (0.0002) (0.0002) (0.0004)
Observations 289,208 69,554 18,336 155,759 150,451 23,949 19,776 6,455 4,777 181,464 123,740 69,387 3,160
R-squared 0.3 0.31 0.3 0.32 0.32 0.4 0.41 0.45 0.35 0.29 0.3 0.33 0.33
Note: Firm-level fixed effect estimations. All variables enter the equation with a one period lag. ROA is
operating profitability and employment is log transformed. For age groups the baseline category contains firms
younger than 3 years old. Regions are classified as: (1) West, (2) Tiger region and (3) Others. Size is classified
by the number of employees: (1) 0-9, (2) 10-49, (3) 50-99, (4) 100-249, (5) 250-499 and (6) >500. Technology
level is classified as: (1) low, (2) low to medium, (3) medium to high and (4) high, according to OECD
classification. "_sq" denotes squared terms. The equations also control for productivity distance to the frontier
firm, being a listed firm, employment and leverage interaction, technology type and productivity distance to
the frontier firm interaction, along with year, year*sector, year*sub region fixed effects. Robust standard errors
are in parentheses. ***, ** and * correspond to statistical significance at 1%, 5% and 10% respectively.
Source: Own calculations (CBRT/OECD).
Available data does not permit to document some important firm-level characteristics
concerning corporate governance, management information systems and financial
reporting practices of firms. Still, combining the information available on their age, size,
ownership, geographical location, technological sophistication, profitability and financing
patterns, possible links between related firm characteristics and physical and knowledge-
based investment outcomes can be outlined for empirical investigation.
Very small, largely informal businesses
Very small, largely informal businesses form a very large population in the manufacturing
sector. Available information on the weight of informality according to firm size and on

26 │ ECO/WKP(2019)1
UPGRADING BUSINESS INVESTMENT IN TURKEY Unclassified
the strong reverse correlation between informal jobs and educational background of
employees (OECD, 2014[3]) suggest that their workers have generally limited formal
education. Firms employing less than 10 workers and older than five years (excluding
therefore young, high-skilled and potentially high-growth start-ups) form the bulk of this
group. Around 50 000 such businesses were in the dataset as of 2016. Two main features
distinguish these firms: i) they are in practice less bound by official regulations and tax and
financial reporting obligations than other firms; and ii) in turn, their interactions with
government authorities, with the banking and financial sector, and with other business
partners are impaired because of this large dose of informality.
Table 6. Determinants of the probability of reporting R&D expenditures
By Region By Size By Technology level
(1) (2) (3) (1) (2) (3) (4) (5) (6) (1) (2) (3) (4)
Sales growth 0.0005** 0.0012** 0.0001 0.0004** 0.0008 -0.0041 0.0034 0.0139 0.0129 0.0008*** 0.0008** -0.0003 0.0031
(0.0003) (0.0006) (0.0007) (0.0002) (0.0006) (0.0029) (0.0042) (0.009) (0.0116) (0.0003) (0.0004) (0.0008) (0.0057)
Cash flow -0.0000* 0.0000*** -0.0000 -0.0000 -0.0000** 0.0000 -0.0000 0.0001 -0.0003* 0.0000 -0.0000 -0.0000 -0.0000
(0.0000) (0.0000) (0.0000) (0.0000) (0.0000) (0.0000) (0.0001) (0.0008) (0.0002) (0.0000) (0.0000) (0.0000) (0.0000)
Employment -0.0086*** -0.0102*** -0.0113** -0.0004 -0.0239* -0.192 0.345 2.176* -0.293 -0.0082*** -0.0012 -0.023*** -0.0423*
(0.0017) (0.0034) (0.005) (0.0026) (0.0129) (0.289) (0.289) (1.18) (0.241) (0.0018) (0.0022) (0.0048) (0.0219)
Employment_sq 0.0035*** 0.0032*** 0.0028** 0.0014 0.0055*** 0.0237 -0.0321 -0.182* 0.0267 0.0024*** 0.0014*** 0.0089*** 0.0163***
(0.0004) (0.0008) (0.0011) (0.0009) (0.0021) (0.0339) (0.0287) (0.101) (0.0171) (0.0004) (0.0005) (0.0011) (0.004)
Age (3-5) 0.0006 -0.002 -0.0011 0.0002 0.0005 0.0152* -0.0157 -0.0028 -0.0354 -0.0008 -0.0003 0.002 0.0357**
(0.0008) (0.0017) (0.0026) (0.0008) (0.0014) (0.0082) (0.0112) (0.0379) (0.0633) (0.0008) (0.0012) (0.0025) (0.017)
Age (6-10) 0.0028** -0.0026 -0.0037 0.0008 0.004** 0.0348*** -0.0296** 0.011 0.0402 0.0004 -0.0002 0.0059* 0.0647***
(0.0011) (0.0022) (0.0033) (0.001) (0.0018) (0.0101) (0.0144) (0.0438) (0.0651) (0.0011) (0.0015) (0.0032) (0.0213)
Age (11-100) 0.0019 -0.0049* -0.0033 0.0002 0.0046* 0.0378*** -0.0411** -0.0181 0.0367 0.0012 -0.0009 -0.0009 0.0527*
(0.0015) (0.0029) (0.0045) (0.0012) (0.0024) (0.0118) (0.017) (0.0467) (0.0718) (0.0015) (0.0021) (0.0043) (0.027)
Real wage 0.0006*** 0.0004** 0.0006 0.0005*** 0.0006*** 0.0002 0.0011** 0.0025*** 0.0002 0.0002* 0.0003*** 0.001*** 0.0017***
(0.0001) (0.0002) (0.0004) (0.0001) (0.0001) (0.0004) (0.0004) (0.0008) (0.0006) (0.0001) (0.0001) (0.0002) (0.0004)
Export ratio 0.0014 0.0046 0.0191** 0.0017 0.0043 0.0009 0.0144 0.0113 0.0318 0.0014 -0.0018 0.0083 0.123***
(0.0019) (0.0043) (0.0089) (0.0015) (0.0031) (0.0116) (0.0139) (0.03) (0.0449) (0.0019) (0.003) (0.0053) (0.0349)
ROA 0.005 -0.0052 0.0026 0.0017 0.0031 0.0051 0.0356 -0.0358 0.121 0.0007 0.0044 0.0063 0.026
(0.0032) (0.007) (0.0123) (0.0026) (0.0057) (0.0195) (0.0285) (0.0536) (0.0745) (0.0032) (0.0042) (0.0094) (0.0484)
Leverage 0.0026 -0.0062 -0.0012 -0.0018 0.0045 0.0742** -0.0106 0.0787 -0.189* -0.0019 0.0064 0.0017 -0.118
(0.004) (0.0069) (0.0083) (0.0031) (0.0069) (0.034) (0.0453) (0.0971) (0.114) (0.0038) (0.0055) (0.0115) (0.0768)
Leverage_sq -0.0029 0.001 0.0002 0.0008 -0.0026 -0.0624** -0.0139 -0.0702 0.168* -0.0005 -0.0066 -0.0000 0.0792
(0.0037) (0.0068) (0.0091) (0.003) (0.0062) (0.0291) (0.0389) (0.0847) (0.0984) (0.0036) (0.0051) (0.0109) (0.0717)
Observations 468,802 111,908 34,330 307,917 219,535 30,209 23,650 7,437 5,383 292,671 207,185 110,505 5,615
R-squared 0.69 0.6 0.6 0.45 0.6 0.75 0.79 0.84 0.84 0.62 0.64 0.69 0.78
Note: Firm-level fixed effect estimations. ROA is the operating profitability and employment is log
transformed. ROA and leverage enter the equations with a one period lag. For age groups the baseline category
contains firms younger than 3 years old. Regions are classified as: (1) West, (2) Tiger regions and (3) Others.
Size is classified by the number of employees: (1) 0-9, (2) 10-49, (3) 50-99, (4) 100-249, (5) 250-499 and (6)
>500. Technology levels are classified as: (1) low, (2) low to medium, (3) medium to high and (4) high,
according to OECD classification. "_sq" denotes squared terms. The probit regressions also control for
productivity distance to the frontier firm, being a listed firm, employment and leverage interaction, technology
type and productivity distance to the frontier firm interaction, as well as year, year*sector, year*sub region
fixed effects. Robust standard errors are in parenthesis. ***, ** and * correspond to statistical significance at
1%, 5% and 10% respectively.
Source: Own calculations (CBRT/OECD).
According to Turkstat’s 2016 Labour Force Survey, 41% of the workers of non-agricultural
firms employing less than 10 workers are employed outside the scope of labour regulations
(without social security and tax registration), against 13% in firms employing between 10-
19 workers and less than 10% in the others. According to this Survey’s dataset, only 22%
of firms employing less than 10 workers had any outstanding bank relations and bank
ECO/WKP(2019)1 │ 27
UPGRADING BUSINESS INVESTMENT IN TURKEY Unclassified
credits in 2016. Many draw on trade credits (from suppliers and customers, which is their
main source of external financing) and this practice has expanded over the past decade.
Their total degree of leverage remains nonetheless well below other types of firms.
These firms have also very low labour productivity levels and their productivity gap vis-à-
vis manufacturing sector averages has widened over the past decade, although gaps may be
smaller in terms of total factor productivity (Taymaz, 2016[19]; Çağlar and Koyuncu,
2018[1]) (Figure 15). They have also expanded their machinery-equipment stock at a slower
pace than other types of firms (Figure 16). A small proportion of them have any R&D
activities and this share has not improved over time (Figure 17)
The empirical findings on the determinants of machinery and equipment investments of
very small firms point to the following main factors:
Sales growth (the accelerator mechanism) is the key driver of their physical
investments.
The two standard drivers of physical investment identified in the international and
Turkish research literature (internal cash-flows and credit) do not seem to play any
significant role in this type of firms (while their relevance is confirmed for firms in
other categories).
Among these very small firms the relatively larger ones invest more. This positive
relation between firm size and investment is stronger in this group than in other
firm categories.
Firm-level average wages seem to affect negatively their investments, possibly
reflecting their engagement in price competition. This is a clear difference from
other firm types (where the impact of the average wage level on investment is
insignificant – hinting at their transition to non-price competition).
Concerning the policy avenues available to improve the performance of this type of firms,
international research suggests that well-designed basic management training programmes
can help improve their management practices and their productivity (Hampel-Milagrosa
and Reeg, 2016[21]; Cravo and Piza, 2016[22]), as also stressed by Turkey’s Productivity
Strategy and Action Plan 2015-18 (Ministry of Science Industry and Technology, 2015[23]).
Simple and user friendly digital management tools are becoming available for them. Their
concentration in Small Industrial Sites (around 500 such SISs throughout Turkey host more
than 100 000 very small manufacturing businesses) may facilitate the implementation of
technical support programmes. Turkey’s SME Agency KOSGEB has traditionally directed
its programmes to relatively larger manufacturing SMEs installed in Organised Industrial
Zones (OIZs) but has recently started to develop programmes for very small firms,
including in service businesses. One of these programmes targets their engineering and
design capabilities.

28 │ ECO/WKP(2019)1
UPGRADING BUSINESS INVESTMENT IN TURKEY Unclassified
Figure 15. Labour productivity diverges across firm types
Manufacturing, real net sales per worker in 2006 prices
Note: Small firms (employing less than ten workers and which are more than five years old), medium-sized
firms (employing from 50 to 249 workers), and young technology-intensive firms (less than four year-old firms
in upper-middle and high technology sectors) real labour productivity are shown in percentage point deviation
from the manufacturing sector average, after controlling for sectoral composition differences.
Source: OECD/CBRT dataset on the basis of Enterprise Information System (EIS).
StatLink 2 https://doi.org/10.1787/888933799454
Figure 16. Machinery and equipment investments grow at uneven paces
Manufacturing, growth rate of machinery and equipment stock (real prices)
Note: Investment growth rates of small firms (employing less than ten workers and which are more than five
years old); of medium-sized firms (employing from 50 to 249 workers); of firms listed on the stock exchange;
and of young technology-intensive firms (less than four year old firms in upper-middle and high technology
sectors) are shown in percentage point deviation from the manufacturing sector average, after controlling for
sectoral composition differences.
Source: OECD/CBRT dataset on the basis of Enterprise Information System (EIS).
StatLink 2 https://doi.org/10.1787/888933799473
110
115
120
125
130
135
140
145
-10
-5
0
5
10
15
20
25
2006 2007 2008 2009 2010 2011 2012 2013 2014 2015 2016
Thousand TRY% points deviation from
averageSmall firms Medium firms Young high-tech firms Unweighted firm average (right axis)
-10
-8
-6
-4
-2
0
2
4
6
8
10
-10
-8
-6
-4
-2
0
2
4
6
8
10
2007 2008 2009 2010 2011 2012 2013 2014 2015 2016
% changes% points deviation from
average
Small firms Medium firms Listed firms Young high-tech firms Unweighted firm average (right axis)

ECO/WKP(2019)1 │ 29
UPGRADING BUSINESS INVESTMENT IN TURKEY Unclassified
Medium-sized family firms
Medium-sized family firms constitute a very different type of business. They have played
an important role in Turkey’s industrial development over the past decade. They grew in
all regions, including in the so-called “Anatolian Tiger” catching-up regions. They are led
by the successful first or second generation owners of the previously smaller businesses
which have succeeded to build-up stronger technical, managerial and financial capacities.
They employ higher-skilled personnel than small firms, pay them higher wages, and
register a higher proportion of them with the social security system (health and pension
benefits). Their production capacities are flexible and the delivery times of their products
may be very short. Many started to integrate into regional and global value chains. The
proportion of such firms operating in lower-middle and even higher-middle technology
sectors has increased and part of them started R&D activities (Figure 17)
Their employment varies considerably, from tens to hundreds of workers per firm. Firms
employing 50-250 workers are the most representative size category. They generally
operate under close family governance, with family members in key managerial positions.
They tend to offer limited external financial transparency, which may restrict their access
to external equity capital and to professional labour markets and, as a result, could constrain
their investment and organisational innovation capacity (Box 2).
Figure 17. Probability of reporting R&D expenditures
Manufacturing, share of firms reporting R&D expenditures in their income statement
Note: Share of small firms (employing less than ten workers and which are more than five years old); of
medium-sized firms (employing from 50 to 249 workers); of firms listed on the stock exchange; and of young
technology-intensive firms (less than four year old firms in upper-middle and high technology sectors) are
shown in percentage point deviation from the manufacturing sector average, after controlling for sectoral
composition differences.
Source: OECD/CBRT dataset on the basis of Enterprise Information System (EIS).
StatLink 2 https://doi.org/10.1787/888933799492
1.6
1.7
1.8
1.9
2.0
2.1
2.2
2.3
2.4
-10
0
10
20
30
40
50
60
70
2006 2007 2008 2009 2010 2011 2012 2013 2014 2015 2016
%% points deviation from average
Small firms Medium firms Listed firms Young high-tech firms Unweighted firm average (right axis)

30 │ ECO/WKP(2019)1
UPGRADING BUSINESS INVESTMENT IN TURKEY Unclassified
Box 2. A semi-formality trap in medium-sized family firms?
Medium-sized family firms have traditionally relied on hands-on management
by their owners. Their management information systems appear to be basic, and
there is evidence that many underreport their effective employment, activity,
wage and profitability levels. Very few publish audited financial accounts. The
vast majority refrain from stock market listing but resort massively to bank loans
to finance their development. Their communication with banks has traditionally
been based on private bilateral rather than on published financial information.
This established practice is now challenged by the new prudential rules in the
banking sector which require reliance on formal audited accounts
A recent survey conducted by the Corporate Governance Association of Turkey
among family firms (TKYD, 2017[24]), point to important challenges. Around
43% of the firms state that they need to strengthen their capital structures and
37% plan to accelerate the digital transformation of their businesses. The survey
finds that only 27% of firms have put in place formal corporate governance
arrangements so far, but 49% are in the process of doing so. A fundamental issue
reported by Turkish family firms is the challenge of transmission to the next
generations. The transition to the third generation is reported as a particularly
testing stage. TKYD recognizes that reinforcing capital structures by upgrading
family firms’ corporate governance arrangements and transparency may increase
costs in short-term, but emphasises that Turkish family firms should assume
these costs as the expected gains are considerable.
The prevalence of insider management in these firms – that international research
identifies as a deterrent to productivity growth (Bloom and Van Reenen,
2010[25]), when associated with limited financial information and transparency,
may delay their transition to integrated management systems based on digital
technologies.
The empirical findings on the determinants of machinery-and-equipment and R&D
investment of medium-sized firms hint at a number of specificities (Table 5 and Table 6):
● Medium-sized manufacturing firms employing between 50-249 workers have
steadily expanded their machinery-equipment investments over the past decade,
faster than all other sizes of firms.
● Such firms in Anatolian Tiger towns have increased their machinery-and-
equipment investments even faster.
● The strong growth of investments required first of all strong internal cash-flows.
The relationship between internal cash-flows and investments has been particularly
strong in the core category in this group – i.e. firms employing 100 to 250 workers.
● Internal cash-flow effects have been particularly strong in Anatolian Tiger towns.
This invites two possible explanations: i) the external funding necessary to
complete internal cash-flows may have been less abundant or more costly in these
catching-up regions, and/or ii) Anatolian Tiger towns’ family firms may have kept
and re-invested a higher proportion of their profits in the development of their
businesses.

ECO/WKP(2019)1 │ 31
UPGRADING BUSINESS INVESTMENT IN TURKEY Unclassified
● A strong impact of internal cash-flows on R&D investments is also visible in
Anatolian Tiger towns, but not in the Western regions. Firms in Western regions
may have had better access to external resources for funding their R&D
investments.
● The profit margins and the resulting cash flows declined in many medium-sized
firms over the past decade, in particular among the lower-scale ones and in
Anatolian Tiger towns. This has restricted their internal funding capacities for both
physical and knowledge-based investments.
● Growing recourse to debt has been the medium-sized firms’ response to the gap
between internal resources and their growing physical and knowledge-based
investment needs. A rapid build-up of debt resulted in the medium-sized firms of
all regions (Figure 18).
● There is some early evidence that a non-linear relationship exists between debt and
machinery-equipment and R&D investments. While access to debt is associated
with higher rates of investment, this positive impact seems to diminish at higher
levels of leverage. Beyond a threshold, excess leverage may constrain both
physical and knowledge-based investment. There is some evidence that this
constraint may be particularly strong for medium-sized firms.
● The investment and productivity gains that could be expected from medium-sized
firms’ access to external equity markets cannot be quantitatively estimated at this
point, but is considerable.
Figure 18. Medium-sized firms and high-tech start-ups are particularly leveraged
Manufacturing, ratio of total liabilities to total assets
Note: Small firms (employing less than ten workers and which are more than five years old), medium-sized
firms (employing from 50 to 249 workers), and young technology-intensive firms (less than four year-old firms
in upper-middle and high technology sectors) ratios are shown in percentage point deviation from the
manufacturing sector average, after controlling for sectoral composition differences.
Source: OECD/CBRT dataset on the basis of Enterprise Information System (EIS).
StatLink 2 https://doi.org/10.1787/888933799511
50
52
54
56
58
60
62
-4
-2
0
2
4
6
8
2006 2007 2008 2009 2010 2011 2012 2013 2014 2015 2016
Ratio in %% points deviation from
average
Small firms Medium firms Young high-tech firms Unweighted firm average (right axis)
32 │ ECO/WKP(2019)1
UPGRADING BUSINESS INVESTMENT IN TURKEY Unclassified
Public policies can help medium-sized family firms surmount their excess debt constraints.
Helping them become fully formal and financially transparent would be an important first
step. Technical support to the adoption of modern management and financial information
systems, and a favourable tax treatment of transition to fuller financial transparency (for
instance through tax allowances for external audit costs) could play a positive role. A
strategy for developing the most important elements of an “equity ecosystem” (see below),
including via the active participation of domestic institutional investors in the equity capital
market, may help many so-far closed medium-sized firms to open to capital markets and
secure new long-term resources for their investments – as was also recommended in the
previous OECD Economic Surveys (OECD, 2014[3]; OECD, 2016[4]).
Large, stock-market listed firms
Large, professionally managed and usually stock-market listed firms constitute the formal
pillar of the Turkish business sector. Around half of the machinery-and-equipment stock of
the Turkish economy is in large firms employing more than 500 workers, and around a
quarter in directly listed firms (a large part of the large-size non-listed firms belong
nonetheless to listed conglomerates). They include big family holdings, some former state-
owned firms which have been privatised through public offerings, and international firms
operating in Turkey – listed in their country of origin. They achieve Turkish
manufacturing’s highest labour productivity and returns of investment, and, according to
an earlier study (McKinsey Global Institute, 2003[26]), top layer corporations match the
productivity and efficiency levels of their advanced OECD country counterparts. They have
developed R&D and technological innovation capacities (Figure 17 above) and invest
extensively in employee training. Subject to the financial reporting rules of the Turkish
Capital Markets Board and of the Istanbul Stock Exchange (Borsa Istanbul) they are
financially transparent according to global standards. About ten of them have issued
securities in the international market and are rated by international rating agencies.
Multi-generation family holdings form the core of the formal business sector. They have
developed special corporate governance arrangements which, despite family prevalence on
boards, offer a large space to professional management. A recent review suggests that
Turkey’s multi-generation family holdings have nonetheless room for further tightening
their management information and control systems, including through integrated digital
applications (Bigan, Decan and Korkmaz, 2017[27]). Their access to domestic and
international capital markets augments their investment resources and capacities. They
increased their external debts under the highly benign international funding conditions of
the post-global crisis period (Box 3).
Box 3. Firms listed in domestic and international capital markets
The transparency, credibility and “blue-chip” status of stock market-listed firms
in the domestic and international banking and capital markets reduce their capital
costs and allow them to tap more investment resources. This has permitted them
to build up pools of funding resources which benefit all their affiliates, and, when
needed, their suppliers and customers via trade credits. This capacity has
contributed to the remarkable expansion of the holding company form in the
Turkish economy.

ECO/WKP(2019)1 │ 33
UPGRADING BUSINESS INVESTMENT IN TURKEY Unclassified
As they tend to fully comply with formal laws and rules, these firms face higher
regulatory, social contribution and tax costs than the rest of Turkish
manufacturing, which may more than offset their lower capital costs. This may
negatively affect their cost competitiveness, in particular in labour intensive
sectors (OECD, 2016[4]).
The financing edge of these firms in the domestic market does not necessarily
extend to international markets. The proportion of their floated shares and the
volume of their public offerings (IPOs and SPOs) remain generally small by
international standards. It was recently suggested that not more than ten Turkish
holding groups have sufficiently large security emission projects to engage
mainstream long-term institutional investors - rather than more risk-prone and
volatile international hedge funds (Ünlü, 2017[28]). These firms are also
constrained by Turkey’s sovereign rating ceilings and bear the corresponding risk
premia in their corporate bond yields and stock price/earnings ratios. In March
2018, the corporate bonds of Turkish firms such as Koç Holding, Anadolu Efes,
Coca Cola Içecek and Oyak were downgraded to below investment grade by the
main international firm-level rating agency as a result of an additional one-notch
downgrade of Turkey’s sovereign rating.
Figure 19. Listed firms achieve higher labour productivity
Manufacturing, real net sales per worker in 2006 prices
Note: Small firms (employing less than ten workers and which are more than five years old), medium-sized
firms (employing from 50 to 249 workers), firms listed on the stock exchange, and young technology-intensive
firms (less than four year-old firms in upper-middle and high technology sectors) real labour productivity are
shown in percentage point deviation from the manufacturing sector average, after controlling for sectoral
composition differences.
Source: OECD/CBRT dataset on the basis of Enterprise Information System (EIS).
StatLink 2 https://doi.org/10.1787/888933799530
Foreign firms having invested in Turkey constitute the internationalised fringe of the formal
sector, with additional financing capacities from their mother companies. This shields their
funding capacities from domestic banking and capital market conditions. However, as their
110
115
120
125
130
135
140
145
-50
0
50
100
150
200
250
300
2006 2007 2008 2009 2010 2011 2012 2013 2014 2015 2016
Thousand TRY% points deviation from average
Small firms Medium firms Listed firms Young high-tech firms Unweighted firm average (right axis)

34 │ ECO/WKP(2019)1
UPGRADING BUSINESS INVESTMENT IN TURKEY Unclassified
key capital formation decisions are taken at the level of their global headquarters, the
return/risk assessment of their projects remain exposed to global perceptions on the risk
factors in local business conditions.
Figure 16, Figure 17 and Figure 19 highlighted the trends in the physical and knowledge-
based investments of listed firms and their edge in labour productivity. Tables 4 and 5
present some econometric results on possible influences on very large firms’ machinery-
equipment and knowledge-based (R&D) investments:
Listed firms invest more in machinery and equipment than non-listed firms – all
other firm characteristics equal.
They also invest more in R&D, although this is confined to lower-middle
technology sectors.
Large firms and in particular listed firms have significantly higher labour
productivity and return on asset levels than other types of firms, even if this gap
was reduced over the past decade (Figure 19).
Still, there are signs that these firms may not be realising their full investment
potential in machinery-equipment and in knowledge-based assets, due to the weight
of the bank debt that they have accumulated (Figure 20). Although the sample size
for these firms is smaller than for other firms, there is some early evidence that very
high bank leverage is harmful for the growth of both their physical and R&D
investment.
Firms in high-technology sectors may be escaping this debt constrain. Their
physical investments continue to grow even under high-debt. These firms may have
achieved higher credibility and creditworthiness with financial investors and
creditors than counterparts in less sophisticated activities - or may possess more
valuable collateral.
As listed firms are more compliant with local laws and pay significantly higher corporate
taxes than other firms, their physical and knowledge-based investments are in principle
more sensitive to tax incentives. Well-designed incentives may stimulate additional
knowledge-based capital building in these high-performance firms, with positive spill-over
effects for the rest of the economy (Andrews, Criscuolo and Gal, 2015[29]). R&D incentives
in Turkey are very generous, including a 250% corporate income tax deduction, wage
subsidies, personal income tax, social security premium and VAT exemptions, and higher
amortization rates for newly acquired assets. However, Turkey grants comparatively less
R&D tax incentives than other OECD countries.

ECO/WKP(2019)1 │ 35
UPGRADING BUSINESS INVESTMENT IN TURKEY Unclassified
Figure 20. Bank leverage of medium-sized and listed firms is high
Manufacturing, ratio of bank liabilities to total assets
Note: Small firms (employing less than ten workers and which are more than five years old), medium-sized
firms (employing from 50 to 249 workers), firms listed on the stock exchange, and young technology-intensive
firms (less than four year-old firms in upper-middle and high technology sectors) ratios are shown in percentage
point deviation from the manufacturing sector average, after controlling for sectoral composition differences.
Source: OECD/CBRT dataset on the basis of Enterprise Information System (EIS).
StatLink 2 https://doi.org/10.1787/888933799549
Skilled start-ups
Skilled-start-ups form a still small but promising layer of the business sector. They are led
by skilled managers and workers and engage in sophisticated manufacturing and service
activities. Part of them have large firms as shareholders, and many draw on the wide set of
supports available for start-ups (Box 4). They tend to develop their machinery-and-
equipment investments very vigorously - while their reporting limited R&D expenditures
to the tax administration may be due to the tax exemptions they anyway obtain in the techno
parks and technology development zones (Figure 16, Figure 17).
Box 4. Turkey's start-up eco-system
The Turkish government, together with large firms and universities, has developed
several schemes to support high-technology start-ups over the past decade. These
schemes have helped foster a relatively large cohort of high-technology start-ups:
The Scientific and Technological Research Council of Turkey (TUBITAK)’s
Techno-Entrepreneurship Grant Programme offers $33 000 per firm in seed
capital to eligible high-tech start-ups.
TUBITAK offered grants subsidising up to 75% of the R&D costs of technology
start-ups.
0
1
2
3
4
5
6
7
8
9
-4
-2
0
2
4
6
8
10
12
14
2006 2007 2008 2009 2010 2011 2012 2013 2014 2015 2016
Ratio in %% points deviation from
average
Small firms Medium firms Listed firms Young high-tech firms Unweighted firm average (right axis)

36 │ ECO/WKP(2019)1
UPGRADING BUSINESS INVESTMENT IN TURKEY Unclassified
A Treasury programme provides direct subsidies to entrepreneurs with
innovative technological ideas. In 2015, around 70% of the applicants received
support.
The SME Agency KOSGEB offers conditional start-up grants, subject to
participation in start-up training courses (or to attending KOSGEB-approved
university lectures on entrepreneurship). Between 2010 and 2017, more than
900 000 people participated in these programmes and 42 000 entrepreneurs
launched start-ups under this programme.
Techno parks attached to major universities offer substantial tax advantages
under a special law. Member firms are granted corporate income tax exemptions
and their staff personal income tax exemptions. The number of firms installed in
techno parks had approached 5000 in 2018 and they were employing around
45 000 eligible workers.
“Endeavor” is an international non-profit contributor to the start-up ecosystem
in Turkey. Young firms selected in the entire country gain access to a network
of international and national business leaders volunteering to help and coach
them in their take-off years.
“Garaj” is a domestic non-profit organisation arranging networking events and
training courses for start-ups. Despite being a young organisation it has gained
considerable visibility among start-ups. It also sponsors crowd-funding
initiatives.
Investors in start-ups obtain substantial tax advantages. Domestic and
international venture- and angel-capital investors registered and licenced by the
Treasury can deduct 75-100% of their investments in start-up funds from their
personal income taxes. More than 450 investors have registered so far and
invested approximately TRY 12 million. A Turkey “Fund of Funds” scheme was
also created by the Treasury in 2013, to take minority participations (of less than
30%) in venture funds. These included a 25% stake in the EUR 260 million
Turkey Growth and Innovation Fund (TGIF) which, by May 2018, invested EUR
52 million in six start-ups. An additional Treasury facility of TRY 2 billion was
announced in December 2017, to directly invest in start-ups. The Treasury
projects that the amount of Treasury funds invested in start-ups will not exceed
the total amount of private venture and angel capital committed to the same start-
ups and will in all instances not exceed TRY 2 billion by 2023 (around 1% of
projected 2018 GDP in real terms).
The results of these substantial support schemes in terms of technological and
commercial success rates have not been systematically assessed to date. The firm-level
Enterprise Information System (EIS) of the Ministry of Science, Industry and
Technology can be further developed and used to this effect, and could help concentrate
public supports on the most effective schemes.
The population of young firms (less than four years old) in upper-middle and high
technology sectors has regularly augmented in the past five years. Compared to their
international counterparts, these firms may be handicapped by their less sophisticated local
(upward and downward) linkages, but the highest potential ones seek to compensate this
handicap by fostering links with global academic and technological partners (OECD,

ECO/WKP(2019)1 │ 37
UPGRADING BUSINESS INVESTMENT IN TURKEY Unclassified
2013[30]). The need to liaise with official and international partners requires them to be
much more transparent operationally and financially than other small businesses.
The sophisticated background of their owners and personnel also entice them to operate
formally and legally. Many of them adopt modern organisation forms and management
information systems. The previous OECD Survey documented that institutional and
governance weaknesses at national level might have more discouraging impacts on this
type of firms than on the others (OECD, 2016[4]). Recent information points to a similar
effect on the international venture capital investors that envisage to invest in them (Clark,
2017[31]).
Some available evidence on the investment drivers and constraints of these firms includes:
The youngest firms achieve the strongest investment growth rates.
As they mature, these firms build up considerable amounts of debt (Figure 18), and,
beyond age 3-4, they become more dependent on internal cash-flows to continue to
finance investments.
For small firms and firms in high-technology activities, size does not seem to be a
constraint on the capacity to undertake R&D expenditures. The relation between
size and engagement in R&D activities is even negative in most parts of the
business sector.
The cash-poor sophisticated start-ups may be facing stronger financial constraints
in Anatolian Tiger towns. There is a positive association between internal cash
flows and the probability of initiating R&D projects in Anatolian Tiger towns,
which is inverted in Western regions. Western high-technology firms may be able
to engage in longer-term innovation projects, and may be able to fund them with
external resources on a longer period.
OECD countries’ general experience with government support schemes for start-ups
suggest that a good balance between “tax” and “equity” support measures is helpful
(Calvino, Criscuolo and Menon, 2016[32]). Innovative support instruments such as
“technological prizes” can also help direct public incentives to targeted technological areas,
while maintaining competition between firms and supporting many of them at once
(Brynjolfsson and McAfee, 2015[33]). Still, additional private resources (equity and bridge
finance) become necessary as they grow.
Diversifying and strengthening the financing of investment
In Turkey, own capital and retained earnings have traditionally been the main sources of
funding for investment. Going forward, financial deepening will help sustain and improve
business investment. The financial system has been growing significantly faster than GDP
since 2008, but 90% of the system's total assets are held by banks. Other financial
intermediaries such as insurance and pension funds are relatively underdeveloped and
associated capital market funding benefits only few companies. Access to new equity
capital is even more restricted. Stock market capitalisation is low and private equity still
scarce.
The extension of the treasury-backed credit guarantee scheme in early 2017 (Box 5) has
reinforced bank dominance and led to an additional increase in bank loans over 2017 -
albeit mostly in the form of medium-term loans (average maturity of 40 months) to support
working capital. Only 2.8% of the loans provided under the guarantee scheme in 2017 were

38 │ ECO/WKP(2019)1
UPGRADING BUSINESS INVESTMENT IN TURKEY Unclassified
investment loans (KGF, 2018[34]) although other loans, not classified as investment loans,
may also have been used for to finance investment projects.
Congruently, banks' NPL ratios have decreased and the overall quality of bank assets
improved. Current capital adequacy ratios of Turkish banks are in line with a smooth
transition to Basel III requirements. Nonetheless, available capital buffers also reflect the
sensitivity of capital ratios to exchange rate depreciation as the share of foreign currency
assets exceeds the share of foreign currency debt. On the back of healthy and well-
regulated banks, loan maturity (Figure 21, Panels A and B) and the share of investment
loans (Panel C) have increased over the past decade, mainly through loans provided by
deposit banks (Panel D). In addition, internationalised firms can turn directly towards banks
residing abroad. While interest rate conditions are more favourable for these dollar- and
euro-denominated loans, the recent pressure on the exchange rate has led to a sharp decline
in cross-border loans.
Figure 21. Bank loans have supported investment
1. Medium-long term loans are loans with a maturity of more than one year.
Source: Banking Regulation and Supervision Agency (BDDK).
StatLink 2 https://doi.org/10.1787/888933799568
0
10
20
30
40
50
60
70
80
90
100
2003
2004
2005
2006
2007
2008
2009
2010
2011
2012
2013
2014
2015
2016
2017
2018
%
A. Share of medium-long term loans by currency ¹
National currency Foreign currency Total
0
10
20
30
40
50
60
70
80
90
2003
2004
2005
2006
2007
2008
2009
2010
2011
2012
2013
2014
2015
2016
2017
2018
%
B. Share of medium-long term loans by bank type ¹
Deposit
Development and investment
Participation
0
5
10
15
20
25
2003
2004
2005
2006
2007
2008
2009
2010
2011
2012
2013
2014
2015
2016
2017
2018
%
C. Share of investment loans by currency
National currency Foreign currency Total
0
5
10
15
20
25
2003
2004
2005
2006
2007
2008
2009
2010
2011
2012
2013
2014
2015
2016
2017
2018
%
D. Share of investment loans by bank type
Deposit
Development and investment
Participation

ECO/WKP(2019)1 │ 39
UPGRADING BUSINESS INVESTMENT IN TURKEY Unclassified
The loan-share of private domestic banks has fallen from more than 70% in 2005 to around
35% in early 2018. The share of foreign banks has experienced the strongest increase
between 2005 and 2008, partly driven by a series of local bank acquisitions by foreign
banks, when it more than quadrupled from 5% to above 20%. Apart one major acquisition
in 2015 bringing the share to around 30%, foreign banks' share in total loans has stagnated
thereafter and even declined more recently. Since 2013, state-owned banks have registered
considerably higher loan growth rates than private banks. Their share in total loans has
risen to 38% early 2018 against an average of 28% between 2010 and 2013.
Participation banks, a synonym for non-interest-earning Islamic banks, have
experienced particularly strong growth from 2005 to 2013 but their share in total banking
assets and loans has diminished over the past five years. The authorities currently seek to
help these banks to contribute more actively to the funding of the business sector in general
and business investment in particular. A strategy document is being prepared to provide
this sector with a more complete regulatory framework which could spur access to finance
of firms that are out of reach of traditional bank lending activities and may search for more
risk sharing forms of external finance.
Box 5. The treasury-backed credit guarantee fund (KGF)
The credit guarantee fund has been created in 1993 to provide access to bank
financing for SMEs with insufficient collateral. Historically, the scope of the
scheme was rather modest with a volume below 0.5% of GDP. In a response to
the loss of the Turkish government’s investment grade sovereign borrower status,
which has affected banks’ capital adequacy and lending capacity in 2016, and
risks of credit rationing, the government decided to extend the scheme
substantially as of March 2017. Maximum guarantees for all types of enterprises
were raised, the guarantee commission fee substantially lowered and the limit of
the fund increased from TL 20 billion to TL 250 billion (8% of 2017 GDP).
While the extension was meant to be temporary, there is a general understanding
that redemptions will be allowed to be reallocated.
The credit guarantee scheme helps overcome the lack of collateral and also gives
incentives for firms to go fully formal. Indeed, to be eligible, a firm must pay
taxes and social security contributions and is not permitted to have any tax and
social security contribution arrears. Additionally, the firm must not be in the
process of bankruptcy or termination.
Following the extension of the scheme, the number of SMEs requesting a KGF
guarantee soared, from 30 000 in 2016 to more than 320 000 in 2017, with the
total approved loan amount rising from less than TL 10 billion to around TL 265
billion (around 90% of which are guaranteed by the KGF) thereby giving
110 000 new SMEs access to bank-financing. Investment loans accounted for
only 2.8% of guaranteed loans in 2017, well below the average share in total
loans (Figure 15, Panel C), but other loans, not classified as investment loans,
may have also been used to finance investment projects. As a result, the
relaxation of the financial constraints of both borrowing firms and banks after
the implementation of this measure appears to have facilitated the recovery of
business investment from the second half of 2017. In addition, following a

40 │ ECO/WKP(2019)1
UPGRADING BUSINESS INVESTMENT IN TURKEY Unclassified
decision in February 2018, a third of the available TL 55 billion of unused and
already returned guarantees shall be reserved for capital investment loans. In
May 2018, TL 35 billion of guarantees, mainly from redemptions, were re-
introduced, TL 30 billion of which will be reserved for working capital loans and
the rest for exporters.
Market participants estimate that the KGF extension, as a positive credit supply
shock, has added between 1 and 1½ percentage points to 2017 real GDP growth
in Turkey and improved bank profitability via lower provisioning (IMF, 2018[2];
Morgan Stanley, 2017[35]). The scheme guarantees loans so long as the bank's
NPL ratio of KGF-guaranteed loans does not exceed 7%, which caps the
contingent liabilities of the Treasury. By early 2018, the banking sector's NPL
ratio had declined below 3%. It needs to be seen whether the maturation of KGF-
backed loans challenges this resilience.
Turkey’s credit guarantee system is currently the OECD’s largest as a share of
GDP and it is advisable to undertake a careful analysis of its costs and benefits.
Certain OECD countries have put in place effective evaluation systems in this
area, including rigorous measurements of counterfactuals. Turkey can draw on
this experience, including with a view to normalise the total size of its credit
guarantee system along OECD good practices. A pre-announced schedule would
facilitate its implementation (OECD, 2017[36]).
Recent bank lending surveys suggest that credit demand has been fuelled by the need for
working capital and debt restructuring, while the demand for loans financing capital
expenditures in fixed assets has declined further. Credit instruments remain primarily
confined to short and medium-term loans that are not suitable for the financing of long-
term fixed investments. The main reasons behind this maturity mismatch lie in high and
uncertain inflation prospects, high and rising loan-to-deposit ratios and a lack of
transparency among firms leading to information asymmetries and high monitoring risks.
Risks are lower for firms subject to compulsory external auditing with IFRS standards, that
is, firms with more than 200 employees as well as listed firms.
The government has introduced a number of targeted investment credits via its Small and
Medium Sized Enterprises Agency (KOSGEB) to help overcome bottlenecks in access to
finance. Banks sign agreements with KOSGEB, which takes on part of the interest
payments for the respective SME loans. Between 2003 and 2017 more than 500 000 SMEs
have benefitted from KOSGEB investment credits, which has created a volume of TRY 20
billion of loans. KOSGEB offered a new wave of interest-free credits and allocated a budget
for around 460 000 SMEs towards the end of 2016 which helped to lean against the adverse
economic effects of the failed coup attempt in 2016. The European Commission
Programme for the Competitiveness of Enterprises and SMEs (COSME) will also provide
loan guarantees to over 37 000 Turkish small businesses up to TRY 750 million (around
EUR 150 million) – in addition to the treasury-backed credit guarantee scheme described
in Box 5.
The authorities have also explored other avenues to improve the business sector's access to
finance and to make better use of existing assets. First, absorbing at least part of the
country's massive "under-the-pillow" gold savings in the mainstream financial system
would buttress financial assets and help provide collateral. Since 2011, the central bank has
allowed banks to hold an increasing amount of required reserves in the form of gold. As of

ECO/WKP(2019)1 │ 41
UPGRADING BUSINESS INVESTMENT IN TURKEY Unclassified
October 2016, the central bank also started to accept scrap gold collected by banks under
the Reserve Options Mechanism (ROM) facility to incorporate “under-the-pillow” gold
into the financial system. Additionally, the Treasury has recently issued gold-backed debt
securities. Second, the recent creation of a sovereign wealth fund not only aims at financing
strategic infrastructure investments but also at collateralising the country's strategic assets
and, directly or indirectly, easing domestic firms' access to funding notably from abroad
(Box 6).
Box 6. The sovereign wealth fund
The "Turkey Wealth Fund" (TWF), was established in late 2016 with the aim to
strengthen the development of the economy. It is not yet fully operational but its
declared objective is to develop and increase the value of the country’s strategic
assets and to provide resources for strategic investments. The fund will focus on
fostering capital market deepening, attracting foreign funds and providing
financing for large-scale strategic investments.
To this end, the TWF is expected to engage in two types of activities. First,
backed by the collateral on its balance sheet (which includes state-owned
enterprises’ equity shares and government real estate, which reportedly raised
TWF’s asset value at TRY 250 billion in 2017 – or 8% of GDP), the TWF will
engage in long-term borrowing from international capital markets with the
purpose of lending to domestic firms at lower costs. Its articles of association
also permit it to participate in domestic firms' direct borrowing from abroad by
providing collateral and guarantees.
Its founding law exempts TWF and its affiliated funds from a number of laws,
notably from the Law on the Protection of Competition. This may reduce
competition in the markets where TWF intervenes.
In the future development of the Fund Turkey should build on OECD’s
“Guidance on Sovereign Wealth Funds” (OECD, 2008[37]). This guidance
contains principles and safeguards to help countries developing such funds, as
well as those receiving their investments, to facilitate their operation in a
transparent, open and commercially-oriented environment.
Non-bank avenues of financial intermediation remain nonetheless underdeveloped.
Institutional investors are smaller than in other catching-up countries and pension funds
have only 12% of their portfolio invested in domestic equities - a lower share than in other
catching-up OECD countries (OECD, 2017[38]). As a result, stock market capitalisation as
a share of GDP is very low in international comparison. Access to outside equity capital
through the market is mostly confined to large companies listed at the Istanbul Stock
Exchange (around 400 firms, including financial companies), which operates a rather
efficient trading system as reflected in high stock market turnover ratios. Similarly, the
domestic private debt securities markets are underdeveloped (so far, around 700 firms,
mainly in the financial sector, have issued commercial paper and corporate bonds).
The deepening of both equity and debt markets has become crucial for widening financing
sources for long-term investment projects. The OECD has recently emphasised that this
requires, more than a few “silver bullet” measures, the development of a multi-dimensional
eco-system with a range of investment instruments, issuers, investors, expert professionals,

42 │ ECO/WKP(2019)1
UPGRADING BUSINESS INVESTMENT IN TURKEY Unclassified
exchange platforms and tax rules and trading regulations (Box 7). The Turkish authorities
have already taken an important tax measure in this direction, by eliminating the debt-
equity bias in corporate taxation in 2015 via full tax allowances for equity remuneration
costs (Spengel et al., 2016[39]).
Private equity investment, including venture, growth and angel capital participation by
domestic and international investors in Turkish business enterprises is another avenue of
non-debt and non-bank financing. This is less demanding than the issuance of market
securities in terms of an ecosystem, but requires highly sophisticated investors, who are
rare. According to one source, Turkey became, together with Poland, one of the two most
dynamic countries in venture and angel capital investing in Europe in 2017 - even though
the total volume of investments is still very low (Start-up Watch, 2018). Venture capital
placements in Turkey grew in the aftermath of the global financial crisis (OECD, 2018[40]).
Venture capital and business angel investments may be compatible with non-interest
earning participation investments (Islamic finance) (OECD, 2014[3]). The ongoing draft law
on participation finance will possibly include provisions in this area.
Box 7. Building up an ecosystem for equity investing in small firms
Public equity markets for small companies need to be supported by a healthy
ecosystem. The latter is currently undersized in Turkey and requires more fully
engaged investment banks, SME-specialised banks, research analysts, brokers,
market makers, and other third-party advisors focused on SMEs (Figure 19).
Legal and financial advisors, accountants and other professionals providing
services targeted to SMEs benefit issuing companies and investors by enhancing
transparency and confidence. Such ecosystems need to be developed at both local
and national levels.
The ecosystems for SMEs are generally not wide-ranging enough in other OECD
countries either, impeding the functioning and deepening of equity markets and
reducing companies’ willingness to list altogether (Nassr and Wehinger,
2016[41]). On the basis of related OECD research and other countries’
experiences, the following elements deserve particular attention in the Turkish
context:
The absence of equity research by financial analysts on small and
mid-sized firms reduces their visibility and attractiveness among
investors. International research underlines the benefits of attracting
foreign analysts, notably by promoting common accounting practices
(Bae, Tan and Welker, 2008[42]). Equity research assists investors in
making informed investment choices, providing an evaluation of the
attractiveness of an individual stock and of the expected operating
performance of the underlying company. It is of particular importance in
the case of small high-growth firms where information is scarce and
harder to assess.
Equity research coverage of small and mid-sized equities is
hampered by the inherent characteristics of small firms. The small
size of initial public offerings (IPOs) and secondary trades renders equity

ECO/WKP(2019)1 │ 43
UPGRADING BUSINESS INVESTMENT IN TURKEY Unclassified
research for small companies economically challenging. The so-called
“transparency barrier” resulting from the reluctance to share sensitive
information by even the most successful and best managed SMEs in
order to protect their strategic position is another impediment. A large
part of professional investors would reportedly not engage in a trade on
either primary or secondary markets without relevant research being
available.
Tax factors play also an important role in institutional and retail
investors’ portfolio allocations to small companies. Investment-
driven tax reliefs and positive incentives may induce long-term
investment into SMEs. Tax relief is the most commonly cited incentive
by market participants, and examples of such practices have proven to
accelerate the development of SMEs equity markets. In the United
Kingdom for example, tax-advantaged venture capital schemes fuelled
investments in small growing businesses. The French Plan Epargne
Actions (EA-PME) scheme played a similar role. The latest OECD
Economic Survey of Italy advocated the energetic use of tax incentives
to promote equity investments in small firms (OECD, 2017[43]).
Figure 22. A valuable ecosystem for SME equity offerings
Source: Nassr and Wehinger, 2016.

44 │ ECO/WKP(2019)1
UPGRADING BUSINESS INVESTMENT IN TURKEY Unclassified
A three-pronged structural upgrading is in order to strengthen investment
A three-pronged structural upgrading process in the business sector would help to
overcome some of the main obstacles to efficient capital formation, to achieve better
balanced development of physical and knowledge-based investments, and to ease the shift
of capital formation toward the more productive and highest potential areas of the economy.
Turkey is in a position to achieve more rapid progress in three interrelated areas:
Much of the economy’s resources remain in low-productivity informal and semi-formal
activities. Policies can further address this challenge by: i) directly targeting better
knowledge-building and productivity gains within these activities (training and technical
support in small industrial sites (KSSs)), and ii) permit permitting the higher productivity
and higher potential firms of all sizes to invest more and employ a higher share of workers
via regulatory reforms reducing their burdens.
The ongoing digital transitions in the business sector, financial firms and public
administration have the potential to deliver substantial efficiency gains i) within business
firms (operational, managerial and financial information systems), ii) in transactions
between firms and banks and capital markets, and iii) in interactions between firms and tax,
customs and other regulatory authorities. The efficiency of the ever-growing business
incentives can also be improved via digital monitoring of beneficiaries’ behaviour and
outcomes.
Progress on these fronts requires long-term knowledge-based investments and calls for a
reinforcement of the equity capital basis of firms. While access of small informal firms to
bank credit is not yet secured, the analysis in this paper suggests that under high debt
leverage now attained in many high-growth firms, and given the immaterial character of
many of their investments, firm balance sheets must be strengthened with additional equity
capital. Raising additional equity from public markets and private equity investors is
compelling.
There are important synergies between these three areas: i) formal and more professionally
managed businesses can produce more operational, managerial and financial information,
reaping the related productivity gains; ii) progress with digitalisation facilitates internal and
external (operational, managerial and financial) transparency, easing communication with
financial market partners, regulators and tax administrators; iii) internal and external
transparency reduce information asymmetries and facilitate additional equity financing
from owner families, public securities markets and private investors.
The continuing integration of Turkish firms in GVCs, in practice often with EU business
partners, holds additional promises of accelerating managerial modernisation and
digitalisation, transparency, and equity absorption capacity. The updating and extension of
the Customs Union agreement between the EU and Turkey along the most advanced
customs union best practices would support this three-pronged process.
Several recent policy initiatives seek to upgrade the investment financing environment.
Shortcomings in this environment have become more binding as a growing share of firms
piled on debt and reached credit limits. New government initiatives include the massive
extension of credit guarantees and several streams of low-interest loan and grant schemes
for SMEs and start-ups. Government-owned banks’ lending activities were also expanded,
including in the first two quarters of 2018, and the newly created Sovereign Wealth Fund
will purportedly support long-term and large-size investment projects and improve
domestic firms' access to finance (Box 6).

ECO/WKP(2019)1 │ 45
UPGRADING BUSINESS INVESTMENT IN TURKEY Unclassified
These initiatives ought to be geared towards supporting the mainstream competitive
market-based financing channels of the economy. Given their very rapid build-up there
may be a risk for their turning into alternatives rather than complements to these
mainstream financing channels. This risk invites well-calibrated policies to avoid
competitive distortions and crowding-out. Robustly regulated private financial
intermediaries competing on a level-playing ground should be encouraged to extend long-
term funds (in the form of equity, credits and other risk-sharing instruments) to formal firms
with strong corporate governance and financial transparency standards. Turkey’s new
business finance measures could be actively used in this direction.
A stable and robust macroeconomic and financial framework may deliver sharper
reductions in capital costs and stimulate more vigorous investments, capital reallocation
and structural upgrading in the composition of investments than direct subsidies through
government-led concessional financing. The OECD policy recommendations based on this
paper’s analysis are summarised in Box 8 below.
Box 8. Policy recommendations
Key recommendations
To reduce the funding costs of the economy improve the international credibility
of governance institutions, fiscal transparency and price stability.
Carry out a strategic review to identify and address the most binding constraints
to the development of the currently weak ecosystem for equity financing of
investment.
Encourage family firms through technical support and awareness campaigns to
develop standard corporate governance, professional management and financial
transparency.
Evaluate the uptake of the various recent social security contribution cuts granted
and make permanent those which have proven most supportive of formalisation,
financing this through better tax enforcement.
Enforce the compulsory auditing rules of the new Company Law. Reduce audit
costs - while maintaining audit quality standards- via tax incentives in the early
years of audited financial reporting.
Streamline the various R&D incentives schemes on the basis of cost-benefit
analyses, and build on international best practices to improve take-up and
efficiency of tax subsidies and grants.
Streamline and stabilise business incentives. Report them according to state aid
law, subject them to competition review, and monitor their impact on beneficiary
firms’ behaviour using the new Enterprise Information System (EIS).
Undertake a cost-benefit analysis of the credit guarantee system and normalise
its size, tighten the macroprudential rules and contain the quasi-fiscal activities
of public financial institutions.

46 │ ECO/WKP(2019)1
UPGRADING BUSINESS INVESTMENT IN TURKEY Unclassified
Other recommendations
Promote standard accounting and financial bookkeeping in firms of all sizes.
Support this by promoting the diffusion of low cost and user-friendly digital
management applications.
Improve the quality and coverage of firm-level credit information and credit
rating systems.
Encourage and publicise good quality private equity analyses.
Monitor and evaluate the efficiency of the many incentives for high-technology
start-ups. Monitor firm-level outcomes using the Enterprise Information System
(EIS).

ECO/WKP(2019)1 │ 47
UPGRADING BUSINESS INVESTMENT IN TURKEY Unclassified
Annex 1.A. Modelling investment
The steady-state
The capital stock accumulates as a result of net investments (�̇�) originating from a fraction
of output that is saved (𝑠𝑌) minus the depreciation of existing capital (𝛿𝐾):
�̇� = 𝑠𝑌 − 𝛿𝐾 (1)
Assuming a standard Cobb-Douglas production function Y=Kα(AL)1-α with L the labour
force (growing with l) and A a measure of labour efficiency (growing with g), the capital
output ratio can be shown to converge to a steady-state level given by:
𝐾
𝑌=
𝑠
𝑔 + 𝑙 + 𝛿 (2)
In the steady-state, output and capital grow at the same rate g+l. Changes to the saving rate
only affect the levels of the capital stock and output but not their long-term growth rates.
The accelerator principle
Assuming a fixed capital-output ratio σ, a firm's "desired" capital stock is proportional to
output (𝐾∗ = 𝜎𝑌) which means that the growth of capital equals the growth rate of output.
To reflect the notion of expected output change that determines the desired capital stock
and to avoid endogeneity, forecasts from the OECD's Economic Outlook are used to
represent simultaneous growth rates of real GDP.
Tobin's Q
To the extent that the market value of a firm reflects the discounted value of future earnings,
a firm's manager has an incentive to increase the capital stock so long as the firm's market
value exceeds the replacement costs of the firm's capital. The ratio between firm valuation
and capital replacement costs is called Tobin's Q. In the absence of countries' net worth
(measuring the replacement costs of the country's capital stock), and building on stable
steady-state capital output ratios, economists commonly use the country's stock market
capitalisation as a share of GDP as a proxy for Tobin's Q.
User cost of capital
The neoclassical theory posits that the marginal expected return on capital is equal to the
real user costs of capital. The user of cost (UCC) of capital is a function of the real interest
(r), the depreciation rate of installed capital (𝛿), the price of investment goods relative to
the price of output, the corporate income tax (𝜏) and the allowance rate on capital
expenditures (𝜃).
𝑈𝐶𝐶𝑡 =𝑃𝑡
𝐼
𝑃𝑡𝑌 (
𝑟 + 𝛿
1 − 𝜏) (1 − 𝜃𝜏) (3)
Tax allowances typically depend on the type of investment, the size of the firm and on
whether a firm runs profits. For the sake of simplicity, and due to a lake of sufficient and
comparable data across time and countries, the econometric specification abstracts away
from tax allowances and sets 𝜃 = 0.
Convergence to steady-state

48 │ ECO/WKP(2019)1
UPGRADING BUSINESS INVESTMENT IN TURKEY Unclassified
Short-run dynamics of investment should also reflect gaps with respect to long-run
equilibria. Consistent with the idea of stable capital-output ratios, the lagged capital-output
ratio is added to the equation inducing a mean-reverting effect. Second, the theoretical
steady-state capital-output ratio from equation (2) is added. The savings rate in (2) is
modelled as the sum of gross investment and the current account balance both expressed
as a share of GDP and smoothed over time.
The econometric specification
As a result, the baseline econometric specification is given by:
𝐼𝑐,𝑡
𝐾𝑐,𝑡−1 = 𝛽0
𝐼𝑐,𝑡−1
𝐾𝑐,𝑡−2 + 𝛽1𝑦𝑐,𝑡 + 𝛽2𝑦𝑐,𝑡−1 + 𝛾𝑄𝑐,𝑡 + 𝜎𝑈𝐶𝐶𝑐,𝑡−1
+𝛼1
𝐾𝑐,𝑡−1
𝑌𝑐,𝑡−1 + 𝛼2
𝐾𝑐,𝑡−1∗
𝑌𝑐,𝑡−1∗
+ 𝛿𝑐 + 𝛿𝑡 + 휀𝑐,𝑡 (4)
The regression includes country-fixed effects (𝛿𝑐) and year-fixed effects (𝛿𝑡). As such, the
model does a good job in dealing with potential omitted variables bias as it can capture
time-invariant structural features inherent to countries as well as global real and financial
cycles. However, the use of standard linear regressions to estimate a dynamic panel induces
a Hurwicz-Nickell bias on the coefficient of the lagged dependent variable. The bias on the
other regressors is limited (Barro, 2015[44]) at least so long as the regressors are uncorrelated
with the lagged dependent variable.
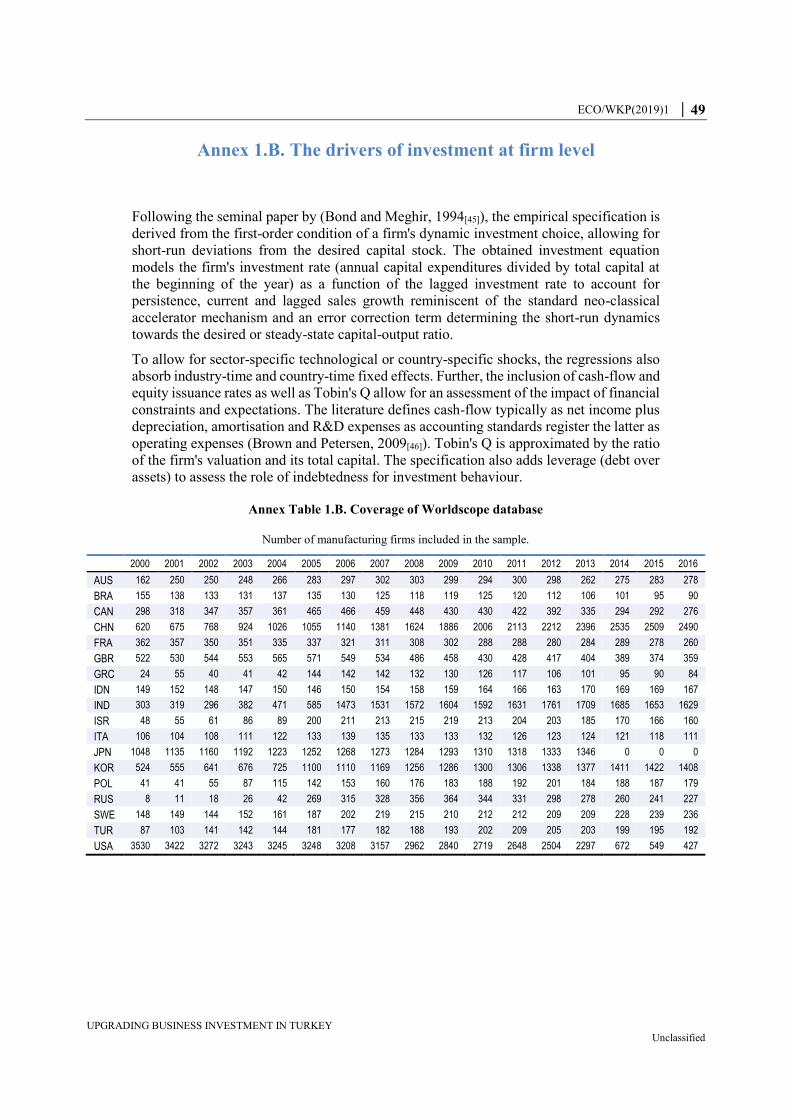
ECO/WKP(2019)1 │ 49
UPGRADING BUSINESS INVESTMENT IN TURKEY Unclassified
Annex 1.B. The drivers of investment at firm level
Following the seminal paper by (Bond and Meghir, 1994[45]), the empirical specification is
derived from the first-order condition of a firm's dynamic investment choice, allowing for
short-run deviations from the desired capital stock. The obtained investment equation
models the firm's investment rate (annual capital expenditures divided by total capital at
the beginning of the year) as a function of the lagged investment rate to account for
persistence, current and lagged sales growth reminiscent of the standard neo-classical
accelerator mechanism and an error correction term determining the short-run dynamics
towards the desired or steady-state capital-output ratio.
To allow for sector-specific technological or country-specific shocks, the regressions also
absorb industry-time and country-time fixed effects. Further, the inclusion of cash-flow and
equity issuance rates as well as Tobin's Q allow for an assessment of the impact of financial
constraints and expectations. The literature defines cash-flow typically as net income plus
depreciation, amortisation and R&D expenses as accounting standards register the latter as
operating expenses (Brown and Petersen, 2009[46]). Tobin's Q is approximated by the ratio
of the firm's valuation and its total capital. The specification also adds leverage (debt over
assets) to assess the role of indebtedness for investment behaviour.
Annex Table 1.B. Coverage of Worldscope database
Number of manufacturing firms included in the sample.
2000 2001 2002 2003 2004 2005 2006 2007 2008 2009 2010 2011 2012 2013 2014 2015 2016
AUS 162 250 250 248 266 283 297 302 303 299 294 300 298 262 275 283 278
BRA 155 138 133 131 137 135 130 125 118 119 125 120 112 106 101 95 90
CAN 298 318 347 357 361 465 466 459 448 430 430 422 392 335 294 292 276
CHN 620 675 768 924 1026 1055 1140 1381 1624 1886 2006 2113 2212 2396 2535 2509 2490
FRA 362 357 350 351 335 337 321 311 308 302 288 288 280 284 289 278 260
GBR 522 530 544 553 565 571 549 534 486 458 430 428 417 404 389 374 359
GRC 24 55 40 41 42 144 142 142 132 130 126 117 106 101 95 90 84
IDN 149 152 148 147 150 146 150 154 158 159 164 166 163 170 169 169 167
IND 303 319 296 382 471 585 1473 1531 1572 1604 1592 1631 1761 1709 1685 1653 1629
ISR 48 55 61 86 89 200 211 213 215 219 213 204 203 185 170 166 160
ITA 106 104 108 111 122 133 139 135 133 133 132 126 123 124 121 118 111
JPN 1048 1135 1160 1192 1223 1252 1268 1273 1284 1293 1310 1318 1333 1346 0 0 0
KOR 524 555 641 676 725 1100 1110 1169 1256 1286 1300 1306 1338 1377 1411 1422 1408
POL 41 41 55 87 115 142 153 160 176 183 188 192 201 184 188 187 179
RUS 8 11 18 26 42 269 315 328 356 364 344 331 298 278 260 241 227
SWE 148 149 144 152 161 187 202 219 215 210 212 212 209 209 228 239 236
TUR 87 103 141 142 144 181 177 182 188 193 202 209 205 203 199 195 192
USA 3530 3422 3272 3243 3245 3248 3208 3157 2962 2840 2719 2648 2504 2297 672 549 427

50 │ ECO/WKP(2019)1
UPGRADING BUSINESS INVESTMENT IN TURKEY Unclassified
References
Andrews, D., C. Criscuolo and P. Gal (2015), “Frontier Firms, Technology Diffusion and Public
Policy: Micro Evidence from OECD Countries”, The Future of Productivity: Main
Background Papers, OECD, https://www.oecd.org/eco/growth/Frontier-Firms-Technology-
Diffusion-and-Public-Policy-Micro-Evidence-from-OECD-Countries.pdf.
[29]
Atabek, A. (2018), Catch-Up in the Turkish Manufacturing Industry: The Role of National and
Regional Frontiers, https://tcmbblog.org/en/catch-up-in-the-turkish-manufacturing-industry-
the-role-of-national-and-regional-frontiers/.
[17]
Atiyas, I. and O. Bakis (2018), Sıçrama Yapan Şirketler, Sabancı Üniversitesi - TÜSİAD
Rekabet Forumu, http://tusiad.org/tr/tum/item/9977-sabanci-universitesi-tusiad-rekabet-
forumu-sicrama-yapan-sirketler-raporunu-kamuoyuyla-paylasti.
[18]
Bae, K., H. Tan and M. Welker (2008), “International GAAP Differences: The Impact on
Foreign Analysts”, The Accounting Review, Vol. 83/3, pp. 593-628,
http://dx.doi.org/10.2308/accr.2008.83.3.593.
[42]
Barro, R. (2015), “Convergence and Modernisation”, The Economic Journal, Vol. 125/585,
pp. 911-942, http://dx.doi.org/10.1111/ecoj.12247.
[44]
Bigan, I., S. Decan and B. Korkmaz (2017), How Turkish companies can become global
successes, McKinsey&Company.
[27]
Bloom, N. and J. Van Reenen (2010), “Why Do Management Practices Differ across Firms and
Countries?”, Journal of Economic Perspectives—Volume, Vol. 24/1—Winter, pp. 203-224.
[25]
Bond, S. and C. Meghir (1994), “Dynamic Investment Models and the Firm's Financial Policy”,
The Review of Economic Studies, Vol. 61/2, pp. 197-222, http://dx.doi.org/10.2307/2297978.
[45]
Brown, J., S. Fazzari and B. Petersen (2009), “Financing Innovation and Growth: Cash Flow,
External Equity, and the 1990s R&D Boom”, The Journal of Finance, Vol. 64/1,
pp. 151-185, http://dx.doi.org/10.1111/j.1540-6261.2008.01431.x.
[10]
Brown, J. and B. Petersen (2009), “Why has the investment-cash flow sensitivity declined so
sharply? Rising R&D and equity market developments”, Journal of Banking & Finance,
Vol. 33/5, pp. 971-984, http://dx.doi.org/10.1016/J.JBANKFIN.2008.10.009.
[46]
Brynjolfsson, E. and A. McAfee (2015), The second machine age : work, progress, and
prosperity in a time of brilliant technologies.
[33]
Brys, B. et al. (2016), “Tax Design for Inclusive Economic Growth”, OECD Taxation Working
Papers, No. 26, OECD Publishing, Paris, http://dx.doi.org/10.1787/5jlv74ggk0g7-en.
[7]
Burkart, M., F. Panunzi and A. Shleifer (2003), “Family Firms”, The Journal of Finance,
Vol. 58/5, pp. 2167-2201, http://dx.doi.org/10.1111/1540-6261.00601.
[8]

ECO/WKP(2019)1 │ 51
UPGRADING BUSINESS INVESTMENT IN TURKEY Unclassified
Çağlar, E. and E. Koyuncu (2018), Toplam Faktör Verimliliği Politika Çerçevesi Geliştirilmesi
için Teknik Destek Projesi Sentez Raporu, Üçüncu Revizyon, UNDP.
[1]
Calvino, F., C. Criscuolo and C. Menon (2016), “No Country for Young Firms?: Start-up
Dynamics and National Policies”, OECD Science, Technology and Industry Policy Papers,
No. 29, OECD Publishing, Paris, http://dx.doi.org/10.1787/5jm22p40c8mw-en.
[32]
Clark, L. (2017), The hottest Istanbul startups in 2017, WIRED UK. [31]
Cravo, T. and C. Piza (2016), “The Impact of Business Support Services for Small and Medium
Enterprises on Firm Performance in Low- and Middle-Income Countries A Meta-Analysis”,
Policy Research Working Paper, No. 7664, World Bank Group Development Research
Group, http://documents.worldbank.org/curated/en/521211467989461591/pdf/WPS7664.pdf.
[22]
Gezici, A., Ö. Orhangazi and C. Yalçın (2018), “R&D activity and financing constraints:
Evidence from Turkey”, Panoeconomicus 00, http://dx.doi.org/10.2298/PAN170420011G.
[11]
Hampel-Milagrosa, A. and C. Reeg (2016), Micro, small and medium enterprises as drivers for
job creation and decent work, United Nations Department of Economic and Social Affairs ,
Bangkok, http://www.un.org/esa/socdev/egms/docs/2016/AimeeHampel-
MilagrosaandCarolineReeg.pdf.
[21]
IMF (2018), Turkey:2018 Article IV Consultations, IMF Country Report No. 18/110. [2]
Johansson, Å. et al. (2008), “Taxation and Economic Growth”, OECD Economics Department
Working Papers, No. 620, OECD Publishing, Paris, http://dx.doi.org/10.1787/241216205486.
[6]
KGF (2018), “2017 Activity Report”, Kredi Garanti Fonu. [34]
McKinsey Global Institute (2003), Turkey: Making the Productivity and Growth Breakthrough,
https://www.mckinsey.com/~/media/McKinsey/Global%20Themes/Europe/Turkey%20makin
g%20the%20productivity%20and%20growth%20breakthrough/MGI_Turkey_Productivity_a
nd_Growth_Breakthrough.ashx.
[26]
Ministry of Science Industry and Technology (2015), Verimlilik Stratejisi ve Eylem Planı (2015-
2018).
[23]
Morgan Stanley (2017), “Turkey Banks and Macro: Don't fear the fund; more to go.”. [35]
Nassr, I. and G. Wehinger (2016), “Opportunities and limitations of public equity markets for
SMEs”, OECD Journal: Financial Market Trends, Vol. 2015/1, https://www.oecd-
ilibrary.org/docserver/fmt-2015-
5jrs051fvnjk.pdf?expires=1525360942&id=id&accname=ocid84004878&checksum=C9F380
AA2E491F891D89301CFF261476.
[41]
Nicoletti, G., D. Andrews and C. Timiliotis (2018), “Going digital: What determines technology
diffusion among firms?, Working Party No. 1 on Macroeconomic and Structural Policy
Analysis 22-23 March 2018, OECD Conference Centre”.
[13]

52 │ ECO/WKP(2019)1
UPGRADING BUSINESS INVESTMENT IN TURKEY Unclassified
OECD (2018), Financing SMEs and Entrepreneurs 2018: An OECD Scoreboard, OECD
Publishing, Paris, http://dx.doi.org/10.1787/fin_sme_ent-2018-en.
[40]
OECD (2018), OECD Economic Surveys: Turkey 2018, OECD Publishing, Paris,
http://dx.doi.org/10.1787/eco_surveys-tur-2018-en.
[9]
OECD (2018), OECD Strategic Approach to Combating Corruption and Promoting Integrity. [16]
OECD (2017), Evaluating Publicly Supported Credit Guarantee Programmes for SMEs,
https://www.oecd.org/finance/Evaluating-Publicly-Supported-Credit-Guarantee-Programmes-
for-SMEs.pdf (accessed on 23 May 2018).
[36]
OECD (2017), Going Digital: Making the Transformation Work for Growth and Well-Being,
Meeting of the OECD Council at Ministerial Level.,
https://www.oecd.org/mcm/documents/C-MIN-2017-4%20EN.pdf.
[14]
OECD (2017), OECD Business and Finance Outlook 2017, OECD Publishing, Paris,
http://dx.doi.org/10.1787/9789264274891-en.
[15]
OECD (2017), OECD Economic Surveys: Italy 2017, OECD Publishing. [43]
OECD (2017), OECD Science, Technology and Industry Scoreboard 2017: The digital
transformation, OECD Publishing, Paris, http://dx.doi.org/10.1787/9789264268821-en.
[12]
OECD (2017), Pension Markets in Focus, http://www.oecd.org/finance/lti.. [38]
OECD (2016), OECD Economic Surveys: Turkey 2016, OECD Publishing, Paris,
http://dx.doi.org/10.1787/eco_surveys-tur-2016-en.
[4]
OECD (2014), OECD Economic Surveys: Turkey 2014, OECD Publishing, Paris,
http://dx.doi.org/10.1787/eco_surveys-tur-2014-en.
[3]
OECD (2013), Science, Technology and Industry Scoreboard 2013 Innovation for Growth. [30]
OECD (2008), OECD Guidance on Sovereign Wealth Funds,
http://www.oecd.org/daf/inv/investment-policy/oecdguidanceonsovereignwealthfunds.htm.
[37]
Spengel, C. et al. (2015), “Effective tax levels using the Devereux/Griffith methodology. Project
for the EU Commission TAXUD/2013/CC/120: Intermediate report 2015”,
https://www.econstor.eu/handle/10419/162729 (accessed on 28 March 2018).
[5]
Spengel, C. et al. (2016), “The effects of tax reforms to address the debt-equity bias on the cost
of capital and on effective tax rates”, https://www.econstor.eu/handle/10419/148156
(accessed on 17 April 2018).
[39]
Taymaz, E. (2016), Estimation of Total Factor Productivity Growth in Turkish Manufacturing,
Total Factor Productivity Project, Background Paper,
https://www.google.fr/_/chrome/newtab?espv=2&ie=UTF-8.
[20]

ECO/WKP(2019)1 │ 53
UPGRADING BUSINESS INVESTMENT IN TURKEY Unclassified
Taymaz, E. (2016), Research on productivity dynamics in Turkish manufacturing industries,
Total Factor Productivity Project, Background Paper,
https://www.google.fr/_/chrome/newtab?espv=2&ie=UTF-8.
[19]
TKYD (2017), Kurumsal Yonetim Dergisi 35,
http://www.tkyd.org/files/downloads/faaliyet_alanlari/yayinlarimiz/kurumsal_yonetim_dergis
i/TKYD_Dergi_Sayi35.pdf.
[24]
Ünlü, M. (2017), “2018'de en yüksek halka arz gerçekleşebilir”,
http://www.hurriyet.com.tr/ekonomi/2018de-en-yuksek-halka-arz-gerceklesebilir-40658500.
[28]