Embed Size (px)
Citation preview

Investment Grade Analysis Report San Luis Obispo Water Reclamation Facility
March 2013
Presented by Presented to

Executive Summary
Page 2 of 79
Investment Grade Analysis Report, Confidential, 3/19/2013
Table of Contents
1.0 Executive Summary ............................................................................... 4
1.1 IGA Project Goals ..................................................................................... 4
1.2 Summary of IGA Findings ......................................................................... 4
1.3 Recommended Improvement Measures ................................................... 4
1.4 Key Project Benefits .................................................................................. 5
1.5 Financial Summary ................................................................................... 6
1.6 Next Steps ................................................................................................. 7
2.0 Approach to Investment Grade Analysis ............................................. 8
2.1 Methodology .............................................................................................. 8
2.2 Process Overview ..................................................................................... 8
2.3 How / Who / Time Frame .......................................................................... 8
2.4 Thank You ................................................................................................. 9
3.0 Utility Analysis ...................................................................................... 10
3.1 Overview ................................................................................................. 10
3.1.1 Electric Usage ......................................................................................... 10
3.1.2 Gas Usage .............................................................................................. 17
3.1.3 Energy Use Benchmarks ........................................................................ 17
4.0 Energy Allocation Analysis ................................................................. 19
4.1 Overview ................................................................................................. 19
4.2 Electrical Annual End-Use Reconciliation ............................................... 19
5.0 Facility Improvment Measures ............................................................ 21
5.1 Introduction ............................................................................................. 21
5.2 Evaluation of Results and Presentation of Findings ................................ 21
5.3 IGA Findings and Recommendations ...................................................... 22
WRF-1 – Cogeneration System Upgrade ............................................................... 22
WRF-2 – Upgrade Headworks ............................................................................... 29
WRF-3 – Retrofit Primary Sludge Pumps ............................................................... 36
Executive Summary
Page 3 of 79
Investment Grade Analysis Report, Confidential, 3/19/2013
WRF-4 – Solids De-Watering ................................................................................. 40
WRF-5 – Install RAS Pump VFDs .......................................................................... 46
WRF-6 – Filter Tower Upgrades ............................................................................ 49
WRF-7 – Aeration Tank Air Pressure Reset Controls ............................................ 52
WRF-8 – Outdoor Lighting Upgrades ..................................................................... 53
WRF-9 – Upgrade SCADA Systems ...................................................................... 55
5.4 Measures Investigated But Not Recommended ...................................... 58
WRF-10 – Cooling Tower Upgrades ...................................................................... 58
WRF-11 – Office Indoor Lighting Upgrades ........................................................... 60
WRF-12 – WAS Pumping System Modifications ...... Error! Bookmark not defined.
WRF-13 – Sludge Thickening ................................................................................ 65
6.0 Cost Benefit Analysis ........................................................................... 73
6.1 Financial Overview .................................................................................. 73
7.0 Project Rebates, Grants and Incentives ............................................. 76
7.1 Administering Incentive Programs ........................................................... 76
7.2 PG&E Non-Residential Retrofit Program & Self-Generation Incentive Program (SGIP) ...................................................................................... 76
8.0 Next Steps ............................................................................................. 78
8.1 Project Schedule .................................................................................... 78
9.0 Appendix ............................................................................................... 79
9.1 Measure Design Plans & Specifications .................................................. 79
WRF-1 150kW Cogeneration .........................................................................................
WRF-2 Headworks Upgrades ........................................................................................
WRF 4 Solids Dewatering ..............................................................................................
WRF-6 Filter Tower Upgrades .......................................................................................
WRF-8 Exterior Lighting Upgrades ................................................................................
WRF-9 SCADA System Upgrades ................................................................................
Executive Summary
Page 4 of 79
Investment Grade Analysis Report, Confidential, 3/19/2013
1.0 EXECUTIVE SUMMARY
This report identifies financially viable energy efficiency and operational upgrades that, when implemented, will allow the City of San Luis Obispo to achieve the project goals. Pacific Gas and Electric (PG&E) and AECOM look forward to working in collaboration with the City to deliver a comprehensive and successful Sustainable Solutions Turnkey (SST) project.
1.1 IGA Project Goals
To improve energy efficiency, decrease operating costs, upgrade aging infrastructure and reduce Green House Gas (GHG) emissions, the City engaged (PG&E) and its partner AECOM Engineering to develop this Investment Grade Analysis (IGA) report. The goal of this IGA is the implementation of a turn-key design/build energy efficiency retrofit project at the Water Reclamation Facility (WRF)
The IGA process began in March 2012 with a kickoff meeting facilitated by the City. This meeting included all key project stakeholders: the City Utilities Department staff, PG&E and AECOM. Clear project goals were decided upon at the meeting:
1. Develop an economically viable project that meets all efficiency and operational goals;
2. Upgrade aging and inefficient systems to improve energy and operational efficiency and to avoid future capital costs;
3. Upgrade / replace the existing cogeneration system to utilize available bio-gas and to maximize cost savings;
4. Upgrade existing Supervisory Control And Data Acquisition (SCADA) controls to maximize energy and operational efficiency for the entire facility;
5. Procure the maximum available electricity and natural gas utility incentives.
1.2 Summary of IGA Findings
During the IGA process, the team worked with City staff, reviewed design drawings, system operational data and performed comprehensive site audits to gain a thorough understanding of the various WRF treatment processes. The audits revealed significant efficiency and modernization opportunities along with identification of critically needed upgrades of failing and/or antiquated systems.
1.3 Recommended Improvement Measures
The recommended improvement measures are listed below (and are described in depth in the body of this report):
1. Cogeneration System Upgrade
2. Headworks Replacement
Executive Summary
Page 5 of 79
Investment Grade Analysis Report, Confidential, 3/19/2013
3. Primary Sludge Pumping Control Improvements
4. Solids De-Watering System Upgrades
5. Variable Flow RAS Pumping and Controls Integration
6. Filter Tower Media and Controls Upgrades
7. Exterior Lighting Upgrades
8. Aeration Tank Control Improvements
9. SCADA Systems Upgrade
1.4 Key Project Benefits
Financial Stewardship
These improvement measures will save the City approximately $325,000 per year in today’s dollars ($11,087,492 over the 25 year equipment life) through energy efficiency savings, a reduction of operation and maintenance costs and utilization of all available utility rebates and incentives.
The savings will be used to fund the improvements at historically low financing rates.
Modernization and Process Expansion/Improvement
The identified measures when implemented will put the city further toward achieving its goal of increased plant capacity as identified in the City’s General Plan and WRF Master Plan. It will allow the plant to be ready for future expansion.
Implementation of these measures eliminates the future need for $2,556,000 in budgeted upgrade costs and planned Capital Improvement Projects identified in the WRF Master Plan.
Implementation of these measures results in the replacement and/or upgrade of several critical systems that have reached the end of their useful life.
This combination of measures addresses the long-overdue upgrade of the WRF SCADA system (controls system) allowing for more efficient and reliable overall system operation, monitoring, and control.
Environmental Stewardship
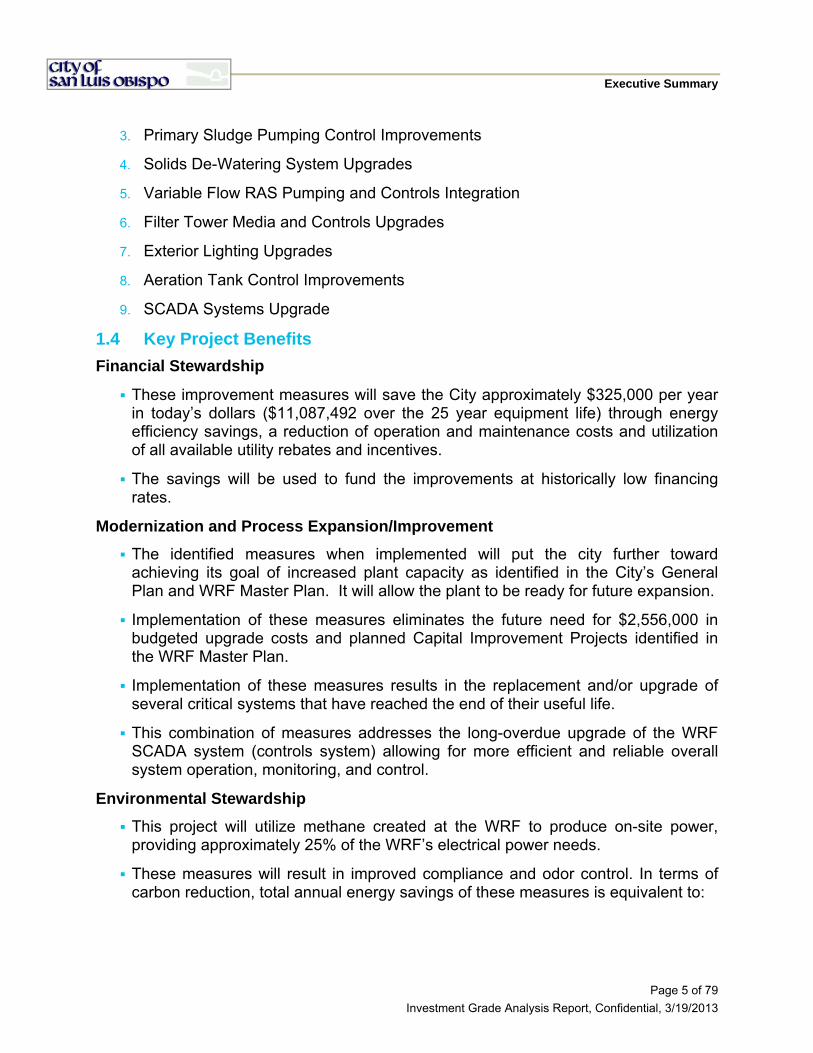
This project will utilize methane created at the WRF to produce on-site power, providing approximately 25% of the WRF’s electrical power needs.
These measures will result in improved compliance and odor control. In terms of carbon reduction, total annual energy savings of these measures is equivalent to:
Executive Summary
Page 6 of 79
Investment Grade Analysis Report, Confidential, 3/19/2013
1.5 Financial Summary
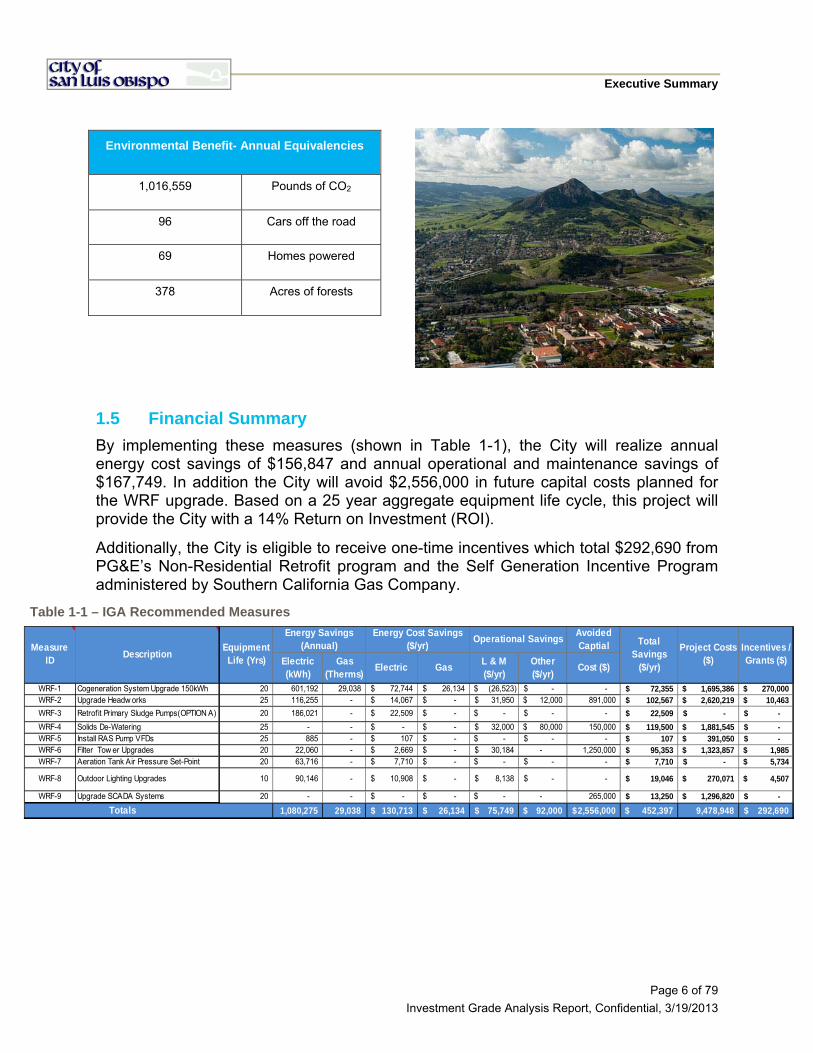
By implementing these measures (shown in Table 1-1), the City will realize annual energy cost savings of $156,847 and annual operational and maintenance savings of $167,749. In addition the City will avoid $2,556,000 in future capital costs planned for the WRF upgrade. Based on a 25 year aggregate equipment life cycle, this project will provide the City with a 14% Return on Investment (ROI).
Additionally, the City is eligible to receive one-time incentives which total $292,690 from PG&E’s Non-Residential Retrofit program and the Self Generation Incentive Program administered by Southern California Gas Company.
Table 1-1 – IGA Recommended Measures
Electric(kWh)
Gas (Therms)
Electric GasL & M ($/yr)
Other ($/yr)
Cost ($)
WRF-1 Cogeneration System Upgrade 150kWh 20 601,192 29,038 72,744$ 26,134$ (26,523)$ -$ - 72,355$ 1,695,386$ 270,000$ WRF-2 Upgrade Headw orks 25 116,255 - 14,067$ -$ 31,950$ 12,000$ 891,000 102,567$ 2,620,219$ 10,463$
WRF-3 Retrofit Primary Sludge Pumps(OPTION A) 20 186,021 - 22,509$ -$ -$ -$ - 22,509$ -$ -$
WRF-4 Solids De-Watering 25 - - -$ -$ 32,000$ 80,000$ 150,000 119,500$ 1,881,545$ -$ WRF-5 Install RAS Pump VFDs 25 885 - 107$ -$ -$ -$ - 107$ 391,050$ -$ WRF-6 Filter Tow er Upgrades 20 22,060 - 2,669$ -$ 30,184$ - 1,250,000 95,353$ 1,323,857$ 1,985$ WRF-7 Aeration Tank Air Pressure Set-Point 20 63,716 - 7,710$ -$ -$ -$ - 7,710$ -$ 5,734$
WRF-8 Outdoor Lighting Upgrades 10 90,146 - 10,908$ -$ 8,138$ -$ - 19,046$ 270,071$ 4,507$
WRF-9 Upgrade SCADA Systems 20 - - -$ -$ -$ - 265,000 13,250$ 1,296,820$ -$
1,080,275 29,038 130,713$ 26,134$ 75,749$ 92,000$ 2,556,000$ 452,397$ 9,478,948 292,690$
Incentives / Grants ($)
Energy Cost Savings ($/yr)
Operational Savings Total Savings
($/yr)
Project Costs ($)
Avoided Captial
Energy Savings (Annual)Equipment
Life (Yrs)
Totals
DescriptionMeasure
ID
Environmental Benefit- Annual Equivalencies
1,016,559 Pounds of CO2
96 Cars off the road
69 Homes powered
378 Acres of forests

Executive Summary
7 of 79
Investment Grade Analysis Report, Confidential, 3/19/2013
1.6 Next Steps
This Investment Grade Analysis identifies energy, operational and infrastructure improvement opportunities that when implemented, as a bundled project, will provide benefits that will significantly contribute to the City meeting its long term operational, infrastructure, and sustainability goals.
We look forward to implementing the presented measures as a turnkey project for the City. The next step forward in this project is to authorize a work order with PG&E. Once the work order is in place, we anticipate a six month period will be needed to complete final design and a ten to twelve month construction period would follow.
Our projects leave the world a better place.
Approach to Investment Grade Analysis
8 of 79
Investment Grade Analysis Report, Confidential, 3/19/2013
2.0 APPROACH TO INVESTMENT GRADE ANALYSIS
2.1 Methodology
The primary purpose of the IGA was to identify financially viable efficiency and operational upgrade projects that meet the City’s specific and unique goals. As the WRF has a variety of large and complex systems, this effort was quite extensive and included field auditing, data collection, interviews with site personnel, energy analysis, and individual measure scope of work and construction cost development. The following sections provide an overview or our approach to developing this IGA.
2.2 Process Overview
The IGA was broken down into eight main phases:
Kickoff Meeting – Established primary goals and general project guidelines.
Utility and Benchmark Analysis – Reviewed energy data to identify general trends and to benchmark SLO facilities against similar facilities.
Field Audit – Performed multiple site visits to investigate / audit all major systems.
System Metering – Installed metering on key systems to establish baseline operating conditions.
Energy and Economic Analysis – developed detailed energy and economic analysis for each measure.
Scope of Work Development – Developed detailed scopes of work based on results of energy and economic analysis and input / guidance from the City.
Developed Design Build Bid Packages – Prepared 50% design drawings, equipment selections, subcontractor bid packages, and other key information to obtain final project pricing.
IGA Presentation – Presented IGA findings to the City.
2.3 How / Who / Time Frame
Facility audits and analyses were performed preformed from April 2012 through September 2012. They included site audits of the target facilities and systems and a series of follow up site visits and phone interviews to gain a more detailed understanding of the facilities and potential measure. Facility Analysis included the following PG&E /AECOM team members.
Team Member Primary
Responsibility Organization
Brent Patera SST Program Director PG&E
Diana Mejia-Chartrand SST Business PG&E
Approach to Investment Grade Analysis
9 of 79
Investment Grade Analysis Report, Confidential, 3/19/2013
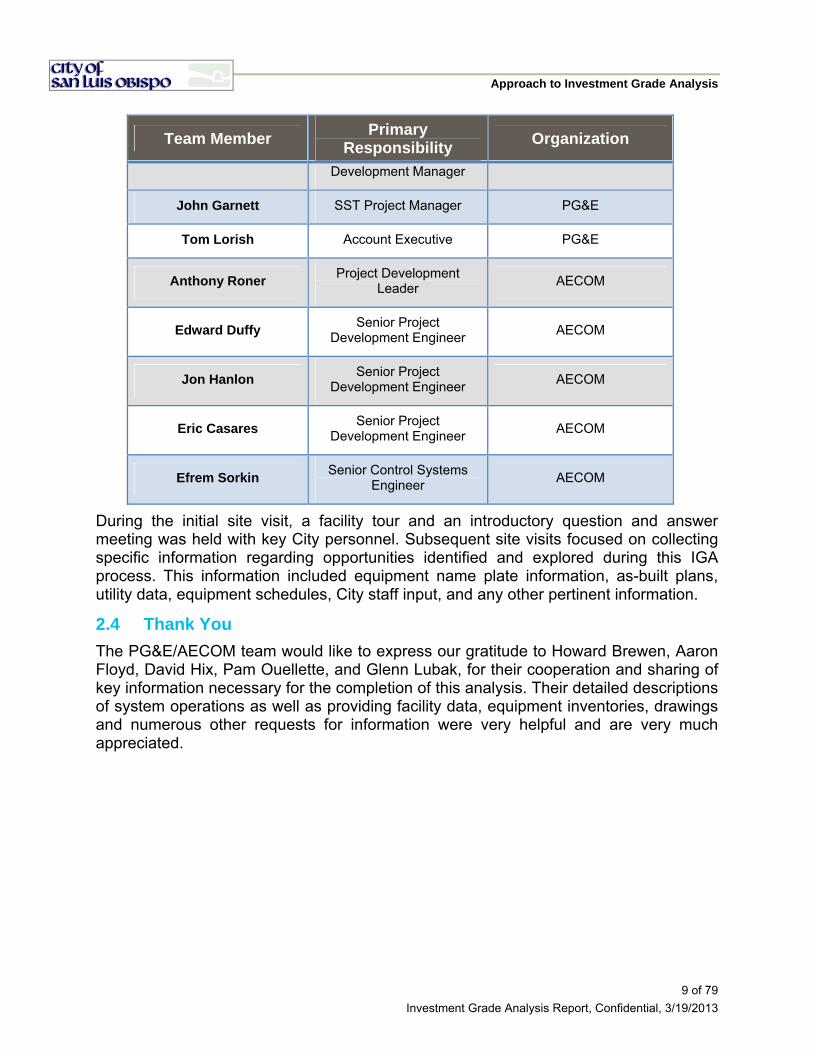
Team Member Primary
Responsibility Organization
Development Manager
John Garnett SST Project Manager PG&E
Tom Lorish Account Executive PG&E
Anthony Roner Project Development
Leader AECOM
Edward Duffy Senior Project
Development Engineer AECOM
Jon Hanlon Senior Project
Development Engineer AECOM
Eric Casares Senior Project
Development Engineer AECOM
Efrem Sorkin Senior Control Systems
Engineer AECOM
During the initial site visit, a facility tour and an introductory question and answer meeting was held with key City personnel. Subsequent site visits focused on collecting specific information regarding opportunities identified and explored during this IGA process. This information included equipment name plate information, as-built plans, utility data, equipment schedules, City staff input, and any other pertinent information.
2.4 Thank You
The PG&E/AECOM team would like to express our gratitude to Howard Brewen, Aaron Floyd, David Hix, Pam Ouellette, and Glenn Lubak, for their cooperation and sharing of key information necessary for the completion of this analysis. Their detailed descriptions of system operations as well as providing facility data, equipment inventories, drawings and numerous other requests for information were very helpful and are very much appreciated.

Utility Analysis
10 of 79
Investment Grade Analysis Report, Confidential, 3/19/2013
3.0 UTILITY ANALYSIS
3.1 Overview
This analysis focuses on developing an understanding of the electrical and natural gas energy use and related costs for the ongoing operation at City of San Luis Obispo WRF. Electrical service to this facility is provided by PG&E and natural gas from Southern California Gas (SCG). The following utility analysis considered up to four years of electric and natural gas consumption data.
Specifically this analysis focuses on determining the facility’s actual monthly and annual electrical and natural gas energy use and related costs, and electrical demand profiles and related costs. The analysis provides indices for comparison against industry benchmarks for utility consumption and costs that are normalized with the wastewater throughput. The determination of the baseline energy use and allocation is used to provide a measure of the magnitude of available savings and as a check for savings calculations.
3.1.1 Electric Usage
Electricity is provided to the site through three meter services. PG&E has provided approximately 3.6 million Kilowatt Hours (kWh) per year over the last four years to the WRF via the site’s main meter under the SE19P rate tariff. Another meter serves the Water Reuse Site and is not part of this study. The third meter indicates very small usage and provides the site about 3,000 kWh per year under the A-6 rate tariff. Table 3-3 through 3-6 depict the last four years of electrical demand, energy usage and costs for the WRF. The demand and energy usage data is broken down by the Time of Use (TOU) periods as defined by PG&E. The TOU periods and related energy rates as of 7/1/2012 are shown in Table 3-1 below, and the demand rates by TOU period are shown in 3.2 . Table 3-1 – PG&E TOU Seasons, Daily Periods and Related Energy Rates as of 7/1/2012 Summer Period A (May-October) Energy Rate Peak: 12:00 noon to 6:00 pm Monday through Friday (except holidays) $0.12342/kWh
Partial-Peak: 8:30 am to 12:00 noon Monday through Friday (except holidays) $0.08980/kWh
6:00 pm to 9:30 pm Monday through Friday (except holidays)
Off-Peak: 9:30 pm to 8:30 am Monday through Friday (except holidays)
$0.06988/kWh All Day Saturday, Sunday, and Holidays
Winter Period B (November-April) Partial-Peak: 8:30 am to 9:30 pm Monday through Friday (except holidays) $0.08603/kWhOff-Peak: 9:30 pm to 8:30 am Monday through Friday (except holidays)
$0.07227/kWh All Day Saturday, Sunday, and Holidays

Utility Analysis
11 of 79
Investment Grade Analysis Report, Confidential, 3/19/2013
Table 3-2 - PG&E TOU Demand Rates as of 7/1/2012
Summer Season
Rate Period
Demand Charge Component
Rate ($/kW/month)
Notes
Peak: On-Peak 14.37 Rate is applied to the maximum demand during peak period
Partial- Peak:
Part-Peak 3.13 Rate is applied to the maximum demand during partial-peak period
Off- Peak:
None N/A There is not a specific off-peak period demand charge
N/A Max 9.23 Rate is applied to the maximum demand during the billing month regardless of the rate period.
Winter Season
Partial-Peak:
Part-Peak 0.40 Rate is applied to the maximum demand during partial-peak period
Off- Peak:
None N/A There is not a specific off-peak period demand charge
N/A Max 9.23 Rate is applied to the maximum demand during the billing month regardless of the rate period.
As can be seen in Table 3-1 and Table 3-2, the cost of energy and demand change significantly with TOU periods, and as a result it may be financially attractive to move some processes (if possible) from peak periods and utilize existing methane gas, which is currently produced during the anaerobic digestion process, to produce electricity to offset the high peak demand costs. A breakdown of the WRF’s annual energy use by TOU period over the last four years is fairly consistent and shows that approximately 10% is used during on-peak periods, 30% during partial-peak periods, and 60% during off-peak periods. Further analysis of the Summer Season months over this same period reveals that the on-peak energy consumption is typically between 17% and 19% of the monthly total and the cost for on-peak period energy and demand is approximately 30% of the monthly cost. An example of the on-peak relationship for the Electric bill is as follows:
Percent of monthly energy used on-peak = 54,056 ÷ 297,324 × 100% = 18.0%
Percent of monthly cost for on-peak usage:
o On-peak energy rate for July 2011 was $0.145/kWh and the resulting cost was approximately 0.145 × 54,056 = $7,823.
o On-peak demand rate for July 2010 was $10.87/kW and the resulting cost was approximately $10.87 × 523 = $5,679.
o % on-peak costs = ($7,823 + $5,679) ÷ $41,485 × 100% = 32.5%
MonthOn Peak
kWOn Peak
kWhPart
Peak kWPart Peak
kWhOff Peak
kWOff Peak
kWhTotal kWh PG&E Costs
Jul-11 523 54,056 507 60,129 496 183139 297,324 41,485$

Utility Analysis
12 of 79
Investment Grade Analysis Report, Confidential, 3/19/2013
The utility usage and cost tables for the WRF also show the calculated load factor. The Load Factor is the ratio of the energy consumed per month divided by the maximum amount of energy that would be consumed at the highest power as measured by demand. The data shows that the monthly load factors are in the 70 to 80% range over a year. This indicates that much of the equipment runs constantly as you would expect in a facility that operates 24 hours per day.
In summary, the average annual electricity provided by PG&E for use at the WRF over the past 4 years is 3,817,188 kWh and the related average annual cost is $443,929.
It is important to note that the WRF operated a micro turbine based cogeneration system from approximately March 2006 through January 2009 which overlaps with our analysis of the data for PG&E’s main meter from March 2008 - February 2009. The result is that the actual electricity consumption, and demand, for the WRF is greater than what is shown in the main meter analysis for March 2008 - February 2009. The following micro turbine system energy production data was provided by the WRF:
From startup (March-April 2006) through December 2007: 370,546 kWh total.
January through December 2008: 220,732 kWh total.
January 1 through January 22, 2009: 11,712 kWh total (micro turbine skid was shut down on the 22nd and has not run since).
If we assume that the micro turbine system generated the same amount of energy each month from January 2008 – December 2008, then the approximate monthly output was 220,732 kWh ÷ 12 = 18,394 kWh. Using this monthly value and the 11,712 kWh for January 2009, the estimated energy produced by the micro turbine system during March 2008 - February 2009 is: 10 months × 18,394 kWh + 11,712 kWh = 195,652 kWh. The resulting total energy usage by the WRF during that period was 195,652 kWh (micro turbines) + 3,885,023 kWh (PG&E) = 4,080,675 kWh.
Utility Analysis
13 of 79
Investment Grade Analysis Report, Confidential, 3/19/2013
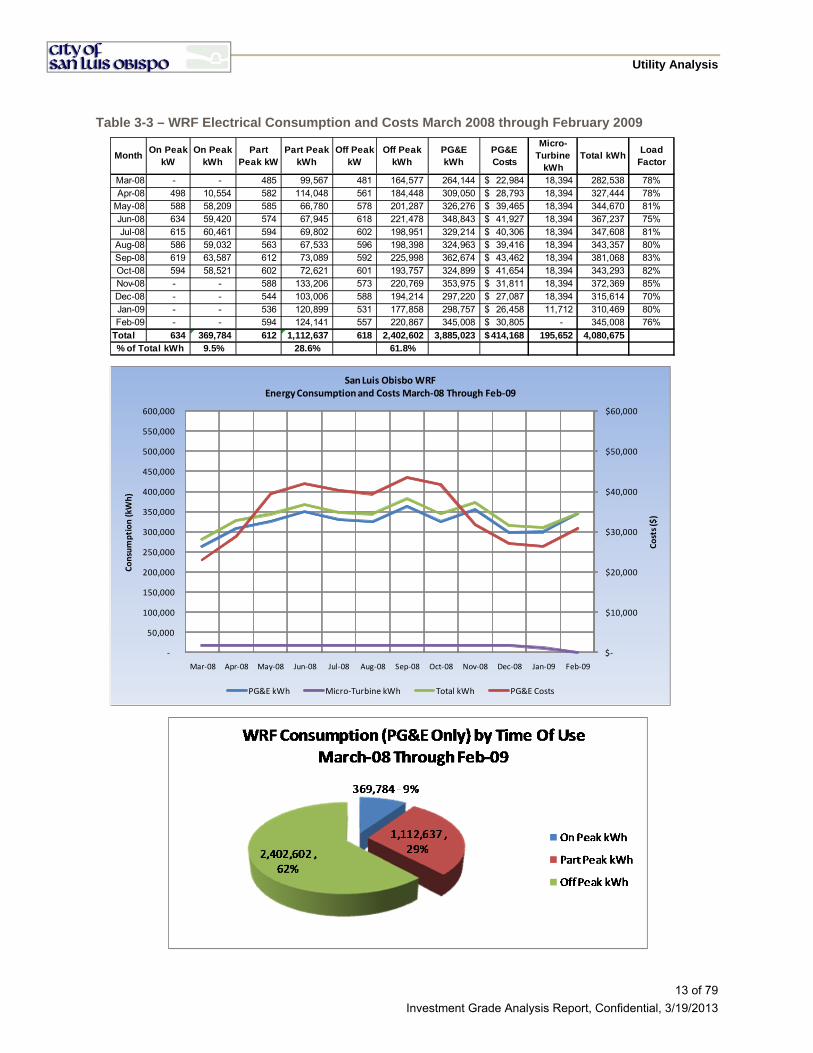
Table 3-3 – WRF Electrical Consumption and Costs March 2008 through February 2009
MonthOn Peak
kWOn Peak
kWhPart
Peak kWPart Peak
kWhOff Peak
kWOff Peak
kWhPG&E kWh
PG&E Costs
Micro-Turbine
kWhTotal kWh
Load Factor
Mar-08 - - 485 99,567 481 164,577 264,144 22,984$ 18,394 282,538 78%Apr-08 498 10,554 582 114,048 561 184,448 309,050 28,793$ 18,394 327,444 78%
May-08 588 58,209 585 66,780 578 201,287 326,276 39,465$ 18,394 344,670 81%Jun-08 634 59,420 574 67,945 618 221,478 348,843 41,927$ 18,394 367,237 75%Jul-08 615 60,461 594 69,802 602 198,951 329,214 40,306$ 18,394 347,608 81%
Aug-08 586 59,032 563 67,533 596 198,398 324,963 39,416$ 18,394 343,357 80%Sep-08 619 63,587 612 73,089 592 225,998 362,674 43,462$ 18,394 381,068 83%Oct-08 594 58,521 602 72,621 601 193,757 324,899 41,654$ 18,394 343,293 82%Nov-08 - - 588 133,206 573 220,769 353,975 31,811$ 18,394 372,369 85%Dec-08 - - 544 103,006 588 194,214 297,220 27,087$ 18,394 315,614 70%Jan-09 - - 536 120,899 531 177,858 298,757 26,458$ 11,712 310,469 80%Feb-09 - - 594 124,141 557 220,867 345,008 30,805$ - 345,008 76%
Total 634 369,784 612 1,112,637 618 2,402,602 3,885,023 414,168$ 195,652 4,080,675 9.5% 28.6% 61.8%% of Total kWh
$‐
$10,000
$20,000
$30,000
$40,000
$50,000
$60,000
‐
50,000
100,000
150,000
200,000
250,000
300,000
350,000
400,000
450,000
500,000
550,000
600,000
Mar‐08 Apr‐08 May‐08 Jun‐08 Jul‐08 Aug‐08 Sep‐08 Oct‐08 Nov‐08 Dec‐08 Jan‐09 Feb‐09
Costs ($)
Consumption (kW
h)
San Luis Obisbo WRFEnergy Consumption and Costs March‐08 Through Feb‐09
PG&E kWh Micro‐Turbine kWh Total kWh PG&E Costs

Utility Analysis
14 of 79
Investment Grade Analysis Report, Confidential, 3/19/2013
MonthOn Peak
kWOn Peak
kWhPart
Peak kWPart Peak
kWhOff Peak
kWOff Peak
kWhPG&E kWh
PG&E Costs
Micro-Turbine
kWhTotal kWh
Load Factor
Mar-09 - - 542 125,385 538 188,161 313,546 30,416$ - 313,546 80%Apr-09 554 11,504 609 118,740 590 195,576 325,820 34,602$ - 325,820 77%
May-09 585 59,873 599 68,637 571 223,458 351,968 48,313$ - 351,968 77%Jun-09 625 66,821 626 76,573 644 209,554 352,948 49,908$ - 352,948 76%Jul-09 582 59,570 577 67,098 572 181,786 308,454 44,421$ - 308,454 76%
Aug-09 572 58,119 585 66,515 574 182,284 306,918 44,092$ - 306,918 75%Sep-09 604 62,786 578 70,911 590 228,262 361,959 49,507$ - 361,959 78%Oct-09 572 52,826 558 72,754 576 189,517 315,097 43,353$ - 315,097 79%Nov-09 - - 547 113,472 524 201,526 314,998 30,616$ - 314,998 73%Dec-09 - - 475 93,247 471 158,189 251,436 24,901$ - 251,436 74%Jan-10 - - 549 111,572 478 160,581 272,153 27,883$ - 272,153 69%Feb-10 - - 519 116,526 525 204,338 320,864 31,869$ - 320,864 80%
Total 625 371,499 626 1,101,430 644 2,323,232 3,796,161 459,882$ - 3,796,161 9.8% 29.0% 61.2%% of Total kWh
$‐
$10,000
$20,000
$30,000
$40,000
$50,000
$60,000
‐
50,000
100,000
150,000
200,000
250,000
300,000
350,000
400,000
450,000
500,000
550,000
600,000
Mar‐09 Apr‐09 May‐09 Jun‐09 Jul‐09 Aug‐09 Sep‐09 Oct‐09 Nov‐09 Dec‐09 Jan‐10 Feb‐10
Consumption (kW
h)
San Luis Obisbo WRFEnergy Consumption and Costs March‐09 Through Feb‐10
PG&E kWh PG&E Costs
Table 3-4 – WRF Electrical Consumption and Costs March 2009 through February 2010
Utility Analysis
15 of 79
Investment Grade Analysis Report, Confidential, 3/19/2013
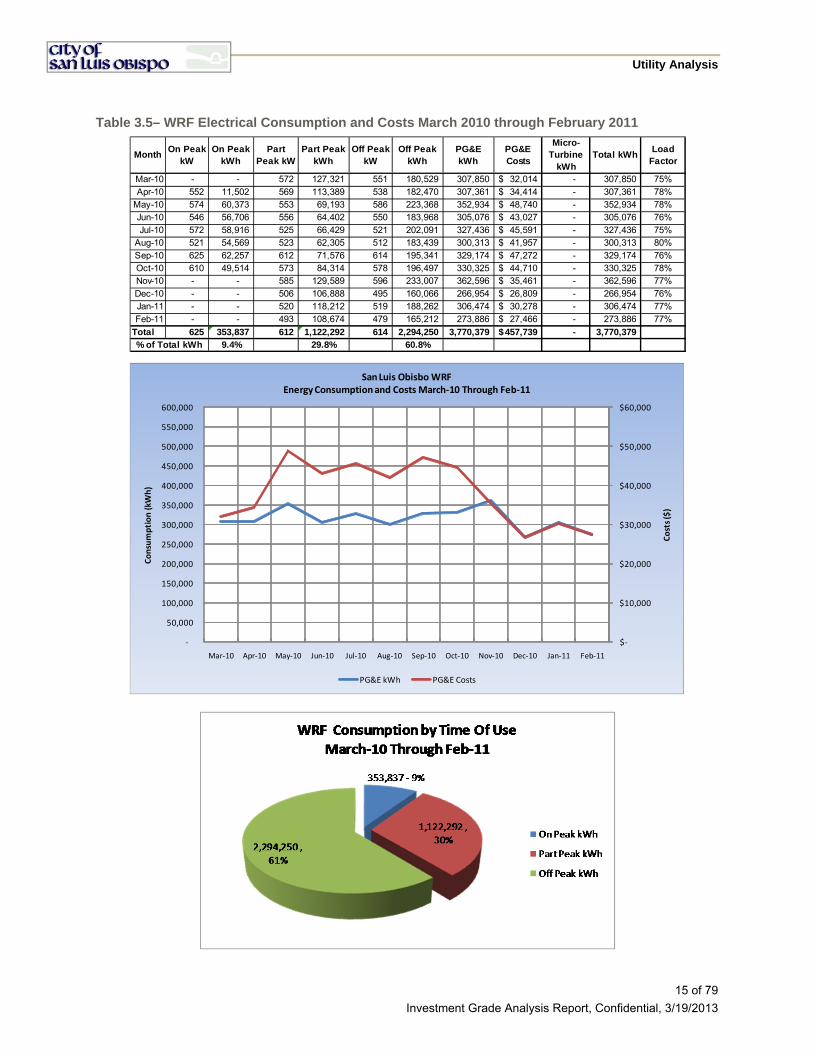
Table 3.5– WRF Electrical Consumption and Costs March 2010 through February 2011
MonthOn Peak
kWOn Peak
kWhPart
Peak kWPart Peak
kWhOff Peak
kWOff Peak
kWhPG&E kWh
PG&E Costs
Micro-Turbine
kWhTotal kWh
Load Factor
Mar-10 - - 572 127,321 551 180,529 307,850 32,014$ - 307,850 75%Apr-10 552 11,502 569 113,389 538 182,470 307,361 34,414$ - 307,361 78%
May-10 574 60,373 553 69,193 586 223,368 352,934 48,740$ - 352,934 78%Jun-10 546 56,706 556 64,402 550 183,968 305,076 43,027$ - 305,076 76%Jul-10 572 58,916 525 66,429 521 202,091 327,436 45,591$ - 327,436 75%
Aug-10 521 54,569 523 62,305 512 183,439 300,313 41,957$ - 300,313 80%Sep-10 625 62,257 612 71,576 614 195,341 329,174 47,272$ - 329,174 76%Oct-10 610 49,514 573 84,314 578 196,497 330,325 44,710$ - 330,325 78%Nov-10 - - 585 129,589 596 233,007 362,596 35,461$ - 362,596 77%Dec-10 - - 506 106,888 495 160,066 266,954 26,809$ - 266,954 76%Jan-11 - - 520 118,212 519 188,262 306,474 30,278$ - 306,474 77%Feb-11 - - 493 108,674 479 165,212 273,886 27,466$ - 273,886 77%
Total 625 353,837 612 1,122,292 614 2,294,250 3,770,379 457,739$ - 3,770,379 9.4% 29.8% 60.8%% of Total kWh
$‐
$10,000
$20,000
$30,000
$40,000
$50,000
$60,000
‐
50,000
100,000
150,000
200,000
250,000
300,000
350,000
400,000
450,000
500,000
550,000
600,000
Mar‐10 Apr‐10 May‐10 Jun‐10 Jul‐10 Aug‐10 Sep‐10 Oct‐10 Nov‐10 Dec‐10 Jan‐11 Feb‐11
Costs ($)
Consumption (kW
h)
San Luis Obisbo WRFEnergy Consumption and Costs March‐10 Through Feb‐11
PG&E kWh PG&E Costs

Utility Analysis
16 of 79
Investment Grade Analysis Report, Confidential, 3/19/2013
Table 3-6 – WRF Electrical Consumption and Costs March 2011 through February 2012
MonthOn Peak
kWOn Peak
kWhPart
Peak kWPart Peak
kWhOff Peak
kWOff Peak
kWhPG&E kWh
PG&E Costs
Micro-Turbine
kWhTotal kWh
Load Factor
Mar-11 - - 528 106,699 518 159,414 266,113 27,489$ - 266,113 72%Apr-11 516 13,256 526 109,774 528 193,634 316,664 34,389$ - 316,664 78%
May-11 549 57,516 575 66,930 541 195,212 319,658 43,891$ - 319,658 75%Jun-11 551 55,438 527 62,711 524 181,575 299,724 42,357$ - 299,724 76%Jul-11 523 54,056 507 60,129 496 183,139 297,324 41,485$ - 297,324 76%
Aug-11 509 50,007 504 56,785 477 164,543 271,335 38,724$ - 271,335 74%Sep-11 531 55,375 521 64,403 534 178,280 298,058 41,879$ - 298,058 80%Oct-11 545 48,692 537 73,507 538 179,151 301,350 41,211$ - 301,350 79%Nov-11 - - 522 102,382 508 187,809 290,191 29,982$ - 290,191 72%Dec-11 - - 474 91,339 420 146,250 237,589 25,072$ - 237,589 67%Jan-12 - - 451 98,775 458 166,394 265,169 26,660$ - 265,169 78%Feb-12 - - 487 101,045 477 161,847 262,892 26,793$ - 262,892 75%
Total 3,724 334,340 6,159 994,479 6,019 2,097,248 3,426,067 419,932$ - 3,426,067 9.8% 29.0% 61.2%% of Total kWh
$‐
$10,000
$20,000
$30,000
$40,000
$50,000
$60,000
‐
50,000
100,000
150,000
200,000
250,000
300,000
350,000
400,000
450,000
500,000
550,000
600,000
Mar‐11 Apr‐11 May‐11 Jun‐11 Jul‐11 Aug‐11 Sep‐11 Oct‐11 Nov‐11 Dec‐11 Jan‐12 Feb‐12
Costs ($)
Consumption (kW
h)
San Luis Obisbo WRFEnergy Consumption and Costs March‐11 Through Feb‐12
PG&E kWh PG&E Costs
Utility Analysis
17 of 79
Investment Grade Analysis Report, Confidential, 3/19/2013
3.1.2 Gas Usage
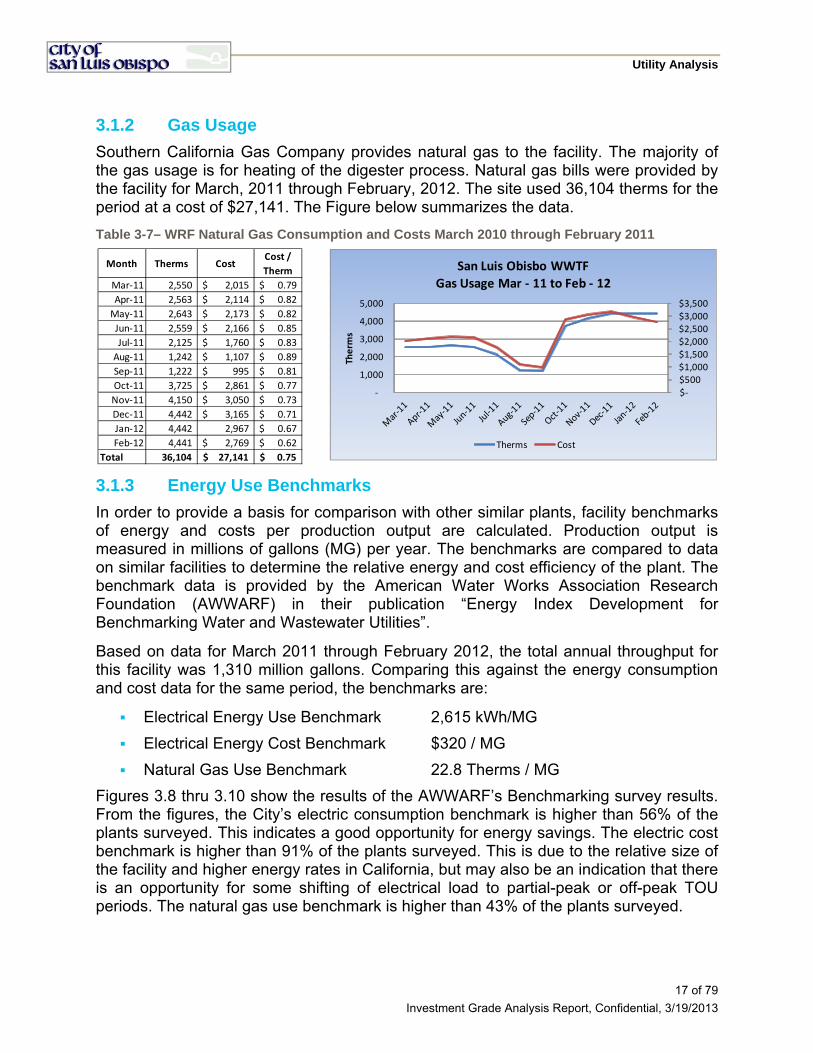
Southern California Gas Company provides natural gas to the facility. The majority of the gas usage is for heating of the digester process. Natural gas bills were provided by the facility for March, 2011 through February, 2012. The site used 36,104 therms for the period at a cost of $27,141. The Figure below summarizes the data.
Table 3-7– WRF Natural Gas Consumption and Costs March 2010 through February 2011
3.1.3 Energy Use Benchmarks
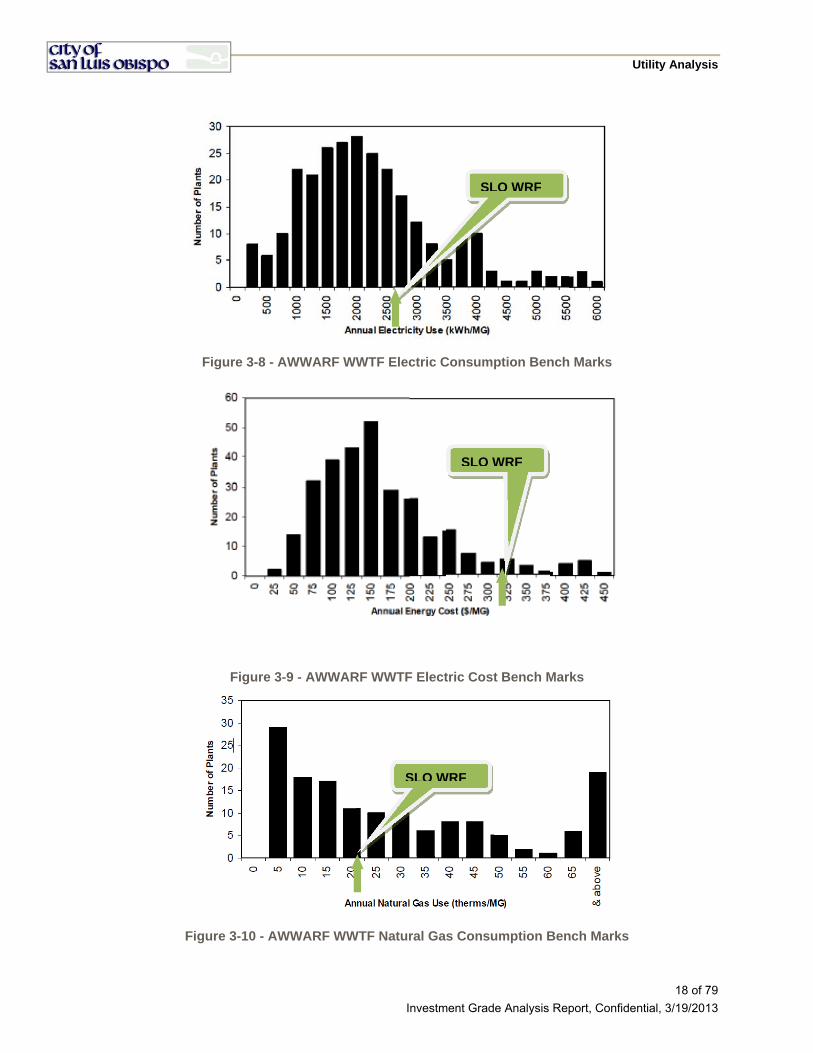
In order to provide a basis for comparison with other similar plants, facility benchmarks of energy and costs per production output are calculated. Production output is measured in millions of gallons (MG) per year. The benchmarks are compared to data on similar facilities to determine the relative energy and cost efficiency of the plant. The benchmark data is provided by the American Water Works Association Research Foundation (AWWARF) in their publication “Energy Index Development for Benchmarking Water and Wastewater Utilities”.
Based on data for March 2011 through February 2012, the total annual throughput for this facility was 1,310 million gallons. Comparing this against the energy consumption and cost data for the same period, the benchmarks are:
Electrical Energy Use Benchmark 2,615 kWh/MG
Electrical Energy Cost Benchmark $320 / MG
Natural Gas Use Benchmark 22.8 Therms / MG
Figures 3.8 thru 3.10 show the results of the AWWARF’s Benchmarking survey results. From the figures, the City’s electric consumption benchmark is higher than 56% of the plants surveyed. This indicates a good opportunity for energy savings. The electric cost benchmark is higher than 91% of the plants surveyed. This is due to the relative size of the facility and higher energy rates in California, but may also be an indication that there is an opportunity for some shifting of electrical load to partial-peak or off-peak TOU periods. The natural gas use benchmark is higher than 43% of the plants surveyed.
Month Therms CostCost /
Therm
Mar‐11 2,550 2,015$ 0.79$
Apr‐11 2,563 2,114$ 0.82$
May‐11 2,643 2,173$ 0.82$
Jun‐11 2,559 2,166$ 0.85$
Jul‐11 2,125 1,760$ 0.83$
Aug‐11 1,242 1,107$ 0.89$
Sep‐11 1,222 995$ 0.81$
Oct‐11 3,725 2,861$ 0.77$
Nov‐11 4,150 3,050$ 0.73$
Dec‐11 4,442 3,165$ 0.71$
Jan‐12 4,442 2,967 0.67$
Feb‐12 4,441 2,769$ 0.62$
Total 36,104 27,141$ 0.75$
$‐
$500 $1,000 $1,500
$2,000 $2,500 $3,000
$3,500
‐
1,000
2,000
3,000
4,000
5,000
Therm
s
San Luis Obisbo WWTF
Gas Usage Mar ‐ 11 to Feb ‐ 12
Therms Cost
Utility Analysis
18 of 79
Investment Grade Analysis Report, Confidential, 3/19/2013
Figure 3-8 - AWWARF WWTF Electric Consumption Bench Marks
Figure 3-9 - AWWARF WWTF Electric Cost Bench Marks
Figure 3-10 - AWWARF WWTF Natural Gas Consumption Bench Marks
SLO WRF
SLO WRF
SLO WRF
Energy Allocation Analysis
19 of 79
Investment Grade Analysis Report, Confidential, 3/19/2013
4.0 ENERGY ALLOCATION ANALYSIS
4.1 Overview
Energy allocation is the process of designating the fraction of the total measured electric energy used by a facility or building to individual systems and components (lights, fans, pumps, etc.). With adequate metering this process would be very simple. In the real world this metering infrequently exists and the energy engineer must utilize what is known of the systems, design, load factors and hours of operation to prepare an approximate picture of how the facility operates and uses energy. This picture is known as an energy allocation.
As part of the IGA process it is AECOM’s practice to examine a facility’s energy use in as great a resolution as possible. This effort has several key values at multiple stages of project development. First, the analysis provides an estimate of the system or component energy use which may be used to calibrate the baseline for a more detailed energy savings calculation using models of specific sub-systems.
Secondly, the allocations allow an energy engineer to identify excessive energy use by a system which cannot be explained by typical loading and hours of use. In this way the allocation analysis can help detect energy waste.
Finally, the energy allocation provides important data for the energy engineer to support sound judgments of energy use which may be used to evaluate the savings fraction for an individual system or systems to be affected by a recommended energy conservation measure. This allows the evaluation of savings interaction between different measures as well as supporting preliminary savings calculations.
It is important to keep in mind that the energy allocation is a tool based on available data, drawings, etc. to be used by building engineers and energy engineers to better understand how a building uses energy. The purpose is to guide investigation efforts into the most effective ways to improve total facilities efficiency.
4.2 Electrical Annual End-Use Reconciliation
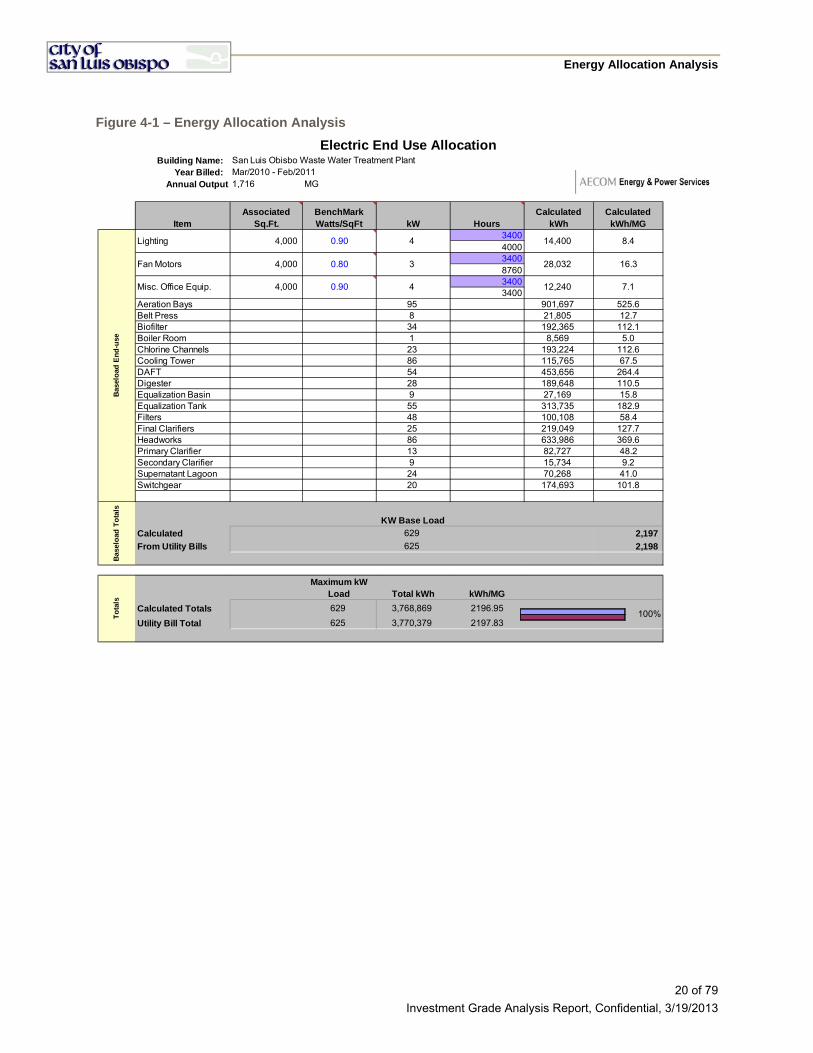
Figure 4.1 below shows the allocation of estimated annual electrical energy use to various systems. These systems represent specific areas or processes within the facility. This allocation is based on equipment and operational data provided by the City. The equipment was assigned to specific systems and the energy use by each component was calculated using the power needs and hours of operation. These allocations are one metric that is used to determine the viability of a measure. The allocation also serves as a check for the energy savings calculation.
Energy Allocation Analysis
20 of 79
Investment Grade Analysis Report, Confidential, 3/19/2013
Figure 4-1 – Energy Allocation Analysis
Building Name: San Luis Obisbo Waste Water Treatment PlantYear Billed: Mar/2010 - Feb/2011
Annual Output 1,716 MG
340040003400876034003400
Aeration Bays 95 901,697 525.6Belt Press 8 21,805 12.7Biofilter 34 192,365 112.1Boiler Room 1 8,569 5.0Chlorine Channels 23 193,224 112.6Cooling Tower 86 115,765 67.5DAFT 54 453,656 264.4Digester 28 189,648 110.5Equalization Basin 9 27,169 15.8Equalization Tank 55 313,735 182.9Filters 48 100,108 58.4Final Clarifiers 25 219,049 127.7Headworks 86 633,986 369.6Primary Clarifier 13 82,727 48.2Secondary Clarifier 9 15,734 9.2Supernatant Lagoon 24 70,268 41.0Switchgear 20 174,693 101.8
KW Base Load
Calculated 629 2,197
From Utility Bills 625 2,198
Maximum kW Load Total kWh kWh/MG
Calculated Totals 629 3,768,869 2196.95
Utility Bill Total 625 3,770,379 2197.83
To
tals
Lighting
Fan Motors
Misc. Office Equip.
Electric End Use Allocation
14,4004,000
4,000
4,000
28,032
8.4
16.3
7.112,240
Bas
elo
ad E
nd
-use
100%
4
Calculated kWh
Calculated kWh/MGItem
BenchMark Watts/SqFt kW Hours
Associated Sq.Ft.
0.90
0.80
0.90
3
4
Bas
elo
ad T
ota
ls
Facility Improvement Measures
21 of 79
Investment Grade Analysis Report, Confidential, 3/19/2013
5.0 FACILITY IMPROVMENT MEASURES
5.1 Introduction
AECOM understands the importance of the IGA in the development of a successful project. Our IGA development process requires significant upfront investment in engineering and project management resources to ensure that the recommended measures meet the City’s criteria and goals, are economically viable, and are constructible within the budgets presented in this report.
5.2 Evaluation of Results and Presentation of Findings
As a result of this IGA effort, the City, AECOM and PG&E as a Team determined that the measures evaluated in this IGA have a dynamic effect on the interrelated WRF processes and should be implemented as a whole. This bundled approach would provide the best overall benefit to the WRF by maximizing process efficiencies and savings benefits for the dollars spent.
Table 5-1 represents viable opportunities for the WRF to consider for implementation. We focused on those measures that would provide the most significant opportunities to meet the City’s stipulated criteria. The measures were evaluated by a combination of meetings and interviews with WRF staff, detailed analysis of a multitude of data collected, analysis of the WRF equipment and site conditions. Section 5.3 provides a detailed description of each recommended measures.
Table 5-1 – Recommended WRF Measure Summary
Measure ID Description
WRF-1 Cogeneration System Upgrade-150kWh
WRF-2 Upgrade Headworks
WRF-3 Retrofit Primary Sludge Pumps ( Option A)
WRF-4 Solids De-watering
WRF-5 Install RAS Pump VFDs
WRF-6 Filter Tower Upgrades
WRF-7 Aeration Tank Air Pressure Set-Point Control Improvements
WRF-8 Outdoor Lighting Upgrades
WRF-9 Upgrade SCADA System

Facility Improvement Measures
22 of 79
Investment Grade Analysis Report, Confidential, 3/19/2013
5.3 IGA Findings and Recommendations
Through this IGA process the following measures were identified, analyzed and are recommended for implementation as they collectively meet or exceed the goals defined at the onset of this process.
WRF-1 – COGENERATION SYSTEM UPGRADE
Existing Conditions
The WRF currently has a 240kW combined heat and power (CHP) cogeneration system designed to utilize Biogas from the site’s digesters. This existing CHP system consists of eight 30kW Capstone micro-turbines, a digester gas recovery/blower system, a fuel (digester gas) treatment system, exhaust heat recovery system with connection to the digester heating system and an electrical system with interconnection to the WRF electrical system. The micro-turbine system was installed in 2005 and operated until early 2009 when it was shut down due to ongoing operational and maintenance issues. The WRF operations staff indicated
that the majority of the problems were related to the fuel treatment system and the micro-turbines reliability. The basis for the existing CHP system sizing and capacity is not clear from the documentation reviewed in our investigation.
Currently, all of the gas produced by the digesters is disposed of via flaring. As a result, the City does not receive any benefit from the energy value of the gas. From meters that the City has recently installed, the measured average instantaneous biogas produced from digesters 1 and 2 is 48 SCFM. This measured average production rate is estimated to produce 65,000 SCF/Day for 10 months out of the year when Cal Poly San Luis Obispo (Cal Poly) is in session and we are estimating a 12% reduction or 57,200 SCF/Day during July and August when the student population at Cal Poly is typically low. The WRF records of digester gas testing provided by operations staff indicate the energy content of the gas is 539 BTU/SCF (LHV). Based on this energy content, the available daily gas energy is 35 MMBTUs (at 65,000 scf/day) and the approximate annual amount is 12 Billion BTUs.
To maximize the solids destruction the digester is maintained at a constant 94 Deg F. To accomplish this the digesters are currently heated using hot water produced by a natural gas fired boiler with an input rating of 600,000 BTU/Hr. Based on the utility bills, the total WRF natural gas usage for the 12-month period of March 2011 through February 2012 was 36,100 Therms. The majority of this gas was used to heat the digester; however there is a small amount of the gas load (less than 100 Therms/year) that is used for domestic hot water serving showers, sinks and dishwashers.
The WRF currently consumes approximately 3.5 MM kWh of electrical energy annually and the minimum demand occasionally dips below 250kW. The minimum demand, or
Figure 1-1 – Existing Micro-turbines

Facility Improvement Measures
23 of 79
Investment Grade Analysis Report, Confidential, 3/19/2013
base load, stays relatively high 24 hours a day which is a good situation for a properly sized CHP system since it allows for a large number of operating hours at maximum output.
Figure 1-2 – WRF Daily Electric Demand Profiles
Measure Description
The essence of this measure is to utilize the renewable, digester gas energy source available at the WRF in a way that benefits the environment and the City of San Luis Obispo. A solution that is commonly implemented in wastewater treatment facilities is a CHP system that will generate electricity and heat onsite for use by the facility’s processes. The electric and thermal energy produced by a CHP system will reduce the WRF’s purchases of electricity and natural gas from its utility providers as well as the associated greenhouse gas emissions. This measure is probably better described as a sustainability improvement and utility cost reduction measure versus a pure energy conservation measure.
The concept investigated for this measure is the installation of a biogas specific CHP system utilizing a reciprocating internal combustion engine (ICE) as the prime mover. This type of CHP system is appealing due to use of more common and proven
200.0
250.0
300.0
350.0
400.0
450.0
500.0
550.0
600.0
650.0
Demand (kW)
City of San Luis Obispo, Water Reclamation Facility
Daily Min, Avg & Max Demand, 04/2011 ‐ 03/2012
Min Demand Avg Demand Max Demand
Facility Improvement Measures
24 of 79
Investment Grade Analysis Report, Confidential, 3/19/2013
technologies when compared to fuel-cells and micro-turbines. The ICE CHP measure involves removal of the existing micro-turbine CHP system and fuel treatment system, and installation of a new fuel treatment system and packaged biogas specific CHP system. In general, the new CHP system will include a new engine-generator and heat recovery system, control system, emissions control system, utility protective relay system, exhaust silencer, heat dump radiator, electrical interconnection and digester heating system interconnection.
The estimated gross electrical power output of the CHP system performing at 35% efficiency is 150kW based on using all of the available 65,000 SCF/Day of digester gas at a steady, continuous rate. The gross output would fall to approximately 135kW during July and August when digester gas availability is reduced. Since the digester gas is a limited fuel supply on a real time basis, the CHP system size must be based on the available fuel production rate versus a desired electrical output. As a result, the CHP system size that can be purchased will probably not exactly match the WRF’s digester gas availability.
As an alternative, investigation into the feasibility of upsizing the CHP system to accommodate enhanced Biogas production was performed. The enhanced Biogas would be produced with the addition of Fats Oils and Grease (FOG) and a digester mixing system to the existing digesters. For this alternative, the City had the opportunity to utilize grant funding to install a larger 400kW CHP system. The Grant required that a retrofit of digester one with a mixing system and FOG augmentation system that would be installed outside the scope of this project. Although a larger CHP system can make financial sense, the key element in order to sustain long term operation is the availability of FOG. During the investigation of the 400kW system the need for approximately 12,000 gallons per day was not available from a reliable source and therefore this option was not pursued further.
Discussion of Analysis, Benefits and Costs for the ICE CHP System
The determination of the financial benefits and costs for a CHP system is relatively complex, especially one that operates in parallel with the local electric utility. In addition to the estimated cost savings related to the reduced utility energy purchases other considerations include ongoing operating and maintenance (O&M) costs for the CHP system and charges from the electric utility provider for operating an electric generation system that is connected to their system. As a result, there are a number of significant variables and related assumptions required to make a meaningful analysis of the financial benefits. We have attempted to provide realistic expectations for the savings and costs in this analysis by using real facility data to the extent possible, and assumptions that are conservative.
Key Assumptions for our cost/benefit analysis
The CHP system will have an operating life of 20 years.
Ongoing O&M costs for the CHP system and fuel treatment system are $26,500. The O&M costs will escalate annually at the rate of inflation during

Facility Improvement Measures
25 of 79
Investment Grade Analysis Report, Confidential, 3/19/2013
the life of the CHP system.
Electricity and natural gas costs will escalate annually at a rate projected for each utility type.
95% of the existing annual natural gas usage on site is for digester heating
Electric Utility Charges
o The departing load charges will not be included. ( Current “renewable” CHP qualification exclude customer from these charges)
o The standby service reservation charge and maximum reactive demand charge will be consistent with the current rate schedule.
o The electric utility charges will escalate annually at the same rate projected for electric utility costs.
The CHP system will operate 95% of the total hours in a year (availability). It is assumed that the CHP system will not run 5% of the time (458 hours/year) due to planned O&M activities and unplanned outages.
In the energy and demand analysis, the CHP outage time is applied proportionally to each month and utility rate period (peak, part-peak and off-peak) based on the total hours for each period.
Electric demand savings will not be realized during one month in the winter season and one month during the summer season due to CHP system unavailability.
The digester gas production rate and BTU content remains constant through the life of the CHP system.
The digester heating requirements remain constant through the life of the CHP system.
Ongoing air permit costs for the CHP system are the same as for permitting the existing digester gas flare.
Based on our evaluation of the addition of 150kW CHP system and the assumptions above the following estimated cost and savings will result.
Savings
Reduction of electric energy purchases of 601,000 kWh/year
Monthly demand reductions up to 150kW
Reduced natural gas purchases of 29,000 Therms/year.
The resulting first year cost savings will be approximately $72,700 for electricity and $26,700 for natural gas for a total utility savings of $98,800.
Facility Improvement Measures
26 of 79
Investment Grade Analysis Report, Confidential, 3/19/2013
Costs
Turnkey implementation cost is estimated to be $1,695,271
First year annual cost for O&M are estimated to be $26,500
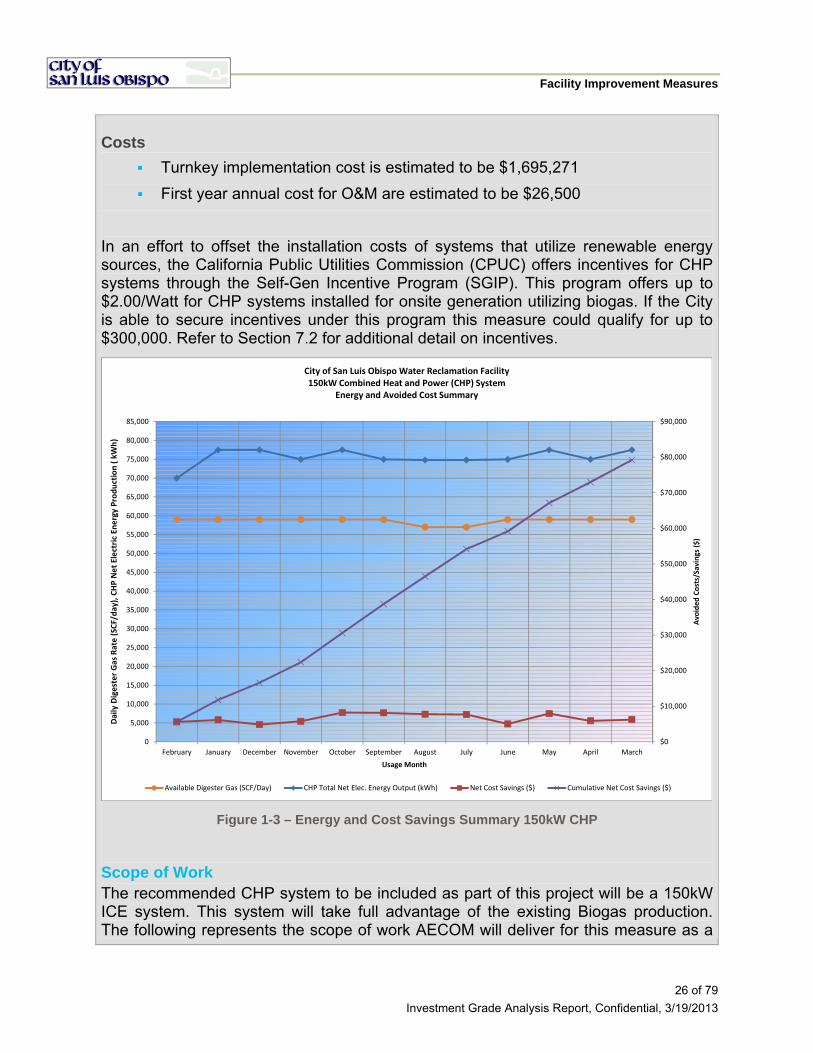
In an effort to offset the installation costs of systems that utilize renewable energy sources, the California Public Utilities Commission (CPUC) offers incentives for CHP systems through the Self-Gen Incentive Program (SGIP). This program offers up to $2.00/Watt for CHP systems installed for onsite generation utilizing biogas. If the City is able to secure incentives under this program this measure could qualify for up to $300,000. Refer to Section 7.2 for additional detail on incentives.
Figure 1-3 – Energy and Cost Savings Summary 150kW CHP
Scope of Work The recommended CHP system to be included as part of this project will be a 150kW ICE system. This system will take full advantage of the existing Biogas production. The following represents the scope of work AECOM will deliver for this measure as a
$0
$10,000
$20,000
$30,000
$40,000
$50,000
$60,000
$70,000
$80,000
$90,000
0
5,000
10,000
15,000
20,000
25,000
30,000
35,000
40,000
45,000
50,000
55,000
60,000
65,000
70,000
75,000
80,000
85,000
February January December November October September August July June May April March
Avoided Costs/Savings ($)
Daily Digester Gas Rate (SCF/day), CHP Net Electric En
ergy Production ( kWh)
Usage Month
City of San Luis Obispo Water Reclamation Facility 150kW Combined Heat and Power (CHP) System
Energy and Avoided Cost Summary
Available Digester Gas (SCF/Day) CHP Total Net Elec. Energy Output (kWh) Net Cost Savings ($) Cumulative Net Cost Savings ($)
Facility Improvement Measures
27 of 79
Investment Grade Analysis Report, Confidential, 3/19/2013
design build turnkey solution.
Required design and design documents for the systems to be installed.
Project and construction management.
Remove the existing micro turbines and fuel treatment system.
Install a new packaged reciprocating internal combustion engine CHP system.
Install a new digester gas/fuel treatment system.
Modify the digester gas blower system as required for proper operation of the new CHP system.
Modify the micro-turbine generator electrical system including removal of the micro-turbine generator conductors, conduit and breakers, and installation of a new generator breaker, conductors and conduit for the new generator.
Modify the digester heating system to utilize the heat recovered from the CHP system.
Install new CHP system controls and modify the existing control system as required to monitor and operate the new CHP system.
Submit Air Pollution Control District (APCD) applications and obtain APCD authority to construct and permit to operate. Provide APCD source testing required for initial permit to operate.
Obtain required building permits.
Modify the existing, or apply for a new Rule 21 interconnection agreement with PG&E.
Apply for available utility incentives.
Commissioning of the new and modified systems.
Benefits
We expect that this measure will:
Allow the City to utilize the energy value from an available renewable energy resource.
Reduce the WRF’s carbon footprint by reducing greenhouse gas emissions from utility fossil fuel electricity generation and natural gas usage at the site.
Reduce electric and natural gas utility costs.
Provide potential Renewable Energy Certificates and trading of carbon credits.
Savings
The implementation of this measure would provide the following savings:
Reduction of electric energy purchases of 601,192 kWh/year

Facility Improvement Measures
28 of 79
Investment Grade Analysis Report, Confidential, 3/19/2013
Monthly demand reductions of up to 150kW
Reduced natural gas purchases of 29,038 Therms/year.
The resulting first year savings after O&M costs of $72,000
Consideration for future increased digester gas production with FOG augmentation
If boosting gas production through the introduction of FOG is an option that the City would like to pursue in the future, there is a potential to add 100kW CHP to the proposed 150 kW system with minor modifications to the existing electrical infrastructure originating at building MCC-A. It is estimated that an additional 45,000 scf/day biogas would be required to operate an additional 100kW CHP system. For the existing digesters to produce this required biogas it is estimated that the addition of 5,000 gallons/day of FOG would be needed.
Additional Assumptions when considering alternative systems with the use of FOG
FOG will be delivered to the site consistently through the 20 year life of the CHP system.
FOG tipping fees will be $.03/Gal, which is a conservative estimate.
Usable Biogas production will be at a consistent rate through the 20 year life of the CHP system.
The digester gas BTU content will be consistent with what is currently produced.
Scope for this work would include:
Addition of a new 100kW CHP system located on existing CHP Pad
Addition of a separate gas filtering system. Modification to the new filter system for the proposed 150 kW system is an option.
Addition of a 5,000 gallon FOG receiving and injection system.
Broker a long term deal for FOG Delivery
Estimated savings for the addition of an additional 100kW CHP System
Reduction of additional electric energy purchases over the base 150kW system by approximately 680,000 kWh/year
Additional monthly demand reductions of up to 100kW.
Additional annual cost savings of approximately $55,000 from electrical utility savings.
Estimated annual revenue of $90,000 could be generated for FOG tipping fees.
Estimated costs for the addition of an additional 100kW CHP System
Facility Improvement Measures
29 of 79
Investment Grade Analysis Report, Confidential, 3/19/2013
Turnkey implementation costs are approximated to be $1,900,000 which includes a packaged 100KW CHP module and a 5000 gallon FOG receiving station.
First year annual cost for O&M are estimated to be $40,000
WRF-2 – UPGRADE HEADWORKS
Existing Conditions
Flow enters the WRF at the equalization basin in two large-diameter sewers. The equalization basin is used to store flows in excess of the peak hydraulic capacity of the facility (32 MGD), equalize peaks in the daily diurnal flow pattern, and provide emergency storage when the influent pumps are out of service. From the equalization basin, the raw wastewater enters the headworks where large, inorganic material and grit are removed from the influent stream. Major mechanical components of the headworks include:
Automatically cleaned bar screens
Inline screenings grinders
Screenings pumps
Rotary screen dewaterer
Grit pumps
Grit blowers
Grit cyclones and classifier
Upon entering the headworks, the wastewater flow is split into two influent channels, each containing automatically cleaned, climber-type bar screens. A third channel containing a manual bar rake is normally closed, but available for peak wet weather events or as needed during maintenance on the screens. Screenings, which include rags and other trash, are removed, ground, and pumped to the rotary screen dewaterer. Here the screenings are washed and dewatered before being discharged into the grit/screenings hopper. One of the two screenings pumps, equipped with a 20 horsepower (HP) motor, is always running.
Facility Improvement Measures
30 of 79
Investment Grade Analysis Report, Confidential, 3/19/2013
Following screening, the wastewater is then lifted by four influent pumps to the aerated grit chambers, where flow enters a channel that apportions it to the two rectangular tanks. Two blowers and a network of coarse bubble diffusers are used to aerate each grit chamber to keep organic material suspended while allowing the grit to settle. Each tank is equipped with two grit pumps that lift the settled grit from the tank sumps to the cyclones and classifier located above the loading area. The grit is dewatered and comingled with the screenings and stored in a bin before being hauled away periodically to Cold Canyon landfill. Both grit chambers are operated throughout the year, with two 15 HP positive displacement blowers and two 20 HP grit pumps running at all times. During the beginning of each wet season both grit chambers and all four grit pumps are simultaneously operated to prevent accumulation of grit during periods of high grit loading.
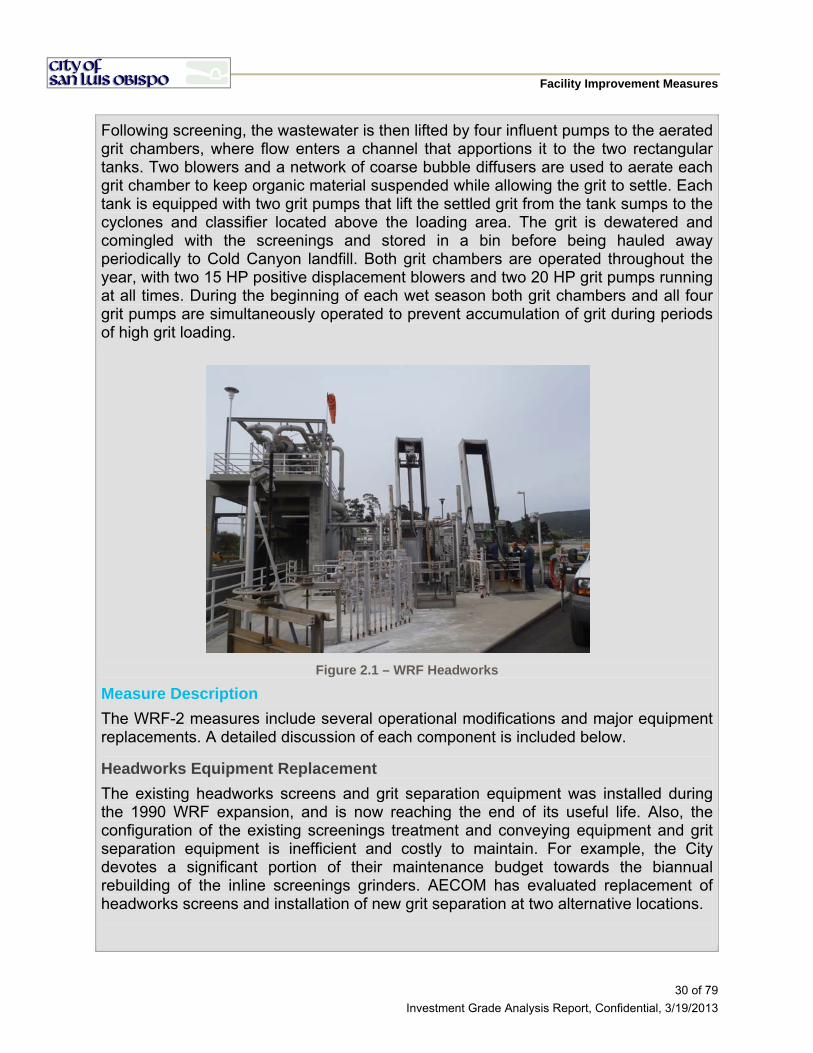
Figure 2.1 – WRF Headworks
Measure Description
The WRF-2 measures include several operational modifications and major equipment replacements. A detailed discussion of each component is included below.
Headworks Equipment Replacement
The existing headworks screens and grit separation equipment was installed during the 1990 WRF expansion, and is now reaching the end of its useful life. Also, the configuration of the existing screenings treatment and conveying equipment and grit separation equipment is inefficient and costly to maintain. For example, the City devotes a significant portion of their maintenance budget towards the biannual rebuilding of the inline screenings grinders. AECOM has evaluated replacement of headworks screens and installation of new grit separation at two alternative locations.
Facility Improvement Measures
31 of 79
Investment Grade Analysis Report, Confidential, 3/19/2013
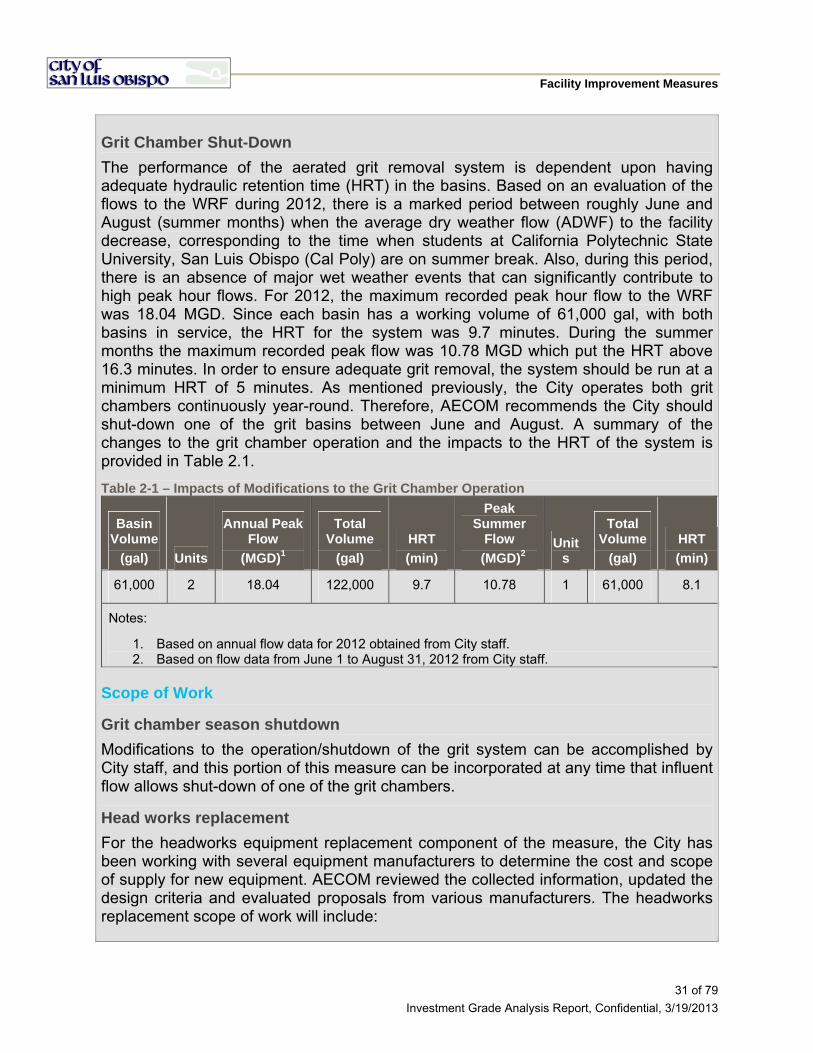
Grit Chamber Shut-Down
The performance of the aerated grit removal system is dependent upon having adequate hydraulic retention time (HRT) in the basins. Based on an evaluation of the flows to the WRF during 2012, there is a marked period between roughly June and August (summer months) when the average dry weather flow (ADWF) to the facility decrease, corresponding to the time when students at California Polytechnic State University, San Luis Obispo (Cal Poly) are on summer break. Also, during this period, there is an absence of major wet weather events that can significantly contribute to high peak hour flows. For 2012, the maximum recorded peak hour flow to the WRF was 18.04 MGD. Since each basin has a working volume of 61,000 gal, with both basins in service, the HRT for the system was 9.7 minutes. During the summer months the maximum recorded peak flow was 10.78 MGD which put the HRT above 16.3 minutes. In order to ensure adequate grit removal, the system should be run at a minimum HRT of 5 minutes. As mentioned previously, the City operates both grit chambers continuously year-round. Therefore, AECOM recommends the City should shut-down one of the grit basins between June and August. A summary of the changes to the grit chamber operation and the impacts to the HRT of the system is provided in Table 2.1.
Table 2-1 – Impacts of Modifications to the Grit Chamber Operation
Basin Volume
(gal) Units
Annual Peak Flow
(MGD)1
Total Volume
(gal)
HRT
(min)
Peak Summer
Flow
(MGD)2 Unit
s
Total Volume
(gal)
HRT
(min)
61,000 2 18.04 122,000 9.7 10.78 1 61,000 8.1
Notes:
1. Based on annual flow data for 2012 obtained from City staff. 2. Based on flow data from June 1 to August 31, 2012 from City staff.
Scope of Work
Grit chamber season shutdown
Modifications to the operation/shutdown of the grit system can be accomplished by City staff, and this portion of this measure can be incorporated at any time that influent flow allows shut-down of one of the grit chambers.
Head works replacement
For the headworks equipment replacement component of the measure, the City has been working with several equipment manufacturers to determine the cost and scope of supply for new equipment. AECOM reviewed the collected information, updated the design criteria and evaluated proposals from various manufacturers. The headworks replacement scope of work will include:
Facility Improvement Measures
32 of 79
Investment Grade Analysis Report, Confidential, 3/19/2013
Removal of the existing bar screens (2),
Removal of the existing screenings grinders (2)
Removal of the two(2) existing screenings pumps
Removal of the rotary screen dewaterer
Provide and install new screens and screenings washing and dewatering equipment.
Provide a new Allen Bradley Programmable Logic Controller (PLC) and programming for optimal operation.
Grit separation equipment replacement
For the grit separation equipment replacement and relocation, AECOM has obtained and evaluated proposals from multiple vendors for replacement equipment. The Grit separation equipment scope of work will include:
Modifications to the reinforced concrete structure supporting the existing grit separation equipment.
Installation of new Hydro grit separation equipment.
Installation of new check valves downstream of the grit pumps
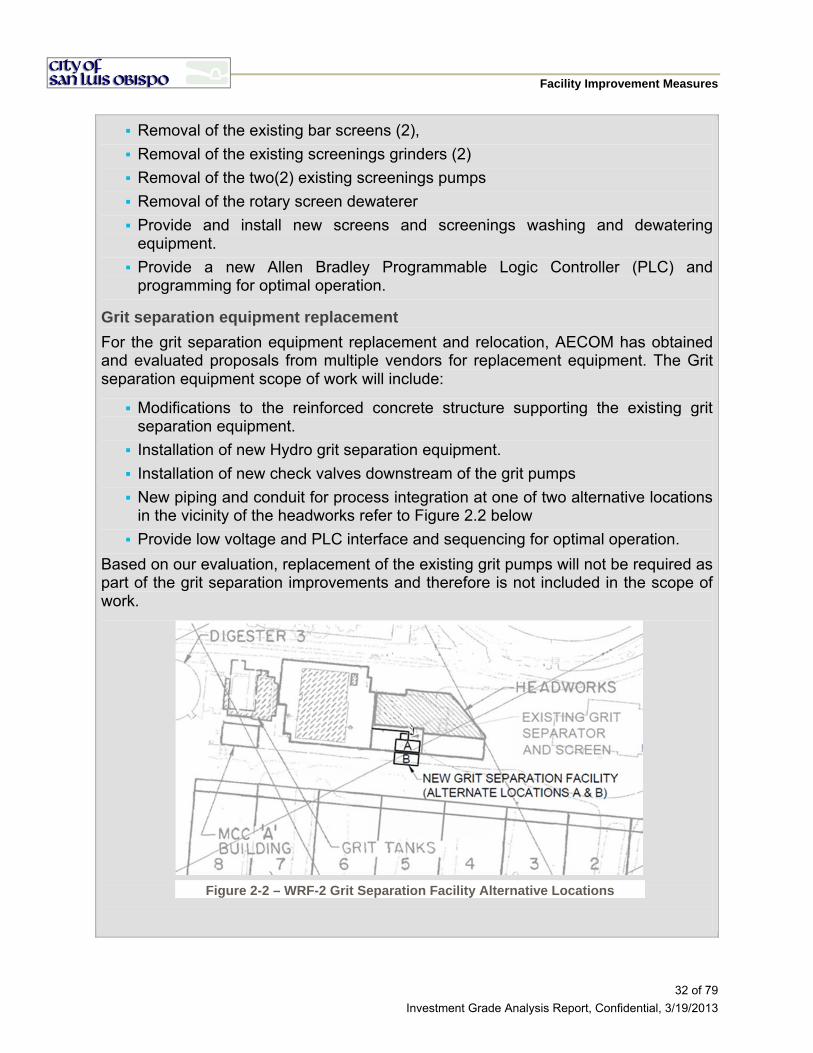
New piping and conduit for process integration at one of two alternative locations in the vicinity of the headworks refer to Figure 2.2 below
Provide low voltage and PLC interface and sequencing for optimal operation.
Based on our evaluation, replacement of the existing grit pumps will not be required as part of the grit separation improvements and therefore is not included in the scope of work.
Figure 2-2 – WRF-2 Grit Separation Facility Alternative Locations
Facility Improvement Measures
33 of 79
Investment Grade Analysis Report, Confidential, 3/19/2013
Design Criteria
The Wastewater Master Plan Update (Brown and Caldwell, Draft 2009) identified the peak hydraulic capacity of the headworks as 32 MGD, based on the flow produced during a 5-year storm event. The Master Plan Update found these values to be relevant for the flow projections through 2030. Additionally, the Master Plan Update reported an average dry weather flow (ADWF) of 5.1 MGD, and an average wet weather flow (AWWF) of 5.5 MGD. The peak flow of 32 MGD has been assumed for the basis of design for the headworks.
Headworks Screening
The design criteria for the screens include peak flow rate, desired opening diameters, and ease of retrofit into the existing headworks structure to minimize cost. The peak flow of 16 MGD (each) has been assumed for the basis of design for the screening equipment.
Open spacing in screens (either between bars or perforations) control the amount and size of material removed from the wastewater stream. Previous investigations and manufacturer quotes assumed an open spacing of 6 mm (1/4-inch). AECOM reviewed 4-mm and 6-mm spacing. A spacing of 4-mm would provide slightly higher removal rates. However, greater removals result in higher operations and maintenance cost resulting from the removal of additional material. An open spacing of 6-mm is appropriate for the current treatment process at the WRF. If membrane bio filtration is pursued in the future, fine screens (1 – 2 mm clear opening) may be required, but these are typically installed directly upstream of the membrane bio-reactor facilities.
The new screens will fit into the existing channels and the additional equipment, including washer/compactors, control panels, etc., will reasonably fit in the area around the screens.
Grit Separation
The peak hydraulic capacity of the grit separation process is 1,000 GPM. According to discussion with the City’s Operations Staff, the four grit slurry pumps (250 GPM each) that discharge to the grit separation process are operated continuously at least once each year, during the first storm even. During normal operation, it is anticipated that one or two grit pumps would be operated simultaneously on an intermittent basis.
A hydraulic capacity of 1,000 GPM has been selected for the replacement grit separator equipment to accommodate simultaneous pumping from all of the existing grit slurry pumps and to allow similar operation for processing high grit volumes during storm events. A minimum hydraulic capacity of 250 GPM has been selected to allow use of one grit pump during intermittent pumping. A summary of design criteria is provided in the following table.
Facility Improvement Measures
34 of 79
Investment Grade Analysis Report, Confidential, 3/19/2013
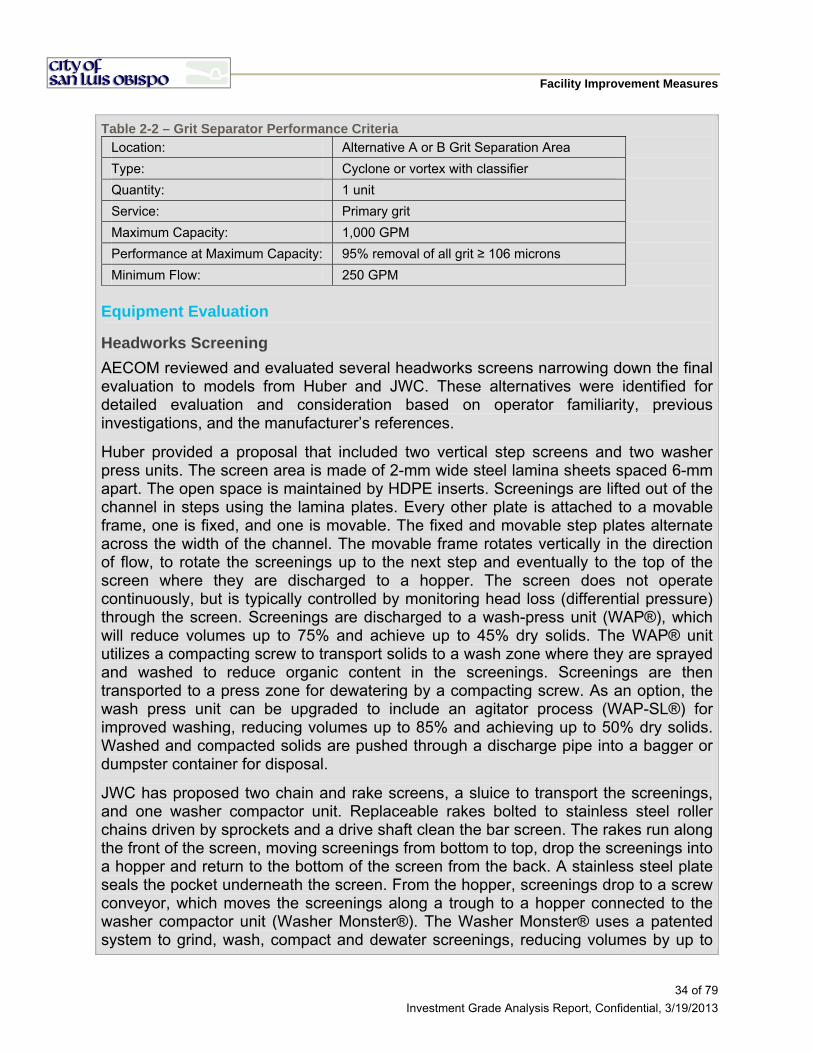
Table 2-2 – Grit Separator Performance Criteria
Location: Alternative A or B Grit Separation Area
Type: Cyclone or vortex with classifier
Quantity: 1 unit
Service: Primary grit
Maximum Capacity: 1,000 GPM
Performance at Maximum Capacity: 95% removal of all grit ≥ 106 microns
Minimum Flow: 250 GPM
Equipment Evaluation
Headworks Screening
AECOM reviewed and evaluated several headworks screens narrowing down the final evaluation to models from Huber and JWC. These alternatives were identified for detailed evaluation and consideration based on operator familiarity, previous investigations, and the manufacturer’s references.
Huber provided a proposal that included two vertical step screens and two washer press units. The screen area is made of 2-mm wide steel lamina sheets spaced 6-mm apart. The open space is maintained by HDPE inserts. Screenings are lifted out of the channel in steps using the lamina plates. Every other plate is attached to a movable frame, one is fixed, and one is movable. The fixed and movable step plates alternate across the width of the channel. The movable frame rotates vertically in the direction of flow, to rotate the screenings up to the next step and eventually to the top of the screen where they are discharged to a hopper. The screen does not operate continuously, but is typically controlled by monitoring head loss (differential pressure) through the screen. Screenings are discharged to a wash-press unit (WAP®), which will reduce volumes up to 75% and achieve up to 45% dry solids. The WAP® unit utilizes a compacting screw to transport solids to a wash zone where they are sprayed and washed to reduce organic content in the screenings. Screenings are then transported to a press zone for dewatering by a compacting screw. As an option, the wash press unit can be upgraded to include an agitator process (WAP-SL®) for improved washing, reducing volumes up to 85% and achieving up to 50% dry solids. Washed and compacted solids are pushed through a discharge pipe into a bagger or dumpster container for disposal.
JWC has proposed two chain and rake screens, a sluice to transport the screenings, and one washer compactor unit. Replaceable rakes bolted to stainless steel roller chains driven by sprockets and a drive shaft clean the bar screen. The rakes run along the front of the screen, moving screenings from bottom to top, drop the screenings into a hopper and return to the bottom of the screen from the back. A stainless steel plate seals the pocket underneath the screen. From the hopper, screenings drop to a screw conveyor, which moves the screenings along a trough to a hopper connected to the washer compactor unit (Washer Monster®). The Washer Monster® uses a patented system to grind, wash, compact and dewater screenings, reducing volumes by up to

Facility Improvement Measures
35 of 79
Investment Grade Analysis Report, Confidential, 3/19/2013
95% and achieving up to 50% dry solids.
The grinder is an additional mechanical piece, distinguishing this JWC unit from the Huber wash press and most other washer/compactors on the market. The potential for additional operational requirements may be balanced by the increase in screenings volume reduction. The WRF currently uses two Monster grinders® to grind screenings, which are the same units utilized with the Washer Monster®. One of the existing grinders could be utilized with the new Washer Monster®. A cutter rebuild is available if needed. The other grinder can be shelved as a spare. There has been some concern about the JWC cutter life however, JWC introduced a new cutter material in August 2010 for the grinders to achieve a greater hardness (65 Rockwell compared to 40 Rockwell for the old cutters). They anticipate that this extends the life of the cutters by at least 2 years. Additionally, the cutter life would be extended due to the horizontal mounting on the unit, utilizing a greater cross section of the cutters.
Beyond the design criteria, AECOM has evaluated the proposed equipment based primarily on equipment configuration, operator preference and cost.
Grit Dewatering Equipment
AECOM reviewed and evaluated grit separation system proposals provided by Huber, Hydro International, and Weir. The proposed grit separation systems from both Huber and the Hydro International Teacup and Grit Snail utilize a grit vortex upstream of a spiral classifier, while the proposed Weir system consists of four grit cyclones and one spiral grit classifier. Each manufacturer provides similar grit removal performance from the proposed systems. Operation and maintenance requirements are expected to be similar. Table 2-3 below provides a summary of the evaluated grit separation system parameters.
Table 2-3 – Grit Separator System Alternatives
Manufacturer Weir Hydro International Huber
Model proposed Wemco Hydrogritter Teacup and Grit Snail
RoSF4.3 Coanda
Units proposed 2 1 2
Hydraulic capacity (GPM, each unit)
500 1,000 500
Hydraulic separator type hydro-cyclone vortex chamber vortex chamber
Number per unit 2 1 2
Mechanical classifier type
spiral spiral spiral
Number per unit 2 1 2
Approx. dimensions (each unit)
10’-2” x 18’ 6.5’ x 12’-2” 5’-5” x 12’-6”
The Teacup and Grit Snail system (Hydro International) would require the smallest footprint of the evaluated grit separators. Two alternative locations for construction of the new grit separation system are described below and are shown in the preliminary

Facility Improvement Measures
36 of 79
Investment Grade Analysis Report, Confidential, 3/19/2013
drawings.
Alternative Site A: beneath the existing concrete grit separation structure and adjacent to the headworks screen channels and wet well; or
Alternative Site B: asphalt cement-paved area immediately southeast of the existing concrete grit separation structure (adjacent Site A).
Benefits
Benefits to the City from modification of the summer operation of the grit removal system, and replacement of the aging headworks and grit separation equipment include:
Energy savings from shutting down one of the grit chambers during the summer months;
Energy savings from more efficient conveyance of screenings;
Reduced operations and maintenance requirements due to replacement of the antiquated climber-type screens;
Reduced operations and maintenance requirements due to installation of new grit separation equipment at an alternative and accessible location;
Reduced hauling costs from production of a drier grit and screenings final product.
Improved grit separation efficiency and performance;
A reduction of the WRF’s carbon footprint resulting from reduced electric energy consumption and fewer number of truck trips for grit and screenings hauling.
ECM Savings
Implementing this measure will result in energy cost savings of approximately $14,000/year, operational and maintenance savings of $31,950/year, reduced hauling costs of approximately $12,000/year. In addition the City will eliminate the need for planned future expenditures of $725,000 in headworks upgrades as well $166,000 for the grit separation equipment.
WRF-3 – RETROFIT PRIMARY SLUDGE PUMPS
Existing Conditions
After leaving the aerated grit basins, screened influent travels to the two 80-foot diameter primary clarifiers. The primary clarifiers allow a large portion of the solids in the influent to either settle or float so they can be removed. The clarifier mechanism skims floating scum from the water surface and sludge from the bottom of the clarifiers, which is then pumped to the dissolved air flotation thickener (DAFT). Two

Facility Improvement Measures
37 of 79
Investment Grade Analysis Report, Confidential, 3/19/2013
7.5 HP centrifugal pumps are used to pump primary sludge to the DAFT. Currently these pumps operate 24/7 365 days a year. The continuous flow which is often more than the treatment system requires, results in a large quantity of very thin primary sludge being sent to the DAFT which adversely affects the downstream process efficiency. A summary of the current primary sludge pumping operation is provided in Table 3.1.
Table 3-1 - Existing Primary Sludge Pumping Operation
Flow
(MGD)1
TSS
(mg/L)2
Solids Loading
(ppd)
Primary Removal
Efficiency
(%)3
Primary
Solids
(ppd)
Sludge Pump
Operation
(min/hr)
Pump Capacity
(GPM)4
Primary
Sludge Flow
(MGD)
Primary Sludge Conc.
(%)
4.33 341 13,310 75 9,982 60 250 0.72 0.17
Notes:
1. Average dry weather flow for 2012 based on data provided by City staff. 2. Planning-level TSS concentration estimate taken from the Wastewater Master
Plan (Brown and Caldwell, 2009). 3. Based on data obtained from the Wastewater Master Plan (Brown & Caldwell,
2009). 4. Primary sludge flow stated is for both primary sludge pumps (CSP-100 and
CSP-200).
Sludge pumped from the primary clarifiers by the primary sludge pumps bypasses the bio filter since the underflow from the DAFT is sent to the head of the aeration basins. The bio filter removes a large percentage of the organics or biochemical oxygen demand (BOD) and a smaller fraction of the Total Kjeldahl Nitrogen (TKN) from the primary effluent. Nitrogen removal associated with the bio filter is primarily attributed to the production of biomass. Therefore, excess liquid in the primary sludge pumped from the primary clarifiers to the DAFT, increases the organic and nitrogen loading to the aeration basins. This increased loading translates to higher aeration requirements and electrical demands from the blowers.
Facility Improvement Measures
38 of 79
Investment Grade Analysis Report, Confidential, 3/19/2013
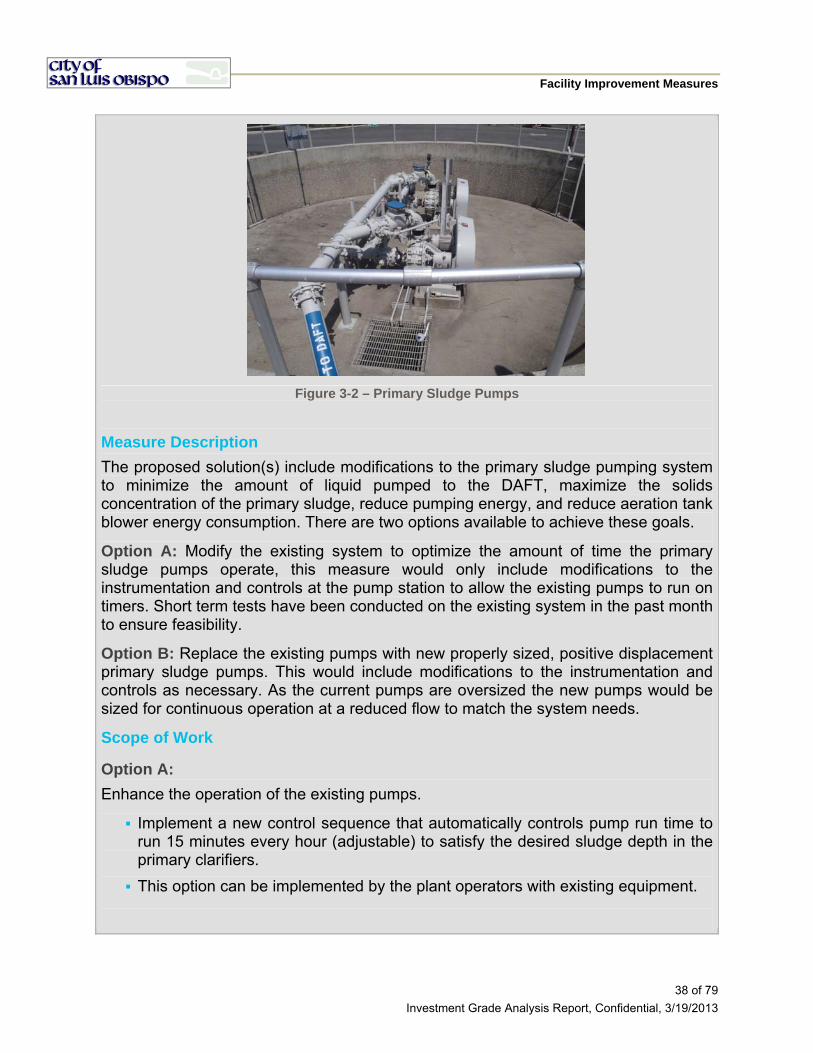
Figure 3-2 – Primary Sludge Pumps
Measure Description
The proposed solution(s) include modifications to the primary sludge pumping system to minimize the amount of liquid pumped to the DAFT, maximize the solids concentration of the primary sludge, reduce pumping energy, and reduce aeration tank blower energy consumption. There are two options available to achieve these goals.
Option A: Modify the existing system to optimize the amount of time the primary sludge pumps operate, this measure would only include modifications to the instrumentation and controls at the pump station to allow the existing pumps to run on timers. Short term tests have been conducted on the existing system in the past month to ensure feasibility.
Option B: Replace the existing pumps with new properly sized, positive displacement primary sludge pumps. This would include modifications to the instrumentation and controls as necessary. As the current pumps are oversized the new pumps would be sized for continuous operation at a reduced flow to match the system needs.
Scope of Work
Option A:
Enhance the operation of the existing pumps.
Implement a new control sequence that automatically controls pump run time to run 15 minutes every hour (adjustable) to satisfy the desired sludge depth in the primary clarifiers.
This option can be implemented by the plant operators with existing equipment.
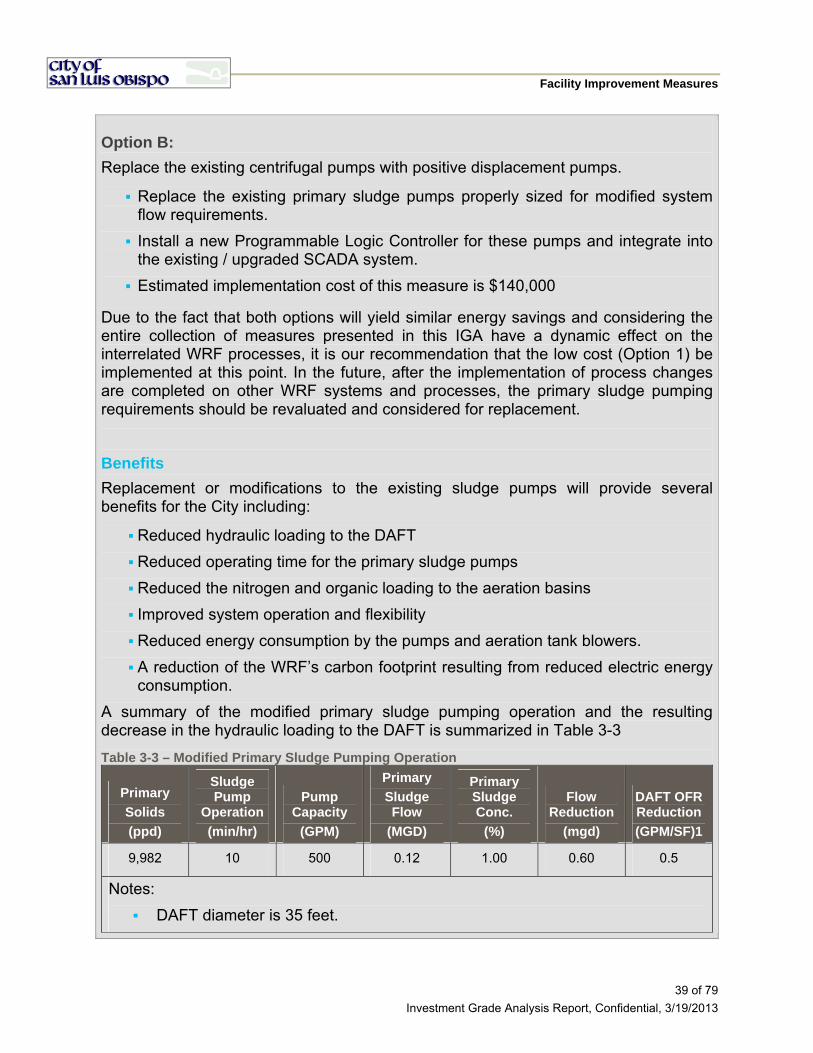
Facility Improvement Measures
39 of 79
Investment Grade Analysis Report, Confidential, 3/19/2013
Option B:
Replace the existing centrifugal pumps with positive displacement pumps.
Replace the existing primary sludge pumps properly sized for modified system flow requirements.
Install a new Programmable Logic Controller for these pumps and integrate into the existing / upgraded SCADA system.
Estimated implementation cost of this measure is $140,000
Due to the fact that both options will yield similar energy savings and considering the entire collection of measures presented in this IGA have a dynamic effect on the interrelated WRF processes, it is our recommendation that the low cost (Option 1) be implemented at this point. In the future, after the implementation of process changes are completed on other WRF systems and processes, the primary sludge pumping requirements should be revaluated and considered for replacement.
Benefits
Replacement or modifications to the existing sludge pumps will provide several benefits for the City including:
Reduced hydraulic loading to the DAFT
Reduced operating time for the primary sludge pumps
Reduced the nitrogen and organic loading to the aeration basins
Improved system operation and flexibility
Reduced energy consumption by the pumps and aeration tank blowers.
A reduction of the WRF’s carbon footprint resulting from reduced electric energy consumption.
A summary of the modified primary sludge pumping operation and the resulting decrease in the hydraulic loading to the DAFT is summarized in Table 3-3
Table 3-3 – Modified Primary Sludge Pumping Operation
Primary
Solids
(ppd)
Sludge Pump
Operation
(min/hr)
Pump Capacity
(GPM)
Primary
Sludge Flow
(MGD)
Primary Sludge Conc.
(%)
Flow Reduction
(mgd)
DAFT OFR Reduction
(GPM/SF)1
9,982 10 500 0.12 1.00 0.60 0.5
Notes:
DAFT diameter is 35 feet.

Facility Improvement Measures
40 of 79
Investment Grade Analysis Report, Confidential, 3/19/2013
In addition to the benefits to the DAFT mentioned previously, the decreased primary sludge volume will also impact the amount of aeration needed in the activated sludge process since the primary effluent flow bypassing the bio filter will be significantly reduced. A summary of the loading impacts and the subsequent decrease in aeration is summarized in Table 3-4.
Table 3-4 - Aeration Reductions from Primary Sludge Pumping Modification
Flow Reduction
(MGD)
Loading Reductions1,2 Oxygen Requirement Reductions
(ppd)
Aeration Reductions
BOD (ppd)
TKN (ppd) (SCF/day) (SCFM)
0.60 696 55 1,298 694,792 482
Notes:
Based on a 22 percent TKN reduction and 68 percent BOD removal rate in the bio filters.
Bio filter performance assumptions based on data from the Wastewater Master Plan (Brown & Caldwell, 2009).
Savings
We expect that implementation of this measure will result in pumping energy savings of 70,168 kWh/year and aeration blower energy savings of 117,036 kWh/year for a total energy savings of 186,021 kWh/year, equating to approximately $22,500.
WRF-4 – SOLIDS DE-WATERING
Existing Conditions
Following digestion, anaerobically stabilized primary and waste activated sludge flows to Digester three which is the smallest of the City’s three digesters. This digester is neither mixed nor heated and operates as a sludge holding tank to allow for consistent operation of the City’s mechanical dewatering operation. From the holding tank, sludge is pumped to an existing one-meter belt filter press which was built in 1965 and has been in service at the WRF since 1990 is housed in a metal building near the sludge drying beds. During the dry season, dewatered bio solids from the press are discharged to a City owned truck and applied to the sludge drying beds where they are allowed to further dry to a solids concentration between 60 and 70 percent. However, between October and May, dewatered cake is transported directly from the dewatering facility by the City’s contract hauler to an offsite location for further treatment and land application. Due to the amount of precipitation the WRF receives, the City cannot effectively dry the material in the beds for a majority of the year.
Based on discussions with City staff and information from the Wastewater Master

Facility Improvement Measures
41 of 79
Investment Grade Analysis Report, Confidential, 3/19/2013
Plan, the belt filter press produced a dewatered cake with a total solids concentration of approximately 16 percent in 2012. Also, due to the throughput of the unit, the City has designated a full-time operator to monitor and run the belt filter press. In order to increase the percent solids of the cake and improve solids capture, liquid polymer is added to the digested sludge prior to dewatering. Based on the operating cost data for polymer received from City staff, the existing polymer dose is approximately 30 active pounds per dry ton. A summary of the City’s existing dewatering practice is provided in Table 4.1.
Table 4.1 - Existing Solids Production and Belt Filter Press Performance
Solids Production
(dtpd)1
Solids Concentration
(%)1
Hauled Weight
(wtpd)
Polymer Dose
(lb/dt)2
Polymer Usage
(ppd)
3.34 16 21 30 101
Notes:
1. Based on information from the Wastewater Master Plan (Brown & Caldwell, 2009).
2. Based on annual polymer usage information obtained from City staff.
Measure Description
This measure includes installation of a new screw press to replace the existing belt filter press. The belt filter press is to remain operable and will provide redundancy for the City’s dewatering process. The cost to haul dewatered bio solids from the facility is a major component of the WRF’s annual operating budget. While the existing belt filter press produces a product with a total solids concentration of 16 percent, this level of dryness is low for a facility producing anaerobically digested primary and WAS. Therefore, this measure is intended to increase the performance of the WRF’s existing dewatering operation and minimize the amount of water the City pays to haul offsite. With this type of sludge, the City should be able to reliably produce a dewatered cake with a solids concentration in excess of 20 percent with a conventional technology such as a screw press. A screw press would also use less polymer to achieve a superior solids capture rate as compared to the belt filter press.
Scope of Work
This measure includes the construction of a new dewatering facility adjacent to the existing dewatering building. The new dewatering facility will be used under normal operating conditions, replacing the existing belt filter press and other aging ancillary facilities that have reached the end of their useful life. Based on preliminary discussions with City staff, and industry standards, the preferred technology is a
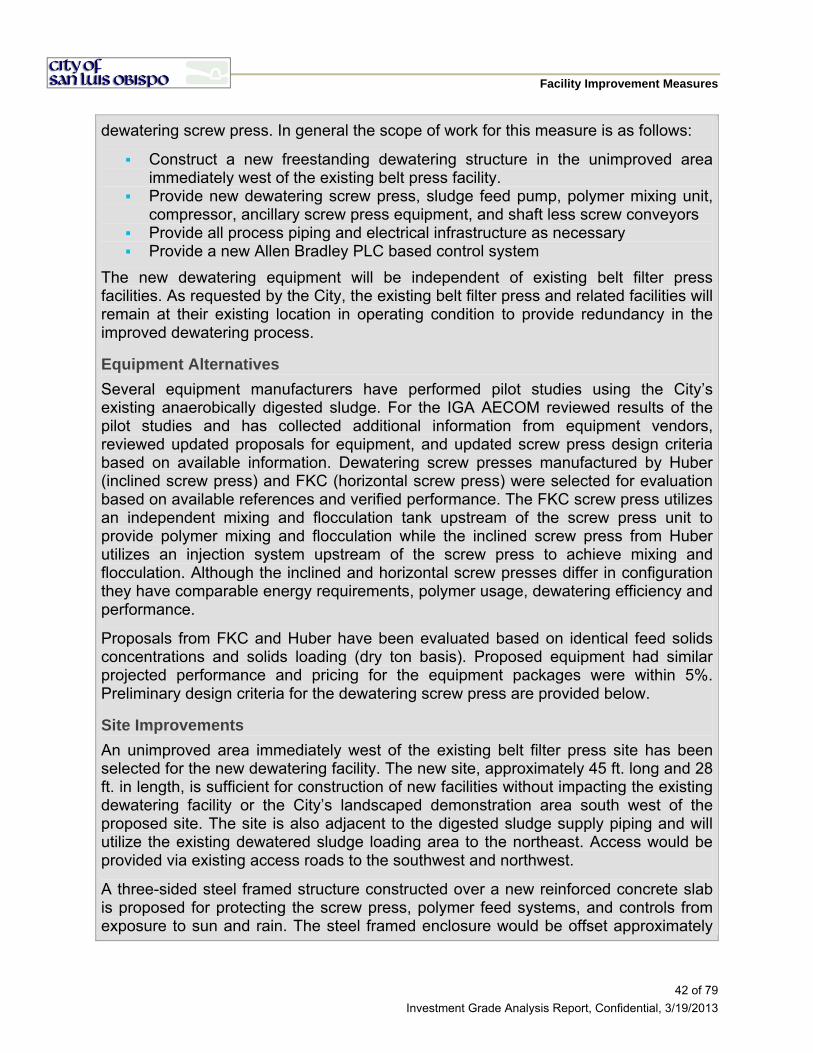
Facility Improvement Measures
42 of 79
Investment Grade Analysis Report, Confidential, 3/19/2013
dewatering screw press. In general the scope of work for this measure is as follows:
Construct a new freestanding dewatering structure in the unimproved area immediately west of the existing belt press facility.
Provide new dewatering screw press, sludge feed pump, polymer mixing unit, compressor, ancillary screw press equipment, and shaft less screw conveyors
Provide all process piping and electrical infrastructure as necessary Provide a new Allen Bradley PLC based control system
The new dewatering equipment will be independent of existing belt filter press facilities. As requested by the City, the existing belt filter press and related facilities will remain at their existing location in operating condition to provide redundancy in the improved dewatering process.
Equipment Alternatives
Several equipment manufacturers have performed pilot studies using the City’s existing anaerobically digested sludge. For the IGA AECOM reviewed results of the pilot studies and has collected additional information from equipment vendors, reviewed updated proposals for equipment, and updated screw press design criteria based on available information. Dewatering screw presses manufactured by Huber (inclined screw press) and FKC (horizontal screw press) were selected for evaluation based on available references and verified performance. The FKC screw press utilizes an independent mixing and flocculation tank upstream of the screw press unit to provide polymer mixing and flocculation while the inclined screw press from Huber utilizes an injection system upstream of the screw press to achieve mixing and flocculation. Although the inclined and horizontal screw presses differ in configuration they have comparable energy requirements, polymer usage, dewatering efficiency and performance.
Proposals from FKC and Huber have been evaluated based on identical feed solids concentrations and solids loading (dry ton basis). Proposed equipment had similar projected performance and pricing for the equipment packages were within 5%. Preliminary design criteria for the dewatering screw press are provided below.
Site Improvements
An unimproved area immediately west of the existing belt filter press site has been selected for the new dewatering facility. The new site, approximately 45 ft. long and 28 ft. in length, is sufficient for construction of new facilities without impacting the existing dewatering facility or the City’s landscaped demonstration area south west of the proposed site. The site is also adjacent to the digested sludge supply piping and will utilize the existing dewatered sludge loading area to the northeast. Access would be provided via existing access roads to the southwest and northwest.
A three-sided steel framed structure constructed over a new reinforced concrete slab is proposed for protecting the screw press, polymer feed systems, and controls from exposure to sun and rain. The steel framed enclosure would be offset approximately
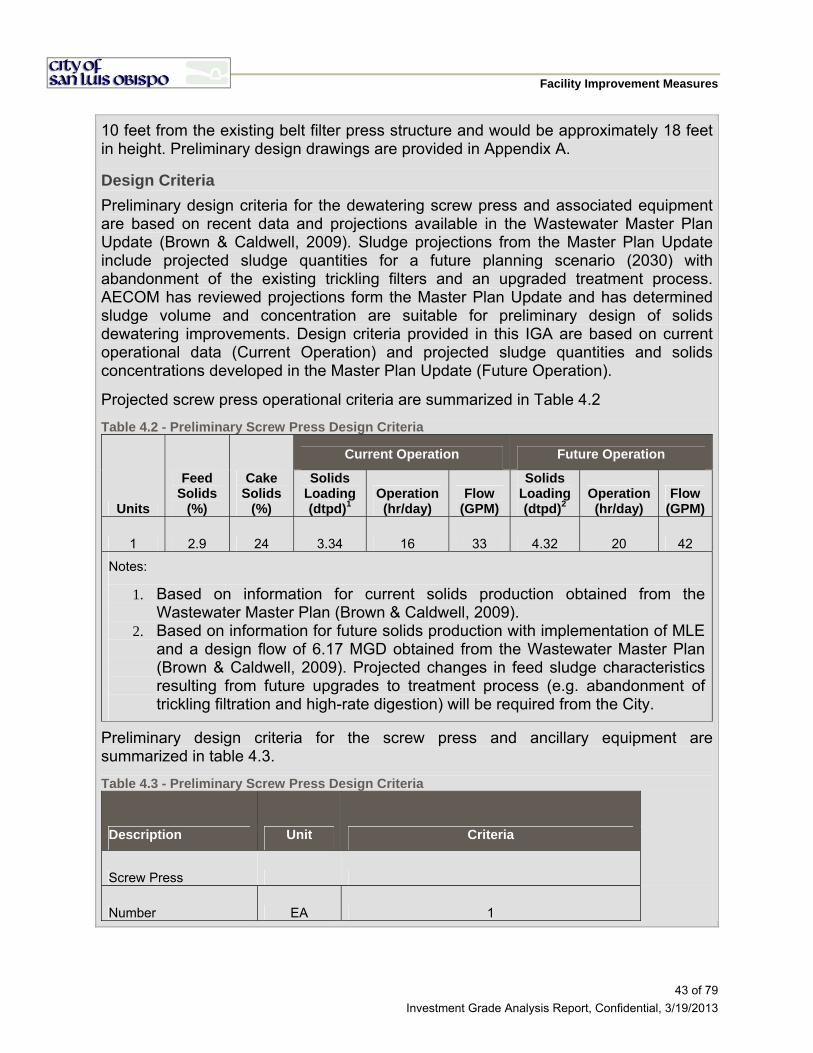
Facility Improvement Measures
43 of 79
Investment Grade Analysis Report, Confidential, 3/19/2013
10 feet from the existing belt filter press structure and would be approximately 18 feet in height. Preliminary design drawings are provided in Appendix A.
Design Criteria
Preliminary design criteria for the dewatering screw press and associated equipment are based on recent data and projections available in the Wastewater Master Plan Update (Brown & Caldwell, 2009). Sludge projections from the Master Plan Update include projected sludge quantities for a future planning scenario (2030) with abandonment of the existing trickling filters and an upgraded treatment process. AECOM has reviewed projections form the Master Plan Update and has determined sludge volume and concentration are suitable for preliminary design of solids dewatering improvements. Design criteria provided in this IGA are based on current operational data (Current Operation) and projected sludge quantities and solids concentrations developed in the Master Plan Update (Future Operation).
Projected screw press operational criteria are summarized in Table 4.2
Table 4.2 - Preliminary Screw Press Design Criteria
Units
Feed Solids
(%)
Cake Solids
(%)
Current Operation Future Operation
Solids Loading (dtpd)1
Operation (hr/day)
Flow (GPM)
Solids Loading (dtpd)2
Operation (hr/day)
Flow (GPM)
1 2.9 24 3.34 16 33 4.32 20 42
Notes:
1. Based on information for current solids production obtained from the Wastewater Master Plan (Brown & Caldwell, 2009).
2. Based on information for future solids production with implementation of MLE and a design flow of 6.17 MGD obtained from the Wastewater Master Plan (Brown & Caldwell, 2009). Projected changes in feed sludge characteristics resulting from future upgrades to treatment process (e.g. abandonment of trickling filtration and high-rate digestion) will be required from the City.
Preliminary design criteria for the screw press and ancillary equipment are summarized in table 4.3.
Table 4.3 - Preliminary Screw Press Design Criteria
Description Unit Criteria
Screw Press
Number EA 1

Facility Improvement Measures
44 of 79
Investment Grade Analysis Report, Confidential, 3/19/2013
Type -- Inclined or horizontal dewatering screw press
Service Description -- Anaerobically digested and thickened sludge
Manufacturer -- Huber or Equal
Average Design Solids Feed Concentration % 2.9
Solids Capacity lb/ hr 490 – 600
Capture % 95
Cake solids % 23
Comment --
Dewatering equipment including screw press, sludge feed pump, polymer preparation and feed, conveyor, and controls to be provided as one package by manufacturer.
Polymer Feed
Number EA 1
Manufacturer -- Provided by Mfg., Velodyne or equal
Sludge Feed Pump
Number EA 1
Type -- Progressive cavity
Manufacturer -- Provided by Mfg., Seepex or equal
Capacity GPM 25 - 80
Comment -- Allow turn-down to accommodate lower feed
rate resulting from thicker feed sludge
Conveyor
Number EA 1
Type -- Shaft less screw
Length (approx) ft 28
Diameter in 12

Facility Improvement Measures
45 of 79
Investment Grade Analysis Report, Confidential, 3/19/2013
Benefits
Use of a new screw press for dewatering in-place of the existing belt filter press will provide the following benefits to the City:
Reduced hauling cost from production of a drier bio solids cake;
Reduced operating cost from a reduction in polymer usage;
Reduced maintenance costs from replacement of the existing belt filter press with a new screw press with lower maintenance requirements; and
Reduced operations needs due to the screw presses ability to run unattended.
A summary of the reduced hauling requirements and polymer usage due to replacement of the belt filter press with a screw press is provided in Table 4.4.
Table 4.4 – Estimated Screw Press Performance
Solids Production
(dtpd)1
Solids Concentration
(%)2
Hauled Weight
(wtpd)
Polymer Dose
(lb/dt)2
Polymer Usage
(ppd)
3.34 24 14 20 67
Notes:
1. Based on information from the Wastewater Master Plan (Brown & Caldwell, 2009).
2. Based on preliminary screw press performance data from a Huber pilot test held in May 2010.
Savings
1. We expect that implementation of this measure will result in significant operational cost reductions including $16,000/year for reduced polymer usage and $80,000/year in reduced solids hauling costs. While we expect insignificant electrical energy savings for this measure, there will be a significant amount operator time that can be reallocated to benefit to the WRF. In addition the City will eliminate the need for a $150,000 expenditure that is currently budgeted for upgrades over the next year as well as eliminating $995,000 in future capital expenditure for needed solids dewatering capacity expansion as outlined in the WRF master plan (Brown & Caldwell, 2009).
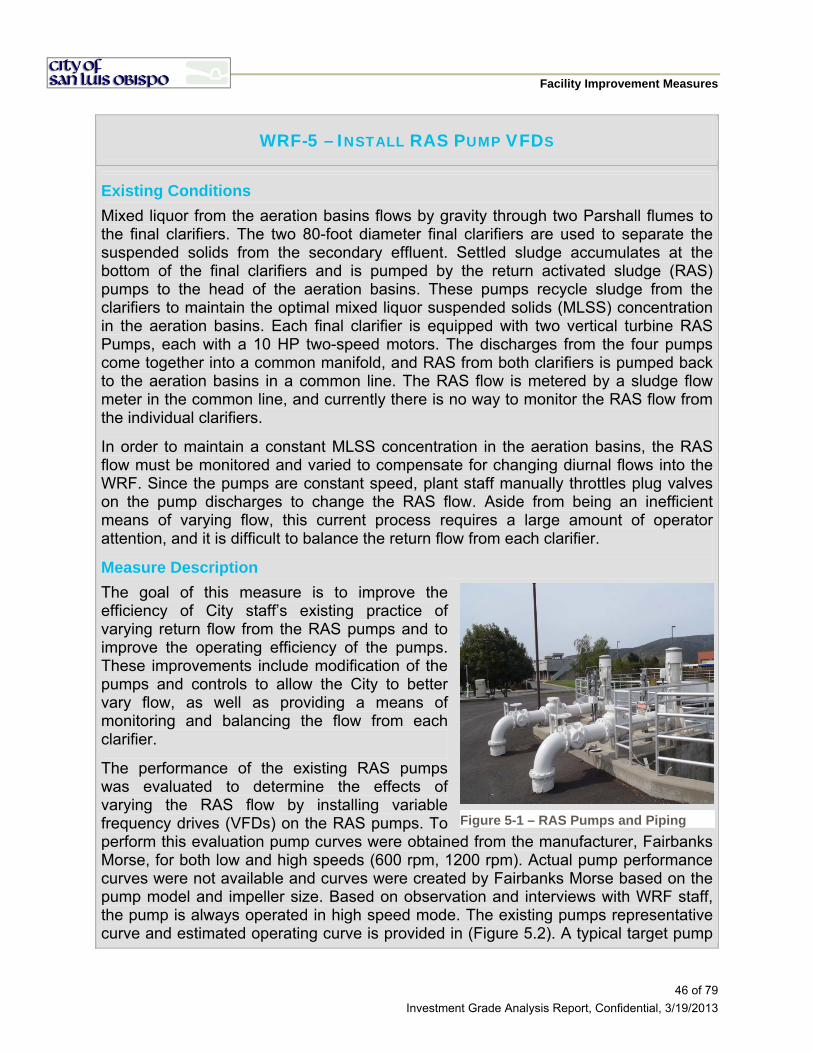
Facility Improvement Measures
46 of 79
Investment Grade Analysis Report, Confidential, 3/19/2013
WRF-5 – INSTALL RAS PUMP VFDS
Existing Conditions
Mixed liquor from the aeration basins flows by gravity through two Parshall flumes to the final clarifiers. The two 80-foot diameter final clarifiers are used to separate the suspended solids from the secondary effluent. Settled sludge accumulates at the bottom of the final clarifiers and is pumped by the return activated sludge (RAS) pumps to the head of the aeration basins. These pumps recycle sludge from the clarifiers to maintain the optimal mixed liquor suspended solids (MLSS) concentration in the aeration basins. Each final clarifier is equipped with two vertical turbine RAS Pumps, each with a 10 HP two-speed motors. The discharges from the four pumps come together into a common manifold, and RAS from both clarifiers is pumped back to the aeration basins in a common line. The RAS flow is metered by a sludge flow meter in the common line, and currently there is no way to monitor the RAS flow from the individual clarifiers.
In order to maintain a constant MLSS concentration in the aeration basins, the RAS flow must be monitored and varied to compensate for changing diurnal flows into the WRF. Since the pumps are constant speed, plant staff manually throttles plug valves on the pump discharges to change the RAS flow. Aside from being an inefficient means of varying flow, this current process requires a large amount of operator attention, and it is difficult to balance the return flow from each clarifier.
Measure Description
The goal of this measure is to improve the efficiency of City staff’s existing practice of varying return flow from the RAS pumps and to improve the operating efficiency of the pumps. These improvements include modification of the pumps and controls to allow the City to better vary flow, as well as providing a means of monitoring and balancing the flow from each clarifier.
The performance of the existing RAS pumps was evaluated to determine the effects of varying the RAS flow by installing variable frequency drives (VFDs) on the RAS pumps. To perform this evaluation pump curves were obtained from the manufacturer, Fairbanks Morse, for both low and high speeds (600 rpm, 1200 rpm). Actual pump performance curves were not available and curves were created by Fairbanks Morse based on the pump model and impeller size. Based on observation and interviews with WRF staff, the pump is always operated in high speed mode. The existing pumps representative curve and estimated operating curve is provided in (Figure 5.2). A typical target pump
Figure 5-1 – RAS Pumps and Piping
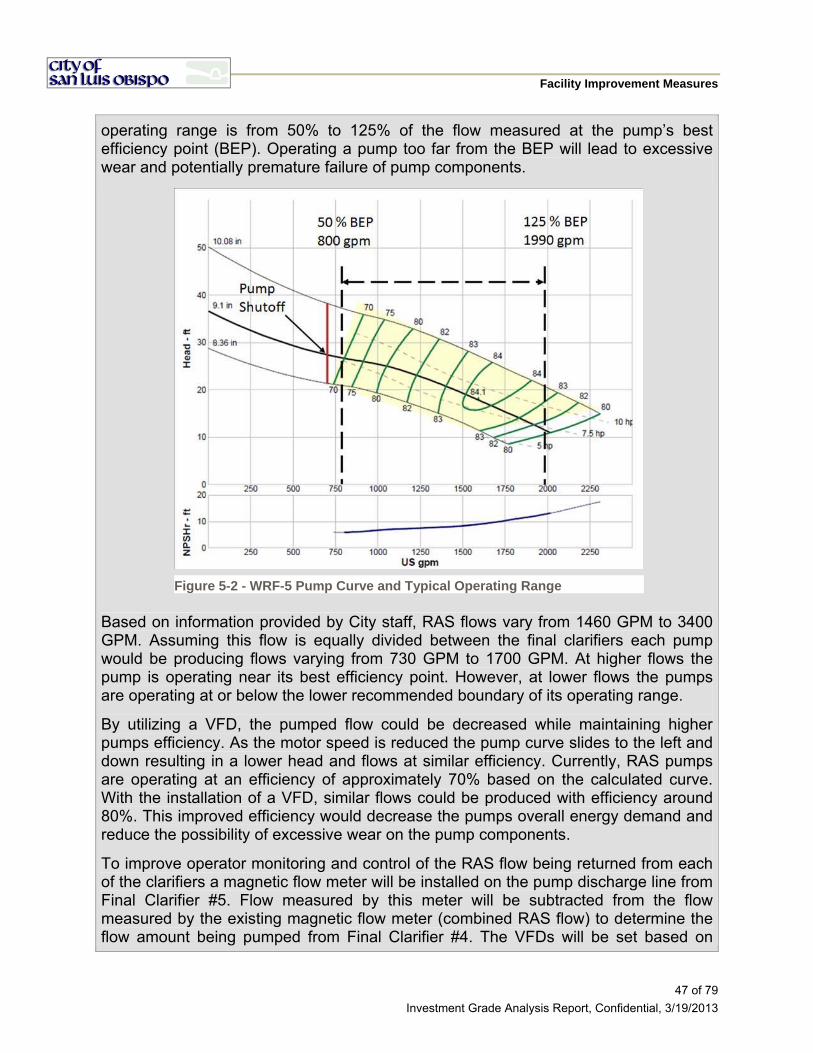
Facility Improvement Measures
47 of 79
Investment Grade Analysis Report, Confidential, 3/19/2013
operating range is from 50% to 125% of the flow measured at the pump’s best efficiency point (BEP). Operating a pump too far from the BEP will lead to excessive wear and potentially premature failure of pump components.
Based on information provided by City staff, RAS flows vary from 1460 GPM to 3400 GPM. Assuming this flow is equally divided between the final clarifiers each pump would be producing flows varying from 730 GPM to 1700 GPM. At higher flows the pump is operating near its best efficiency point. However, at lower flows the pumps are operating at or below the lower recommended boundary of its operating range.
By utilizing a VFD, the pumped flow could be decreased while maintaining higher pumps efficiency. As the motor speed is reduced the pump curve slides to the left and down resulting in a lower head and flows at similar efficiency. Currently, RAS pumps are operating at an efficiency of approximately 70% based on the calculated curve. With the installation of a VFD, similar flows could be produced with efficiency around 80%. This improved efficiency would decrease the pumps overall energy demand and reduce the possibility of excessive wear on the pump components.
To improve operator monitoring and control of the RAS flow being returned from each of the clarifiers a magnetic flow meter will be installed on the pump discharge line from Final Clarifier #5. Flow measured by this meter will be subtracted from the flow measured by the existing magnetic flow meter (combined RAS flow) to determine the flow amount being pumped from Final Clarifier #4. The VFDs will be set based on
Figure 5-2 - WRF-5 Pump Curve and Typical Operating Range
Facility Improvement Measures
48 of 79
Investment Grade Analysis Report, Confidential, 3/19/2013
these readings and the desired RAS flow rate. The VFD adjustments will normally be performed automatically through the plant’s SCADA system relative to the plant flow with the ability to also be set manually.
Scope of Work
In order to accommodate the goals of the this measure, AECOM will make the following modifications to the RAS Pumps and distribution piping:
Replace the existing pump motors with inverter rated motors; Addition of VFDs to the existing RAS pump motors Installation of a magnetic flow meter on the RAS discharge piping from Final
Clarifier #5; Modifications to the instrumentation and controls to allow the speed of the RAS
pumps to vary automatically with the influent flow to the WRF; Installation of a digital gauge displaying the flow rate of the existing flow meter.
New RAS Pump Motors
To allow the use of VFDs, new inverter rated, 10 hp motors will be installed on existing pumps and the local control switch (Slow/Fast) will be removed. The existing motors are not inverter rated and could be mechanically harmed by VFDs. It is preferred these motors be replaced, especially considering the existing motor age (20 years)
VFDs
The VFDs for each of the pumps will be installed within the Switchgear Building and will be connected to the existing motor controls for the RAS pumps.
Magnetic Flow Meter
Electromagnetic flow meters require sufficient distance from adjacent fittings to provide uniform flow through the meter. Sufficient room is not available at the existing pump manifold prior to the line turning down and running underground. The new flow meter will be placed in a precast concrete vault between the discharge manifold and the connection to the RAS from Final Clarifier #4.
After the RAS pumping system has been modified, the speed of the RAS pumps will modulate to maintain the desired flow set point in the RAS magnetic flow meters (existing and new). The RAS flow set point will automatically change based on a flow signal from the influent flow meter, and will be adjusted as a percentage of the influent flow.
Benefits
The modifications to the RAS system will improve the operating efficiency of the existing RAS pumps, reduce the potential for pump damage due to operating at or below the recommend operating range, and will provide the City with better process control with less operator attention. Although the actual energy savings calculated as a result of improving the pump efficiency is minimal, this ECM will allow the City to

Facility Improvement Measures
49 of 79
Investment Grade Analysis Report, Confidential, 3/19/2013
allocate staff time to tasks other than monitoring and adjusting the RAS pumping operation.
Savings
The greatest amount of energy savings anticipated through use of a VFD occurs when pumps are set at lower flow or when the pumps efficiency is near 70%. To provide an estimated energy savings it was assumed that the pumps operated at this level for approximately a third of the operating hours throughout the year, and that the VFD would allow the pump to operate near its BEP (84%). This results in pumping energy savings of 855 kWh/year. At current utility rates, this would equate to a savings of approximately $107 per year.
Additional energy savings are anticipated through the improved biological process in the aeration basins (e.g. reduced blower requirements, etc.).
WRF-6 – FILTER TOWER UPGRADES
Existing Conditions
The WRF final filtration system includes four separate filter cells (Filter 1-4) that receive wastewater from the equalization tanks though the filter influent channel and discharge though the backwash diversion box. The function of the WRF’s filter system is to reduce turbidity and color of the wastewater to in order satisfy stringent discharge permit requirements. The filtration system is primarily controlled by two packaged Leopold control consoles which
were supplied as part of the original filter structure installation, approximately 19 years ago. This control system is critical for monitoring key parameters of the filtration system as well as performing automated functioning such as backwashing the filters at the least costly time (during off peak hours) when staffing is limited at the facility.
Within the last few years the staff has been experiencing frequent problems with the system and its components. Currently this system cannot reliably perform complete automatic control of the filters due to failed control panel components that are no longer available and cannot be replaced in kind. Filter 1 and Filter 2 are controlled by Filter Control Panel FLZ 140, and Filter 3 and Filter 4 are controlled by Filter Control Panel FLZ 240. These control panels also control the filter backwash system that serves all four filter cells. The filter backwash system cleans the filter media with air
Figure 6.1 – Existing Filter Control Panel
Facility Improvement Measures
50 of 79
Investment Grade Analysis Report, Confidential, 3/19/2013
and water multiple times daily or as needed. The backwash system consists of two, parallel, two-speed, 40HP backwash pumps and two 50HP backwash air blowers (a lead and a standby).One consequence of the problems with the filter control panels is that the WRF operators must manually initiate backwash operations which cause the backwash cycles to occur during higher cost peak or part-peak utility rate periods. An additional issue related to the aging control panels is that WRF operations and maintenance personnel must regularly devote time to manually operating, troubleshooting and repairing the controls to ensure proper system operation.
During the observation and evaluation of the filter/backwash operations, the City independently hired Leopold to evaluate the filter media and produce a report of their findings (Refer to Appendix A). As with the controls, the filter media has been in service for 19 years. This type of media has a useful service life of 5 to 8 years. Noted in the report is that the current media experienced some degradation and will require replacement.
Measure Description
The solution initially conceived during the preliminary analysis was to provide VFDs and new motors (if needed) for the backwash pumps which would be connected to and controlled by the existing control system. This concept was to provide operator scheduling to automatically initiate the backwash operations, soft starting of the backwash pumps and controlling the desired backwash flow rate by varying the speed of backwash pumps versus modulating a control valve.
In consideration of the age, issues currently experienced with the filter control system and the state of the existing filter media, our recommendation is for a wholesale replacement of the existing control system and filter media. This would include wholesale replacement of the existing control system complete with new control consoles, PLC controllers, instrumentation (other than the existing effluent mag meters and the turbidity meters) and the addition of VFDs on the backwash filter pumps. The existing filter media will be replaced with new more efficient mono-media silica sand in addition the filter bottom under drain will be rep-laces with new S-Type under drain with integral IMS Cap.
Scope of Work
Replace the existing control system
Install two new Leopold Dual Filter Control panels in the filter structure towers complete with touch screen operator interface as well as manual override switches to provide the ability for an operator to initiate filter operations as needed.
Install Allen Bradley Compact Logix series PLC as the basis for all automated monitoring, scheduling, sequencing and interface
Install two (2) new VFDs on each backwash pump.
Install four (4) new ultrasonic filter level probes (one for each filter bay).

Facility Improvement Measures
51 of 79
Investment Grade Analysis Report, Confidential, 3/19/2013
Install four (4) new differential pressure sensors (one for each filter bay)
Integrate new controls with proposed SCADA system upgrades
Implement control strategies to automatically initiate backwash operations and control the backwash flow rate using the backwash pump VFDs.
Provide factory start up and operator training.
Remove existing dual media each filter cell (4 total).
Remove the existing filter under drain
Provide and install in each filter cell (4 total) new updated dual/ parallel lateral type under drain with integral media retainer.
Provide and install for each filter cell (4 total) with new mono-media silica sand.
Provide factory trained supervision on the new under drain and media installation.
Benefits
The expected benefits for this measure include:
Increased reliability of the filter controls
A reduction in the time required by WRF personnel to manage and operate the backwash system.
Improved visibility of the backwash controls via the SCADA system.
Reduced filter backwash flow requirement
Reduced filter backwash run time
Reduced electrical demand, energy consumption and related costs for the backwash system.
Expand the current filter capacity from 5.1MGD to approximately 8 MGD which will eliminate the need for costly future filter building expansion
Provides the option for future upgrades to add a de-nitrification system to meet future regulations
Savings
The expected savings for this measure are approximately $2,700/year in utility costs as well as an estimated $30,000 annual O&M savings based on a reduction in time required for WRF personnel to maintain and operate the backwash system. In addition the City will eliminate the need for an $185,100 expenditure that is currently budgeted for upgrades over the next two year as well as eliminating $3,147,000 in future capital expenditure for needed filter tower capacity expansion as outlined in WRF master plan (Brown & Caldwell, 2009).
Facility Improvement Measures
52 of 79
Investment Grade Analysis Report, Confidential, 3/19/2013
WRF-7 – AERATION TANK AIR PRESSURE RESET CONTROLS
Existing Conditions
The compressed air for the aeration tanks (AT) is provided by a set of three existing blowers. A 200hp Turblex blower that was installed in 2004-2005 timeframe is used as the primary source of compressed air for the aeration tanks. There are two older 250hp Lampson blowers which are generally used to back up the Turblex blower as needed. The WRF operations staff indicated that the Turblex blower is typically sufficient to supply the aeration needs of the ATs except on rare occasions.
Our review of the original as-builts including process and instrumentation diagrams for the ATs indicates that the blowers are controlled to satisfy a discharge header pressure set-point. In addition the control logic describes a most open valve sequence that monitors the header valve positions in each basin and resets the header pressure set point to maintain the most open valve position.
The site has been experiencing issues with the integration of the header control valves to the PLC that controls the aeration bays which does not allow the site to utilize the most open valve sequence. Currently the system is operating with a fixed header pressure and does not utilize the most open valve sequence.
Measure Description
The concept of this measure is to modify or replace the existing valve controllers to allow for integration into the existing PLC control system. Once complete, a most open valve sequence would be enabled to automatically adjust the discharge header pressure set-point based on the real-time valve position. This sequence decreases the header pressure set-point as the most open valve position decreases reducing the blower energy consumption while maintaining proper dissolved oxygen levels in each bay. The header set point will be reset between a 6.9 and 8.0 PSI depending on demand. The current set-point which is manually set by the operators is relatively high to ensure system performance meets high demand conditions. With this current configuration there is an opportunity to reduce the set-point for periods of lower demand which will reduce the required blower power input.
Scope of Work
Modify the existing valve controllers or PLC interface as necessary to integrate to the blower master control panel PLC
Add and modify programming to enable the most open valve and pressure reset sequence.
Benefits
We expect that this ECM will:
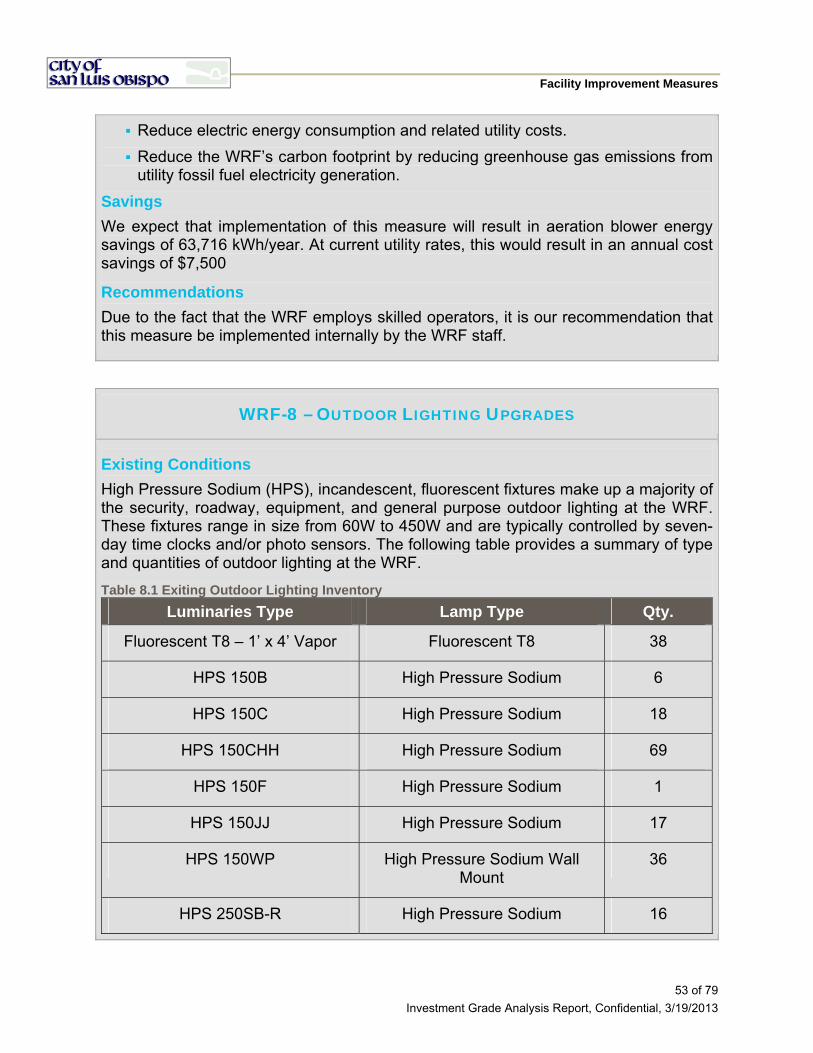
Facility Improvement Measures
53 of 79
Investment Grade Analysis Report, Confidential, 3/19/2013
Reduce electric energy consumption and related utility costs.
Reduce the WRF’s carbon footprint by reducing greenhouse gas emissions from utility fossil fuel electricity generation.
Savings
We expect that implementation of this measure will result in aeration blower energy savings of 63,716 kWh/year. At current utility rates, this would result in an annual cost savings of $7,500
Recommendations
Due to the fact that the WRF employs skilled operators, it is our recommendation that this measure be implemented internally by the WRF staff.
WRF-8 – OUTDOOR LIGHTING UPGRADES
Existing Conditions
High Pressure Sodium (HPS), incandescent, fluorescent fixtures make up a majority of the security, roadway, equipment, and general purpose outdoor lighting at the WRF. These fixtures range in size from 60W to 450W and are typically controlled by seven-day time clocks and/or photo sensors. The following table provides a summary of type and quantities of outdoor lighting at the WRF.
Table 8.1 Exiting Outdoor Lighting Inventory
Luminaries Type Lamp Type Qty.
Fluorescent T8 – 1’ x 4’ Vapor Fluorescent T8 38
HPS 150B High Pressure Sodium 6
HPS 150C High Pressure Sodium 18
HPS 150CHH High Pressure Sodium 69
HPS 150F High Pressure Sodium 1
HPS 150JJ High Pressure Sodium 17
HPS 150WP High Pressure Sodium Wall Mount
36
HPS 250SB-R High Pressure Sodium 16
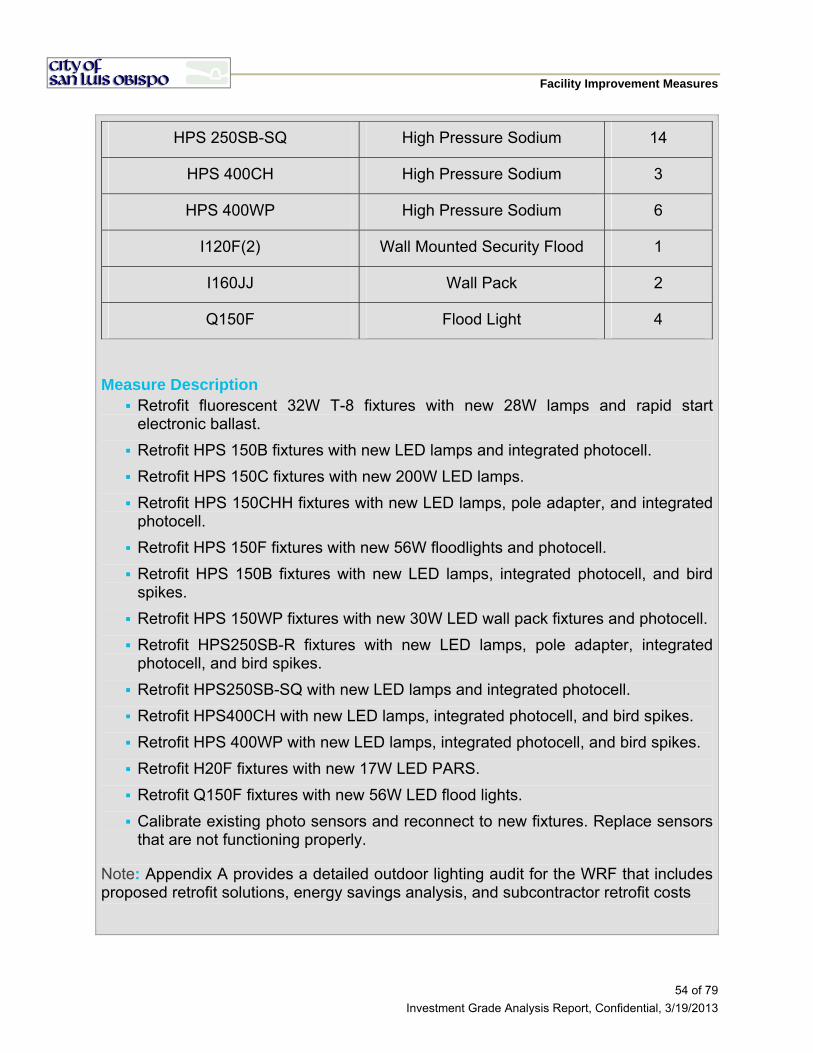
Facility Improvement Measures
54 of 79
Investment Grade Analysis Report, Confidential, 3/19/2013
HPS 250SB-SQ High Pressure Sodium 14
HPS 400CH High Pressure Sodium 3
HPS 400WP High Pressure Sodium 6
I120F(2) Wall Mounted Security Flood 1
I160JJ Wall Pack 2
Q150F Flood Light 4
Measure Description Retrofit fluorescent 32W T-8 fixtures with new 28W lamps and rapid start
electronic ballast.
Retrofit HPS 150B fixtures with new LED lamps and integrated photocell.
Retrofit HPS 150C fixtures with new 200W LED lamps.
Retrofit HPS 150CHH fixtures with new LED lamps, pole adapter, and integrated photocell.
Retrofit HPS 150F fixtures with new 56W floodlights and photocell.
Retrofit HPS 150B fixtures with new LED lamps, integrated photocell, and bird spikes.
Retrofit HPS 150WP fixtures with new 30W LED wall pack fixtures and photocell.
Retrofit HPS250SB-R fixtures with new LED lamps, pole adapter, integrated photocell, and bird spikes.
Retrofit HPS250SB-SQ with new LED lamps and integrated photocell.
Retrofit HPS400CH with new LED lamps, integrated photocell, and bird spikes.
Retrofit HPS 400WP with new LED lamps, integrated photocell, and bird spikes.
Retrofit H20F fixtures with new 17W LED PARS.
Retrofit Q150F fixtures with new 56W LED flood lights.
Calibrate existing photo sensors and reconnect to new fixtures. Replace sensors that are not functioning properly.
Note: Appendix A provides a detailed outdoor lighting audit for the WRF that includes proposed retrofit solutions, energy savings analysis, and subcontractor retrofit costs

Facility Improvement Measures
55 of 79
Investment Grade Analysis Report, Confidential, 3/19/2013
Benefits
LED lighting provides a much better efficacy (lumens / Watt) than HPS and fluorescent fixtures. Additionally, LED fixtures have a much longer expected operating life span (over twice that of HPS).
Savings
We expect that implementation of this measure will result in an estimated reduction of electric energy consumption of 90,146 kWh/year and reduced demand of 25kW (mainly during off peak utility periods), equating to a reduced cost of approximately $10,908. In addition approximately $8,000 in annual O&M savings will realized based on a 10% annual failure rate of the existing fixtures. Due to the fact that the WRF employs skilled operators, it is our recommendation that this measure be implemented internally by the WRF staff.
WRF-9 – UPGRADE SCADA SYSTEMS
Existing Conditions
The WRF currently experiences significant operational difficulties as a result of the age and condition of the existing SCADA and communication system. These issues are primarily associated with the following:
Existing communication system topology and communication media (radio) at the WRF.
Lack of automatic and/or remote control capabilities of some of the process equipment.
Insufficient trending, archiving, and reporting capabilities associated with the outdated SCADA system.
Mismatch of obsolescence of control and communication platforms
Currently due to the inefficient communication platform, multiple system alarms tend to “stack up” even though the initial cause of the alarm may have been corrected. This is costly to the City, as operators may be called out a second time (often at night) to respond to an alarm that has already been rectified. Additionally, due to the non-specific nature of how the alarms are presented in the current system, staff has no way of assessing if the alarm received has already been addressed. The installation of a fiber-optic backbone, which the City is currently pursuing, will allow the City to eliminate the radio-based communication system, and will allow the WRF to be integrated into the City-wide network. This is expected to alleviate some operational issues, and will allow other City staff to review and trend WRF data from other remote locations. The City is already moving forward with this important project, thus we have
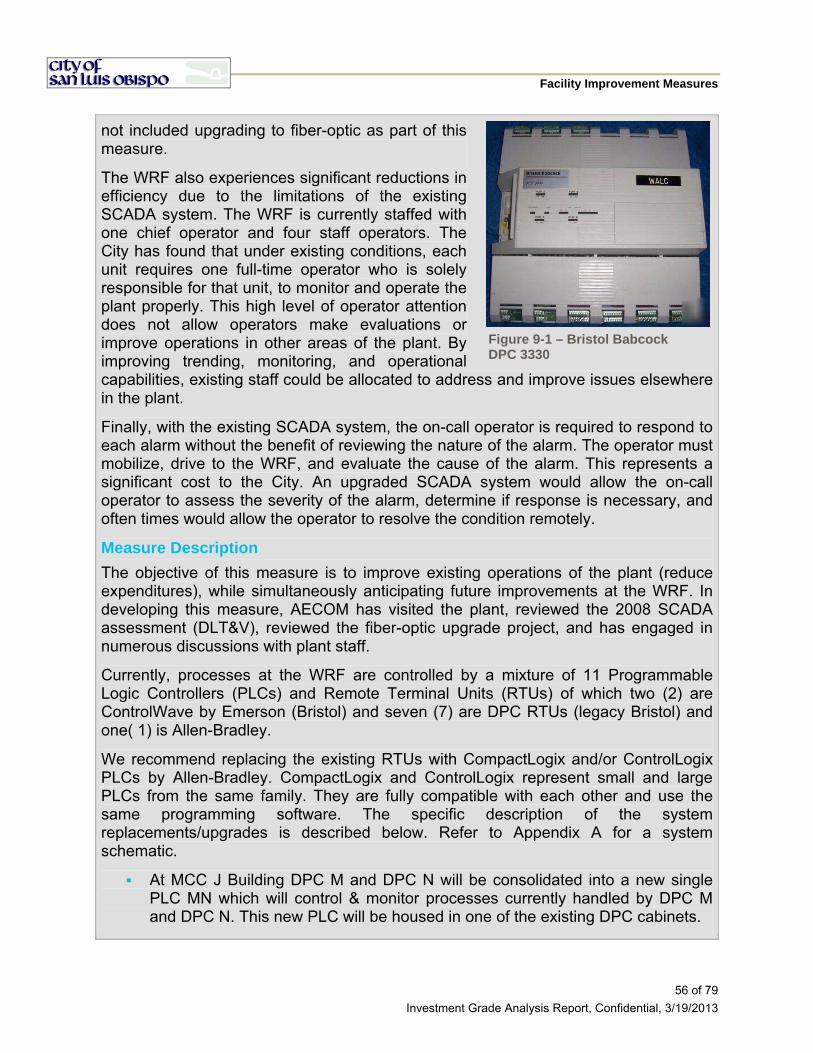
Facility Improvement Measures
56 of 79
Investment Grade Analysis Report, Confidential, 3/19/2013
not included upgrading to fiber-optic as part of this measure.
The WRF also experiences significant reductions in efficiency due to the limitations of the existing SCADA system. The WRF is currently staffed with one chief operator and four staff operators. The City has found that under existing conditions, each unit requires one full-time operator who is solely responsible for that unit, to monitor and operate the plant properly. This high level of operator attention does not allow operators make evaluations or improve operations in other areas of the plant. By improving trending, monitoring, and operational capabilities, existing staff could be allocated to address and improve issues elsewhere in the plant.
Finally, with the existing SCADA system, the on-call operator is required to respond to each alarm without the benefit of reviewing the nature of the alarm. The operator must mobilize, drive to the WRF, and evaluate the cause of the alarm. This represents a significant cost to the City. An upgraded SCADA system would allow the on-call operator to assess the severity of the alarm, determine if response is necessary, and often times would allow the operator to resolve the condition remotely.
Measure Description
The objective of this measure is to improve existing operations of the plant (reduce expenditures), while simultaneously anticipating future improvements at the WRF. In developing this measure, AECOM has visited the plant, reviewed the 2008 SCADA assessment (DLT&V), reviewed the fiber-optic upgrade project, and has engaged in numerous discussions with plant staff.
Currently, processes at the WRF are controlled by a mixture of 11 Programmable Logic Controllers (PLCs) and Remote Terminal Units (RTUs) of which two (2) are ControlWave by Emerson (Bristol) and seven (7) are DPC RTUs (legacy Bristol) and one( 1) is Allen-Bradley.
We recommend replacing the existing RTUs with CompactLogix and/or ControlLogix PLCs by Allen-Bradley. CompactLogix and ControlLogix represent small and large PLCs from the same family. They are fully compatible with each other and use the same programming software. The specific description of the system replacements/upgrades is described below. Refer to Appendix A for a system schematic.
At MCC J Building DPC M and DPC N will be consolidated into a new single PLC MN which will control & monitor processes currently handled by DPC M and DPC N. This new PLC will be housed in one of the existing DPC cabinets.
Figure 9-1 – Bristol Babcock DPC 3330

Facility Improvement Measures
57 of 79
Investment Grade Analysis Report, Confidential, 3/19/2013
At the Main Switchgear Building DPC F and DPC FA will be consolidated into a new single PLC FA which will control & monitor processes currently handled by DPC A and DPC FA. This new PLC will be housed in one of the existing DPC cabinets.
Existing TURBLEX (PLC-T) which is currently an Allen-Bradley SLC 504 will be upgraded with an Ethernet-compatible CPU 505. Known as “PLC T” it will interface with the SCADA via fiber optic network.
Existing DPC-P, DPC-B, and DPC-G will be replaced with new PLCs in their current locations.
The Filter tower controllers( K-1 and K-2) will be replaced as part of the Filter tower upgrades
In addition to replacing and modification of existing PLCs/RTUs, SCADA upgrade will also include interface with packaged controls (PLCs which will come with new or modified processes or equipment). They include:
− Headworks Screen (PLC D)
− Screw Press (PLC E)
− Filters Controls (PLC K1 and PLC K2)
− Cogeneration System (PLC S)
All of the upgraded PLC will interface with the site wide SCADA system via the new fiber optic network that is being installed under a separate City contract.
Existing Data Concentrator (Bristol ControlWave PLC) will be not required for the new SCADA and could be dismantled after complete system integration.
Measure Benefits
The benefits of this measure include:
Providing a robust facility wide SCADA system that will utilize the planned fiber backbone to centralize the communication and control of multiple complex systems at the WRF.
Reducing overtime costs by allowing staff and on-call operator to assess and resolve minor issues remotely (without having to mobilize to the WRF).
Optimize many critical functions while reducing staffing requirements for “manual operation” thus allowing staff to be allocated to address and improve issues elsewhere in the plant.
Providing critical process information to evaluate and improve process operations and efficiency.
Providing history and trending data to City staff (outside WRF).
Providing a PLC and associated communication specification for future upgrades or expansion which will save the costs incurred by integrating mismatched
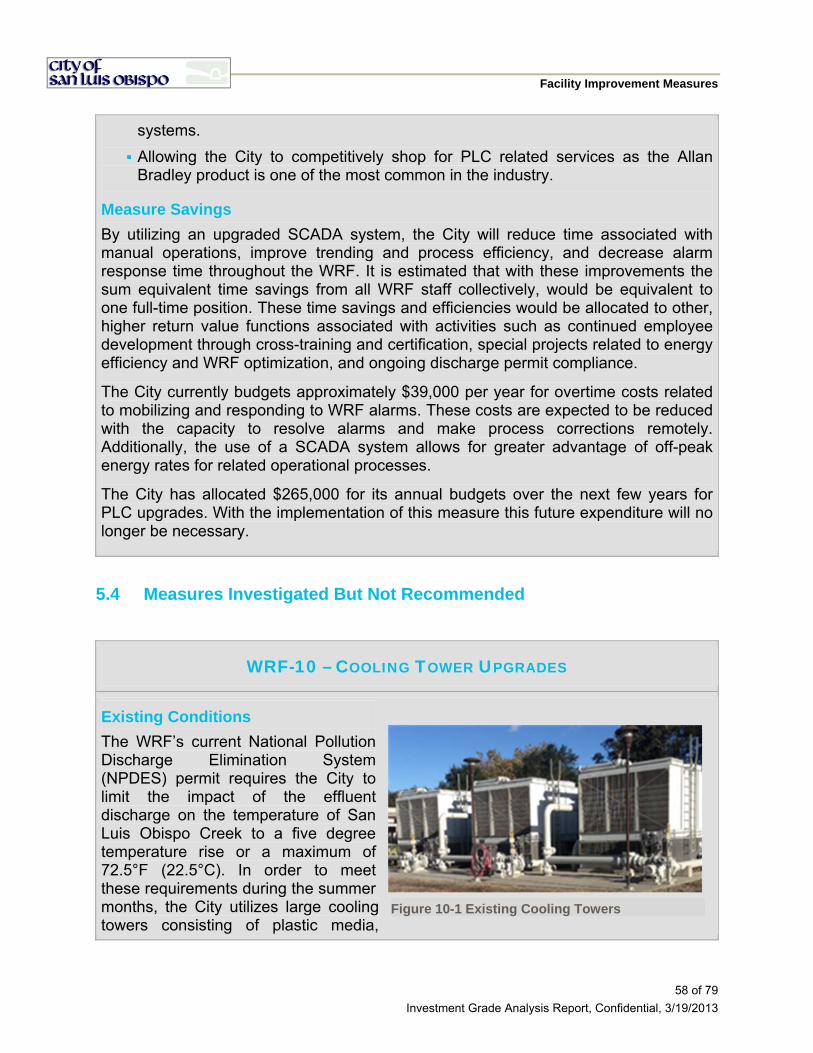
Facility Improvement Measures
58 of 79
Investment Grade Analysis Report, Confidential, 3/19/2013
systems.
Allowing the City to competitively shop for PLC related services as the Allan Bradley product is one of the most common in the industry.
Measure Savings
By utilizing an upgraded SCADA system, the City will reduce time associated with manual operations, improve trending and process efficiency, and decrease alarm response time throughout the WRF. It is estimated that with these improvements the sum equivalent time savings from all WRF staff collectively, would be equivalent to one full-time position. These time savings and efficiencies would be allocated to other, higher return value functions associated with activities such as continued employee development through cross-training and certification, special projects related to energy efficiency and WRF optimization, and ongoing discharge permit compliance.
The City currently budgets approximately $39,000 per year for overtime costs related to mobilizing and responding to WRF alarms. These costs are expected to be reduced with the capacity to resolve alarms and make process corrections remotely. Additionally, the use of a SCADA system allows for greater advantage of off-peak energy rates for related operational processes.
The City has allocated $265,000 for its annual budgets over the next few years for PLC upgrades. With the implementation of this measure this future expenditure will no longer be necessary.
5.4 Measures Investigated But Not Recommended
WRF-10 – COOLING TOWER UPGRADES
Existing Conditions
The WRF’s current National Pollution Discharge Elimination System (NPDES) permit requires the City to limit the impact of the effluent discharge on the temperature of San Luis Obispo Creek to a five degree temperature rise or a maximum of 72.5°F (22.5°C). In order to meet these requirements during the summer months, the City utilizes large cooling towers consisting of plastic media,
Figure 10-1 Existing Cooling Towers
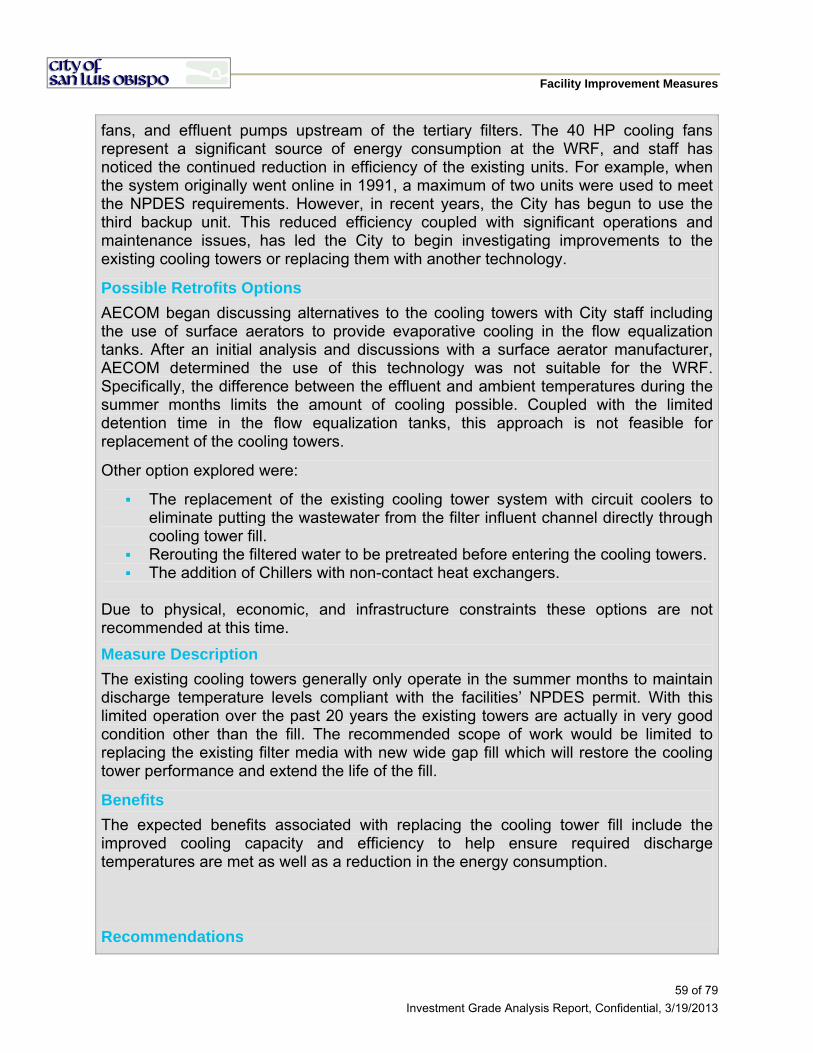
Facility Improvement Measures
59 of 79
Investment Grade Analysis Report, Confidential, 3/19/2013
fans, and effluent pumps upstream of the tertiary filters. The 40 HP cooling fans represent a significant source of energy consumption at the WRF, and staff has noticed the continued reduction in efficiency of the existing units. For example, when the system originally went online in 1991, a maximum of two units were used to meet the NPDES requirements. However, in recent years, the City has begun to use the third backup unit. This reduced efficiency coupled with significant operations and maintenance issues, has led the City to begin investigating improvements to the existing cooling towers or replacing them with another technology.
Possible Retrofits Options
AECOM began discussing alternatives to the cooling towers with City staff including the use of surface aerators to provide evaporative cooling in the flow equalization tanks. After an initial analysis and discussions with a surface aerator manufacturer, AECOM determined the use of this technology was not suitable for the WRF. Specifically, the difference between the effluent and ambient temperatures during the summer months limits the amount of cooling possible. Coupled with the limited detention time in the flow equalization tanks, this approach is not feasible for replacement of the cooling towers.
Other option explored were:
The replacement of the existing cooling tower system with circuit coolers to eliminate putting the wastewater from the filter influent channel directly through cooling tower fill.
Rerouting the filtered water to be pretreated before entering the cooling towers. The addition of Chillers with non-contact heat exchangers.
Due to physical, economic, and infrastructure constraints these options are not recommended at this time.
Measure Description
The existing cooling towers generally only operate in the summer months to maintain discharge temperature levels compliant with the facilities’ NPDES permit. With this limited operation over the past 20 years the existing towers are actually in very good condition other than the fill. The recommended scope of work would be limited to replacing the existing filter media with new wide gap fill which will restore the cooling tower performance and extend the life of the fill.
Benefits
The expected benefits associated with replacing the cooling tower fill include the improved cooling capacity and efficiency to help ensure required discharge temperatures are met as well as a reduction in the energy consumption.
Recommendations
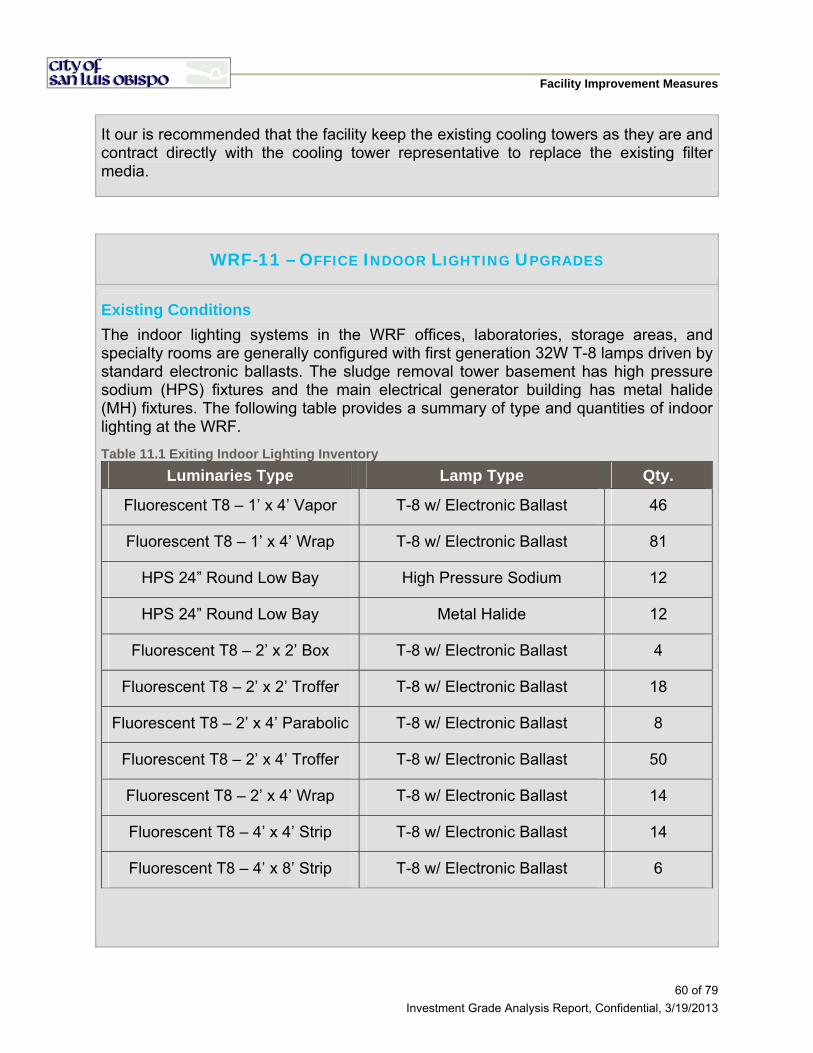
Facility Improvement Measures
60 of 79
Investment Grade Analysis Report, Confidential, 3/19/2013
It our is recommended that the facility keep the existing cooling towers as they are and contract directly with the cooling tower representative to replace the existing filter media.
WRF-11 – OFFICE INDOOR LIGHTING UPGRADES
Existing Conditions
The indoor lighting systems in the WRF offices, laboratories, storage areas, and specialty rooms are generally configured with first generation 32W T-8 lamps driven by standard electronic ballasts. The sludge removal tower basement has high pressure sodium (HPS) fixtures and the main electrical generator building has metal halide (MH) fixtures. The following table provides a summary of type and quantities of indoor lighting at the WRF.
Table 11.1 Exiting Indoor Lighting Inventory
Luminaries Type Lamp Type Qty.
Fluorescent T8 – 1’ x 4’ Vapor T-8 w/ Electronic Ballast 46
Fluorescent T8 – 1’ x 4’ Wrap T-8 w/ Electronic Ballast 81
HPS 24” Round Low Bay High Pressure Sodium 12
HPS 24” Round Low Bay Metal Halide 12
Fluorescent T8 – 2’ x 2’ Box T-8 w/ Electronic Ballast 4
Fluorescent T8 – 2’ x 2’ Troffer T-8 w/ Electronic Ballast 18
Fluorescent T8 – 2’ x 4’ Parabolic T-8 w/ Electronic Ballast 8
Fluorescent T8 – 2’ x 4’ Troffer T-8 w/ Electronic Ballast 50
Fluorescent T8 – 2’ x 4’ Wrap T-8 w/ Electronic Ballast 14
Fluorescent T8 – 4’ x 4’ Strip T-8 w/ Electronic Ballast 14
Fluorescent T8 – 4’ x 8’ Strip T-8 w/ Electronic Ballast 6

Facility Improvement Measures
61 of 79
Investment Grade Analysis Report, Confidential, 3/19/2013
Measure Description
The focus of this energy conservation measure is to improve lighting system efficiency through application of the latest third generation T-8 and T-5 lamp and ballast technologies to increase fixture efficiency, increase lamp life and to improve the design of lighting systems where warranted.
Existing fluorescent fixture ballasts at the WRF operate with a standard ballast factor (lamp wattage/fixture wattage) of 0.87 which are fairly efficient. New low power ballasts are available with ballast factors of 0.71. Similarly new improved lamp designs from major lamp manufacturers such as Phillips, GE and Sylvania offer 28W versions of the 32W energy saver lamp currently used.
The fixture retrofits identified in this report will offer an improvement in energy efficiency while maintaining optimal lighting quality.
Scope of Work Retrofit existing T-8 fixtures located in the buildings at the WRF with new 3rd
generation fluorescent T-8 Super Saver Lamps (28W) and matched rapid start electronic ballasts. Retrofit will include installation of new lamp sockets.
Retrofit existing HPS and MH fixtures with new high efficiency fluorescent T-5 fixtures equipped with electronic ballast and reflectors.
Complete new ballast electrical installation with new quick disconnects for easy maintenance and future replacement. Connectors will allow repair of ballast without the need to interrupt power to the entire lighting circuit.
Disposal of all old lamps and ballasts in compliance with all applicable environmental regulations.
Note: Appendix A provides a detailed indoor lighting audit for the WRF that includes proposed retrofit solutions, energy savings analysis, and subcontractor retrofit costs.
Benefits
Upgrading the indoor lighting will result in energy savings, reduced operational costs, while maintaining existing lighting levels
Savings
The expected savings for this measure are 13,198 kWh/year and 7.0 kW of demand which would equate to approximately $1,500 per year cost savings.
Recommendations
The limited number of interior fixtures, minimal operating hours and efficiency of the existing fixtures do not warrant the cost of replacement at this time.
Facility Improvement Measures
62 of 79
Investment Grade Analysis Report, Confidential, 3/19/2013
WRF-12 – WAS PUMPING SYSTEM MODIFICATIONS
Existing Conditions
To maintain the optimal MLSS concentration in the aeration basins, solids are periodically wasted from the system and sent to the DAFT where they are thickened ahead of the anaerobic digesters. Two five HP centrifugal pumps pull mixed liquor from the mixed liquor channel at the end of the aeration basins and pump it to the DAFT. Each pump has a rated capacity of approximately 100 GPM, and based on wasting data obtained from City staff for 2010, one pump operates for approximately 16 hours each day. The pump is controlled through a manually operated VFD. The WAS flow rate varies depending on the waste calculation requirements and averages around 70 GPM according to City. The WAS line is combined with other waste streams (primary and secondary sludge) prior to reaching the DAFT. A reduction in the flow rate is noticed by plant staff when pumps feeding waste to the DAFT from these other processes are operating simultaneously due to the resulting increase in head conditions.
Measure Description
Unlike most activated sludge facilities, solids are removed from the biological process as mixed liquor as opposed to sludge from the final clarifiers. This process results in the WAS having roughly half the solids concentration as would be expected if it was taken from the final clarifiers. Therefore, like the WRF-3 measure, a potential opportunity to reduce the amount of liquid sent to the DAFT was identified by modifying the sludge wasting process from the final clarifiers. For this measure, the point of sludge wasting was evaluated to be changed to the final clarifiers rather than the aeration basins.
In order to facilitate wasting from the final clarifiers, the existing RAS pumps were evaluated to pump sludge to the DAFT. As part of this evaluation a simple computer model of the system was constructed in WaterCAD (Bentley WaterCAD V8i) to determine the suitability of the existing RAS pumps. An estimated pump curve (high speed mode, see WRF-6) supplied by the manufacture (Fairbanks Morse) using the available pump information (model and impeller size) was used in the hydraulic model. A simplified piping layout was also created in the model based on the existing RAS and WAS pipe layout.
Based on information provided by City staff, total RAS flows vary from 1460 GPM to 3400 GPM. This variation in rate is achieved by manually throttling plug valves on the pump discharges. Using these RAS pump operating points and an assumed target WAS flow rate of 50 GPM, the resultant available head in the WAS line from ground surface at the DAFT was estimated to be 27 feet at the low RAS flow condition, and 12 feet at the high RAS flow condition. Based on these results the RAS pumps would not be able to overcome the required head to deliver WAS to the existing DAFT under all flow conditions. Note that both of this scenario assumes that the WAS tie-in to the

Facility Improvement Measures
63 of 79
Investment Grade Analysis Report, Confidential, 3/19/2013
RAS line occurs between the pump discharge and the throttling valve, and that no VFD is installed on the RAS pumps.
Although the existing RAS pumps are not capable of delivering WAS to the existing DAFT, WRF-18 proposes DAFT modifications including installation of a screw thickener located near ground elevation. If WRF- 18 is performed, RAS pumps could potentially be used to convey WAS flows to the thickener since the head requirements would be lower. It should be recognized that the available head calculated under high flow conditions is marginally adequate to allow the WAS to flow to the thickener. This risk is high and would require extensive review and additional field testing to confirm available pressure.
In addition to static head requirements, increased head conditions are present when multiple sludge pumps are on. For example, based on measured pressures on the outlet side of the primary sludge pumps, the RAS pumps would be required to overcome an additional 30 feet of head to deliver WAS to the DAFT unit if these pumps were on. For this measure to be a viable option (only in association with WRF -18), it would be required that the WAS piping be modified as such that it is no longer connected to the other waste streams. This would eliminate the increased head demand when multiple pumps are operating. Separation could be performed as flow enters the screw thickener proposed in WRF-18 via the flocculation tank. Multiple pipes can potential be connected to this tank thus allowing the WAS piping to be separated from other waste streams.
As stated above the available head estimates are based on a simplified model of the proposed process and do not include additional head loss resulting from specific attributes such as pipe fittings, valves and decreased pipe diameter due to solids accumulation. More detailed analysis along with field testing would be required to verify the pump’s ability to deliver WAS flows to the proposed screw thickener with these losses included.
WRF-6 proposes installing VFDs on the RAS pumps to control the RAS flow rates to eliminate the need for throttling of plug valves as previously described. As indicated in WRF-6, VFDs would effectively reduce the amount of available head produced by the pumps at these lower flow rates making this measure no longer viable.
The evaluation of the RAS pumps is based on current RAS flow rates. Future modifications to treatment processes (removal of the trickling filters, new MLE, etc.) will affect the RAS flow rates, WAS flow rates and the RAS pump performance. Analysis of the effects from these plant modifications were not part of this study.
Scope of Work
Due to the RAS pumps inability to provide adequate head for the existing DAFT, and the incompatibility with WRF-6 (RAS VFDs), AECOM does not recommend further evaluation of this measure. A discussion of marginal electrical savings is included below.

Facility Improvement Measures
64 of 79
Investment Grade Analysis Report, Confidential, 3/19/2013
If the City elects to pursue this Measure instead of WRF-6, the following modifications to the WAS piping would be required:
Modification of the RAS pump discharge piping;
Installation of magnetic flow meters and motorized flow control valves on the WAS line;
Installation of a connection to the existing WAS line, and;
Modify WAS pumping at DAFT to separate from other waste streams.
To use the existing RAS pumps to convey WAS from the final clarifiers to the screw thickener, piping modifications would be required to the discharge piping of each RAS pump. Since RAS flow is controlled through throttling of a plug valve, higher pressures would be available on the upstream side of the valve. These higher pressures are necessary to convey WAS flows and therefore a tee would be placed directly upstream of these plug valves at each pump.
To control the WAS flow conveyed to the screw thickener a magnetic flow meter and a plug valve with a motorized flow control valve would be installed on each WAS line. These would allow plant staff to automatically control WAS flows based on waste calculation requirements. The staff would set the desired WAS flow rate from each clarifier and the plug valve would modulate to maintain this flow based on the reading from the flow meter. The flow meters and flow control valves (four sets total) would be placed above ground immediately downstream of the installed tee described above.
Each WAS line coming from the RAS pumps would be combined to a single pipe and would be connected to the existing WAS line with a tee and check valve. This would allow WAS to be supplied from either the RAS pumps or the existing WAS pumps if necessary.
As previously discussed, it is necessary for the WAS piping entering the screw thickener unit be modified to separate the WAS flow from other waste streams to eliminate the variable head conditions in the line. This would be performed as the WAS enters the flocculation tank of the screw thickener proposed in WRF-18.
It would be recommended that the existing WAS pumps remain in place and be used as a backup to the new wasting system.
Benefits
The modifications to the WAS system is estimated to only slightly reduce the hydraulic loading rate of the DAFT (by approximately 20 GPM). Further development of this measure is no longer recommended since this reduction in the hydraulic loading rate will not have a significant impact on the thickening operation, and WAS cannot be delivered to the existing DAFT using the RAS pumps. The ability of the RAS pumps to deliver the WAS flows to the proposed screw thickener (WRF-18) is questionable and would require a thorough analysis and field testing to determine the suitability. In addition, if VFDs are installed on the RAS pumps as proposed in WRF-6 this measure
Facility Improvement Measures
65 of 79
Investment Grade Analysis Report, Confidential, 3/19/2013
cannot be performed.
Savings
The potential cost savings from this measure would occur as a result of a decrease in required pumping energy due to the reduction in WAS flows (70 GPM to 50 GPM). Based a flow reduction of 20 GPM a pumping energy savings of 490 kWh/yr would be expected. We also do not expect significant O&M savings for this measure since the existing WAS pumps would continue to require occasional maintenance to remain operable.
Recommendations
Due to the minimal estimated positive gains in system performance and inability to be performed in conjunction with WRF-6, this measure is not recommended.
WRF-13 – SLUDGE THICKENING
ECM Description
This measure explores the replacement of the existing dissolved air flotation thickening (DAFT) system with a new thickening process. The existing DAFT unit receives settled sludge from the primary clarifiers and secondary clarifiers, Waste Activated Sludge (WAS) from the aeration basins, and scum from the clarifiers. Prior to recent operational changes described later in this section, the DAFT system thickened an average of 750 gallons per minute (GPM) of sludge from less than 1% solids to 5-6%.
The objective of the measure is to replace the existing system with a more efficient dewatering process that requires less operator attention and does not increase odors. The current system requires approximately 450,000 kWh/yr of power, primarily for system pressurization pumps and grinders. The dewatering system is located adjacent to the Bob Jones Trail and the City intends to contain and treat odors to the extent practicable.
Alternatives Evaluation
The alternatives for replacing the DAFT considered in the study and discussed with City staff include gravity belt, screw-type, and rotary drum systems. Each technology produces a thickened sludge that is 5-6% solids. The alternatives are described briefly below:
Gravity belt thickeners (GBT) – This technology utilizes a system of pulleys and a
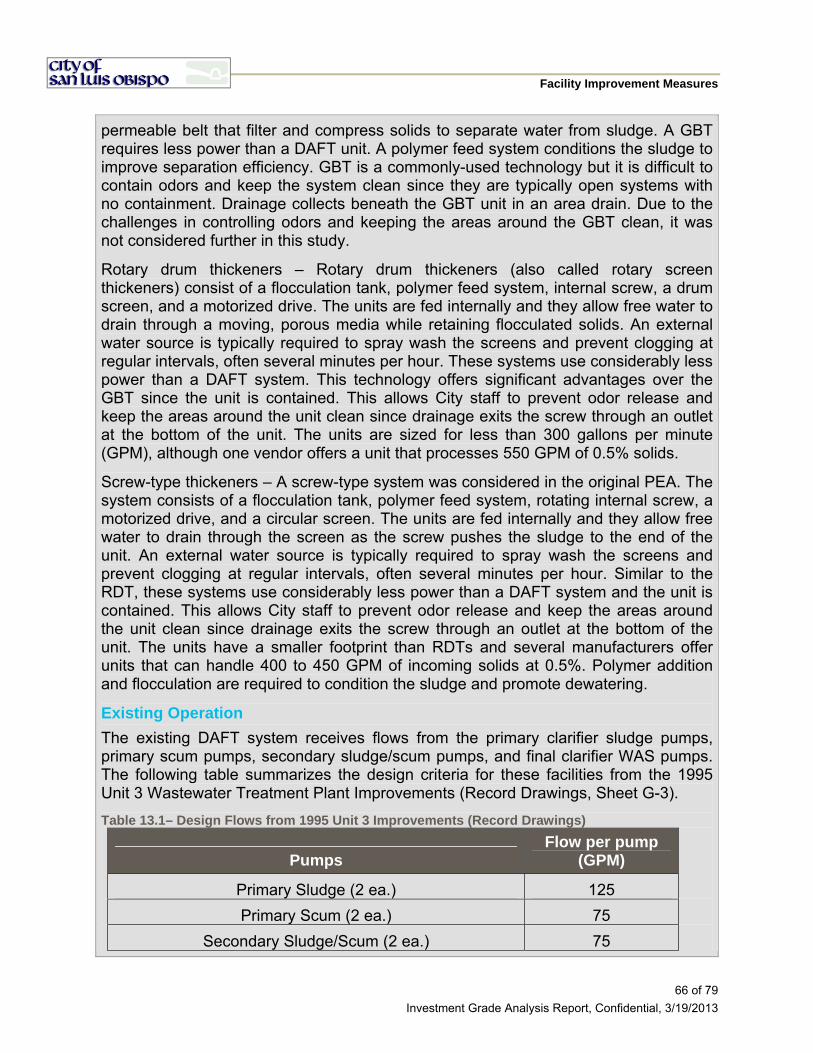
Facility Improvement Measures
66 of 79
Investment Grade Analysis Report, Confidential, 3/19/2013
permeable belt that filter and compress solids to separate water from sludge. A GBT requires less power than a DAFT unit. A polymer feed system conditions the sludge to improve separation efficiency. GBT is a commonly-used technology but it is difficult to contain odors and keep the system clean since they are typically open systems with no containment. Drainage collects beneath the GBT unit in an area drain. Due to the challenges in controlling odors and keeping the areas around the GBT clean, it was not considered further in this study.
Rotary drum thickeners – Rotary drum thickeners (also called rotary screen thickeners) consist of a flocculation tank, polymer feed system, internal screw, a drum screen, and a motorized drive. The units are fed internally and they allow free water to drain through a moving, porous media while retaining flocculated solids. An external water source is typically required to spray wash the screens and prevent clogging at regular intervals, often several minutes per hour. These systems use considerably less power than a DAFT system. This technology offers significant advantages over the GBT since the unit is contained. This allows City staff to prevent odor release and keep the areas around the unit clean since drainage exits the screw through an outlet at the bottom of the unit. The units are sized for less than 300 gallons per minute (GPM), although one vendor offers a unit that processes 550 GPM of 0.5% solids.
Screw-type thickeners – A screw-type system was considered in the original PEA. The system consists of a flocculation tank, polymer feed system, rotating internal screw, a motorized drive, and a circular screen. The units are fed internally and they allow free water to drain through the screen as the screw pushes the sludge to the end of the unit. An external water source is typically required to spray wash the screens and prevent clogging at regular intervals, often several minutes per hour. Similar to the RDT, these systems use considerably less power than a DAFT system and the unit is contained. This allows City staff to prevent odor release and keep the areas around the unit clean since drainage exits the screw through an outlet at the bottom of the unit. The units have a smaller footprint than RDTs and several manufacturers offer units that can handle 400 to 450 GPM of incoming solids at 0.5%. Polymer addition and flocculation are required to condition the sludge and promote dewatering.
Existing Operation
The existing DAFT system receives flows from the primary clarifier sludge pumps, primary scum pumps, secondary sludge/scum pumps, and final clarifier WAS pumps. The following table summarizes the design criteria for these facilities from the 1995 Unit 3 Wastewater Treatment Plant Improvements (Record Drawings, Sheet G-3).
Table 13.1– Design Flows from 1995 Unit 3 Improvements (Record Drawings)
Pumps Flow per pump
(GPM)
Primary Sludge (2 ea.) 125
Primary Scum (2 ea.) 75
Secondary Sludge/Scum (2 ea.) 75

Facility Improvement Measures
67 of 79
Investment Grade Analysis Report, Confidential, 3/19/2013
WAS (2 ea.) 100
According to City operations staff, it is difficult to anticipate how much flow each pump actually contributes to the DAFT without metering them individually. When several pumps operate simultaneously, the resulting discharge pressure causes any of the centrifugal pumps to reduce flow in response to the increasing head conditions. With all pumps running simultaneously, the maximum flow to the DAFT should be 750 GPM according to the design criteria described above.
In 1997, the secondary sludge/scum pump system was modified. One of the pumps was replaced with a larger pump (Cornell Model 4NNT-F6 with 7.5 hp motor) with a design flow of 350 GPM to improve control of sludge blanket depth. The Cornell pump was originally utilized as part of the plant water system, and was coated, moved, and recommissioned as a secondary sludge pump. The pump is operated by a variable frequency drive and typically runs at 75% of maximum speed (yielding a 350 GPM flow) and the operators note that running the pump at higher speeds results in frequent clogging.
Each WAS pump is operated by VFD to pump 70 GPM on average, although the maximum speed according to the Record Drawings (ibid.) is 100 GPM.
In the past, prior to making some recent operational changes as discussed below, the operators sent an annual average of 750 GPM to the DAFT unit. The 2009 Wastewater Facilities Master Plan Update stated that the DAFT unit was designed to increase solids concentration by 4%, but the system has performed consistently better and was increasing solids concentration from 4.5% to 5.5% at the time the draft Update was prepared.
Table 13.2 – Current DAFT Operation
Flow per pump (GPM) Operating Time
Primary Sludge Pumps (2 operating) 125 10 to 30 min/hr
Primary Scum Pumps (2 operating) 75 30 min/day
Secondary Scum Pumps (1 operating) 75 30 min/day
WAS Pumps 70 24 hrs/day
Secondary Sludge Pump 350 24 hrs/day
The current DAFT operation is described in Table 13.2 above. The City recently tested operating the primary sludge pumps on a timer system. This has resulted in a reduction of average DAFT inflow from 750 GPM to 417 GPM, according to data recorded between July 1, 2011, and June 30, 2012. The average incoming solids concentration was recorded as 0.29% and loading rate averaged 14,800 pounds per day (ppd).
Basis of Design

Facility Improvement Measures
68 of 79
Investment Grade Analysis Report, Confidential, 3/19/2013
In order to develop a Basis of Design for the solids thickening system, AECOM discussed current operations with WRF staff and considered WRF-3 (Primary Sludge Pumping System). The following table summarizes our assumed design criteria for identifying and selecting appropriate sludge thickening systems.
Table 13.3- Basis of Design
Max. Flow
(GPM)
Solids Conc. (%) Run Time
Average Daily Flows (gpd)
Average Daily
Loadings (ppd) Comments
Primary Sludge 250 5000 30 min/hr 180000 7506
Assumed solids concentration at shorter run times
Primary Scum 150 5 30 min/d 4500 0
Could be operated when primary and secondary sludge are not being pumped
Secondary Sludge 350 2500 30 min/hr 252000 5254
Assumed solids concentration at shorter run times; also assumed a new check valve and other appurtenances would allow the pump to be operated intermittently instead of 24 hrs/day
Secondary Scum 75 5 30 min/d 2250 0
Pumped to thickener when primary and secondary sludge are not pumped
Waste Activated Sludge (WAS) 70 2400 24 hrs/d 100800 2018
WAS concentration from 2010 plant records referenced in PEA
Total 895 -- -- -- 539550 15000 Loadings

Facility Improvement Measures
69 of 79
Investment Grade Analysis Report, Confidential, 3/19/2013
Maximum Instantaneous Flow
rounded to nearest 1,000 ppd
Total Maximum Flow to Thickener (see comments) 670 0.3%
Avg solids concentration
The following are assumed:
The City would continue operating the thickening system on a 24-hr/day basis, although opportunities for batch-wasting will be discussed in following sections of this study.
The July 2011-June 2012 average solids loading rate of 14,800 ppd was rounded to 15,000 ppd. Typical solids concentrations for primary and secondary sludge were assumed since the City will be changing sludge pumping operations to increase these concentrations, although it is assumed the total solids loading rates would not change. The proportion of primary to secondary sludge is important to measure since it will affect both the polymer feed rate and the thickening system performance; therefore the solids concentrations should be verified prior to final design.
Scum pumping could be scheduled so it does not occur simultaneously with both primary and secondary sludge pumping, allowing a reduction in the design flow to the thickener. This is assumed in the “Total Maximum Flow to Thickener” calculation.
As discussed in the draft Master Plan Update, a future 2030 solids loading rate of 19,400 ppd will be assumed when addressing future conditions in this IGA.
Alternative Evaluation
Due to the variations between flocculation and thickening characteristics of primary and secondary sludge, and the need to actively manage polymer feed rates to match the quality of incoming solids, both screw thickeners and RDTs perform very well in batch-operating modes or continuous operation and are difficult to operate intermittently. Equipment vendors strongly recommend either batch operation or continuous operation. Adjusting polymer dosage to maintain consistent performance is challenging at plants that intermittently pump sludge throughout the day.
Two alternatives were evaluated in this IGA:
Install one RDT
Install two screw thickeners
Alternative 1 – Install One RDT
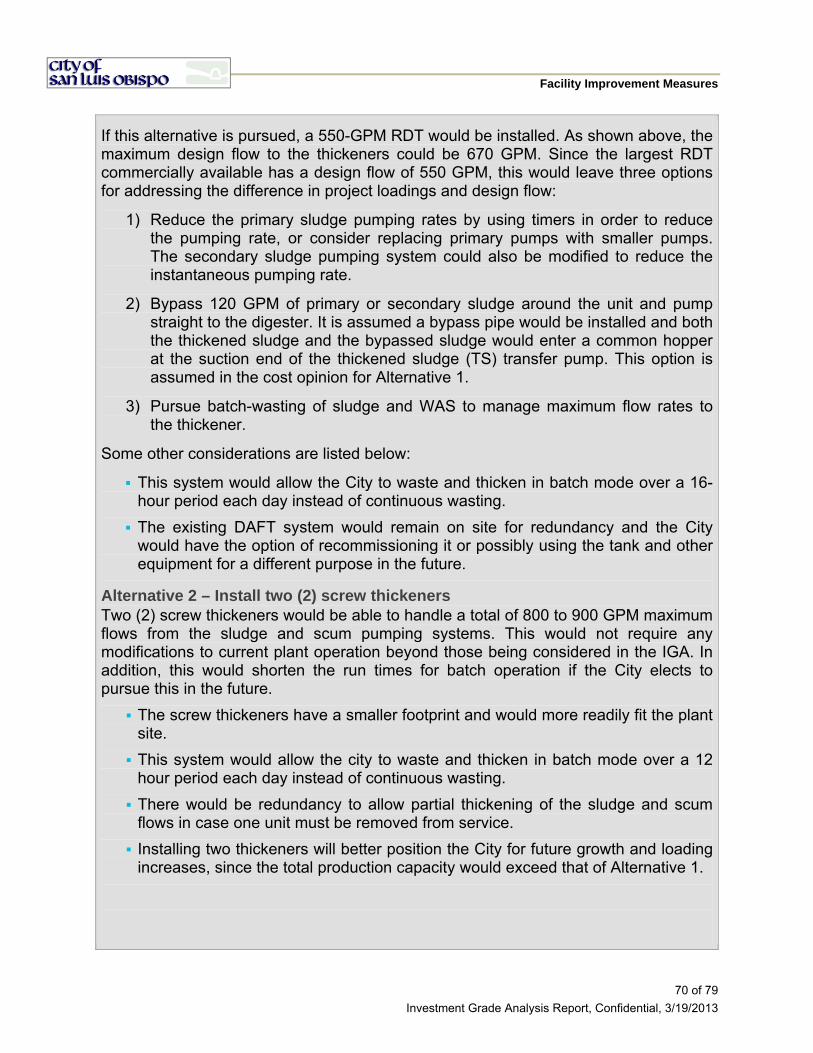
Facility Improvement Measures
70 of 79
Investment Grade Analysis Report, Confidential, 3/19/2013
If this alternative is pursued, a 550-GPM RDT would be installed. As shown above, the maximum design flow to the thickeners could be 670 GPM. Since the largest RDT commercially available has a design flow of 550 GPM, this would leave three options for addressing the difference in project loadings and design flow:
1) Reduce the primary sludge pumping rates by using timers in order to reduce the pumping rate, or consider replacing primary pumps with smaller pumps. The secondary sludge pumping system could also be modified to reduce the instantaneous pumping rate.
2) Bypass 120 GPM of primary or secondary sludge around the unit and pump straight to the digester. It is assumed a bypass pipe would be installed and both the thickened sludge and the bypassed sludge would enter a common hopper at the suction end of the thickened sludge (TS) transfer pump. This option is assumed in the cost opinion for Alternative 1.
3) Pursue batch-wasting of sludge and WAS to manage maximum flow rates to the thickener.
Some other considerations are listed below:
This system would allow the City to waste and thicken in batch mode over a 16-hour period each day instead of continuous wasting.
The existing DAFT system would remain on site for redundancy and the City would have the option of recommissioning it or possibly using the tank and other equipment for a different purpose in the future.
Alternative 2 – Install two (2) screw thickeners Two (2) screw thickeners would be able to handle a total of 800 to 900 GPM maximum flows from the sludge and scum pumping systems. This would not require any modifications to current plant operation beyond those being considered in the IGA. In addition, this would shorten the run times for batch operation if the City elects to pursue this in the future.
The screw thickeners have a smaller footprint and would more readily fit the plant site.
This system would allow the city to waste and thicken in batch mode over a 12 hour period each day instead of continuous wasting.
There would be redundancy to allow partial thickening of the sludge and scum flows in case one unit must be removed from service.
Installing two thickeners will better position the City for future growth and loading increases, since the total production capacity would exceed that of Alternative 1.
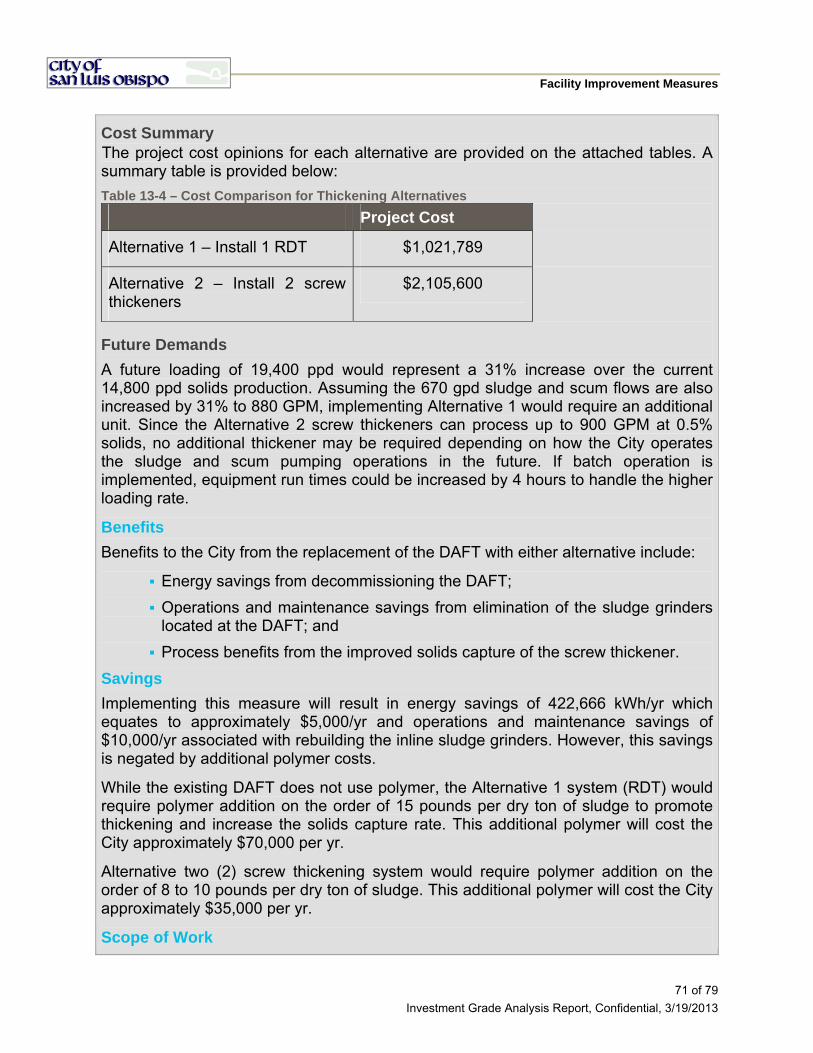
Facility Improvement Measures
71 of 79
Investment Grade Analysis Report, Confidential, 3/19/2013
Cost Summary The project cost opinions for each alternative are provided on the attached tables. A summary table is provided below:
Table 13-4 – Cost Comparison for Thickening Alternatives
Project Cost
Alternative 1 – Install 1 RDT $1,021,789
Alternative 2 – Install 2 screw thickeners
$2,105,600
Future Demands
A future loading of 19,400 ppd would represent a 31% increase over the current 14,800 ppd solids production. Assuming the 670 gpd sludge and scum flows are also increased by 31% to 880 GPM, implementing Alternative 1 would require an additional unit. Since the Alternative 2 screw thickeners can process up to 900 GPM at 0.5% solids, no additional thickener may be required depending on how the City operates the sludge and scum pumping operations in the future. If batch operation is implemented, equipment run times could be increased by 4 hours to handle the higher loading rate.
Benefits
Benefits to the City from the replacement of the DAFT with either alternative include:
Energy savings from decommissioning the DAFT;
Operations and maintenance savings from elimination of the sludge grinders located at the DAFT; and
Process benefits from the improved solids capture of the screw thickener.
Savings
Implementing this measure will result in energy savings of 422,666 kWh/yr which equates to approximately $5,000/yr and operations and maintenance savings of $10,000/yr associated with rebuilding the inline sludge grinders. However, this savings is negated by additional polymer costs.
While the existing DAFT does not use polymer, the Alternative 1 system (RDT) would require polymer addition on the order of 15 pounds per dry ton of sludge to promote thickening and increase the solids capture rate. This additional polymer will cost the City approximately $70,000 per yr.
Alternative two (2) screw thickening system would require polymer addition on the order of 8 to 10 pounds per dry ton of sludge. This additional polymer will cost the City approximately $35,000 per yr.
Scope of Work
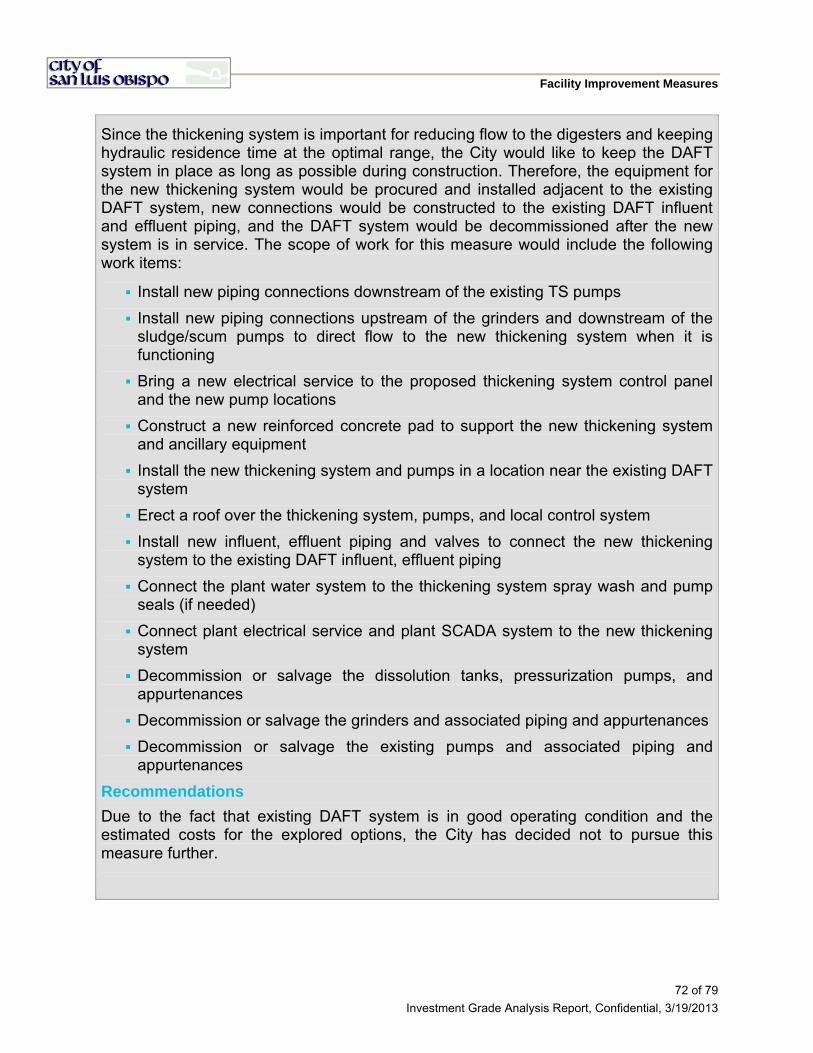
Facility Improvement Measures
72 of 79
Investment Grade Analysis Report, Confidential, 3/19/2013
Since the thickening system is important for reducing flow to the digesters and keeping hydraulic residence time at the optimal range, the City would like to keep the DAFT system in place as long as possible during construction. Therefore, the equipment for the new thickening system would be procured and installed adjacent to the existing DAFT system, new connections would be constructed to the existing DAFT influent and effluent piping, and the DAFT system would be decommissioned after the new system is in service. The scope of work for this measure would include the following work items:
Install new piping connections downstream of the existing TS pumps
Install new piping connections upstream of the grinders and downstream of the sludge/scum pumps to direct flow to the new thickening system when it is functioning
Bring a new electrical service to the proposed thickening system control panel and the new pump locations
Construct a new reinforced concrete pad to support the new thickening system and ancillary equipment
Install the new thickening system and pumps in a location near the existing DAFT system
Erect a roof over the thickening system, pumps, and local control system
Install new influent, effluent piping and valves to connect the new thickening system to the existing DAFT influent, effluent piping
Connect the plant water system to the thickening system spray wash and pump seals (if needed)
Connect plant electrical service and plant SCADA system to the new thickening system
Decommission or salvage the dissolution tanks, pressurization pumps, and appurtenances
Decommission or salvage the grinders and associated piping and appurtenances
Decommission or salvage the existing pumps and associated piping and appurtenances
Recommendations
Due to the fact that existing DAFT system is in good operating condition and the estimated costs for the explored options, the City has decided not to pursue this measure further.

Cost Benefit Analysis
73 of 79
Investment Grade Analysis Report, Confidential, 3/19/2013
6.0 COST BENEFIT ANALYSIS
6.1 Financial Overview
In this section we have included construction cost information and an example financial pro forma. The construction cost estimates were developed utilizing information that we were able to compile during our assessment, experience from previous projects, and quotes received from equipment vendors and installation contractors based on our preliminary designs.
The annual cost savings, estimated incentives and estimated construction costs for each measure are shown in Table 6-2. To demonstrate the financial viability of this project, Table 6-3 represents an example financial pro forma using current interest rates at the time of this report. This pro forma represents an example of how this project could be financially structured and the key inputs and assumptions are displayed in Table 6.1 below. As we move forward toward the implementation phase, PG&E and AECOM will work with the City to develop the most cost effective financial package for this project.
Table 6-1 - WRF Financial Pro Forma Inputs/Assumptions
Item Value
Escalation Rates
Electricity 2.5%/yr.
Natural Gas 2.5%/yr.
Operations and Maintenance 2.5%/yr.
Utility Rates
Electricity $0.12/kWh
Natural Gas $0.90/therm
Key financial parameters
Project Cost $9,478,948
Customer Contribution $2,000,000
Utility Incentives $292,690
Annual Energy Savings $156,848
Annual O&M Savings $167,749
Amount Financed $7,186,257
Return on investment 14%
Financing Period 20 Years
Number of Payments per Year TBD
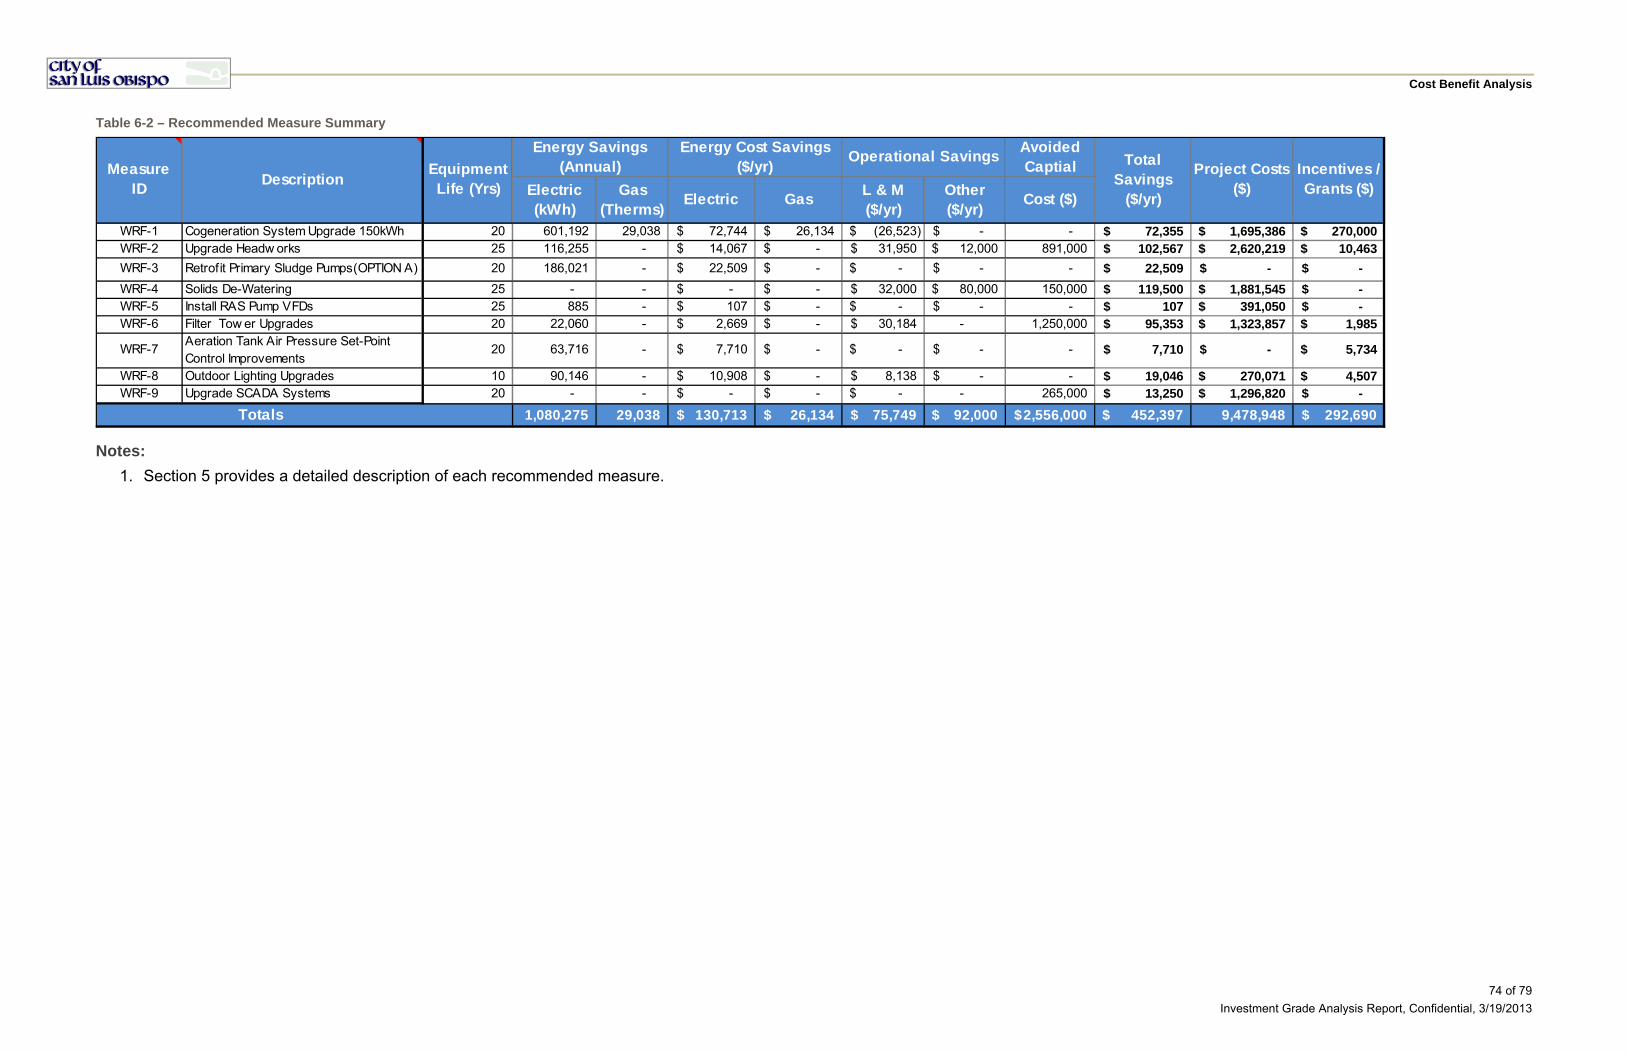
Cost Benefit Analysis
74 of 79
Investment Grade Analysis Report, Confidential, 3/19/2013
Table 6-2 – Recommended Measure Summary
Notes:
1. Section 5 provides a detailed description of each recommended measure.
Electric(kWh)
Gas (Therms)
Electric GasL & M ($/yr)
Other ($/yr)
Cost ($)
WRF-1 Cogeneration System Upgrade 150kWh 20 601,192 29,038 72,744$ 26,134$ (26,523)$ -$ - 72,355$ 1,695,386$ 270,000$ WRF-2 Upgrade Headw orks 25 116,255 - 14,067$ -$ 31,950$ 12,000$ 891,000 102,567$ 2,620,219$ 10,463$
WRF-3 Retrofit Primary Sludge Pumps(OPTION A) 20 186,021 - 22,509$ -$ -$ -$ - 22,509$ -$ -$
WRF-4 Solids De-Watering 25 - - -$ -$ 32,000$ 80,000$ 150,000 119,500$ 1,881,545$ -$ WRF-5 Install RAS Pump VFDs 25 885 - 107$ -$ -$ -$ - 107$ 391,050$ -$ WRF-6 Filter Tow er Upgrades 20 22,060 - 2,669$ -$ 30,184$ - 1,250,000 95,353$ 1,323,857$ 1,985$
WRF-7Aeration Tank Air Pressure Set-Point Control Improvements
20 63,716 - 7,710$ -$ -$ -$ - 7,710$ -$ 5,734$
WRF-8 Outdoor Lighting Upgrades 10 90,146 - 10,908$ -$ 8,138$ -$ - 19,046$ 270,071$ 4,507$ WRF-9 Upgrade SCADA Systems 20 - - -$ -$ -$ - 265,000 13,250$ 1,296,820$ -$
1,080,275 29,038 130,713$ 26,134$ 75,749$ 92,000$ 2,556,000$ 452,397$ 9,478,948 292,690$
Incentives / Grants ($)
Energy Cost Savings ($/yr)
Operational Savings Total Savings
($/yr)
Project Costs ($)
Avoided Captial
Energy Savings (Annual)Equipment
Life (Yrs)
Totals
DescriptionMeasure
ID

Cost Benefit Analysis
75 of 79
Investment Grade Analysis Report, Confidential, 3/19/2013
Figure 6-3 – IGA Example Pro Forma
Key Inputs
Duration
(Months) Days Date
Fees &
Expenses
Escrow Fund
Balance
Interest
Earned % Draw $ Draw Project Cost 7,186,258$ Interest rate on debt 3.890%
0 5/1/2013 42,500$ 7,186,258$ Financing Fees 35,000$ Interest Applied Days/Year 360
1 0 5/1/2013 7,042,533$ ‐$ 2.00% 143,725$ ‐$ Interest rate on project fund 0.00%
2 30 6/1/2013 6,898,808$ ‐$ 2.00% 143,725$ Closing Costs 7,500$ Energy Savings Discount % 0.00%
3 30 7/1/2013 6,755,083$ ‐$ 2.00% 143,725$ Total amount to be financed 7,228,758$ City Payment Delay in Days 30
4 30 8/1/2013 6,611,357$ ‐$ 2.00% 143,725$
5 30 9/1/2013 6,467,632$ ‐$ 2.00% 143,725$
6 30 10/1/2013 6,323,907$ ‐$ 2.00% 143,725$
7 30 11/1/2013 5,749,006$ ‐$ 8.00% 574,901$
8 30 12/1/2013 5,174,106$ ‐$ 8.00% 574,901$
9 30 1/1/2014 4,599,205$ ‐$ 8.00% 574,901$
10 30 2/1/2014 4,024,304$ ‐$ 8.00% 574,901$
11 30 3/1/2014 3,449,404$ ‐$ 8.00% 574,901$
12 30 4/1/2014 2,874,503$ ‐$ 8.00% 574,901$ Determination of Interest Rate
13 30 5/1/2014 2,299,603$ ‐$ 8.00% 574,901$ 30‐year UST 3.11% 3/5/13 Denotes an input cell
14 30 6/1/2014 1,868,427$ ‐$ 6.00% 431,175$ 10‐year UST 1.90% 3/5/13 Denotes dependent cell
15 30 7/1/2014 1,437,252$ ‐$ 6.00% 431,175$ Difference 1.21%
16 30 8/1/2014 1,006,076$ ‐$ 6.00% 431,175$ Change/year 0.081%
17 30 9/1/2014 574,901$ ‐$ 6.00% 431,175$ Total Change 0.318% Project Cost Details
18 30 10/1/2014 287,450$ ‐$ 4.00% 287,450$ Index Rate 2.22% Total Estimated Implementation Cost 9,478,948
19 30 11/1/2014 143,725$ ‐$ 2.00% 143,725$ Spread 1.75% Total Estimated Project Incentives 292,690
20 30 12/1/2014 (0)$ ‐$ 2.00% 143,725$ Interest Rate 3.970% 100.00%
540 42,500$ ‐$ 100.00% 7,186,258$ 292,690
Capitalized interest expense (coupon) 419,318$ Client Contribution 2,000,000
Subtotal 7,605,576$ Statistics/Reconciliation Total Financed Project Cost 7,186,258
Fees & Closing Expenses 42,500$ Total Term (yrs) 20.58
Accrued Interest on Fees & Closing Expenses 2,480$ Averge Life (yrs) 13.95
Subtotal 44,980$ Total Payments Financed 10,736,441$
Beginning balance for amortization on the date 11/1/2014 7,650,556$ Total Interest Paid 3,922,168$
Include pre‐construction savings in year 1 payment Yes Total Principal Repaid 6,814,273$
Include incentives in year 1 payment No
[SCH‐3]
Beginning M&V Costs Interest Ending
Date Balance Estimated Discount % Proposed
O&M &
Avoided CIP Incentive Total No Scheduled Actual 3.89% Balance
Contract (a) (b) © (d) (e) (f) (G) (h) (i) (j) (k) (l) (m) (n) (o)
Duration 0 11/1/14 Construction Period ‐$ 0.00% ‐$ ‐$ ‐$
1.6 30 12/1/14 7,650,556$ 152,492$ 0.00% 152,492$ 295,549$ ‐$ 448,041$ ‐$ 448,041$ 448,041$ 24,801$ 7,227,316$ 448,041$
2.6 360 12/1/15 7,227,316$ 156,304$ 0.00% 156,304$ 299,743$ ‐$ 456,047$ ‐$ 456,047$ 456,047$ 281,143$ 7,052,412$ 456,047$
3.6 360 12/1/16 7,052,412$ 160,212$ 0.00% 160,212$ 304,041$ ‐$ 464,253$ ‐$ 464,253$ 464,253$ 274,339$ 6,862,497$ 464,253$
4.6 360 12/1/17 6,862,497$ 164,217$ 0.00% 164,217$ 308,447$ ‐$ 472,664$ ‐$ 472,664$ 472,664$ 266,951$ 6,656,784$ 472,664$
5.6 360 12/1/18 6,656,784$ 168,322$ 0.00% 168,322$ 312,964$ ‐$ 481,286$ ‐$ 481,286$ 481,286$ 258,949$ 6,434,447$ 481,286$
6.6 360 12/1/19 6,434,447$ 172,530$ 0.00% 172,530$ 317,593$ ‐$ 490,123$ ‐$ 490,123$ 490,123$ 250,300$ 6,194,624$ 490,123$
7.6 360 12/1/20 6,194,624$ 176,844$ 0.00% 176,844$ 322,337$ ‐$ 499,181$ ‐$ 499,181$ 499,181$ 240,971$ 5,936,414$ 499,181$
8.6 360 12/1/21 5,936,414$ 181,265$ 0.00% 181,265$ 327,201$ ‐$ 508,466$ ‐$ 508,466$ 508,466$ 230,927$ 5,658,875$ 508,466$
9.6 360 12/1/22 5,658,875$ 185,796$ 0.00% 185,796$ 332,186$ ‐$ 517,982$ ‐$ 517,982$ 517,982$ 220,130$ 5,361,023$ 517,982$
10.6 360 12/1/23 5,361,023$ 190,441$ 0.00% 190,441$ 337,296$ ‐$ 527,737$ ‐$ 527,737$ 527,737$ 208,544$ 5,041,830$ 527,737$
11.6 360 12/1/24 5,041,830$ 195,202$ 0.00% 195,202$ 342,533$ ‐$ 537,735$ ‐$ 537,735$ 537,735$ 196,127$ 4,700,222$ 537,735$
12.6 360 12/1/25 4,700,222$ 200,082$ 0.00% 200,082$ 347,901$ ‐$ 547,984$ ‐$ 547,984$ 547,984$ 182,839$ 4,335,077$ 547,984$
13.6 360 12/1/26 4,335,077$ 205,084$ 0.00% 205,084$ 353,404$ ‐$ 558,488$ ‐$ 558,488$ 558,488$ 168,634$ 3,945,223$ 558,488$
14.6 360 12/1/27 3,945,223$ 210,212$ 0.00% 210,212$ 359,044$ ‐$ 569,255$ ‐$ 569,255$ 569,255$ 153,469$ 3,529,437$ 569,255$
15.6 360 12/1/28 3,529,437$ 215,467$ 0.00% 215,467$ 364,825$ ‐$ 580,292$ ‐$ 580,292$ 580,292$ 137,295$ 3,086,440$ 580,292$
16.6 360 12/1/29 3,086,440$ 220,854$ 0.00% 220,854$ 370,751$ ‐$ 591,604$ ‐$ 591,604$ 591,604$ 120,063$ 2,614,898$ 591,604$
17.6 360 12/1/30 2,614,898$ 226,375$ 0.00% 226,375$ 376,824$ ‐$ 603,199$ ‐$ 603,199$ 603,199$ 101,720$ 2,113,419$ 603,199$
18.6 360 12/1/31 2,113,419$ 232,034$ 0.00% 232,034$ 383,050$ ‐$ 615,084$ ‐$ 615,084$ 615,084$ 82,212$ 1,580,546$ 615,084$
19.6 360 12/1/32 1,580,546$ 237,835$ 0.00% 237,835$ 389,431$ ‐$ 627,266$ ‐$ 627,266$ 627,266$ 61,483$ 1,014,763$ 627,266$
20.6 360 12/1/33 1,014,763$ 243,781$ 0.00% 243,781$ 395,972$ ‐$ 639,753$ ‐$ 639,753$ 639,753$ 39,474$ 414,485$
0 ‐$
6,870 3,895,350$ 3,895,350$ 6,841,091$ ‐$ 10,736,441$ ‐$ 10,736,441$ 10,736,441$ 3,500,370$ 10,096,688
Total Payments to
Financier
Amortization
Escrow Fund during Construction Period
Energy
Savings [SCH‐1] Payments to Lender
Total % Incentives Used for Project Buy‐
DownTotal $ Incentives Used for Project Buy‐
Down
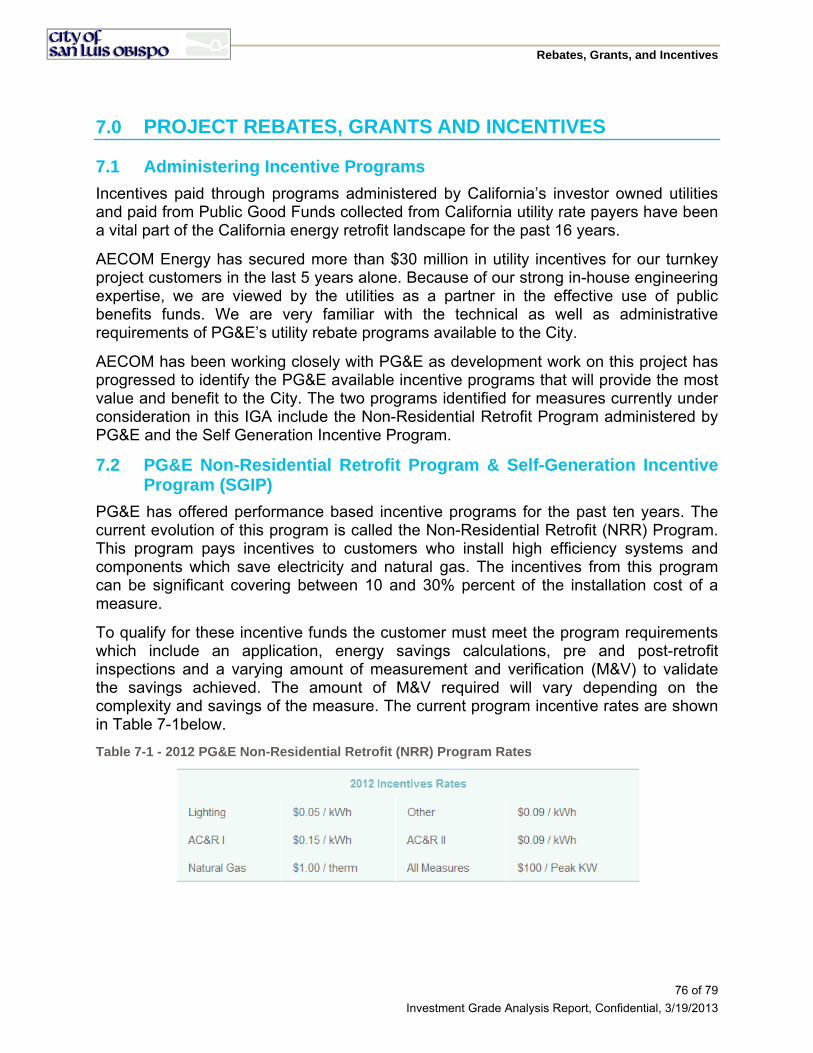
Rebates, Grants, and Incentives
76 of 79
Investment Grade Analysis Report, Confidential, 3/19/2013
7.0 PROJECT REBATES, GRANTS AND INCENTIVES
7.1 Administering Incentive Programs
Incentives paid through programs administered by California’s investor owned utilities and paid from Public Good Funds collected from California utility rate payers have been a vital part of the California energy retrofit landscape for the past 16 years.
AECOM Energy has secured more than $30 million in utility incentives for our turnkey project customers in the last 5 years alone. Because of our strong in-house engineering expertise, we are viewed by the utilities as a partner in the effective use of public benefits funds. We are very familiar with the technical as well as administrative requirements of PG&E’s utility rebate programs available to the City.
AECOM has been working closely with PG&E as development work on this project has progressed to identify the PG&E available incentive programs that will provide the most value and benefit to the City. The two programs identified for measures currently under consideration in this IGA include the Non-Residential Retrofit Program administered by PG&E and the Self Generation Incentive Program.
7.2 PG&E Non-Residential Retrofit Program & Self-Generation Incentive Program (SGIP)
PG&E has offered performance based incentive programs for the past ten years. The current evolution of this program is called the Non-Residential Retrofit (NRR) Program. This program pays incentives to customers who install high efficiency systems and components which save electricity and natural gas. The incentives from this program can be significant covering between 10 and 30% percent of the installation cost of a measure.
To qualify for these incentive funds the customer must meet the program requirements which include an application, energy savings calculations, pre and post-retrofit inspections and a varying amount of measurement and verification (M&V) to validate the savings achieved. The amount of M&V required will vary depending on the complexity and savings of the measure. The current program incentive rates are shown in Table 7-1below.
Table 7-1 - 2012 PG&E Non-Residential Retrofit (NRR) Program Rates
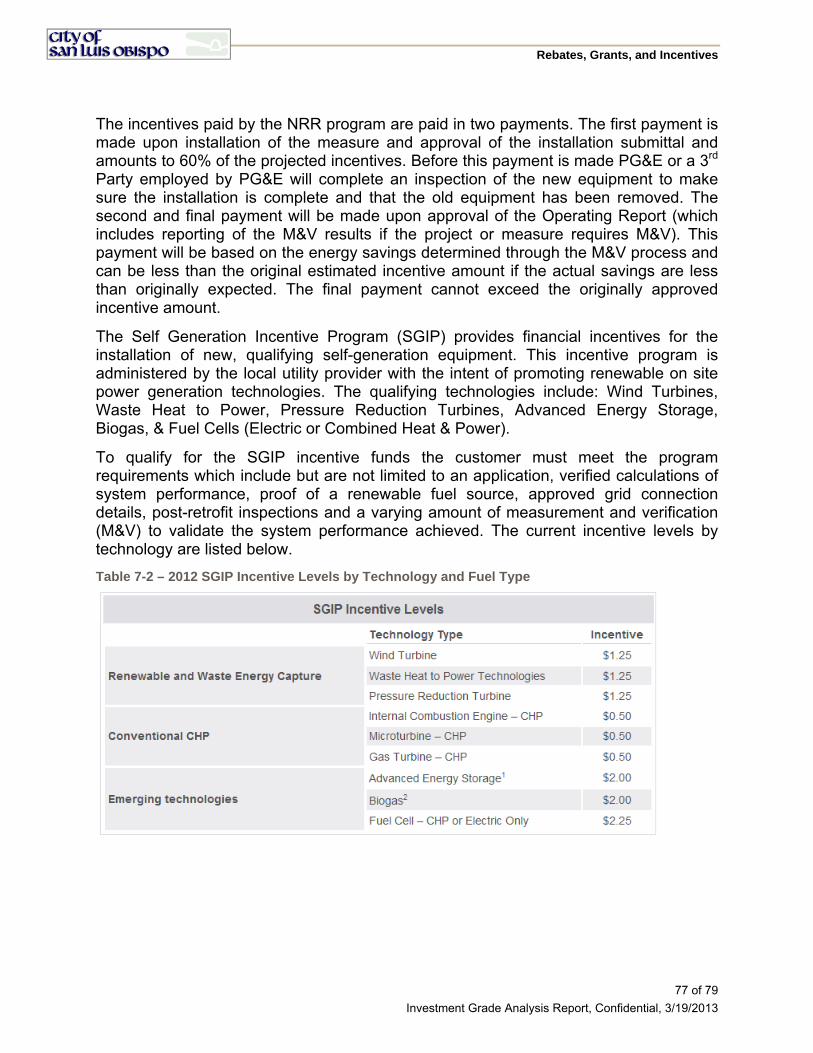
Rebates, Grants, and Incentives
77 of 79
Investment Grade Analysis Report, Confidential, 3/19/2013
The incentives paid by the NRR program are paid in two payments. The first payment is made upon installation of the measure and approval of the installation submittal and amounts to 60% of the projected incentives. Before this payment is made PG&E or a 3rd Party employed by PG&E will complete an inspection of the new equipment to make sure the installation is complete and that the old equipment has been removed. The second and final payment will be made upon approval of the Operating Report (which includes reporting of the M&V results if the project or measure requires M&V). This payment will be based on the energy savings determined through the M&V process and can be less than the original estimated incentive amount if the actual savings are less than originally expected. The final payment cannot exceed the originally approved incentive amount.
The Self Generation Incentive Program (SGIP) provides financial incentives for the installation of new, qualifying self-generation equipment. This incentive program is administered by the local utility provider with the intent of promoting renewable on site power generation technologies. The qualifying technologies include: Wind Turbines, Waste Heat to Power, Pressure Reduction Turbines, Advanced Energy Storage, Biogas, & Fuel Cells (Electric or Combined Heat & Power).
To qualify for the SGIP incentive funds the customer must meet the program requirements which include but are not limited to an application, verified calculations of system performance, proof of a renewable fuel source, approved grid connection details, post-retrofit inspections and a varying amount of measurement and verification (M&V) to validate the system performance achieved. The current incentive levels by technology are listed below.
Table 7-2 – 2012 SGIP Incentive Levels by Technology and Fuel Type
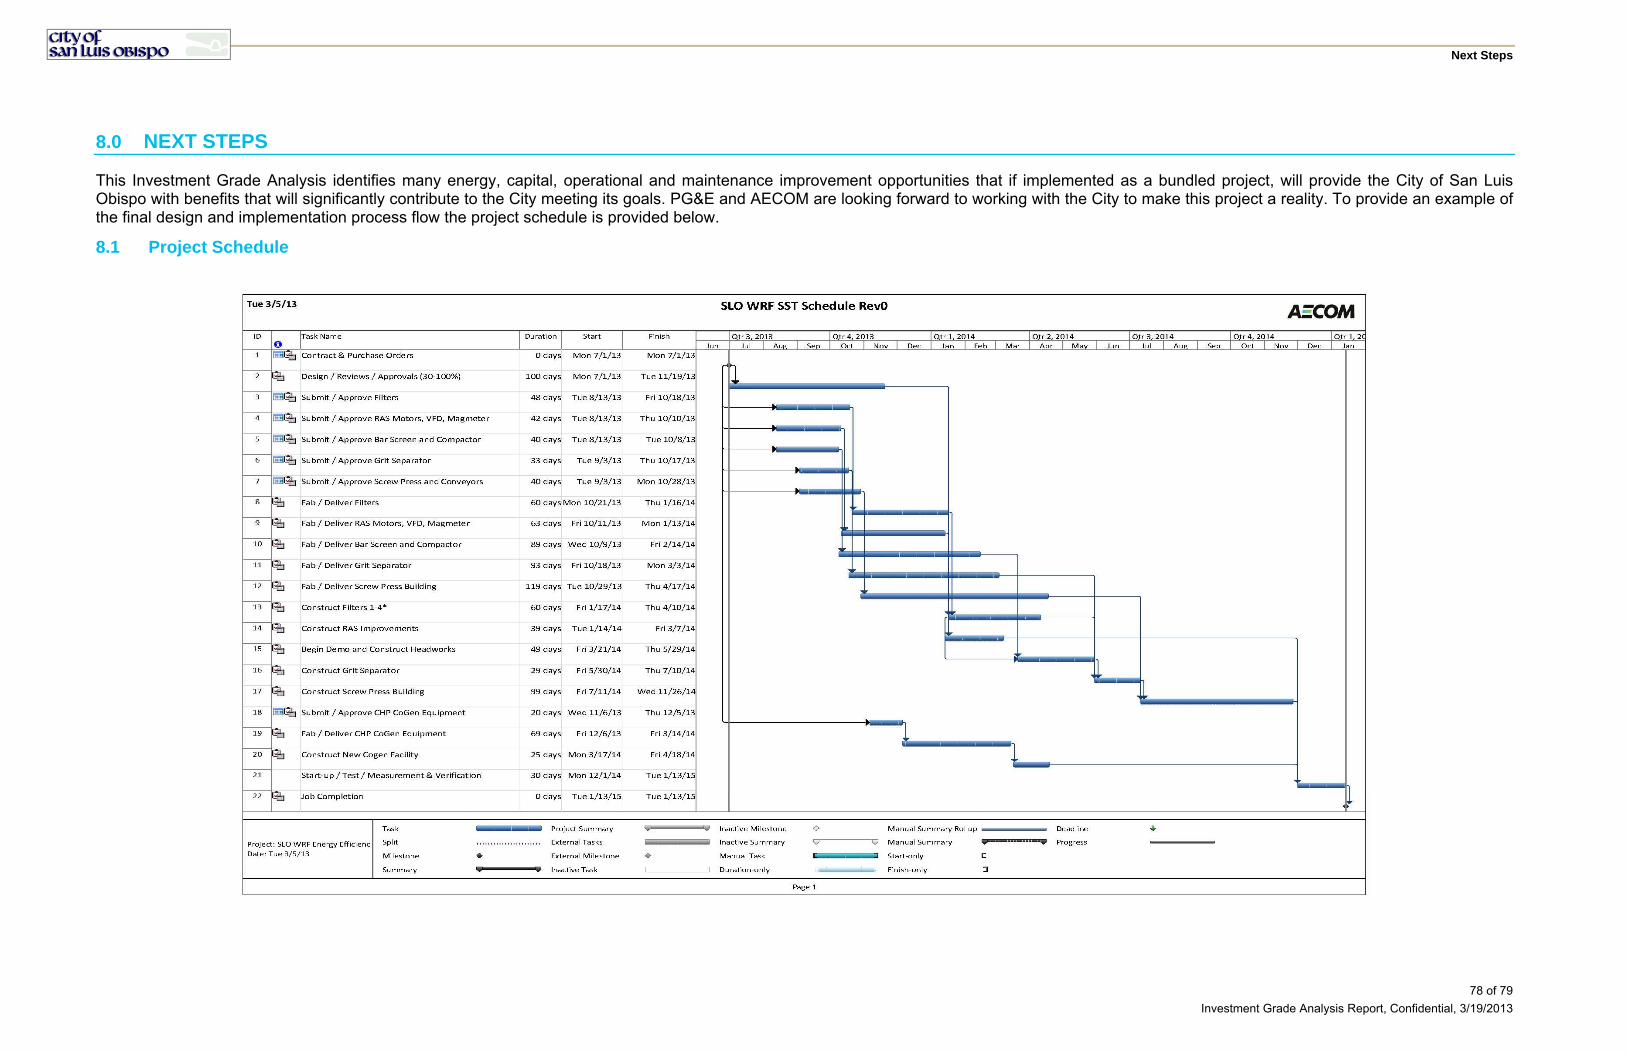
Next Steps
78 of 79
Investment Grade Analysis Report, Confidential, 3/19/2013
8.0 NEXT STEPS
This Investment Grade Analysis identifies many energy, capital, operational and maintenance improvement opportunities that if implemented as a bundled project, will provide the City of San Luis Obispo with benefits that will significantly contribute to the City meeting its goals. PG&E and AECOM are looking forward to working with the City to make this project a reality. To provide an example of the final design and implementation process flow the project schedule is provided below.
8.1 Project Schedule
Appendix
79 of 79
Investment Grade Analysis Report, Confidential, 3/19/2013
9.0 APPENDIX
9.1 Measure Design Plans & Specifications
WRF-1 150kW Cogeneration
WRF-2 Headworks Upgrades
WRF 4 Solids Dewatering
WRF-6 Filter Tower Upgrades
WRF-8 Exterior Lighting Upgrades
WRF-9 SCADA System Upgrades