Embed Size (px)
Citation preview

Investment ConferenceDiscussion Packscuss o acJP Morgan Investment Conferences
New York and EdinburghNew York and Edinburgh
October 2009
1
October 2009

IndexIndex
1 Philosophy, Performance and Direction 31 Philosophy, Performance and Direction 3
2 Sustainability 8
3 Group Overview 12
4 2009 F ll Y R lt 164 2009 Full Year Results 16
5 Operating Divisions 29
6 Capital Management 63
7 Outlook 65
8 Investor Relations Contacts and Information 66
2
Philosophy, Performance and DirectionPhilosophy, Performance and Direction

Long-term consistent strategiesLong term, consistent strategies
MANAGING BALANCE SHEET EFFECTIVELY
4

Recent evolution of WesfarmersAcquisition Events | Divestment Events | Growth Events | Capital Events
November 2006
November 2007Coles Group
Recent evolution of Wesfarmers
August 2003April 2001
November 2006OAMPS
April 2008
February/March 20093:7 rights issue
August 2003Landmark rural
services business
April 2001Westralian Farmers Co-operative and
Franked Income Fund dissolvedJune 2006Australian
Railroad GroupJanuary 2003Curragh North
August 2007Australian Vinyls
p1:8 rights issue
gDevelopment
November 2000Merger IAMA with
Wesfarmers DalgetyFebruary 2007
Wesfarmers Dalgety
May 2000Curragh coal mine October 2003
Lumley InsuranceAugust 2001Howard Smith
Crombie Lockwood & Coregas Pty Ltd
December 2000Australian Railroad GroupAugust 1999
Commitment $100m Gresham Private Equity Fund No 1
5
Private Equity Fund No. 1
FY99 FY00 FY01 FY02 FY03 FY04 FY05 FY06 FY07 FY08 FY09
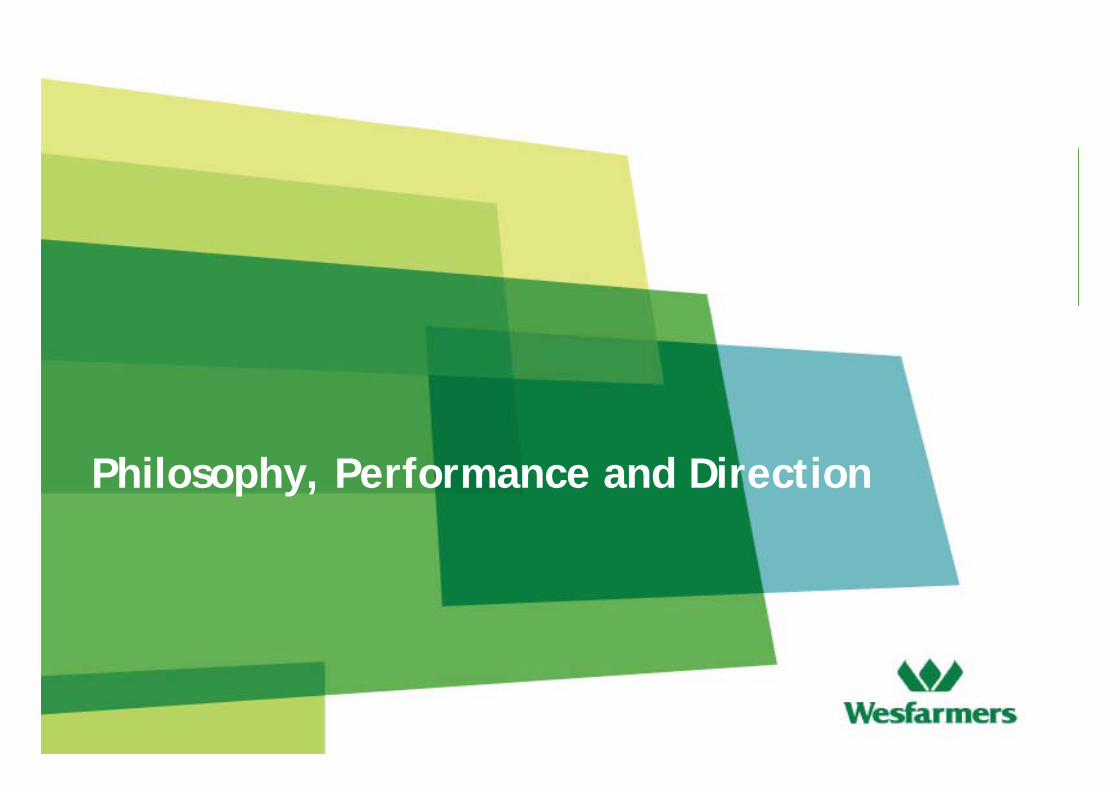
Portfolio of leading brandsPortfolio of leading brandsRetail Businesses Industrial Businesses
Insurance
Hotels
Insurance
6

Strong long-term performanceStrong long term performance
300
EPS (cents per share)
150
200
250
0
50
100
98 99 00 01 02 03 04 05 06 07 08 09
EPS (AGAAP) Girrah EPS Landmark EPS EPS (AIFRS) ARG EPS
Aug-99 Aug-00 Aug-01 Aug-02 Aug-03 Aug-04 Aug-05 Aug-06 Aug-07 Aug-08 Aug-09
Wesfarmers TSR Index All Ordinaries Accumulation Index 7

SustainabilitySustainability

SustainabilitySustainabilityFinancial performance• All our actions are directed towards satisfying our corporate objective of providing ay g p j p g
satisfactory return to shareholders. To be sustainable, Wesfarmers must continue toachieve high standards of financial performance thereby allowing us to make the mostmeaningful contribution possible to the community through wealth generation andemployment creation
Safe and rewarding workplaces• Wesfarmers is one of Australia’s largest private sector employers. Attraction and
retention of skilled and committed employees is one of our key priorities. We have anobligation to provide safe workplaces to treat our people with decency and respectobligation to provide safe workplaces, to treat our people with decency and respectand provide them with opportunities for interesting and rewarding career paths. Eachbusiness unit is set a target of reducing its lost time injury frequency rate by 50 percent a year on the path to zero. Remuneration of some senior staff is linked toachievement of safety targets
Good value products and services• Central to our business success is to maintain a reputation for quality and value across the range of our diversified suite
of operations. We seek to apply the same principles and standards to delivering export coal as we would to dealing with
y g
clients in the insurance businesses or catering to the needs of our retail customer base.
Respect for customers and suppliers• Retention of high levels of satisfaction in both these groups is essential if we are to continue to succeed. Extensive
customer feedback systems are maintained in the retail operations
9
customer feedback systems are maintained in the retail operations.

SustainabilitySustainabilityEnvironmental responsibility• Our diverse range of businesses expose us to a number of challenging or Wesfarmers is a Our diverse range of businesses expose us to a number of challenging or
potentially challenging environmental issues, including waste disposal,packaging, environmental contamination, energy use and greenhouse gasemissions. We set legal compliance as a minimum and seek to exceed thatwherever possible. During 2008/2009 Wesfarmers became a signatory to the
Wesfarmers is a member of the Dow Jones Sustainability World Indexes for 2009 Australian National Packaging Covenant.
Ethical dealings
World Indexes for 2009, rating it in the top 10 per cent of companies
• Respect for the letter and the spirit of the law is paramount. There are codesof ethics and conduct in place at both Group and business unit level, as wellas for the Board of Directors. Every year hundreds of our employeesparticipate in detailed seminars covering obligations under the TradeP ti A t i A t li d t ti l i l ti i N
assessed worldwide against economic, environmental and
Practices Act in Australia and consumer protection legislation in NewZealand.
Community contributionW b li th b fit f h i t ti d t iti W h i ifi t
social criteria
• We believe the company benefits from having a reputation as a good corporate citizen. We have a significantprogramme of support for community-focused organisations and causes for which the Board contributes up to0.25 per cent of before tax profits each year. In 2008/2009 this amounted to A$4.78 million within a total of$27.42 million attributable to cash, product and in kind support provided to the community by our businesses –in addition community based organisations in Australia and New Zealand received $31 82 million through
10
in addition community based organisations in Australia and New Zealand received $31.82 million throughactivities facilitated by our retail businesses in the main.
SustainabilitySustainabilitySustainability reporting• Voluntarily publicly reporting on sustainability issues since 1998/99. The stand-alone Sustainability Report is published to
coincide with the company's Annual General Meeting. The 2008 report runs to more than 130 pages of very detailed information p y g p p g yon our environmental, health and safety and community engagement performance and was independently verified using the AA1000 Assurance Standard. The report can be accessed on-line at www.wesfarmers.com.au. The 2009 report will be launched on 10 November.
Climate change• Greenhouse gas emissions from wholly-owned business units or those where we have management responsibility are disclosed
in the Sustainability Report . Our 08/09 emissions were approximately 6.53m tonnes CO2e, and we used approximately 29 petajoules of energy.
• Wesfarmers was again a respondent to the Carbon Disclosure Project in 2008, which provides full disclosure on greenhouse emissions and our overall approach to climate change issues. Our 2008 report can be accessed at www.cdproject.net. Duringemissions and our overall approach to climate change issues. Our 2008 report can be accessed at www.cdproject.net. During 2008/2009, Wesfarmers has continued to review the issue of carbon emission targets in the context of Australian and NZ carbonemissions policies, whilst focusing on energy efficiency initiatives.
• Our coal operations continued to contribute to the Coal21 Fund established by the Australian coal industry to demonstrate promising technologies to reduce greenhouse emissions from coal-fired power stations. The Fund is expected to raise up to $1 billion over 10 years with Wesfarmers putting in around $30 millionbillion over 10 years with Wesfarmers putting in around $30 million.
• We support the development of a global emissions trading framework and the establishment of the Australian national carbon emissions trading laws ahead of a global agreement- we believe while such a scheme will provide an effective platform for reducing emissions it must also carefully factor in economic conditions and hence allow for flexibility in implementation. The Australian Federal Government commenced the National Greenhouse and Energy Reporting scheme on 1 July 2008. The scheme ill record the majorit of A stralia’s greenho se emissions and energ se Wesfarmers has registered to participate inscheme will record the majority of Australia’s greenhouse emissions and energy use. Wesfarmers has registered to participate inthe scheme and has developed a management information system to comply with the complex requirements of these laws.
Energy efficiency• We have registered under the Australian government's Energy Efficiency Operations (EEO) programme which requires
companies using more than 0 5 petajoules in any year to conduct assessments and report on implementation of measures
11
companies using more than 0.5 petajoules in any year to conduct assessments and report on implementation of measures designed to increase energy efficiency. We believe there are financial as well as environmental benefits to be obtained fromadopting a positive approach to this legislative requirement and made our first Public Report in December 2008.
Group OverviewGroup Overview

Financial SummaryFY09 FY08*
Operating Results
% Change pcp
Financial Summary
Revenue A$m 50,982 33,584 51.8
EBITDA A$m 4,001 2,889 38.5
Earnings before interest and tax A$m 2,977 2,229 33.6
Net profit after tax (pre significant items) A$m 1,641 1,132 45.0
Net profit after tax (post significant items) A$m 1,535 1,063 44.4
Operating Cash flow per share cents 324.8 247.2 31.4
Financial Position
Total assets A$m 39,295 37,178 5.7
Net borrowings A$m 4,435 9,276 52.2
Shareholders' equity A$m 24,252 19,598 23.7
Capital expenditure on PPE (cash basis) A$m 1,503 1,241 21.1
Depreciation and amortisation^ A$m 1,024 660 55.2 Depreciation and amortisation A$m 1,024 660 55.2
Financial Performance
Basic earnings per share # cents 160.0 174.2 8.2
Dividends per share cents 110 200 45.0
Operating Cash flow per share A$ 3 25 2 47 31 4Operating Cash flow per share A$ 3.25 2.47 31.4
Return on average shareholders' equity % 7.4 0.0 1.2pt
Gearing (net debt to equity) % 18.3 47.3 29pt
Net interest cover (cash basis) times 5.3 4.9 8.2
^ including Stanwell amortisation (FY09 A$170m, FY08 A$58m and FY07 A$120m)# adjusted for rights issues in accordance with AIFRS
* Coles, Kmart, Officeworks and Target included for the period 23 Nov 07 to 30 Jun 08. Minor adjustments reflecting finalisation of Coles Group acquisition accounts and Insurance restatement.
13

Divisional SummaryDivisional Summary
Activities FY09 Revenue FY09 EBIT FY09 EBITActivities
(A$m) (A$m) Contribution*
Coles The division comprises one of Australia's largest supermarketbusinesses, liquor retailing outlets, fuel and convenience outlets. 28,799 831 25%
Home Improvement & Office Supplies
Australia and New Zealand's leading supplier of homeimprovement and outdoor living products, office products, and amajor supplier of building materials.
7,151 724 22%
Target Australian department store offering great quality and valueclothing and homewares. 3,788 357 11%
KmartAustralian and New Zealand discount department store retaileroffering a wide variety of quality and great value generalmerchandice and apparel
3,998 109 3%
14*based on operating divisional EBIT

Divisional Summary (cont )Divisional Summary (cont.)
Activities FY09 Revenue FY09 EBIT FY09 EBITActivities
(A$m) (A$m) Contribution*
Resources Mining of metallurgical and steaming coal to domestic and exportmarkets 2,411 915 28%
Insurance Provider of underwriting, broking, premium funding and financialservices activites in Australia, New Zealand and the UK. 1,720 91 3%
Industrial & Safety Australia and New Zealand's market leaders in the supply ofmaintenance, repair and operating products and safety products. 1,294 114 4%
Chemicals & FertilisersManufacture and marketing of industrial chemicals and fertilisersused in the mining, mineral processing, industrial andagricultural sectors.
1,162 52 2%
Production, marketing and distribution of LPG and LNG;
598 75 2%Energy manufacture and marketing of industrial, medical and specialitygases; and power generation
598 75 2%
Other Businesses50% interest in Gresham Partners; Gresham Private Equityinvestments; 50% interest in Wespine; and 23% interest in BWPT. 61 (190)
15*based on operating divisional EBIT
Includes non-trading items of $137m( )

2009 Full Year Results2009 Full Year Results

2009 Full Year Results2009 Full Year Results
• Operating revenue of A$51.0bn
Group Performance Highlights Year ended 30 June (A$m) 2009 2008* %
Revenue 50,982 33,584 51.8
EBITDA 4,001 2,889 38.5Operating revenue of A$51.0bn
– Significant revenue growth in the Resources,
Coles, Bunnings & Target businesses
EBIT 2,977 2,229 33.6
Net profit after tax (pre significant items) 1,641 1,132 45.0
Net profit after tax (post significant items) 1,535 1,063 44.4
Operating cash flow 3,044 1,451 109.8
• Group profit after tax of A$1,535 million
– Impacted by a number of significant external
Earnings per share (ex. employee res. shares)^ 160.0 174.2 (8.2)
Earnings per share (inc. employee res. shares)^ 159.0 172.5 (7.8)
Cash flow per share (inc. employee res. shares) 324.8 247.2 31.4
Dividends per share 110 200 (45.0)
f ( %) (1 2) tfactors and a slowing economy
• Strong cash generation with operating cash
flow of A$3 0bn350cps
Return on shareholders' funds (R12 %) 7.4 8.6 (1.2)pt
^ 2008 restated for equity raising in accordance with AIFRS
* Coles, Kmart, Officeworks and Target included for period of 23 Nov 07 to 30 Jun 08. Minor adjustments reflecting finalisation of Coles Group acquisition accounting and Insurance restatement
flow of A$3.0bn
• Earnings per share of 160.0 cents per share
FY09 di id d f A$1 10 h d f id 200
250
300
• FY09 dividends of A$1.10, ahead of guidance
– Reflecting strong free cash flow generation and
strength in the balance sheet 50
100
150
17
g0
2005 2006 2007 2008 2009Operating Cashflow* Free Cashflow* EPS*^
*Excludes the sale of ARG in 2006 based on WANOS including employee reserved shares^ Restated for equity raisings in FY08 and FY09

2009 Full Year Results2009 Full Year Results
Divisional Performance Overview Year ended 30 June (A$m) 2009 2008* %
Coles 831 475 n.m.• Coles turnaround continues to meet
Wesfarmers’ expectations
• Bunnings and Target delivered strong performances
Coles 831 475 n.m.Home Improvement 659 589 11.9Office Supplies 65 36 n.m.Target 357 221 n.m.Kmart 109 111 n.m.
performances
• Officeworks and Kmart transformations professing well
Kmart still at an early stage
Resources 915 423 116.3Insurance 91 122 (25.4)Industrial & Safety 114 130 (12.3)Chemicals & Fertilisers 52 124 (58.1)Energy 75 90 (16 7)– Kmart still at an early stage
• Record Resources production and sales
• Other Industrial and Insurance divisions i t d b t l f t d l i
Energy 75 90 (16.7)Other (including non-trading items) (190) (4) n.m.Divisional EBIT^ 3,078 2,317 32.8Corporate overheads (101) (88) (14.8)Group EBIT^ 2,977 2,229 33.6
impacted by external factors and a slowing economy
• Other EBIT includes A$137m of expenses relating to non trading items
*Coles, Kmart, Officeworks & Target included for period of 23 Nov 07 to 30 Jun 08^ EBIT is after amortisation of intangibles of A$83m (2007: A$53m)n.m. = not meaningful given acquisition date of 23 Nov 07
relating to non trading items
• Balance sheet strengthened with closing net debt to equity of 18.3%
18

Coles – 2009 Full Year PerformanceColes 2009 Full Year PerformanceHighlightsFood
• Encouraging sales trend with 4Q comp sales of 7 3% (Easter
Financial PerformanceYear ended 30 June (A$m) 2009 2008*
Revenue 28,799 16,876
Year ended 30 June (A$m) 2009 2008*
Revenue 28,799 16,876• Encouraging sales trend with 4Q comp sales of 7.3% (Easter
adjusted)
• Supply chain transformation reducing net working capital by five days
EBIT1 831 475Food & Liquor Revenue 3 22,506 12,825
Total store sales growth % 6.2 4.2Comp store sales growth % 4.6 2.8
EBIT1 831 475Food & Liquor Revenue 3 22,506 12,825
Total store sales growth % 6.2 4.2Comp store sales growth % 4.6 2.8y y
• Store network optimisation
• Continuing improvement of in-store offer
Liquor
Trading EBIT 1,3
EBIT Margin7433.3
4223.3
Convenience Revenue 3 6,273 4,038Total store sales growth % 2 8.0 8.9C t l th % 2 6 4 5 7
Trading EBIT 1,3
EBIT Margin7433.3
4223.3
Convenience Revenue 3 6,273 4,038Total store sales growth % 2 8.0 8.9C t l th % 2 6 4 5 7Liquor
• New management team driving change
• Improvements in operating model and value proposition
Convenience
Financial Performance – 2H09 v 2H08
Comp store sales growth % 2 6.4 5.7Trading EBIT 3 67 42Comp store sales growth % 2 6.4 5.7Trading EBIT 3 67 42
(A$m) 2H09 2H08 %(A$m) 2H09 2H08 %Convenience
• Improving customer service
• Ongoing network optimisation
Revenue 14,173 13,957* 1.5EBIT1 400 345 15.9Food & Liquor Revenue 3 11,315 10,554* 7.2
Comp store sales growth % 6.9 3.0 3.9pt
Revenue 14,173 13,957* 1.5EBIT1 400 345 15.9Food & Liquor Revenue 3 11,315 10,554* 7.2
Comp store sales growth % 6.9 3.0 3.9pt
Outlook
• Economic conditions remain fragile
• Coles will help customers stretch their dollar further
Trading EBIT 1,3 362 304 19.1
EBIT Margin 3.2 2.9 0.3pt
Convenience Revenue 3 2,848 3,390* (16.0)
Comp store sales growth % 2 7.4 5.4 2.0pt
Trading EBIT 1,3 362 304 19.1
EBIT Margin 3.2 2.9 0.3pt
Convenience Revenue 3 2,848 3,390* (16.0)
Comp store sales growth % 2 7.4 5.4 2.0pt
19
– Focus on quality, service & value
• Five year turnaround programme to continue at pace19
*Ownership period 23 Nov 07 to 30 June 2008. Incl. adj. for finalisation of acquisition accounting.n.m. = not meaningful given ownership period
11
1. Excludes non-trading items 2. Excl. fuel 3. Excl. property4. Includes 1 additional trading day due to the re-alignment of the Coles and Wesfarmers reporting calendars
Trading EBIT 3 31 30 3.3Trading EBIT 3 31 30 3.3

Home Improvement & Office Supplies2009 Full Year Performance2009 Full Year Performance
Highlights Financial Performance – Home ImprovementHome Improvement Year ended 30 June (A$m) 2009 2008Year ended 30 June (A$m) 2009 2008 %%
• Store on store cash sales growth of 10.1%
• 2.8% decline in trade sales in challenging markets
• 13 stores and 10 trade centres opened
Revenue 5,845 5,359 9.1
EBIT 659 589 11.9
ROC (R12 %) 30.2 31.2 (1.0)pt
Safety (R12 LTIFR) 14.4 13.5
Revenue 5,845 5,359 9.1
EBIT 659 589 11.9
ROC (R12 %) 30.2 31.2 (1.0)pt
Safety (R12 LTIFR) 14.4 13.5
• Improvements in offer and continued investment in store upgrades & category enhancements
Officeworks
Trading Revenue (excl. property & non-trading items) 5,808 5,265 10.3
Net property contribution 11 26
Trading EBIT (excl. property & non-trading items) 648 569 13.9
T di EBIT / T di R (%) 11 2 10 8 0 4 t
Trading Revenue (excl. property & non-trading items) 5,808 5,265 10.3
Net property contribution 11 26
Trading EBIT (excl. property & non-trading items) 648 569 13.9
T di EBIT / T di R (%) 11 2 10 8 0 4 t
Outlook
• Retail store sales growth of 7.7%, 10.6% lift in transactions
• Continued traction from reset strategic agenda
Financial Performance – Office Supplies1
Trading EBIT / Trading Revenue (%) 11.2 10.8 0.4ptTrading EBIT / Trading Revenue (%) 11.2 10.8 0.4pt
Home Improvement
• Continued cash sales growth; albeit tempered following Australian Government stimulus
Year ended 30 June (A$m) 2009 2008*
Revenue 1,306 802
EBIT 65 36
Year ended 30 June (A$m) 2009 2008*
Revenue 1,306 802
EBIT 65 36
• Positive trade contributions as economy recovers
• Network expansion 10 to 14 stores, strong store pipeline
Officeworks
ROC (R12 %) 5.7 n.m.
Safety (R12 LTIFR) 12.3 n.m.
EBIT / Revenue (%) 5.0 4.5
ROC (R12 %) 5.7 n.m.
Safety (R12 LTIFR) 12.3 n.m.
EBIT / Revenue (%) 5.0 4.5
20
• Moderate sales growth in retail stores
• Focus on executing strategic agenda
*Ownership period 23 Nov 07 to 30 June 2008. Incl. adj. for finalisation of acquisition accounting.n.m. = not meaningful given ownership period
(%) 5.0 4.5(%) 5.0 4.5

Target – 2009 Full Year PerformanceHighlights Financial Performance
Target 2009 Full Year Performance
• EBIT margin strength maintained at 9.4% Year ended 30 June (A$m) 2009 2008*Year ended 30 June (A$m) 2009 2008*
• FY09 comp store sales growth of 4.2%
– All departments increased sales over the period
• Cost control continued in a difficult environment
Revenue 3,788 2,198
EBIT 357 221
EBIT margin (%) 9.4 10.0
Revenue 3,788 2,198
EBIT 357 221
EBIT margin (%) 9.4 10.0
• Inventory fresh and at similar levels to last year despite growth in store network
• 16 new store openings, total stores 286
ROC (R12 %) 10.4 n.m.
Safety (R12 LTIFR) 9.1 n.m.
Total revenue growth (%) 7.2 7.4
Comp store sales growth (%) 4 2 3 3
ROC (R12 %) 10.4 n.m.
Safety (R12 LTIFR) 9.1 n.m.
Total revenue growth (%) 7.2 7.4
Comp store sales growth (%) 4 2 3 3
Outlook
p g ,
• 4Q comparative store sales growth of 6.4% (Easter adjusted)
Financial Performance – 2H09 v 2H08
Comp. store sales growth (%) 4.2 3.3
Store numbers 286 277
Comp. store sales growth (%) 4.2 3.3
Store numbers 286 277
• Subdued conditions expected following Australian Government stimulus packages
• Absolute focus on the customer and delivering what they
Financial Performance 2H09 v 2H08%%%%(A$m) 2H09 2H08
Revenue 1,694 1,593^ 6.3
EBIT 142 103 37.9
(A$m) 2H09 2H08
Revenue 1,694 1,593^ 6.3
EBIT 142 103 37.9
%%
g ydemand
• Careful management of margins and costs will be a key focus
EBIT margin (%) 8.4 6.5 1.9pt
Comp. store sales growth (%) 4.4 3.4
EBIT margin (%) 8.4 6.5 1.9pt
Comp. store sales growth (%) 4.4 3.4
*Ownership period 23 Nov 07 to 30 June 2008. Incl. adj. for finalisation of acquisition accounting.^ I l d 12 dditi l t di d d t th li t f th C l d W f ti
21
• Ongoing leverage of major expenses
• Seven new stores & 20 refurbishments in FY10 21
^ Includes 12additional trading day due to the re-alignment of the Coles and Wesfarmers reporting calendars
n.m. = not meaningful given ownership period
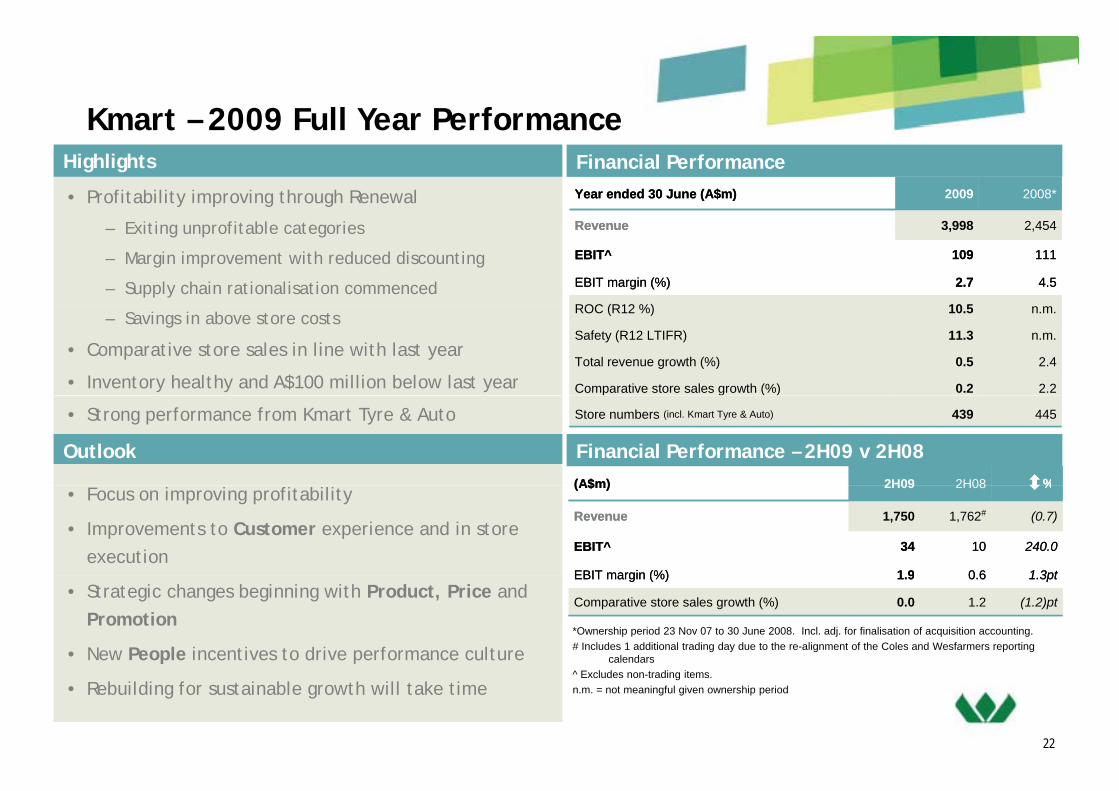
Kmart – 2009 Full Year PerformanceHighlights Financial Performance
Kmart 2009 Full Year Performance
• Profitability improving through Renewal Year ended 30 June (A$m) 2009 2008*Year ended 30 June (A$m) 2009 2008*
– Exiting unprofitable categories
– Margin improvement with reduced discounting
– Supply chain rationalisation commenced
Revenue 3,998 2,454
EBIT^ 109 111
EBIT margin (%) 2.7 4.5
ROC (R12 %) 10 5
Revenue 3,998 2,454
EBIT^ 109 111
EBIT margin (%) 2.7 4.5
ROC (R12 %) 10 5– Savings in above store costs
• Comparative store sales in line with last year
• Inventory healthy and A$100 million below last year
ROC (R12 %) 10.5 n.m.
Safety (R12 LTIFR) 11.3 n.m.
Total revenue growth (%) 0.5 2.4
Comparative store sales growth (%) 0.2 2.2
ROC (R12 %) 10.5 n.m.
Safety (R12 LTIFR) 11.3 n.m.
Total revenue growth (%) 0.5 2.4
Comparative store sales growth (%) 0.2 2.2
Outlook
• Strong performance from Kmart Tyre & Auto
Financial Performance – 2H09 v 2H08%
Store numbers (incl. Kmart Tyre & Auto) 439 445Store numbers (incl. Kmart Tyre & Auto) 439 445
(A$m) 2H09 2H08(A$m) 2H09 2H08 %%• Focus on improving profitability
• Improvements to Customer experience and in store execution
%(A$m) 2H09 2H08
Revenue 1,750 1,762# (0.7)
EBIT^ 34 10 240.0
EBIT margin (%) 1 9 0 6 1 3pt
(A$m) 2H09 2H08
Revenue 1,750 1,762# (0.7)
EBIT^ 34 10 240.0
EBIT margin (%) 1 9 0 6 1 3pt
%%
• Strategic changes beginning with Product, Price and Promotion
• New People incentives to drive performance culture
EBIT margin (%) 1.9 0.6 1.3pt
Comparative store sales growth (%) 0.0 1.2 (1.2)pt
EBIT margin (%) 1.9 0.6 1.3pt
Comparative store sales growth (%) 0.0 1.2 (1.2)pt
*Ownership period 23 Nov 07 to 30 June 2008. Incl. adj. for finalisation of acquisition accounting.# Includes 1 additional trading day due to the re-alignment of the Coles and Wesfarmers reporting
calendars
22
• Rebuilding for sustainable growth will take time
22
^ Excludes non-trading items. n.m. = not meaningful given ownership period

Resources – 2009 Full Year PerformanceResources 2009 Full Year PerformanceHighlights Financial Performance• Record full year production, sales and earnings
h h d f ll l d
Year ended 30 June ($m) 2009 2008 %
• Highest achieved prices for metallurgical and steaming coal (up to March 2009)
• Strong operational performance through global financial crisis
Revenue1 2,411 1,311 83.9
EBITDA 1,188 571 108.1
Depreciation & Amortisation2 (273) (148) 84.5
EBIT3 915 423 116 3crisis
• Curragh remains a lowest quartile cost producer despite industry wide cost increases
Blackwater Creek Diversion on schedule and budget
EBIT3 915 423 116.3
ROC (R12%) 85.4 43.0 42.4pt
Coal Production (‘000 tonnes) 15,107 14,318 5.5
Safety (R12 LTIFR)4 2.5 7.2
Outlook
• Blackwater Creek Diversion on schedule and budget
• Feasibility studies to expand Curragh Bengalla mines continue
Forecast Curragh Metallurgical Sales Mix
1. Incl. traded coal of $170m in 2009 (2008: $42m) and locked-in exchange rate losses of $88m in 20092. Includes Stanwell rebate amortisation of $170m in 2009 (2008: $58m)3. 2009 includes Royalties of $208m (2008: $73m) and $8m Char Plant write-down4. Curragh and Premier only
Outlook• Positive signs of global steel production recovery
• Forecast Curragh metallurgical sales of 6.2-6.7mt in FY10
• Significantly reduced earnings in 2009/10
Forecast Curragh Metallurgical Sales Mix
Significantly reduced earnings in 2009/10
– Stanwell rebate estimate $160 to $180 million in FY10 ($110-$120 million in 1H10) assuming AUD:USD $0.80
– Locked in hedge losses of $85m in FY10 (1H10 $65m)
Hard47 - 50%
Semi Hard20% 2009/10 estimate
6.2 - 6.7 million tonnes
23
• Aggressive cost reduction programmes in place; lower mine cash costs in FY10
• Timing of expansion projects subject to market conditions
PCI30 - 33%

Insurance – 2009 Full Year PerformanceInsurance 2009 Full Year PerformanceHighlights Financial Performance
• Frequency and severity of weather events affected Year ended 30 June ($m) 2009 2008^ %
underwriting claims and earnings
• Profit and margin growth in insurance broking
• Lumley NZ delivering on turnaround (A$32m YoY profit
Gross Written Premium Underwritten 1,358 1,328 2.3
Total Revenue 1,720 1,649 4.3
EBITA Underwriting 33 73 (54.8)
EBITA Broking 61 56 8.9improvement)
• Restructuring and management changes in Lumley Australia
g
EBITA Other 9 6 50.0
EBITA Insurance Division* 103 135 (23.7)
EBIT Insurance Division* 91 122 (25.4)
Net Earned Loss Ratio (%) 72 9 66 5 (6 4) pt
Outlook
• Consolidation of Australian underwriting licenses
• Five bolt-on acquisitions in insurance broking
Net Earned Loss Ratio (%) 72.9 66.5 (6.4) pt
Combined Operating Ratio (%) 103.2 99.1 (4.1) pt
EBITA Margin (Broking) (%) 27.9 26.7 1.2 pt
* Excludes non-trading items.
• Rate increases being achieved on renewal but competition is constraining market hardening
• Higher reinsurance costs and lower industry reserves
g^ Includes $10m prior year adjustment and $3m reclassification
to place more upward pressure on rates
• Maintain business focus in selected market segments
• Strong focus on underwriting and claims disciplines
24
• Deliver on turnaround of Lumley Australia
• Improvements in business processes and sales effectiveness
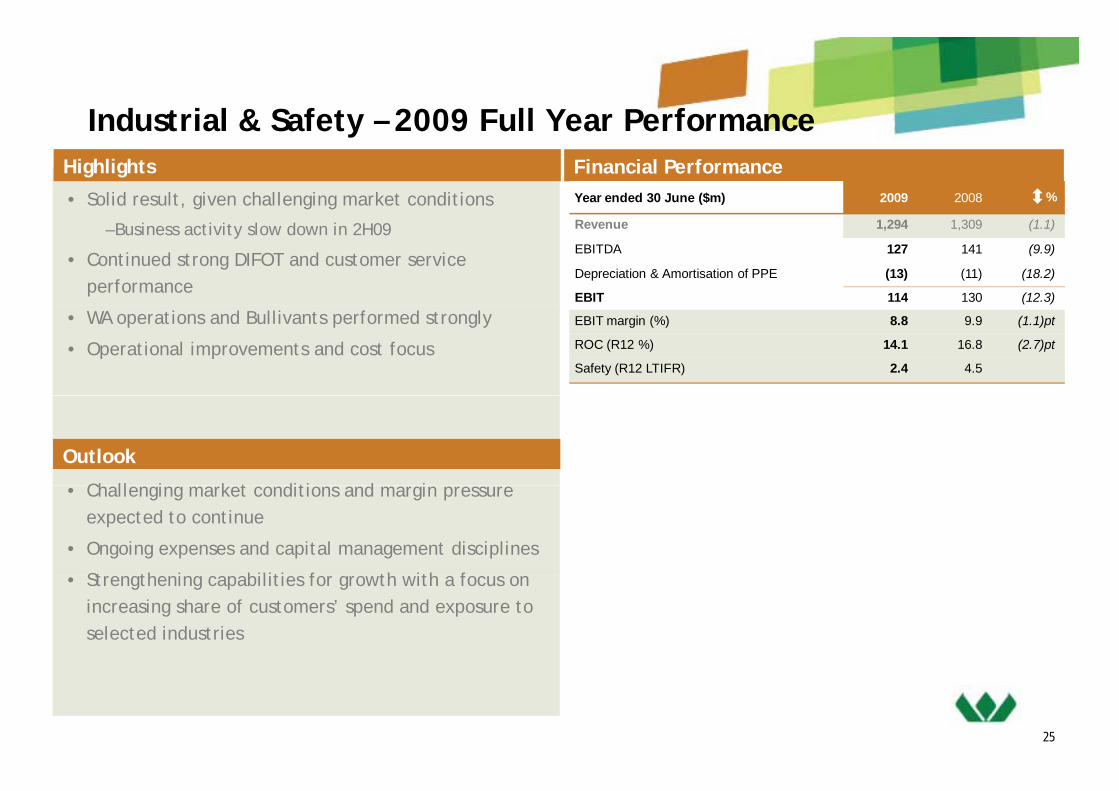
Industrial & Safety – 2009 Full Year PerformanceIndustrial & Safety 2009 Full Year PerformanceHighlights Financial Performance
• Solid result, given challenging market conditions Year ended 30 June ($m) 2009 2008 %
– Business activity slow down in 2H09
• Continued strong DIFOT and customer service performance
Revenue 1,294 1,309 (1.1)
EBITDA 127 141 (9.9)
Depreciation & Amortisation of PPE (13) (11) (18.2)
EBIT 114 130 (12.3)
• WA operations and Bullivants performed strongly
• Operational improvements and cost focus
EBIT margin (%) 8.8 9.9 (1.1)pt
ROC (R12 %) 14.1 16.8 (2.7)pt
Safety (R12 LTIFR) 2.4 4.5
Outlook
Ch ll i k t diti d i • Challenging market conditions and margin pressure expected to continue
• Ongoing expenses and capital management disciplines
St th i biliti f th ith f • Strengthening capabilities for growth with a focus on increasing share of customers’ spend and exposure to selected industries
25

Chemicals & Fertilisers – 2009 Full Year PerformanceChemicals & Fertilisers 2009 Full Year PerformanceHighlights Financial Performance
• Ammonium nitrate sales volumes up 52.1% Year ended 30 June ($m) 2009 2008 %
• Disruption of contracted gas supplies impacted production of sodium cyanide and ammonia
– Estimated EBIT impact (13 months) $65 million
Revenue Chemicals 615 464 32.5
Fertilisers 547 533 2.6
1,162 997 16.6
EBITDA 115 172 (33.1)
• Fertiliser sales volumes lower due to late seasonal break and economic conditions
• AVC loss due to Distributed Control System
Depreciation & Amortisation (63) (48) (31.2)
EBIT 52 124 (58.1)
Sales Volume (‘000t): Chemicals 747 605 23.5
Fertilisers 739 1,057 (30.1)
Outlook
implementation issues in 1H09 and impact of economic slowdown on PVC market
ROC (R12 %) 4.3 13.1 (8.8)pt
Safety (R12 LTIFR) 3.0 3.0
• Gas restrictions ceased in July 2009
• Sodium cyanide expansion expected to be commissioned by October 2009y
• Demand for ammonium nitrate in W.A. and Queensland remains strong
Working capital release expected over FY10
26
• Working capital release expected over FY10
• Return to normal trading conditions at AVC

Energy – 2009 Full Year PerformanceEnergy 2009 Full Year PerformanceHighlights
• Reduced earnings largely due to a reduction in
Financial Performance
Year ended 30 June ($m) 2009 2008 %
international LPG prices and gas supply disruption
– Estimated gas supply EBIT impact c$25 million
• Industrial gas EBIT growth despite weaker
Revenue 598 565 5.8
EBITDA 122 128 (4.7)
Depreciation & Amortisation (47) (38) (23.7)
EBIT 75 90 (16 7)Industrial gas EBIT growth despite weaker customer demand
• WA LNG project commissioned in September 2008
EBIT 75 90 (16.7)
ROC (R12 %) 9.2 11.6 (2.4pt)
WLPG production (kt) 170 168 1.2
Safety (R12 LTIFR) 2.2 6.3
Outlook
• Growth of LNG sales to Western Australian heave duty
vehicle marketvehicle market
• Coregas focus on business growth and operating
efficiencies
• LPG earnings dependent on international LPG prices,
LPG content and Western Australian gas market
27

Other Businesses – 2009 Full Year PerformanceOther Businesses 2009 Full Year PerformanceHighlights Financial Performance
Gresham Private EquityYear ended 30 June (A$m) Holding
% 2009 2008 Gresham Private Equity
• Carrying value of investment in Gresham Private Equity Funds $122mA t li P ifi P P d t di t d d i g th
Share of net profit/(loss) of associates:Gresham Private Equity Funds Various (57) 16
Gresham Partners 50 1 5 Wespine 50 4 5 B nnings Wareho se Propert Tr st 23 (8)• Australian Pacific Paper Products divested during the
period returning 4.5x cash invested• $57m loss due to revaluations relating to
investments held includes $35m in relation to
Bunnings Warehouse Property Trust 23 (8) - Sub-total (60) 27 Interest revenue 57 34 Dividend income - April 07 Coles Stake - 32 Non-trading items^ (137) (102) investments held, includes $35m in relation to
Riviera• 27% p.a. Cash IRR from Gresham Private Equity
Fund 1
* Incl. BPML, self insurance trading and investments. ^ Refer below
Non-Trading and Significant Items
Other* (50) 5 Total (190) (4)
— Riviera only remaining investment; carrying value of nil following receivership
• Investments held in diverse range of industries
Non Trading and Significant Items(A$m) FY09
Pre-taxFY09
Post-tax Segment Comment
Coles (52) (60) Other Property impairments partially offset by write-back of store exit provision
Kmart (70) (49) Other Supply chain and other restructuring
(A$m) FY09Pre-tax
FY09Post-tax Segment Comment
Coles (52) (60) Other Property impairments partially offset by write-back of store exit provision
Kmart (70) (49) Other Supply chain and other restructuring• Quarterly revaluations of remaining investments to
Wesfarmers’ earnings and non-cash in nature
Kmart (70) (49) Other Supply chain and other restructuring
Insurance & Other (15) (12) Other Single licence and other restructuring including Centrepoint exit
Non-trading items (137) (121)
Other (136) (95) Finance costs
Interest rate swap close-outs post debt repa ment
Kmart (70) (49) Other Supply chain and other restructuring
Insurance & Other (15) (12) Other Single licence and other restructuring including Centrepoint exit
Non-trading items (137) (121)
Other (136) (95) Finance costs
Interest rate swap close-outs post debt repa ment
28
( ) ( ) costs debt repayment
Tax adjustment - 110 Tax Reviews of leasehold tax base and R&D claims
Total (273) (106)
( ) ( ) costs debt repayment
Tax adjustment - 110 Tax Reviews of leasehold tax base and R&D claims
Total (273) (106)

Operating DivisionsOperating Divisions

ColesColes
30

Coles NetworkColes Networkat 30 June 2009
Supermarkets (sqm) 1,600,578Selling Area
7 8 11Liquor (sqm) – ex hotels 173,886
153 78230
251 5252
62 63081 693
67 43117
251 5252
195 162
211161
763 Supermarkets775 Liquor stores
195 162
14 15
3131
q95 Hotels625 Convenience

Coles – StrategyColes StrategyPhase 1 of turnaround on track…
f
Building a Solid Foundation
Delivering Consistently Well
Driving the Coles Difference
Performance
C lt f ti• Create a strong top team
• Cultural change
• Embed the new culture
• Team member development
I d t i
• Culture of continuous improvement
• Strong customer trust and l lt• Availability & store standards
• Value and customer trust
• Renewal store development
• Improved customer service
• Improved efficiency
• Appealing Fresh food offer
loyalty
• Strong operational efficiency
• Innovative & Improved offer • Renewal store development
• IT & supply chain infrastructure
• Liquor renewal
• Stronger delivery of value
• Scale rollout of new format
A t l i h t l t d
• New stores, new categories
32Year 1 - 2 Year 2 - 4 Year 4 - 5+
• Efficient use of capital • Auto replenishment completed

Coles – StrategyColes StrategyPhase 1 Progress
Create a strong top team 100% of leadership team new to Coles/role with over 125 years of retailing experience. 50% of zone manager new, 44% of Merchandise General Managers new. Continual increase in expectations and calibre of team.
Cultural change Move to customer centric structures and processes. Quarterly road-shows i i i t ti ith t Ab t i d t i llimproving interaction with store managers. Absenteeism down materially. Launch of Coles Retail Leaders programme and Coles graduate programme.
Availability & store standards Out of stocks down over 66%. Easy ordering trials near completion. Customer facing service investment Rising expectations in store standards Customerfacing service investment. Rising expectations in store standards. Customer response encouraging with customer satisfaction highest in over two years.
Value and customer trust Investment in weekly promotions; private label sales growing in double digits; NPD pipeline developing. Reinvestment in prices. p p p g p
Renewal store development 13 Pilot stores landed, showing encouraging early results.
IT & supply chain infrastructure DC modernisation complete; Improved service to stores
Liquor renewal Top team strengthened and restructured including appointment of Tony Leon. Accelerated change programme. Improved store standards and improved service and execution.
33
Efficient use of capital Inventory overstocks 65% lower than at acquisition. 5 day reduction in net working capital. Returns focus on capital expenditure.
Home Improvement & Home Improvement & Office Supplies
WIDEST RANGELOWEST PRICESBEST SERVICE
34

Bunnings NetworkBunnings Networkat 30 June 2009
175 Warehouse stores175 Warehouse stores
56 Smaller format stores
22 Trade Centres2
29 5 722
8
297
2
5 7
13
53
43
12
16
25
5
5
43
2 14
5
1
353535

Home Improvement PerformanceHome Improvement Performance
Growth Strategies EBIT A$m
ROC %Home Improvement Strategies
500
600
700$
25
30
35
40p g
Profitable sales growth Improving serviceExpanding the networkImproving the merchandise offer
Better stock flow Improving the end to end supply chain to lift in-stock levels and reduce costs
200
300
400
10
15
20
25
Engaging and developing a strong team
Improving productivity and execution
Effective delivery of safety, training and other team development programmes
Focus on reducing the cost of doing business through the continued development of systems and other business improvement and
0
100
2005 2006 2007 2008 2009
0
5
EBIT Return on Capital (R12)
Sustainability Continued commitment to reducing water, energy consumption and wastage
Improve affordability of sustainability projects for customers
and other business improvement and productivity projects
for customers
(A$m) 2005 2006 2007 2008 2009
Revenue 4,065 4,276 4,939 5,359 5,845
EBIT 416 421 528 589 659
EBIT/Revenue Ratio 10 2% 9 8% 10 7% 11 0% 11 3%
36
EBIT/Revenue Ratio 10.2% 9.8% 10.7% 11.0% 11.3%

Office Suppliers PerformanceOffice Suppliers Performance
Growth StrategiesRetail Stores
Officeworks & Harris Technology Network – 30 June ‘09Officeworks Strategies
123 Officeworks
5 Harris Technology
Retail Stores
B i
gImproving the customer offer Enhance and expand the range
Provide more useful customer informationRollout new special orders service
Improving customer service
T i i d d l t
Enhance service intensity through better rostering
118
24
40
11
2
1
1
1 4 Fulfilment Centres3 Service Centres
Business
2
Training and development Rollout of new POS systemInvesting process efficiencies back in to service
Building a stronger team Continued focus on improving safety and delivering team programmes that support and enhance the business and culture
38
2
1 1 1Reduced costs and complexity Reduce end-to-end supply chain costs
Optimise inventory levels
Drive sales and profitability Lift produce range authorityE d th t t k
Continue working to remove cost duplication and complexity
Expand the store network
Invest in more full store upgrades and merchandising uplifts
37

Target Target
38

Target PerformanceTarget PerformanceGrowth Strategies Latest Store Design - SunburyStrategies DetailsProfitable sales growth Continued investment in the store portfolio and targeted mix of Profitable sales growth
Product leader
Sustainability
Continued investment in the store portfolio and targeted mix of volumes in product ranges
Continued focus on core categories, supported by new and differentiated product development and improved speed to market
Continued focus on building sustainability into the business from
Target Network – 30 June ‘09
Right: Store Entry
Treatment and signage
Sustainability Continued focus on building sustainability into the business from new store design principles, to supply chain initiatives and product choices
33
and signage
3126
56
3126
56Left: Entry and Orientation Z
68
97
68
97
Zone
393939
286 Target stores(incl 116 Target Country)
55

Kmart Kmart
40

Kmart Store NetworkKmart Store Networkat 30 June 2009
2 3
36 52
20 2813 20
50 72
12
184 Kmart stores255 KTAS centres
43 74
5 6 3
41414141

Kmart PerformanceKmart Performance
Growth Strategies
Strategies DetailsCustomer
Product
Continue to improve the in-store experience and rebuild customer trust
Build on-trend profitable categories that deliver quality and
CustomerOutstanding C t
Focus on volume itemsRanges that are compatible for every store
Price Continue to communicate prices that customers trust and understand whilst offering everyday value
Build on trend profitable categories that deliver quality and reliability People
Best People, Great
Company
Product
Ranges Customers
Want
Customer Experience
Improve product marginReduce pricing administration
Promotion Build the brand and create events that excite customers
g y y
Develop marketing strategies that are simple, clear and compelling
Place
E Sit
Price
G t V l
Profit
Place Improve network profitabilityDeliver the best new locations that support the customer offerOptimise investment returns
People Customer-focused and engaged team membersDevelop programmes that motivate and drive performance
compelling Every Site a Success
Great Value EverydayPromotion
Clear CommunicationDevelop programmes that motivate and drive performance
Focus on creating safer workplaces
42424242
ResourcesResources
43

Resources - LocationsResources Locations
CoalCoal
Premier Coal
Curragh
44
Bengalla (40%)

Resources - PerformanceResources PerformanceGrowth StrategiesOpportunities Strategies
Long-term contracts ongoingMaximise export sales and optimise 1 000
EBIT A$m
100
ROC %
Long-term contracts ongoingPrice relativity maintainedMaximise higher value products
Cost reduction programmes Improve operational performanceCost reduction programmes in place
Maximise export sales and optimise sales mix
600
700
800
900
1,000
60
70
80
90
100
People, process and systemsEvaluate improved mining technology
Expansion opportunities
Extend product and market reach Evaluate acquisitions that offer economies
Timing of expansion projects subject to market conditions
200
300
400
500
600
20
30
40
50
60
Brownfield growth opportunitiesSustainability Safety and environmental performance
Community engagementCoal21
qof scale or downstream benefits
0
100
2005 2006 2007 2008 2009
0
10
EBIT (AIFRS) Return on Capital (R12)
(A$m) 2005 2006 2007 2008 2009
Revenue 764 1 304 1 134 1 311 2 411
Coal21
Revenue 764 1,304 1,134 1,311 2,411
EBIT 251 578 338 423 915
EBIT/Revenue Ratio 32.9% 44.3% 29.8% 32.3% 38.0%
45
Stanwell Amortisation 4 81 120 58 170
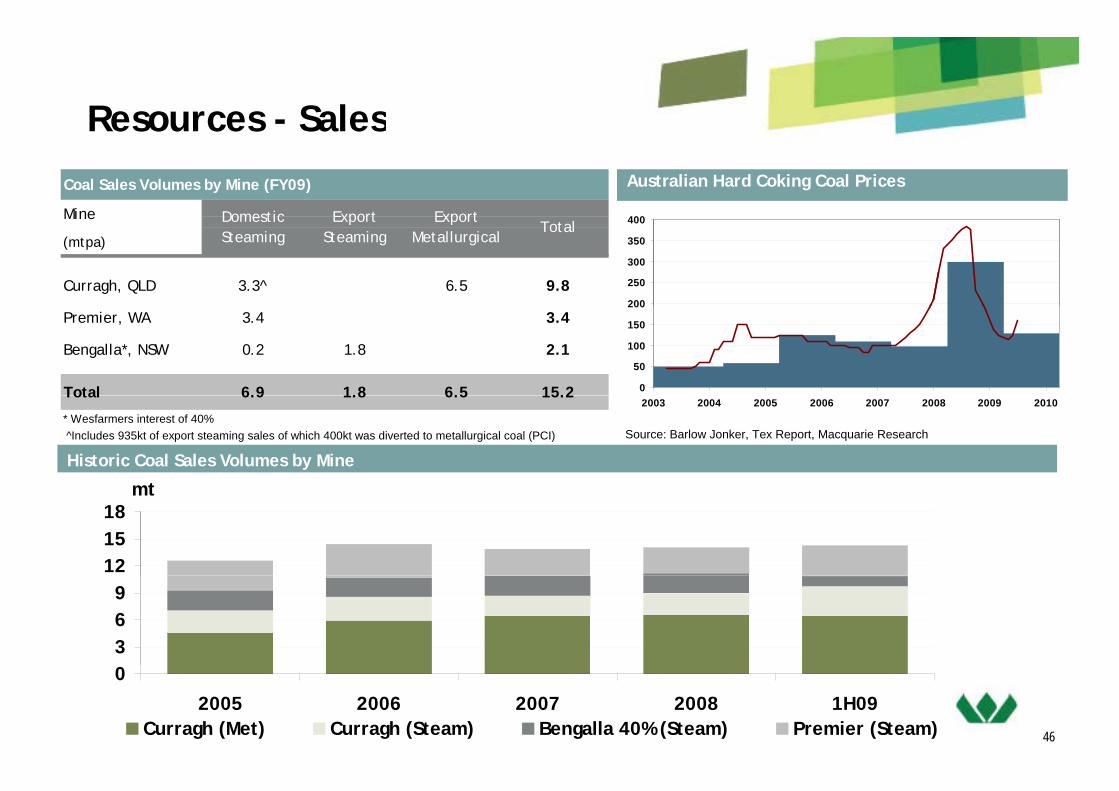
Resources - SalesResources SalesAustralian Hard Coking Coal Prices
400
Coal Sales Volumes by Mine (FY09)
Mine Domestic Export Export
200
250
300
350
400Mine
(mtpa)
Curragh, QLD 3.3^ 6.5 9.8
TotalDomestic Steaming
Export Steaming
Export Metallurgical
0
50
100
150
200Premier, WA 3.4 3.4
Bengalla*, NSW 0.2 1.8 2.1
Total 6.9 1.8 6.5 15.2
Historic Coal Sales Volumes by Mine
Source: Barlow Jonker, Tex Report, Macquarie Research
2003 2004 2005 2006 2007 2008 2009 2010
mt
Total 6.9 1.8 6.5 15.2
* Wesfarmers interest of 40% ^Includes 935kt of export steaming sales of which 400kt was diverted to metallurgical coal (PCI)
121518
mt
369
46
0
2005 2006 2007 2008 1H09Curragh (Met) Curragh (Steam) Bengalla 40% (Steam) Premier (Steam)

Hedging profile as at 30 June 2009Hedging profile as at 30 June 2009
Curragh – Open Contracts Bengalla – Open Contracts
Year end 30 Jun
Current US$ sold forward
(US$m)
AverageA$ / US$
hedge rate
Year end 30 Jun
Current US$ sold forward
(US$m)
AverageA$ / US$
hedge rate
2010 350 0.78
2011 285 0.79
2010 97 0.79
2011 65 0.79
2012 62 0.80 2012 34 0.77
2013 24 0.76 2013 10 0.78
Cl d t t I dditi t th b t t i fi i l d 30 J 2010 US$210Closed contracts: In addition to the above open contracts; in financial year end 30 June 2010 US$210m forward exchange contracts have been ‘closed out’ by offsetting US$ buy contracts in response to changed global market conditions
A$65m locked in losses to be booked in H1 2010 A$20m locked in losses to be booked in H2 2010
4747
– A$65m locked-in losses to be booked in H1 2010; A$20m locked-in losses to be booked in H2 2010

InsuranceInsurance
48

Geographical Presence Geographical Presence
33
6
1
31
UK
419
14
2 11
1
3
16 17
2
8
1
11
8
14
17 6
6
8
1Lumley Insurance (Australia) 12
3
2
21
Lumley General New Zealand
WFI
OAMPS
8634
10
4949
Crombie Lockwood 17

Insurance - PerformanceInsurance PerformanceGrowth Strategies
Opportunities StrategiesPortfolio review complete - remedial action underwayIT systems alignment and upgradeBuilding technical capabilitiesBusiness Improvementti
ng
160
EBITA A$m
35
ROC %
Building technical capabilitiesLGNZ margin improvementAustralian single licence effective 31 March 2009
New businesses Retail distribution opportunitiesLeverage combined capabilitiesStreamline support functions and empower branches
Business Improvement
Business Improvement
Und
erw
ri
100
120
140
20
25
30
Upgrade sales performance systemsLaunch of L&D programme
Continue broker acquisition programmeEconomies of scale for larger brokers
New SME insurance offerpromote ancillary business
Business Improvement
Acquisitions
New businesses
Brok
ing
40
60
80
10
15
promote ancillary businessLaunch of L&D programmeImproved incentives for high performersSelective hires in NZ, Australia & UK
Expand financial services offeringDevelop alternative distribution channels (retail)D
ivis
ion
Building the best team
Leverage distribution network
0
20
2005 2006 2007 2008 20090
5
EBITA (AIFRS) Return on Capital (R12)
(A$m) 2005 2006 2007 2008^ 2009
Gross Written Premium (underwriting) 1,020 1,026 1,191 1,328 1,358
Broking revenue na na 119 209 218
Acquisition opportunities Selectively evaluate opportunitiesEBITA (AIFRS) Return on Capital (R12)
g
EBITA Underwriting 133 122 97 73 33
EBITA Broking na na 32 56 61
EBITA Other 2 1 1 6 9
EBITA Insurance Division 135 125 130 135 103
50
EBIT Insurance Division 135 125 120 122 91
Combined Operating Ratio 86.1% 88.1% 94.2% 99.1% 103.2%
Above includes Lumley from Oct 2003, OAMPS from Nov 2006, and Crombie Lockwood from Mar 2007
^ Includes $10m adjustment and $3m recalssification

Insurance – Underwriting PerformanceInsurance Underwriting PerformanceFY09 Gross Written Premium by Class of BusinessKey Performance IndicatorsTotal $1,358mTotal $1,358mYear ended 30 June (%) 2009 2008Year ended 30 June (%) 2009 2008 %pt%pt
Liability $248
Marine $59
Personal $284
Gross Earned Loss Ratio 79.4 64.8 14.6
Net Earned Loss Ratio 72.9 66.5 6.4
Reinsurance Expenses (% GEP) 23.0 24.6 (1.6)
Gross Earned Loss Ratio 79.4 64.8 14.6
Net Earned Loss Ratio 72.9 66.5 6.4
Reinsurance Expenses (% GEP) 23.0 24.6 (1.6)Marine $59
Engineering $75
Crop $28Commercial
$272Other $47
Exchange Commission (% RI excl XOL) 24.7 24.6 0.1
Commission Expense (% GWP) 13.9 13.9 -
Total Earned Expenses (% GEP) 27.8 29.4 (1.6)
Combined Operating Ratio (% NEP) 103.2 99.1 4.1
Exchange Commission (% RI excl XOL) 24.7 24.6 0.1
Commission Expense (% GWP) 13.9 13.9 -
Total Earned Expenses (% GEP) 27.8 29.4 (1.6)
Combined Operating Ratio (% NEP) 103.2 99.1 4.1 Crop $28
Commercial Motor $345
$272Combined Operating Ratio (% NEP) 103.2 99.1 4.1
Insurance Margin (% NEP) 1.1 5.2 (4.1)
Combined Operating Ratio (% NEP) 103.2 99.1 4.1
Insurance Margin (% NEP) 1.1 5.2 (4.1)
51

Industrial & Safety Industrial & Safety Business Portfolio
Australia New Zealand
Industrial Specialists
“All your workplace needs”
Safety Specialist
(1)
52525252(1) Manufacturing and services

Industrial & Safety - Distribution Network
Australia No
Industrial & Safety Distribution Network240 locations (163 Australia, 77 New Zealand)
Australia No.
69 MRO, “All your workplace needs”
6 Electrical 14 6
21 1 16
12 76
42 Safety
22 Materials handling, lifting, rigging5
92 1
5
44 2 17
6 4
129 4
7
16 Fasteners
8 Engineering
1
11
64 1
4
5
New Zealand No.
20 MRO, hose, conveyor (1)
1171 1
253 1
20 y
24 Safety
22 Safety(1) 20221124
535353
11 Packaging, hygiene2211
As at 30 June 2009; (1) Including 11 co-located Blackwoods Paykels and Protector Safety branches

Industrial & Safety - PerformanceIndustrial & Safety PerformanceGrowth StrategiesOpportunities StrategiesIncrease sales to existing customers Maintained strong DIFOT performance and security of
140
EBIT A$m
18
ROC %g
Reinforced e-Business capabilitiesGrowing services
g p ysupply to customers
Strengthening range of leading and home brands at competitive prices
80
100
120
140
10
12
14
16
18
gOngoing investment in sales teams
Target higher growth sectors
Growing offshore salesInvestment in new service capabilities
Strengthened mining and infrastructure national management
20
40
60
80
4
6
8
10
Increase SME penetration Roll-out telesales operations in Australia
Increase competitiveness Ongoing reduction of organisation complexity and costNetwork optimisation
Continued networks upgrade, increased promotional and sponsorship activities
0
20
2005 2006 2007 2008 2009
0
2
EBIT (AIFRS) Return on Capital (R12)
(A$m) 2005 2006 2007 2008 2009
Revenue 1 175 1 164 1 208 1 309 1 294 Revenue 1,175 1,164 1,208 1,309 1,294
EBIT 109 97 115 130 114
EBITA/Revenue Ratio 9.3% 8.3% 9.5% 9.9% 8.8%
54

Chemicals & FertilisersChemicals & Fertilisers
55

Chemicals & Fertilisers - LocationsChemicals & Fertilisers Locations
■ CSBP fertilisers■ CSBP fertilisersManufacturing plant 5
Import and distribution centres 5
Depots 6p
Regional Sales Representatives 27
Sales agents 135
■ CSBP chemicalsManufacturing plants 10
■ AV Manufacturing plants 2
■ QNP (50%)f i lManufacturing plants 4
56

Chemicals & Fertilisers – PerformanceChemicals & Fertilisers Performance
Growth Strategies140
EBIT A$m
20
ROC %
Opportunities Strategies
80
100
120
140
12
14
16
18
20Opportunities StrategiesSodium cyanide expansion (+8,000 tpa)
Optimise cost and capital Inventory and expense management
Maintain & Grow Businesses Improve ammonia plant production performance
40
60
80
4
6
8
10
12Sustainability Sustainability framework and legacy issues
Ongoing information system improvementsI d t i i g d f
Improved capabilities and people development
Preparation for Carbon Pollution Reduction Scheme
0
20
2005 2006 2007 2008 20090
2
4
EBIT (AIFRS) Return on Capital (R12)
Improved training and focusGreater cultural alignment
EBIT (AIFRS) Return on Capital (R12)
(A$m) 2005 2006 2007 2008 2009
Revenue 587 595 592 997 1,162
EBIT 89 81 101 124 52
EBIT/Revenue Ratio 15.2% 13.7% 17.0% 4.8% 4.5%
Sales Volumes - Chemicals (kt) 456 490 449 605 747
57
Sales Volumes - Fertlisers (kt) 1,120 959 901 1,057 739

EnergyEnergy
58

Energy - locationsEnergy locations
I d i l di l d i l Industrial, medical and specialty gasesAir separation units (ALWA)
Air separation units (Coregas)
Hydrogen/acetylene plants (Coregas)Hydrogen/acetylene plants (Coregas)
Industrial gas depots/branches (ALWA)
Industrial gas depots/branches (Coregas)
Acetylene plant (ALWA)514
1 1
121 1
LPG & LNGLPG depots/branches
LPG extraction facility
219 5
1
111 41
LNG production facility
Power generationPower stations owned and/or operated
2 1
9 39 3
2
59

Energy - PerformanceEnergy PerformanceGrowth Strategies
Industrial gas growth in:
SegmentStrategiesIndustrial gas growth in:
SegmentStrategies100
EBIT A$m
50
ROC %
Industrial gas growth in:• eastern states sales; and• oil and gas sector
Maximise LPG productionLPG distribution:
• customer focus; and
Improve – Existing Businesses
Industrial gas growth in:• eastern states sales; and• oil and gas sector
Maximise LPG productionLPG distribution:
• customer focus; and
Improve – Existing Businesses60
70
80
90
30
40
Industrial gas – supply projectsLNG – WA Project:
• customer focus; and • controllable costs
Pursue new power generation projects
d D li P j
Industrial gas – supply projectsLNG – WA Project:
• customer focus; and • controllable costs
Pursue new power generation projects
d D li P j20
30
40
50
10
20
LNG projects – east coastOther alternative fuels and renewables
• Plant / Distribution• HDV market development• Power stations
Evaluate – New Opportunities
Expand – Deliver Projects
LNG projects – east coastOther alternative fuels and renewables
• Plant / Distribution• HDV market development• Power stations
Evaluate – New Opportunities
Expand – Deliver Projects
0
10
2005 2006 2007 2008 20090
EBIT (AIFRS) Return on Capital (R12)
(A$m) 2005 2006 2007 2008 2009
Revenue 398 372 463 565 598
EBIT 66 49 75 90 75
EBITA/R R ti 16 6% 13 3% 16 3% 15 9% 12 5%
60
EBITA/Revenue Ratio 16.6% 13.3% 16.3% 15.9% 12.5%

Energy – BusinessesEnergy Businesses
distributor and marketer of LPG and LNG andActivities
Activities
240 156T LPG
distributor and marketer of LPG and LNG andgas appliances to a broad range of domestic,commercial, autogas and industrial customers
Sales VolumesMW installed: 90
Activities
Operations
design, construction, operatation andmaintenance of both company-owned andcustomer-owned power stations
Port Kembla Air Capacity:Separation Unit: 1 350 TPD Oxygen
Production, distribution and marketing ofindustrial and medical gases on Australia’s eastcoast.
Operations
2008/09 Actual: 240,156T LPG 25,156T LNG
Depots 36Branches 16Commission agents 29
Sites
GWh generated per annum: 376Power stations: 20Customers: 6 Acetylene plant 200 m3/hr
Cylinder filling operations: 5Specialty gas laboratory 20 cylinders/dayCustomers: 9,500
Separation Unit: 1,350 TPD OxygenHydrogen Plant: 1000 m3/hr
Franchisees 11Dealers 592
Customers 258,000 ActivitiesAir Liquide WA is a joint venture betweenWesfarmers (40%) and Air Liquide Australiamanufacturing and supplying a range ofi d t i l di l d i lt
Activitiesowns and operates LPG and LNG extractionfacilities in Western Australia supplyingKleenheat Gas domestically and exportmarkets
Production Volume
Air Separation Plants: Kwinana: Capacity 285 TPD Oxygen Hismelt: Capacity 880 TPD OxygenCarbon Dioxide Plants: CSBP C i 130 TPD
Operations
industrial medical and specialty gases
2008/09 Actual: 170,326T
2008/09 Actual: Export: 52.9kT Domestic: 139.3kT
Customers 2
Sales Volumes
Production Volume CSBP: Capacity 130 TPDCylinder Filling Operations: 3Branches: 3 in Western Australia
1 in Northern TerritoryAgents: 60Customers: 12,450
61
Customers 2
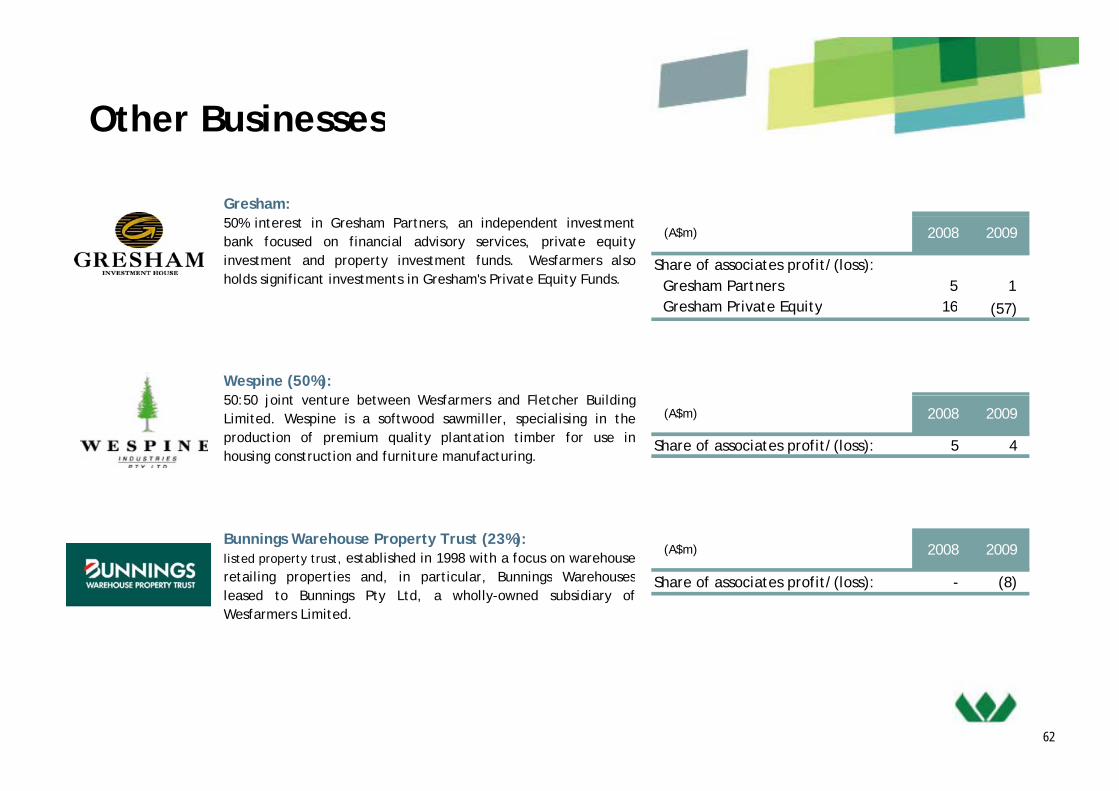
Other BusinessesOther Businesses
Gresham:
(A$m) 2008 2009
Share of associates profit/(loss): Gresham Partners 5 1 Gresham Private Equity 16 (57)
50% interest in Gresham Partners, an independent investmentbank focused on financial advisory services, private equityinvestment and property investment funds. Wesfarmers alsoholds significant investments in Gresham's Private Equity Funds.
Gresham Private Equity 16 (57)
Wespine (50%):50 50 j i t t b t W f d Fl t h B ildi
(A$m) 2008 2009
Share of associates profit/(loss): 5 4
50:50 joint venture between Wesfarmers and Fletcher BuildingLimited. Wespine is a softwood sawmiller, specialising in theproduction of premium quality plantation timber for use inhousing construction and furniture manufacturing.
(A$m) 2008 2009Bunnings Warehouse Property Trust (23%):listed property trust, established in 1998 with a focus on warehouseretailing properties and in particular Bunnings Warehouses Share of associates profit/(loss): - (8)retailing properties and, in particular, Bunnings Warehousesleased to Bunnings Pty Ltd, a wholly-owned subsidiary ofWesfarmers Limited.
62
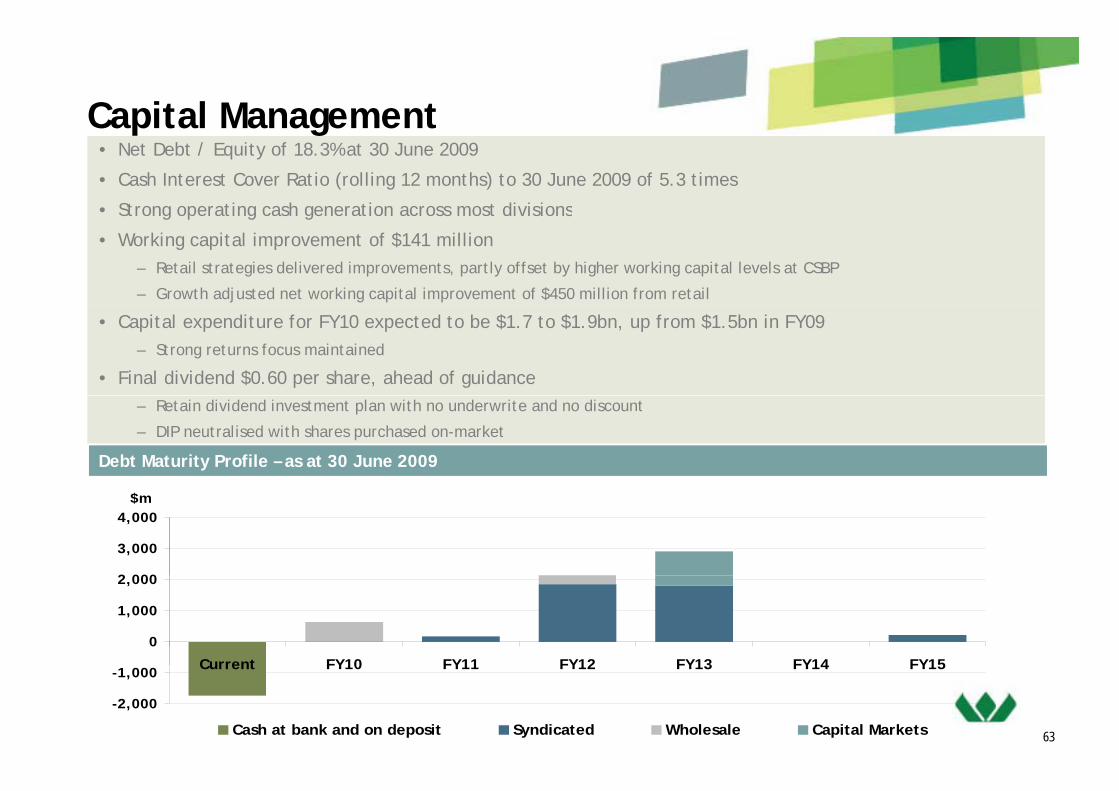
Capital Management• Net Debt / Equity of 18.3% at 30 June 2009
• Cash Interest Cover Ratio (rolling 12 months) to 30 June 2009 of 5.3 times
• Strong operating cash generation across most divisions
Capital Management
St o g ope at g cas ge e at o ac oss ost d v s o s
• Working capital improvement of $141 million– Retail strategies delivered improvements, partly offset by higher working capital levels at CSBP
– Growth adjusted net working capital improvement of $450 million from retail
• Capital expenditure for FY10 expected to be $1.7 to $1.9bn, up from $1.5bn in FY09– Strong returns focus maintained
• Final dividend $0.60 per share, ahead of guidance– Retain dividend investment plan with no underwrite and no discount
– DIP neutralised with shares purchased on-market
Debt Maturity Profile – as at 30 June 2009
2 000
3,000
4,000$m
0
1,000
2,000
Current FY10 FY11 FY12 FY13 FY14 FY15
63
-2,000
-1,000 Current FY10 FY11 FY12 FY13 FY14 FY15
Cash at bank and on deposit Syndicated Wholesale Capital Markets

CashflowCashflow
• Retail strategies delivered improvements in working capital during the year, partl offset b higher orking capital le els in CSBPpartly offset by higher working capital levels in CSBP
3,000
3,500$m
120
140%
1 500
2,000
2,500
60
80
100
500
1,000
1,500
20
40
60
0
2005 2006 2007 2008 2009
0
64
NPATDA* Operating Cash Flow Cash Realisation Ratio
64* Adjusted for Stanwell and significant non-cash NTIs and impairments

OutlookOutlook
• Cautiously optimistic about the economic outlook in FY10 although y p gcognisant of a degree of ongoing fragility
• Underlying retail trading conditions remain somewhat volatile and difficult toUnderlying retail trading conditions remain somewhat volatile and difficult to predict despite recent signs of growing consumer confidence
– Impact of cycling 2008/09 Government stimulus packages– Impact of cycling 2008/09 Government stimulus packages
• Retail business turnarounds to continue at pace
• Resources’ FY10 earnings to reduce significantly due to lower export prices
• Remaining businesses expected to improve assuming more normalised conditions prevail
• Continued focus on growth in ROC, cash flows and balance sheet strength
65
g g
65

Investor Relations ContactInvestor Relations ContactWesfarmer’s Investor Relations For further information on Wesfarmers including:
Tanya Rybarczyk 61 8 9327 [email protected] Annual reports
Financial results announcements
Address
Financial results announcements
Presentations and webcasts
Corporate policiesAddress
Wesfarmers House
40 The Esplanade Please visit our website
Perth WA 6000
Fax: 61 8 9327 4320
www.wesfarmers.com.au
Important Notice and Disclaimer
• The material contained in this presentation is intended to be general background information on Wesfarmers Limited and its activities
• The information is supplied in summary form and is therefore not necessarily complete. Also, it is not intended that it be relied upon as advice to investors or potential investors, who should consider seeking independent professional advice depending upon their specific investment objectives, financial situation or particular needs
66
particular needs
• The financial information contained in this presentation includes non-GAAP financial measures. For a reconciliation of these measures to the most comparable GAAP measure, please refer to half and full year financial statements filed with the Australian Stock Exchange
• Nothing in this release should be construed as either an offer to sell or a solicitation of an offer to buy or sell shares in any jurisdiction