Embed Size (px)
Citation preview

1
Investing in Broadband Investing in Broadband CommunicationsCommunications
Presented byAndrew Kau – General Partner
December 5, 2002

2
Equipment Vendor Balance Sheet AnalysisEquipment Vendor Balance Sheet Analysis
TELLABSSIEMENSNORTELNOKIAMOTOROLALUCENTERICSSONCISCOALCATELUSD M
1994,7093566,6342,72591(1,507)6,4829812003E
1103,161(933)6,1101,662(1,859)(2,582)4,7821932002E
Free Cash Flow
110,5434,7901,0428,9435,1606,999--5,965Debt
9938,8914,8696,3036,4875,4238,20421,0614,723Cash
$1,888$31,357$1,919$69,126$24,668$2,849$8,025$74,971$3,231Market Cap
Sourced: Bear Stearns

3
Walden International Overview Walden International Overview
Founded in 1987
Extensive presence in Asia and U.S.
Relationships with top tier investors
Fifteen General Partners
US$2.0 billion under management

4
Geographic Coverage Geographic Coverage
Singapore
San Francisco
Mumbai
Beijing
Hong Kong
Palo Alto
Kuala Lumpur
Manila
Taipei
Tokyo
Shanghai

5
Team Experience and ExpertiseTeam Experience and Expertise
Semiconductor
Areas of Focus
Communications
Life SciencesEnterprise Software
IT Services / Integration
Semiconductor

6
VentureVenture--Backed Backed IPOsIPOs in the USin the US
$3.7$4.6
$8.7
$0.9$1.7
$18.8
$19.4
1121
200
248
68
121
216
0
5
10
15
20
25
1996 1997 1998 1999 2000 2001 YTD 2002
USD
Bill
ion
0
50
100
150
200
250
300
# of
IPO
s
$ Raised at IPO # of IPOs
Source: VentureOne

7
US VCs US VCs -- $ Raised & $ Invested$ Raised & $ Invested
$12 $16 $18$20
$31 $27
$61$68
$106
$128
$41
$54
$5
$19
$0
$20
$40
$60
$80
$100
$120
$140
USD
Bill
ion
1996 1997 1998 1999 2000 2001 YTD 2002
$ Raised $ Invested
Source: Venture Economics

8
Asian VCs Asian VCs -- $ Raised & $ Invested$ Raised & $ Invested
Source: AVCJ
$7.4
$4.9
$16.6
$9.1
$17.9
$12.3 $12.1 $11.9
$1.1
$5.6
02468
1012141618
USD
Bill
ion
1998 1999 2000 2001 YTD 2002
$ Raised $ Invested

9
PRC Government PlanPRC Government Plan
Information Technology becoming a new driving force of China’s economy growthChina’s MII a 10-year plan focusing on network construction, software development and R&D of core IT technologies, incl.
Making a strategic adjustment to its existing networks under the principle of integrating computer networks, telecom and cable TV networksBuilding high-speed broadband information network, providing voice as well as data and multimedia transmission services
Core IT Technology sectorAim to master core technologies, including IC and software developmentMake breakthroughts in R&D of large-scale IC, high-function computers, large scale system software, high-speed network systems, new generation mobile communications and digital TV broadcasting
Changes in regulationTelecom carriers are free to set tariffs on non-basic services such as ISDN local calls, voice mail rentals, cellular SIM card fees and satellite mobile

10
China Communications marketChina Communications market
Broadband (ADSL + Ethernet)# of broadband users in 2001 was between 1.8 to 2 millionCapacity of broadband networks was 5.7 million in 2001
CellularProjected by IDC to reach 166 million subscribers in 2002Mobile penetration reached 6.7%
OpportunitiesWireless LANDSL deploymentMetro / access optical networks Broadband access

11
StatisticsStatistics
Output of IT industry accounted for 4.2% of China’s GDP in 2001, up from 2% in 1995 and is expected to double to account for more than 7% of the national GDP by 2005Under the 10th 5-Year Plan, by 2005
China’s IT industry to reach RMB 920 billion (~USD111 billion) Sales revenue of electronic IT products expects to reach RMB 1.5trillion (~USD181 billion)Export of electronic IT products will rise to USD100 billionTelecom revenue expects to be RMB1 trillion (~USD121 billion)40 million Internet-connected computersA telephone penetration of 40%200 million data, Internet and multimedia usersInternet penetration rate of 15%
China’s IT market has approximately 46,000 IT companies

12
OpportunitiesOpportunities
“Digital Olympics” programBuilding of telecommunications infrastructure and network systems Creation of Media Village for the press
Workstations with sophisticated equipment and facilities, including high definition TV signals, ISDN telephones, multimedia network terminals, various wire and wireless wideband access
Government support & budget will accelerate infrastructure investment
Set up a mobile communication product R&D fund to bolster domestic technology development
Current MAN infrastructure is limited in both capacity and coverage, require major built out

13
DWDM EndDWDM End--users Revenues users Revenues Asia Pacific (excluding Japan)Asia Pacific (excluding Japan)
Long Haul DWDM Systems by Country (% of 1H 2001 Revenues)
PRC81.2%
Taiwan5.4%
Thailand0.9%
Australia6.7%
Malaysia1.9%
Korea0.7%
Philippines1.3%
New Zealand0.3%
India1.6%
Metropolitan DWDM Systems by Country (% based on 1H 2001 Revenues)
Hong Kong8.6%
India3.3%
Korea35.1%
PRC37.9%
Australia11.0%
Singapore4.1%
Revenues of USD 349 million
Revenues of USD 29 million
Source: IDC

14
China China –– Market Forecast for DWDM SystemsMarket Forecast for DWDM Systems
$350
$11
$592
$14
$847
$24
$1,211
$44
$1,514
$75
$1,635
$118
$0
$200
$400
$600
$800
$1,000
$1,200
$1,400
$1,600
$1,800
Rev
enue
s in
USD
mill
ion
2000 2001 2002 E 2003 E 2004 E 2005 E
Long Haul Metro
Carriers continue to build up their fibre optic network and utilize DWDM equipmentData and voice traffic continue to increase at high rates, which cannot be met by traditional managed networks services like DDN
Source: IDC

15
China China –– Market Forecast for Optical CrossMarket Forecast for Optical Cross--ConnectsConnects
$6$35
$62
$218$253
$311
$0
$50
$100
$150
$200
$250
$300
$350
Rev
enue
s in
USD
mill
ion
2000 2001 2002 E 2003 E 2004 E 2005 E
Optical Switch - Opaque
Optical switches are deployed by new generation carriers and potential service providers to build up their optical network.
Source: IDC

16
China China –– Telecom Service Revenues ForecastTelecom Service Revenues Forecast
$0.5 $0.7 $0.8$1.1
$1.3$1.6
$0.0
$0.5
$1.0
$1.5
$2.0
Reve
nue
Fore
cast
USD
bi
llion
2000 2001 2002E 2003E 2004E 2005E
MDNS
$17,730$21,691
$25,845$29,903
$33,599 $36,775
$0
$5,000
$10,000
$15,000
$20,000
$25,000
$30,000
$35,000
$40,000
Rev
enue
For
ecas
t USD
mill
ion
2000 2001 2002E 2003E 2004E 2005E
PSTN Service
$4.0$9.0 $13.0
$41.0
$215.0
$306.0
$0$50
$100$150$200
$250$300$350
Rev
enue
For
ecas
t USD
M
2000 2001 2002E 2003E 2004E 2005E
IP-VPN
$0.2 $0.8$2.0
$4.0
$6.5
$9.4
$0
$2
$4
$6
$8
$10
Reve
nue
Fore
cast
USD
B
2000 2001 2002E 2003E 2004E 2005E
VoIP Services
Source: IDC

17
China China –– Broadband Services Revenue ForecastBroadband Services Revenue Forecast
$16 $46
$146
$389
$733
$1,221
$1,646
$1,919
$45 $97$184
$400
$684
$829
$39
$135
$1,108
$937
$627
$318
$8$153
$368
$730
$0
$500
$1,000
$1,500
$2,000
$2,500
2000 2001 2002E 2003E 2004E 2005E
USD
mill
ion
ADSL Cable ModemMetroEthernet FWA
Source: IDC
18
Macro approach Macro approach –– what we dowhat we do
Strong commitment to Asia
Establish strong local government and industrial networks
Build strong local investment team in Shanghai / Hong Kong / Beijing offices
Develop / expand proprietary deal flows
Provide global value adding services and strong domain knowledge
19
What we requireWhat we require
Entrepreneurs With technical experience and entrepreneurs mentality
Understand local market / local customer needs
Experience in general management
Hungry to build scalable world class companies

20
WI WI -- Investments in Asia Investments in Asia (from 1992 to Aug(from 1992 to Aug--02)02)
Others7%
China/Hong Kong27%
India6%
Malaysia7%Philippines
7%
Singapore18%
Taiwan28%
21
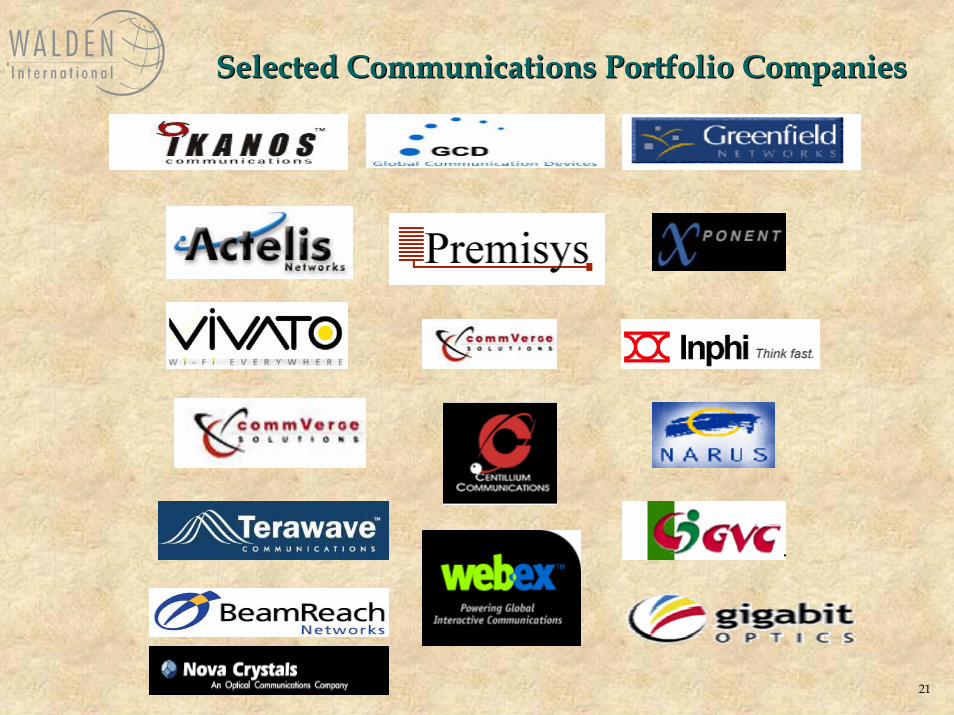
Selected Communications Portfolio CompaniesSelected Communications Portfolio Companies