Embed Size (px)
Citation preview
Version 1 – January 2007
1
FibroMAX:
FibroTest, SteatoTest, NashTest, ActiTest and AshTest
Investigator’s Brochure
Contents Index of abbreviations and definitions 1. Introduction ...................................................................................................................................................... 5 2. Limitations of liver biopsy for the diagnostic of steatosis, fibrosis and NASH .......................................... 5 3. Scientific rationale of FibroMax tests ............................................................................................................. 6 4. Administrative data on FibroMax, Patent and Marketing ........................................................................... 8
4.1. The most recent recommendations of the French Health Authority for the use of FibroTest ................. 9 5. Pre-analytic recommendations for FibroMax................................................................................................ 9 6. FibroMax pack biomarkers: FibroTest, ActiTest, SteatoTest, NashTest and AshTest ........................... 10
6.1. FibroTest-ActiTest-FibroSURE overview................................................................................................. 10 6.1.1. Standardisation of observed AUROC according to the prevalence of individual fibrosis stages ..... 10 6.1.2. FibroTest-FibroSURE Meta-analysis: fully validation in the four most frequent liver diseases .... 12 6.1.3. ActiTest diagnostic value in chronic viral hepatitis ........................................................................... 17
6.2. SteatoTest - universal serum marker of steatosis (fatty liver) .................................................................. 19 6.2.1. Introduction ......................................................................................................................................... 19 6.2.2. Discovery, internal validation, comparisons with ultrasonography, GGT and ALT ........................ 19 6.2.3. SteatoTest external validation in CYTOL Study Group NAFLD patients ........................................ 23 6.2.4. Steatosis improvement by SteatoTest after HCV treatment ............................................................... 23
6.3. NashTest – serum marker of non-alcoholic steatohepatitis (NASH) ..................................................... 24 6.3.1. Introduction ......................................................................................................................................... 24 6.3.2. Discovery and external validation (CYTOL Study Group NAFLD patients).................................... 24

Version 1 – January 2007
2
6.4. AshTest - marker of gravity of the alcoholic steatohepatitis (ASH) ........................................................ 28 6.4.1. Introduction ......................................................................................................................................... 28 6.4.2. Discovery and validation ..................................................................................................................... 28
7. Screening strategies with non-invasive biomarkers: FibroMAX (FibroTest, SteatoTest, NashTest) ..... 32 7.1. Efficacy of screening of hyperlipidemics with non-invasive biomarkers ................................................ 32 7.2. Efficacy of screening of diabetics with non-invasive biomarkers............................................................ 35
8. Conclusion ....................................................................................................................................................... 37 9. FibroMAX pack: how and when to use non-invasive biomarkers, recommended algorithms................ 38
9.1. Best management of the patients with metabolic risk factors (overweight, dyslipidemia, diabetes). FibroMAX pack: FibroTest, SteatoTest and NashTest ........................................................................... 38
9.2. Best management of the patients with excessive alcohol intake. FibroMAX pack: FibroTest, SteatoTest and AshTest .............................................................................. 39
9.3. Best management of the patients with chronic viral hepatitis FibroMAX pack: FibroTest, SteatoTest and ActiTest ............................................................................. 40
10. References...................................................................................................................................................... 41
Version 1 – January 2007
3
Index of abbreviations and definitions A0, A1, A2, A3: METAVIR scoring system for grading activity: A0=no liver activity, A1=minimal
activity, A2=moderate activity, A3= severe activity A2M: alpha2-macroglobulin AdAUROC: adjusted Area Under the ROC curve [AdAUROC=0.582+0.105 x (DANA)] AFEF: Association Française pour l’Etude du Foie ALD: alcoholic liver disease ALT, ALAT: alanine aminotransferase AP-HP: Assistance Publique Hôpitaux de Paris, Public Assistance Hospitals of Paris APO A1: Apolipoprotein A1 APRI: AST to platelet ratio index ASH: alcoholic steatohepatitis AST, ASAT: aspartate aminotransferase AT: ActiTest AUROC: Area Under the ROC curve BD: blood donors BIL or BILI: total bilirubin BMI: body mass index [weight (kg)/height²(cm)] CHC: chronic hepatitis C CNRS: Centre National de la Recherche Scientifique CT : total cholesterol DANA: difference between the mean fibrosis stages in the advanced fibrosis and non
advanced fibrosis groups EALT: Elevated ALT ESSEC: Ecole Supérieure des Sciences Economiques et Commerciales F0, F1, F2, F3, F4: METAVIR scoring system: F0=no liver fibrosis, F1=portal fibrosis, F2=portal
fibrosis with few septas, F3=portal fibrosis with many septas, F4=cirrhosis FibroSURE™ LabCorp and BioPredictive Inc have entered into an exclusive agreement to offer
FibroSURE™ combining both FibroTest (FT) and ActiTest (AT) as a single test option. Published literature refers to the tests as FibroTest-ActiTest. FibroSURE™ is a trademarked LabCorp name.
FT: FibroTest GGT: gamma-glutamyl-transpeptidase Gilbert’s syndrome: congenital partial enzymatic deficiency of glucuronyl-transferase with increased
fluctuating non-conjugated bilirubin level with occasional asymptomatic jaundice. HAPTO: haptoglobin HBV: hepatitis B virus, refered in text at chronic hepatitis B HCV: hepatitis C virus HCV-RNA: hepatitis C viral load HDL, HDL-C: high density lipoprotein, HDL-cholesterol HIV: human immunodeficiency virus

Version 1 – January 2007
4
HOMA-IR: homeostasis model assessment of insulin resistance HR, HRFP, HRFN: high risk false positive, high risk false negative IGF: Insulin Growth Factor IGFBP-1: Insulin-like Growth Factor Binding Protein-1 INSERM : Institut National de la Recherche et de la Santé Médicale Knodell score: histological scoring system, (ranging from 0 to 22), assessing the piecemeal necrosis
(0-10), intralobular necrosis (0-4), portal inflammation (0-4) and fibrosis (0-4) Maddrey-DF: Maddrey –discriminant function METAVIR: histological scoring system assessing the activity (necro-inflammatory lesions) in 4
grades (A0 to A3) and liver fibrosis in 5 stages (F0 to F4) NAFLD: Non-Alcoholic Fatty Liver Disease NAS: new histological score for the diagnostic of non-alcoholic steatohepatitis
(Kleiner&al.2005) NASH: non-alcoholic steatohepatitis NPV: negative predictive value ObAUROC: observed Area Under the ROC curve OR: Odds Ratio P: probability level, significant difference is considered as p<0.05 PEG-IFN (alpha2b): pegylated alpha2b-interferon PMN: polymorphonuclear neutrophils PNALT: persistently normal ALT (alanine amino transferases) PPV: positive predictive value R: correlation coefficient ROC: receiver operating characteristic curve SAA: serum amyloid A SAA HDL: complexe between serum amyloid A and HDL S0, S1, S2, S3-S4: S0=No steatosis, S1=mild steatosis (1-5%), S2=moderate steatosis (6-32%),
S3S4=marked to severe steatosis (>33%) Se: sensitivity se, SE: standard error Sp: specificity ST: SteatoTest SVR: sustained viral responder TB: total bilirubin TG: serum triglycerides USPTO: United States Patent and Trademark Office

Version 1 – January 2007
5
1. Introduction
FibroMax is the combination of up to five non-invasive liver tests: FibroTest, ActiTest, SteatoTest, NashTest and AshTest. These markers use a blood sample and therefore could be used in the first line before treatment decision; liver biopsy could be used as a secondary alternative only if necessary.
FibroTest and ActiTest are non-invasive alternatives to liver biopsy first developed in patients with hepatitis C virus (HCV) and thereafter in patients with hepatitis B virus chronic infection (HBV) and alcoholic (ALD) and non alcoholic (NAFLD) steatosis.
The FibroTest assesses the degree of fibrosis (scarring) in HCV, HBV, ALD and NAFLD patients. 1-6 The ActiTest the degree of activity (necrosis and inflammation) in HCV and HBV patients.1 Both tests are detailed in a separate brochure, which last version is available on the web site www.biopredictive.com.
Recently Biopredictive has developed three new non invasive tests: one (SteatoTest)7 for the diagnosis of liver steatosis in HCV, HBV, ALD and NAFLD patients, one for steato-hepatitis in ALD (AshTest)8 and one for NAFLD (NashTest)9. New panels, SteatoTest, NashTest and AshTest were developed combining the same 6 components of the FibroTest-ActiTest (alpha2-macroglobulin, haptoglobin, apolipoprotein A1, GGT, total bilirubin and ALT) adjusted for age, gender and BMI, plus serum fasting glucose, triglycerides, cholesterol and AST.
Data regarding liver histology is considered essential for basing treatment decisions upon and for the follow-up of patients suffering of the most frequent chronic liver diseases: HCV, HBV, ALD and NAFLD.
Until the development of FibroTest-ActiTest, liver histology could only be assessed correctly by liver biopsy, usually done via the intercostal route. However, the numerous limitations of liver biopsy does not make it a simple procedure nor suitable on a large scale. What is more, the high sampling variability in chronic liver diseases makes biopsy an indirect marker of reality, the true “gold-standard” being the liver in its entirety.
The release of these healthcare products on the market will simplify the medical management and supervision in patients worldwide.
2. Limitations of liver biopsy for the diagnostic of steatosis, fibrosis and NASH
Several studies on liver biopsy in chronic hepatitis C showed that this procedure is not completely adapted10,11 to the management of chronic hepatitis C. Liver biopsy is costly,12 can be experienced by patients as an aggressive procedure, prone to complications (30%) including death (0.3%),13 has considerable variability in staging fibrosis and grading activity mainly due to the sampling error.14-17 The advantages and disadvantages of the biomarkers compared to liver biopsy are debated in detail in the FibroTest Brochure available on the web site www.biopredictive.com).
The same is true for the other chronic liver diseases, which are even more frequent than chronic hepatitis C: chronic hepatitis B, 350 millions, alcoholic and non alcoholic steatosis with more than 1 billion of people concerned worldwide.
Sample variability for the diagnostic of steatosis, fibrosis, and steatohepatitis in NAFLD patients
A recent study18 in a NAFLD cohort with two liver samples collected by Ratziu et al. assessed the sampling error of liver biopsy and its impact on the diagnosis and staging of NASH and its individually histological features (steatosis, ballooning and acidophilic bodies).

Version 1 – January 2007
6
Ratziu et al. reported a discordance of one stage or more of fibrosis in 41%. 6/17 (35%) patients with bridging fibrosis on one sample had only mild or no fibrosis on the other and could have been under staged with only one sample biopsy.
The same study reported that a significant (more than 20%) difference in the magnitude of steatosis was noted in 18% of patients. Discordance rate between paired biopsies was 33% for the semiquantitative assessment of hepatocyte ballooning. A higher level of discordance was noted for acidophlic bodies (27%). Among the paired biopsies in which perisinusoidal fibrosis was detected, the staging was different between the two samples in 49%. Interface hepatitis and Mallory bodies was absent in most cases and discordances were low 4% and 16% respectively. For a composite diagnosis of NASH comprising ballooning and perisinusoidal fibrosis, the diagnosis would have been missed in 36%. This study suggests that not only diagnostic but also staging was significantly altered by sampling variability of liver biopsy in NAFLD/NASH patients. Liver biopsy is not an adequate screening tool for NAFLD patients
The number of patients at risk for NAFLD is high enough that liver biopsy is not apractical and efficient tool for identifying those at risk of advanced fibrosis. Indeed an estimated 15 to 20% of theWestern European population has steatosis19 while more than half of Americans are overweight or obese.
The inability of liver biopsy to meet several challenges in mass screening made the development of non-invasive, readily available and easy to perform serum markers an essential step for more effective management of patients with frequent liver pathologies. 3. Scientific rationale of FibroMax tests
Scientific rationale of FibroTest-ActiTest is detailed in the FibroTest-Fibrochure available on the web site www.biopredictive.com.
SteatoTest, NashTest and AshTest are combining the same six components of the FibroTest-
ActiTest (alpha2-macroglobulin, haptoglobin, apolipoprotein A1, GGT, total bilirubin and ALT) adjusted for age, gender and BMI, plus serum fasting glucose, triglycerides, cholesterol and AST. The chosen markers could be easily automated, and provide simple and robust quantification. A prospective first phase study was done which allowed for the identification and the optimal combination of markers. A second phase was carried out for the first validation. As for the FibroTest-ActiTest, in addition to quality control procedures, additional algorithms were also developed testing outliers (99% percentiles) for the risk of errors. Each of the components provides a rationale for, and adds complementary value to, the estimation of individual histological features predicted of each test.
Alpha2-macroglobulin (A2M) is a protein synthesized by the liver (hepatocytes, stellate cells, granulomas). Haptoglobin is a protein synthesized by the liver. Apolipoprotein A1 (ApoA1) is a protein synthesized by the liver, which transports cholesterol. Bilirubin is a pigment resulting from the degradation of erythrocytes (hemoglobin), which is normally taken up from the blood by the liver and excreted in bile. Gamma glutamyl transpeptidase (GGT), transaminases ALT and AST are enzymes synthesized by hepatocytes. Glucose (a carbohydrate), and total cholesterol and triglycerides (lipids) are serum composants which serum levels are dependent of food intake and metabolism.

Version 1 – January 2007
7
SteatoTest rationale GGT, ALT, triglycerides, cholesterol, glucose and BMI had been previously associated with steatosis
of different origins20,21,22. ApoA1 is highly associated with HDL-cholesterol 21and a negative association was also expected with steatosis when fibrosis or inflammation occured. The advantage of combining biomarkers of steatosis and those more specific for fibrosis such as A2M, haptoglobin and bilirubin is to adjust the predictive values according to the associated stage of fibrosis.
NashTest rationale
The most significant components of NashTest were the metabolic factors (mostly weight, triglycerides and glucose), as previously observed23-27, but also A2M and apoA1. These proteins have been proven to be associated with fibrosis28 but also with steatosis7, steato-hepatitis6,29 and insulin resistance pathways6. A2M is a protease inhibitor but also has multiple functions as a binding, carrier and targeting protein30. Other studies have observed an increase of A2M in diabetic patients31. Insulin is covalently bound to A2M32 in plasma and A2M is a binding protein of Insulin-like Growth Factor Binding Protein-1 (IGFBP-1) which modifies the IGFBP-1/IGF interaction33. Therefore A2M can be directly involved both in the hepatic mechanisms of insulin resistance and fibrogenesis.
Comparisons with biomarkers of alcoholic steato hepatitis (ASH)8 are important as ASH and NASH share many physio-pathological mechanisms and histological features. The same associations were observed for proteins in univariate analysis with a decrease in ApoA1, haptoglobin and an increase of A2M in NASH. However the decrease of apolipoprotein A1 in NASH was much lower than in patients with ASH.
AshTest rationale
AST, GGT and bilirubin, are increasing with ASH and were previously associated with ASH7,34-37. The most striking observation was the dramatic reduction of APOA1 in the presence of PMN infiltrate.38-39 The association of APOA1 with ASH independent of fibrosis had been indirectly suggested 5,40. During the acute phase response circulating HDL are charged in serum amyloid A (SAA) and depleted in APOA141,42. When APOA1 is liberated from HDL, it interacts with inflammatory cells such as PMN and decreases neutrophil degranulation and superoxyde production43. APOA1 facilitates the adhesive responses of PMN to lipopolysaccharide44. Other possible mechanisms and cascades include the down regulation of PMN by APOA145. In the absence of APOA1, SAAHDL is not formed and free SAA increases46 which can also activate PMN47. Finally activated PMN are a source of myeloperoxydase and hydrogen peroxide, which can destroy the integrity of APOA148-51.

Version 1 – January 2007
8
4. Administrative data on FibroMax, Patent and Marketing Professor Thierry Poynard and his team have worked for over 15 years on biochemical markers of liver fibrosis [Public Assistance Hospitals of Paris (AP-HP), University of Paris 6, CNRS UMR 8149 and University of Paris 5]. An international patent, (USPTO 6,631,330) which was registered by the AP-HP, protects the discovery of these biochemical markers of fibrosis (FibroTest), activity (ActiTest), steatosis (SteatoTest) and steatotohepatitis (NashTest and AshTest).
In 2002, and in agreement with the Innovation and Research Act (1999) pertaining to public research, the task of exploiting this patent was assigned to Biopredictive, a biotech start-up company. This assignment was made after examination by the scientific board of Paris-Biotech [which includes an incubator from the University of Paris 5, the City of Paris, INSERM (Institut National de la Santé et de la Recherche Médicale), l’Ecole Centrale and ESSEC (Ecole Supérieure des Sciences Economiques et Commerciales)]. The operating license was then transferred from the Public Assistance AP-HP to the limited public company, Biopredictive. In 2002, this project was a winner of the ANVAR (Agence Nationale de Valorisation de la Recherche) Award of the “Fourth National Competition of Aid for the Creation of Innovative Technological Enterprises” in the “Creation and Development” category. This competition, organized by the French Ministry of Research, designated the winners of the award after jury deliberation on the commercial and financial aspects of the project. In September 2002, the first health product, FibroTest-ActiTest, was released on the French market and in April 2006 the recently developed SteatoTest, NashTest and AshTest were released. This company provides a service to public or private laboratories. Using ten registered biologic tests, an algorithm-system expert takes into account the age, gender and BMI of the patient, and generates quantitative estimators of fibrosis stage (FibroTest), necroinflammatory activity (ActiTest), steatosis (SteatoTest) and alcoholic steatohepatitis (AshTest) and a semi quantitative estimator of non alcoholic steatohepatitis (NashTest). This is done via secured and anonymous Internet connection. Security algorithms are also provided with the results, in order to detect the risk of false positive/false negative results due of an extremely high or extremely low value of one of the ten parameters.
There has been widespread acknowledgement abroad of FibroTest and ActiTest through presentations at scientific meetings. These tests are currently marketed in France, Morocco (where they are performed by 30 laboratories), in Mexico, Portugal, Switzerland, Belgium, Germany, Italy, United Kingdom, Brazil, Egypt, Turkey, Canada and USA, Argentina, Austria, Australia, United Emirates, Spain, Georgia, Lebanon, Romania, Ukrain. In France, more than 500 private laboratories currently perform these tests and 37 public hospitals have signed a contract with Biopredictive for their use. FibroMax is performed in the same laboratories as FibroTest-ActiTest.
In USA, LabCorp and BioPredictive Inc have entered into an exclusive agreement to offer FibroSURE™, NASH-FibroSURE™ and ASH-FibroSURE™. Published literature that includes data on FibroSURE refers to the tests as FibroTest and ActiTest, NASH-FibroSURE refers to the tests as FibroTest, SteatoTest and NashTest and ASH-FibroSURE refers to the tests as FibroTest, SteatoTest and AshTest. FibroSURE™, NASH-FibroSURE™ and ASH-FibroSURE™ are trademarked LabCorp names that combines FibroTest with ActiTest, SteatoTest, NashTest and AshTest according to pathology, as a single test option. In Europe, FibroMax refers to the results of all five tests regrouped on the same results sheet.
FI-BROCHURE is the official investigator document of FibroTest-ActiTest, launched in March 2004 with the latest version available on the web site www.biopredictive.com .
Version 1 – January 2007
9
4.1. The most recent recommendations of the French Health Authority for the use of FibroTest The French Health Authority (La Haute Autorité de Santé) recommended the use of the non-invasive serum marker of fibrosis FibroTest as a first line estimate of liver injury to reduce the need for liver biopsy in chronic hepatitis C management. These official recommendations issued from several years of studies were oral communicated at the occasion of the French Liver Meeting (AFEF) in October 2006 and will be soon published.52 5. Pre-analytic recommendations for FibroMax Fasting versus non-fasting
For FibroTest-ActiTest the intra-individual variation of biochemical markers was low, and it was shown that measurement of FibroTest, ActiTest and their components are not significantly modified by meal intake.
However, the other FibroMax tests in particular SteatoTest and NashTest are including composants that need be dosed fasting (glucose, triglycerides and cholesterol) because of high variation of their serum level with the meal.53 Conditions of transport, pre-treatment, serum storage temperature
The measurements of the six parameters of FibroTest-ActiTest are made preferably on fresh serum (or plasma) or that which has been stored between +2°C and +8°C for a maximum of four days in an unlit area (for the protection of bilirubin). Centrifugation of the vial for the fasting glucose measurement should be done rapidly after been collected on a special fluorated vacutainer in order to empeach glucose metabolism by red cells enzyms. For deferred measurements, the serum should be quickly frozen to -80°C. After thawing, it should be centrifuged for 10 minutes at 15,000g.
One study recommended that to avoid the risk of false negative or false positive results for non-invasive liver markers, validation studies need to be done on fresh sera and if retrospective analyses are needed, sera storage at -80°C was recommended. 54
Version 1 – January 2007
10
6. FibroMax pack biomarkers: FibroTest, ActiTest, SteatoTest, NashTest and AshTest 6.1. FibroTest-ActiTest-FibroSURE overview 6.1.1. Standardisation of observed AUROC according to the prevalence of individual fibrosis stages Prevalence of fibrosis stages is a major factor of variability when assessing the area under the ROC curves (AUROC) in the diagnostic evaluation of liver fibrosis markers.55
Poynard, T, Halfon P, Castera L, Munteanu M, Imbert Bismut F, Ratziu V, Bourliere M, de Ledinghen V, FibroPaca study group. Gastroenterol Clin Biol. 2006; 30: 1039 (Abstract)
The area under the ROC curve (AUROC) is widely used as an estimate of the diagnostic value for liver fibrosis markers. AUROC combines sensitivity (Se) and specificity (Sp) of a quantitative marker. Se is usually assessed in patients with advanced fibrosis (METAVIR stages F2, F3, F4) and Sp in no advanced fibrosis (METAVIR stages F0, F1).
The AUROC’s variability due to a change in the prevalence of each fibrosis stage inside advanced fibrosis or non-advanced fibrosis groups is unknown.
The aim was to assess the relationships between the prevalence of each stage of fibrosis and the
AUROC and to construct an index for standardizing comparisons of AUROCs between studies. An integrated database of 1,312 HCV patients with contemporaneous FibroTest and biopsy was
constructed. The FibrpTest AUROC for the diagnostic of advanced fibrosis was computed in 19 populations with different stage prevalence.
An index (DANA) was constructed = difference between the mean of advanced fibrosis stages and the mean of non advanced fibrosis stages, range 0 to 4 fibrosis METAVIR units. An overview database of 19 published FibroTest studies was constructed to validate the association between DANA and AUROC.
According to stage prevalence, FibroTest AUROC varies (P<0.001) from 0.67 to 0.98 and from 0.65 to 0.89, DANA from 1.00 to 4.00 and 1.47 to 3.05, in the integrated database and in the overview, respectively. There was a close correlation between the FibroTest AUROC and DANA: R=0.89, both among the integrated database (R=0.95 P<0.0001) and the overview (R=0.69 P=0.001) (Figure 1). No other factors including biopsy size, fragments, author, and alcohol consumption had a significant association with FibroTest AUROC.
The formula for standardizing FibroTest AUROCs estimated from different stage prevalence was AUROC=0.582+0.105 x (DANA) with FibroTest AUROC=0.85 for a standard DANA of 2.5 (each stage prevalence =0.20).
The prevalence of each fibrosis stage must be taken into account when fibrosis markers are
evaluated using AUROCs for the diagnosis of advanced fibrosis. The formula for standardizing AUROCs estimated from different stage prevalence was
AUROC=0.582+0.105x (DANA) with FibroTest AUROC=0.85 for a standard DANA of 2.5 (each stage prevalence =0.20).

Version 1 – January 2007
11
Figure 1. Association between DANA and AUROC in the 19 studies included in the integrated database. Yellow points represent the 20 possible combinations between two different stages of fibrosis and the red points the DANA the representation of each publish study. For a study including a population with very different stages of fibrosis (only F0 and F4) the DANA=4 and the observed AUROC will be artificially increased (0.98); contrarily to a study including a population with adjacent stages of fibrosis (only F1 and F2) for which observed AUROC will be lower (0.67). For a standardized DANA =2.5 representing a population with equal prevalences of fibrosis (20% of each stage F0, F1, F2, F3, and F4) the standardized AUROC obtained is only 0.85.
0.85
0.00
1.00
2.00
3.00
4.00
0.5 0.6 0.7 0.8 0.9 1.0
F1234
NoF0
NoF1
NoF2
NoF3
NoF4
NoF02
NoF03
NoF04
NoF12
NoF13
NoF14
NoF23
NoF24
NoF34
NoF023
NoF034
NoF134
NoF123
Callewaert
Myers
Rossi
Poynard1
Wilson
Cales2
Poynard2
Cales1
Halfon
Varaud1
Varaud2
Imbert1
Poynard3
Imbert2Sebastiani1
Sebastiani2
Castera
Sene
AUROC for Advanced vs Non Advanced Fibrosis
A
d
v
a
n
c
e
d
m
i
n
u
s
N
o
n
A
d
v
a
n
c
e
d
F
i
b
r
o
s
i
s
M
e
a
n
s
F1 vs F2 DANA=1 AUROC=0.67
Standardized Point :
DANA=2.5
AUROC=0.85
F4 vs F0 DANA=4 AUROC=0.98
DANA=2.5

Version 1 – January 2007
12
6.1.2. FibroTest-FibroSURE Meta-analysis: fully validation in the four most frequent liver diseases
Complete information about FibroTest-ActiTest internal and independent validations, analytical standardisation and comparisons with other markers is published on FibroTest FIBROCHURE latest version available in open access on the web site www.biopredictive.com .
Meta-analysis of FibroTest (FT) for the diagnosis of fibrosis in the four more frequent liver diseases. Poynard T, Halfon P, Castera L, Ratziu V, Imbert-Bismut F, Naveau S, Thabut D, Lebrec D, Zoulim F, Munteanu M, Bourlière M, de Ledinghen V.2 Gastroenterol Clin Biol. 2006; 30: 1057 (Abstract) Diagnostic value of FibroTest -ActiTest among published studies (meta-analysis2 and integrated database)
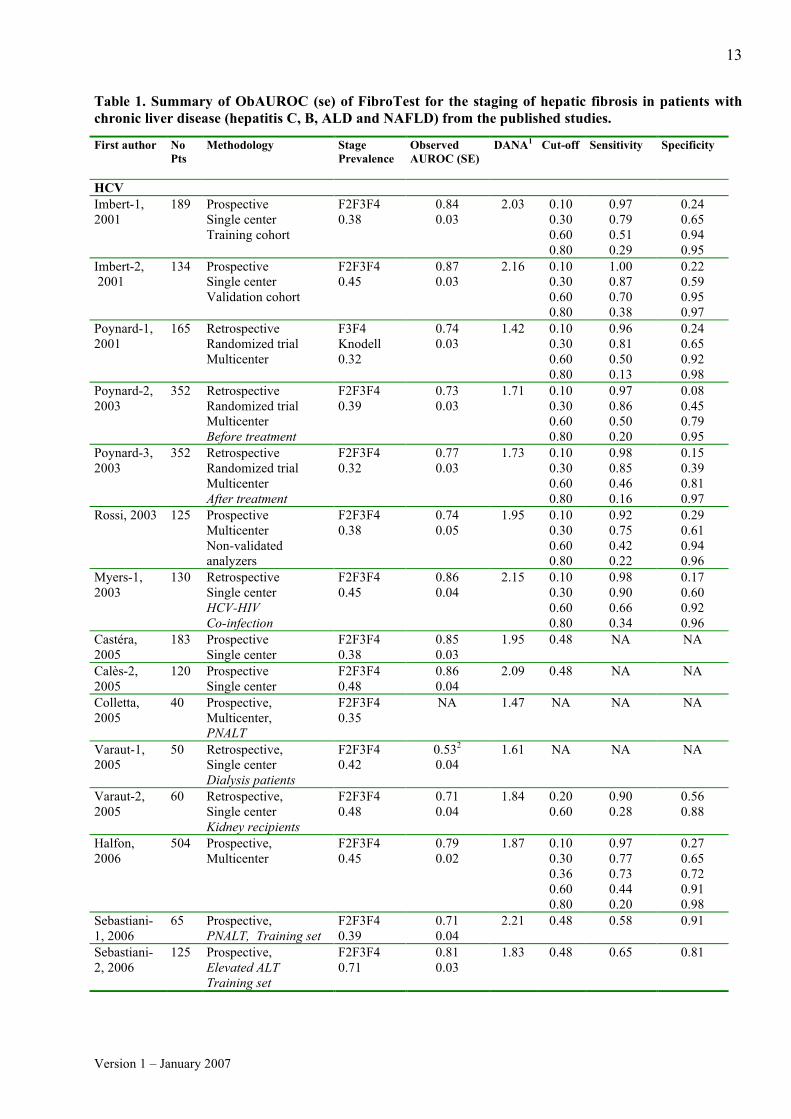
For 24 groups of patients detailed in 19 publications,3-6,28,56-69 it was possible to assess the prevalence of significant fibrosis (F2F3F4), and AUROC values as well as the Se and Sp for different FibroTest cut-offs (Table 1) (exept for 4 studies for which AUROC, Se or Sp were not reported).
A new integrated database was constructed with the studies where individual data were available cumulating a total of 3,282 patients (2,431 HCV, 322 HBV, 267 NAFLD and 262 ALD) being 74% of the literature. Comparison of FibroTest diagnostic value between different liver diseases
Meta-analysis was performed twice, once according to the absolute value of the observed AUROCs (ObAUROC) and once according to the AUROCs adjusted for the spectrum of fibrosis stages (AdAUROC).55 (Figure 2, Panel A and B). When two publication were excluded because in one of them patients were already included in other study [Thabut et al.] and in the other AUROC [Colletta et al.] was not reported, the mean observed AUROCs for the diagnosis of significant fibrosis (F2F3F4) was 0.79 (95% CI, 0.77-0.82) and the mean adjusted AUROC was 0.84 (95% CI, 0.82-0.86); all observed AUROC ranged from 0.71 (for 0.39 prevalence of F2F3F4) to 0.87 (for 0.45 prevalence of F2F3F4). The heterogeneity of observed AUROC between studies disappears after adjustement of AUROCs (Cochran Q=26 p=0.19). Figure 2. Meta-analysis of the FibroTest ObAUROCs (Panel A) and AdAUROCs (Panel B) in published studies. Ob and AdAUROCs were all higher for FibroTest than the random 0.50 value (P<0.001). There was no significant difference between the different liver diseases for Ob and AdAUROCs. The red line is the best AUROC it can be obtained (0.90) with 20mm biopsy vs the whole liver [Bedossa 2003]. Panel A. Panel B.
0.00 0.10 0.20 0.30 0.40 0.50 0.60
AUROCs Difference vs 0.50
Mean Difference
A
u
t
h
o
r
HBVPoynard4MyersAve
HCVVaraudSebastiani1Poynard2RossiWilsonPoynard1Poynard3HalfonSebastiani2SeneImbert1CasteraMyersCales2Imbert2Ave
MixedCales1CallewaertAve
NAFLD ALDRatziu2NaveauRatziu1Ave
Total
Disease
Combined
HBV
HCV
Mixed
NAFLD ALD
0.00 0.10 0.20 0.30 0.40 0.50 0.60
AUROCs Difference vs 0.50
Mean Difference
Author
HBVMyers2Poynard4Ave
HCVSebastiani1VaraudSeneRossiWilsonPoynard2Poynard3Poynard1HalfonSebastiani2Imbert1Myers1Cales2Imbert2CasteraAve
MixedCales1CallewaertAve
NAFLD ALDRatziu2NaveauRatziu1Ave
Total
Ajusted AUROCs
CombinedHBVHCVMixedNAFLD ALD
Version 1 – January 2007
13
Table 1. Summary of ObAUROC (se) of FibroTest for the staging of hepatic fibrosis in patients with chronic liver disease (hepatitis C, B, ALD and NAFLD) from the published studies.
First author No Pts
Methodology Stage Prevalence
Observed AUROC (SE)
DANA1 Cut-off Sensitivity Specificity
HCV Imbert-1, 2001
189 Prospective Single center Training cohort
F2F3F4 0.38
0.84 0.03
2.03 0.10 0.30 0.60 0.80
0.97 0.79 0.51 0.29
0.24 0.65 0.94 0.95
Imbert-2, 2001
134 Prospective Single center Validation cohort
F2F3F4 0.45
0.87 0.03
2.16 0.10 0.30 0.60 0.80
1.00 0.87 0.70 0.38
0.22 0.59 0.95 0.97
Poynard-1, 2001
165 Retrospective Randomized trial Multicenter
F3F4 Knodell 0.32
0.74 0.03
1.42 0.10 0.30 0.60 0.80
0.96 0.81 0.50 0.13
0.24 0.65 0.92 0.98
Poynard-2, 2003
352 Retrospective Randomized trial Multicenter Before treatment
F2F3F4 0.39
0.73 0.03
1.71 0.10 0.30 0.60 0.80
0.97 0.86 0.50 0.20
0.08 0.45 0.79 0.95
Poynard-3, 2003
352 Retrospective Randomized trial Multicenter After treatment
F2F3F4 0.32
0.77 0.03
1.73 0.10 0.30 0.60 0.80
0.98 0.85 0.46 0.16
0.15 0.39 0.81 0.97
Rossi, 2003 125 Prospective Multicenter Non-validated analyzers
F2F3F4 0.38
0.74 0.05
1.95 0.10 0.30 0.60 0.80
0.92 0.75 0.42 0.22
0.29 0.61 0.94 0.96
Myers-1, 2003
130 Retrospective Single center HCV-HIV Co-infection
F2F3F4 0.45
0.86 0.04
2.15 0.10 0.30 0.60 0.80
0.98 0.90 0.66 0.34
0.17 0.60 0.92 0.96
Castéra, 2005
183 Prospective Single center
F2F3F4 0.38
0.85 0.03
1.95 0.48 NA NA
Calès-2, 2005
120 Prospective Single center
F2F3F4 0.48
0.86 0.04
2.09 0.48 NA NA
Colletta, 2005
40 Prospective, Multicenter, PNALT
F2F3F4 0.35
NA 1.47 NA NA NA
Varaut-1, 2005
50 Retrospective, Single center Dialysis patients
F2F3F4 0.42
0.532 0.04
1.61 NA NA NA
Varaut-2, 2005
60 Retrospective, Single center Kidney recipients
F2F3F4 0.48
0.71 0.04
1.84 0.20 0.60
0.90 0.28
0.56 0.88
Halfon, 2006
504 Prospective, Multicenter
F2F3F4 0.45
0.79 0.02
1.87 0.10 0.30 0.36 0.60 0.80
0.97 0.77 0.73 0.44 0.20
0.27 0.65 0.72 0.91 0.98
Sebastiani-1, 2006
65 Prospective, PNALT, Training set
F2F3F4 0.39
0.71 0.04
2.21 0.48 0.58 0.91
Sebastiani-2, 2006
125 Prospective, Elevated ALT Training set
F2F3F4 0.71
0.81 0.03
1.83 0.48 0.65 0.81

Version 1 – January 2007
14
First author No
Pts Methodology Stage
Prevalence AUROCs DANA3 Cut-off Sensitivity Specificity
Wilson, 2006
115 Retrospective Multicenter 30%HIV
F2F3F4 0.38
0.74 0.05
1.87 NA NA NA
Sene, 2006
258 Prospective Single center Cryoglobulinemia vasculitis
F2F3F4 0.47
0.83 0.04
3.05 0.37 0.85 0.85
HBV Myers-2, 2003
209 Prospective (42) and Retrospective (167)
F2F3F4 0.29
0.78 0.04
2.31 0.20 0.40 0.60 0.80 0.90
0.89 0.54 0.34 0.18 0.08
0.52 0.80 0.93 0.99 1.00
Poynard-4, 2005
214 Prospective
F2F3F4 0.45
0.77 0.03
2.17 NA NA NA
ALD Naveau, 2005
221 Prospective F2F3F4 0.64
0.84 0.03
2.34 0.30 0.70
0.84 0.55
0.66 0.93
NAFLD Ratziu-1, 2006
170 Prospective F2F3F4 0.24
0.86 0.03
2.30 0.30 0.70
0.83 0.18
0.78 0.98
Ratziu-2, 2006
97 Prospective F2F3F4 0.15
0.75 0.04
2.04 0.30 0.70
0.71 0.13
0.74 0.98
Mixed Callewaert, 2004
106 Prospective HCVand alcohol
F4 0.29
0.89 0.04
2.08 NA NA NA
Calès-1, 2005
478 Retrospective Single center Mixed causes Training cohort
F2F3F4 0.59
0.82 0.03
2.73 NA NA NA
*Details for stages given out of 119 and not out of 115: ** half of Knodell F3 has been counted as METAVIR F2
In the four most common liver diseases there was a very significant difference for the diagnostic value (AUROC) of FibroTest versus random diagnosis (0.50) in each study using either meta-analysis or pooled data in the integrated database; the only significant difference of AUROC between differents etiologies was a higher ObAUROC before adjustment in ALD that in HCV (p=0.001); this difference was no longer significant after adjustment of AUROCs to the prevalence of each stage of fibrosis. (Table 2) Table 2. Characteristics of the new integrated data-base and the FibroTest diagnostic value in the four most common liver diseases Disease No
Age yrs
Biopsy Length mm
F0 (%)
F1 (%)
F2 (%)
F3 (%)
F4 (%)
ObAUROC 95% CI
DANA AdAUROC 95% CI
HCV 2,431 47 17 204 (8.4)
1123 (46.2)
531 (21.8)
298 (12.3)
275 (11.3)
0.77 0.75-0.79
1.92 0.83 0.81-0.85
HBV 322 42 17 86 (26.7)
94 (29.2)
61 (18.9)
38 (11.8)
43 (11.4)
0.81 0.76-0.86
2.30 0.83 0.78-0.88
ALD 262 48 14 18 (6.9)
67 (25.6)
50 (19.1)
23 (8.8)
104 (39.7)
0.85 0.80-0.89*
2.52 0.85 0.80-0.89
NAFLD
267 51 19 102 (38.2)
94 (35.2)
35 (13.1)
23 (8.6)
13 (4.9)
0.81 0.74-0.86
2.21 0.84 0.77-0.89
All 3,282 47 17 410 (12.5)
1378 (42.0)
677 (20.6)
382 (11.6)
435 (13.3)
0.79 0.77-0.80
2.07 0.84 0.82-0.86
*P=0.001 between HCV and ALD for ObAUROC, Non Significant for AdAUROC

Version 1 – January 2007
15
Sensitivity analysis Prospective studies, inventors’ studies and fragmented biopsies studies were associated with higher
observed ObAUROC, but not with higher adjusted AdAUROCs (Table 3, Panel A). There was no difference between FibroTest Ob AUROCs or AdAUROCs according to elevated or nonelevated baseline ALT (Table 3 Panel A and B).
Table 3. Sensitivity analyses of FibroTest diagnostic values according to published studies (Panel A) or patient characteristics (Panel B). Panel A.
Characteristic (number of studies)
Observed AUROC Adjusted AUROCs
All (23) 0.79 0.77-0.82 0.84 0.82-0.86 Design Prospective (15) Retrospective (7)
0.82 0.79-0.84*
0.75 0.72-0.78
0.85 0.83-0.88 0.83 0.80-0.85
Authors Independent (12) Mixed (5) Inventor (6)
0.79 0.75-0.83 0.76 0.73-0.80
0.83 0.80-0.87**
0.84 0.80-0.87 0.83 0.80-0.86 0.85 0.81-0.89
Guidelines/Fresh No (8) Yes (15)
0.76 0.72-0.79 0.81 0.78-0.83
0.83 0.80-0.86 0.85 0.82-0.88
Length biopsy <18 (8) >=18 (10)
0.81 0.77-0.84 0.80 0.77-0.83
0.86 0.82-0.90 0.84 0.81-0.87
Interval serum-biopsy >30 days (7) <30 (14)
0.77 0.71-0.83 0.80 0.78-0.33
0.81 0.77-0.85 0.85 0.83-0.87
Co-morbidity No (18) Yes (5)
0.79 0.76-0.81 0.80 0.74-0.86
0.85 0.82-0.87 0.81 0.78-0.88
Normal baseline ALT Yes (1) No (22)
0.71 0.60-0.82 0.80 0.77-0.82
0.74 0.63-0.85 0.84 0.83-0.86
P=0.01 **P=0.04 Panel B. Characteristic (number of patients)
Observed AUROC DANA Adjusted AUROC
Length biopsy <25mm (2,446) >=25mm (492)
0.80 0.78-0.82 0.77 0.72-0.81
2.10 1.91
0.84 0.82-0.86 0.83 0.78-0.87
More than 2 fragments Yes (575) No (606)
0.86 0.82-0.89* 0.78 0.73-0.81
2.45 2.05
0.87 0.83-0.90 0.83 0.78-0.86
Normal baseline ALT No (1,833) Yes (493)
0.80 0.78-0.82 0.79 0.74-0.84
2.16 2.39
0.84 0.82-0.86 0.81 0.76-0.86
*P=0.002 not significant for adjusted AUROCs

Version 1 – January 2007
16
Diagnostic value of FibroTest for intermediate and adjacent stages in HCV carriers on the first integrated data-base1
The AUROCs between different stages’ combinations are given in the Table 4. Between two contiguous stages (one stage difference) the AUROCs were not significantly different and ranged from 0.63 to 0.71. Between patients with a 2 stages difference, the AUROCs were not significantly different and ranged from 0.75 to 0.86. Between patients with a 3 stages difference, the AUROCs were not significantly different and ranged from 0.87 to 0.95. Between patients with a 4 or 5 stage differences (blood donors versus F3 or F4, and F0 versus F4), the AUROCs were not significantly different and ranged from 0.95 to 0.99. 1 Table 4. Summary of the diagnostic value of FibroTest for the diagnosis of all stages combinations of hepatic fibrosis (AUROC) in HCV carriers (first integrated published data-base). Between two contiguous stages (one stage difference), the AUROCs are given in bold. Between patients with a 2 stages difference, the AUROCs are given in italics. Between patients with 3 stages difference, the AUROCs are given in bold and italics. Between patients with 4 or 5 stages differences (blood donors versus F3 or F4, and F0 versus F4), the AUROCs are given underlined. Significant differences were observed between AUROCs when there was a difference of two or more stages. F0 F1 F2 F3 F4 BD F0 F0F1 F1F2 F2F3F4 F3F4
Blood Donor BD n=300 0.71 0.86 0.95 0.99 0.99 - 0.84 0.88 0.97 0.99 F0 n=95 -
F1 n=688 0.66 - F2 n=253 0.82 0.69 - F3 n=111 0.92 0.80 0.63 - F4 n=123 0.95 0.87 0.75 0.65 - BD F0 0.71 0.81 0.92 0.98 0.98 - F0F1 - - 0.71 0.82 0.88 - - - F1F2 0.71 - 0.69 0.81 0.82 0.84 - - - F2F3 0.85 0.76 - - 0.72 0.92 0.80 - - F3F4 0.94 0.81 0.81 - - 0.98 0.89 0.80 - F2F3F4 0.83 0.78 - - - 0.95 0.78 - - - BD F0F1 - - 0.77 0.87 0.91 - - - 0.83 0.89
Comparison of FibroTest diagnostic values between adjacent stages in the four chronic liver diseases Overall AUROC for the diagnosis of intermediate stages F2 vs. F1 (0.66, n=2,055) was not different
compared to the extreme stages: F3 vs. F4 (0.69, n=817) or F1 vs. F0 (0.62, n=1788). No AUROCs difference was observed between adjacent stages for all four chronic liver disease. (Table 5)
Table 5. FibroTest diagnostic values between adjacent stages in the four chronic liver diseases.
AUROCs (95%CI) Number of patients Etiology F1 vs F0 F2 vs F1 F3 vs F2 F4 vs F3
ALL 0.62 0.59-0.65 N=1,788 0.66 0.63-0.68 N=2,055 0.67 0.64-0.70 N=1,059 0.69 0.65-0.72 N=817 HCV 0.64 0.60-0.68 N= 1,327 0.66 0.63-0.69 N=1,654 0.66 0.62-0.69 N=829 0.66 0.61-0.70 N=573 HBV 0.64 0.56-0.72 N=180 0.63 0.53-0.71 N=155 0.78 0.67-0.86 N=99 0.54 0.40-0.65 N=81* ALD 0.47 0.32-0.60 N=85 0.65 0.53-0.74 N=117 0.66 0.50-0.77 N=73 0.82 0.69-0.90 N=127*
NAFLD 0.53 0.45-0.61 N=196 0.69 0.57-0.78 N=129 0.69 0.52-0.80 N=58 0.71 0.45-0.86 N=36 * P=0.001 between HBV and ALD

Version 1 – January 2007
17
6.1.3. ActiTest diagnostic value in chronic viral hepatitis
Diagnostic value of ActiTest for intermediate and adjacent grades in HCV carriers-first integrated database The AUROCs between different grades’ combinations in the first integrated database (only HCV
carriers) are given in the Table 6. Between two contiguous grades (one grade difference) the AUROCs were not significantly different and ranged from 0.60 to 0.70. Between patients with 2 stages difference the AUROCs were not significantly different and ranged from 0.75 to 0.86. Between patients with a 3 stages difference, the AUROCs were not significantly different and ranged from 0.87 to 0.95. Between patients with a 4 stages difference (blood donors versus F3 and F0 versus F4) the AUROCs were not significantly different and ranged from 0.95 to 0.99.
Table 6. Summary of the diagnostic value of ActiTest for the differential diagnosis of all grades of histologic activity (AUROC) in HCV carriers (first integrated published data-base). Between two contiguous grades (one grade difference) the AUROCs are given in bold. Between patients with a 2 grades difference, the AUROCs are given in italics. Between patients with 3 grades difference, the AUROC are given in bold and italics. Between patients with a 3 or 4 grades difference (blood donors versus A2 or A3, and A0 versus A3) the AUROCs are given underlined. Significant differences were observed between AUROCs when there was difference of two or more grades. A0 A1 A2 A3 BD A0 A0A1 A1A2 A2A3
Blood Donor BD n=300 0.67 0.84 0.96 0.99 - 0.79 0.89 0.97 A0 n=185 - A1 n=443 0.69 - A2 n=370 0.87 0.70 - A3 n=272 0.93 0.79 0.60 -
A0A1 - - 0.70 0.83 - A1A2 0.77 - - 0.70 0.85 - A2A3 0.89 0.74 - - 0.94 0.78 -
A0A1A2 - - - 0.75 - - - - BD A0A1 - - 0.82 0.88 - - - 0.84
ActiTest diagnostic value
For four groups of patients detailed in two publications28,60 it was possible to assess the prevalence of significant activity, and the ActiTest AUROC values as well as the sensitivity and specificity for 4 different ActiTest cut-offs (Table 7). For the diagnosis of significant histological activity by the METAVIR scoring system, the AUROCs ranged from 0.75 to 0.86. There was a very significant difference versus random diagnosis, in each study, using either meta-analysis (Mean Difference in AUROC=0.29, random effect model Chi square=556 P<0.001) or pooled data in the integrated database. For the cut-off of 0.36, the ActiTest negative predictive value for excluding significant activity (prevalence 0.41) was 85%.

Version 1 – January 2007
18
Table 7. Summary of the diagnostic value of ActiTest for the diagnostic of necrotico-inflammatory hepatic activity (AUROC) First Author Number Methodology Marker Grade
Prevalence AUROC SE
Cut off
Sensitivity Specificity
Imbert-Bismut, 2001
189 Prospective Single center
ActiTest A2A3 0.33
0.79 0.03
0.10 0.30 0.60 0.80
0.99 0.91 0.70 0.49
0.07 0.42 0.75 0.88
Imbert-Bismut, 2001
134 Prospective Single center Validation cohort
ActiTest A2A3 0.28
0.75 0.03
0.10 0.30 0.60 0.80
1.00 0.94 0.67 0.42
0.07 0.33 0.65 0.87
Poynard, 2003 352 Retrospective Randomized trial Multicenter Before treatment
ActiTest A2A3 0.83
0.75 0.03
0.10 0.30 0.60 0.80
1.00 0.90 0.49 0.20
0.00 0.38 0.87 0.99
Poynard, 2003 352 Retrospective Randomized trial Multicenter After treatment
ActiTest A2A3 0.39
0.86 0.02
0.10 0.30 0.60 0.80
0.91 0.75 0.38 0.14
0.59 0.83 0.98 0.996
Version 1 – January 2007
19
6.2. SteatoTest - universal serum marker of steatosis (fatty liver) 6.2.1. Introduction
Steatosis or fatty liver is defined as an excessive accumulation of triglycerides in hepatocytes.70 The prevalence of steatosis is very high, and is associated with several factors such as alcohol, diabetes, overweight, hyperlipidemia, insulin resistance, hepatitis C genotype 3, abetalipoproteinemia and administration of some drugs.20,70-72
Fatty liver disease involves not only simple steatosis, but also other histological lesions and often fibrosis with possible progression to cirrhosis, hepatocellular cancer and liver-related death. In patients with alcoholic liver disease (ALD), chronic hepatitis C, and possibly in those with hepatitis B, the presence of steatosis is also associated with fibrosis progression. 70,72-74
Therefore the diagnosis of liver steatosis is mandatory to better manage all at risk patients.
6.2.2. Discovery, internal and external validations, comparisons with ultrasonography, GGT and ALT The diagnostic value of biomarkers (SteatoTest) for the prediction of liver steatosis.7 Poynard T, Ratziu V, Naveau S, Thabut D, Charlotte F, Messous D, Capron D, Abella A, Massard J, Ngo Y, Munteanu M, Mercadier A, Manns M, Albrecht J. Comp Hepatol. 2005. 23; 4: 10.
For the diagnosis of steatosis, there is no standard recommendation. The usual recommendation is to measure GGT and ALT and, in addition, to perform liver biopsy for grading and staging. It is impossible to perform liver biopsy in such a number of patients. 20,70,72,75
The objective of the current study was to create a new panel of biomarkers known as SteatoTest
with sufficient predictive values for the diagnosis of steatosis due to alcohol, non-alcoholic fatty liver disease (NAFLD) and chronic hepatitis C and B.
A secondary aim was to compare the diagnostic value of SteatoTest was compared to ultrasonography and serum GGT and ALT considered as the standard biochemical markers.
Independently, the SteatoTest diagnostic value was validated on an independent cohort from.
A total of 2,272 subjects were analyzed, being 884 subjects included in the biomarker validation study with a distribution as follows: 310 patients in the training group (various etiologies: NAFLD, ALD, HCV, HBV); 171 in the validation group 1 (HCV detectable at baseline); 201 in the validation group 2 (HCV undetectable at 24 weeks follow-up); 62 in the validation group 3 (ALD); and 140 in the control group (blood donors, fasting and not-fasting volunteers).
The advantage of validation group 2 was the inclusion of a group of patients having liver biopsies that are clinically and biologically close to a "normal" population, as these patients are sustained virologic responders (SVR) and had quasi-normal liver function tests. Characteristics of the patients
The 1,388 non-included patients were not significantly different from the 884 patients integrated in the validation group. Patients included in the four groups were similar in age with a predominance of male subjects. The prevalence of steatosis greater than 5% (grades 2 to 4) varied from 11% in hepatitis C virus (HCV) cured patients to 94% in patients with ALD.

Version 1 – January 2007
20
Training group results: construction of the test In the training group (n=310) the most significant components associated with the presence of grade
2–4 steatosis in univariate analysis were body mass index (BMI), age, ALT, AST, GGT, glucose, and triglycerides. The logistic regression defining the SteatoTest included 12 components – ALT, α2-macroglobulin (A2M), apolipoprotein A-I (ApoA1), haptoglobin (HAPTO), total bilirubin (TB), GGT, cholesterol (CT), triglycerides (TG), glucose, age, gender and BMI and the most significant components were BMI (P = 0.0002), GGT (P = 0.002), ApoA1 (P = 0.01), A2M (P = 0.02), ALT (P = 0.03) and TG (P = 0.04).
In the validation groups, similar differences were observed, most significantly for BMI, GGT, ALT and triglycerides.
Conversion between the SteatoTest results and the corresponding steatosis histological grades
SteatoTest is a continuous linear quantitative assessment of steatosis grade. SteatoTest provides a numerical quantitative estimate of liver steatosis ranging from 0.00 to 1.00, corresponding to a steatosis scoring system of grades S0 to S4.
Among the 140 controls, the median SteatoTest value (± SE) was 0.08 ± 0.004 (95th percentile, 0.23). Among the 744 patients with liver biopsy, the SteatoTest conversion was linear. (Table 8 and Table 9) Table 8. Median SteatoTest values according to steatosis grade at liver biopsy in patients and according to control category (fasting, non-fasting, blood donors)
Subjects Group/Category Median SteatoTest
Fasting 0.13 Non-fasting 0.18
Controls
Blood donors 0.14 No steatosis 0.26 Grade 1 steatosis 0.43 Grade 2 steatosis 0.62 Grade 3 steatosis 0.70
Patients (biopsy) Grade 4 steatosis 0.75
Table 9. Conversion between the SteatoTest results and the corresponding steatosis
Diagnostic value of SteatoTest compared to GGT and ALT in the training group
SteatoTest had high AUROCs (SE) in the training and validations groups 1, 2 and 3: 0.79 (0.03); 0.80 (0.04); 0.86 (0.03); and 0.72 (0.05), respectively. The AUROCs of SteatoTest were always significantly higher than that of GGT and ALT (for the training and validation 1 groups). For the diagnosis of grade 2–4 steatosis, the sensitivity of SteatoTest at the 0.30 cut-off was 0.91, 0.98, 1.00 and 0.85 and the specificity at the 0.70 cut-off was 0.89, 0.83, 0.92, and 1.00, for the training and validation groups, respectively.
SteatoTest Predicted histological grade
Quantitative estimation
0.0000 – 0.3000 S0 No steatosis 0.3001 – 0.3800 S0-S1 0.3801 – 0.4800 S1
Mild steatosis (1-5%)
0.4801 – 0.5700 S1-S2 0.5701 – 0.6700 S2
Moderate steatosis (6-32%)
0.6701 – 0.6900 S2-S3 Marked steatosis (33- 66%) 0.6901 – 1.0000 S3-S4 Severe steatosis (>66%)

Version 1 – January 2007
21
Results of the integrated database (all groups polled together), comparisons with ALT and GGT Integrated database (n=884) combined the training group, the three validation groups and the control group. There was a very significant overall correlation between SteatoTest and the steatosis grades from controls to S3. For SteatoTest, there was a significant difference between all histological grades for all pairwise differences between means (P < 0.05). Contrarily, for both GGT and ALT, there was no significant difference between S0 and S1. Moreover for ALT, there was no significant difference between S0 and S2, S1 and S2, and S2 and S3, either. For SteatoTest, a cut-off of 0.30 had 90% sensitivity and a cut-off of 0.70 had 88% specificity permitting to achieve useful predictive values for steatosis grade 2–4, 93% negative predictive value (NPV) and 63% positive predictive value (PPV) for a steatosis prevalence of 30%. The 90% specificity was obtained for a 0.72 cut-off with a corresponding 63% PPV. The overall percentage of patients classified with at least 90% sensitivity or 90% specificity was 59% (363+156/884). SteatoTest versus Ultrasonography for steatosis diagnosis Ultrasonography has been preformed together with SteatoTest and biopsy in 304 patients. Concordance between steatosis diagnosed, at ultrasonography and at biopsy, was lower (kappa coefficient = 0.32 ± 0.05) than the concordance with SteatoTest (at 0.50 cut-off, kappa = 0.44 ± 0.06; P = 0.02), as well as lower AUROC 0.65 ± 0.03 for ultrasonography versus 0.78 ± 0.03 for ST (P = 0.001). SteatoTest versus classical serum markers GGT and ALT for steatosis diagnosis Among the 744 patients with biopsy, for the diagnosis of steatosis S3S4, the SteatoTest AUROC was 0.79 (0.02), significantly higher than GGT 0.74 (0.02) (P = 0.03), and ALT 0.71 (0.02) (P = 0.007). The 90% sensitivity was obtained for a 0.32 cut-off; the 90% specificity was obtained for a 0.81 cut-off. (Table 10) SteatoTest could distinguish better than GGT and ALT between differents stages of fibrosis. (Figure 3, Panels A, B and C, respectively) Table 10. AUROCs of SteatoTest, GGT and ALT for the diagnosis of steatosis greater than 5%. Diagnostic panel
Training Group N=310
Validation group 1 (HCV before treatment) N=171
Validation group 2 (HCV sustained responders) N=201
Validation group 3 (Alcoholic liver disease) N=171
All groups
SteatoTest 0.79 (0.03)* 0.80 (0.04)£ 0.86 (0.03)$ 0.72 (0.05)** 0.80 (0.02)££ GGT 0.66 (0.03) 0.67 (0.05) 0.74 (0.05) 0.50 (0.09) 0.66 (0.02) ALT 0.58 (0.03) 0.62 (0.05) 0.79 (0.04) 0.66 (0.07) 0.61 (0.02) * – Higher than GGT (P < 0.0001) and ALT (P < 0.0001); £ – Higher than GGT (P = 0.007) and ALT (P < 0.0001); $ – Higher than GGT (P = 0.02); ** – Higher than GGT (P = 0.002); ££ Higher than GGT (P < 0.0001) and ALT (P < 0.0001). Sensitivity analyses: better diagnostic value with good quality biopsy A total of 670 (78%) patients had a biopsy sample length smaller than 20 mm. The AUROC of SteatoTest was slightly smaller in those patients (0.76, 95% CI 0.71–0.79) than in the 161 (15%) patients with greater biopsy sample (0.82, 95% CI 0.74–0.88; P = 0.10). There it was not found any significant differences in SteatoTest AUROCs according to ethnicity.
Version 1 – January 2007
22
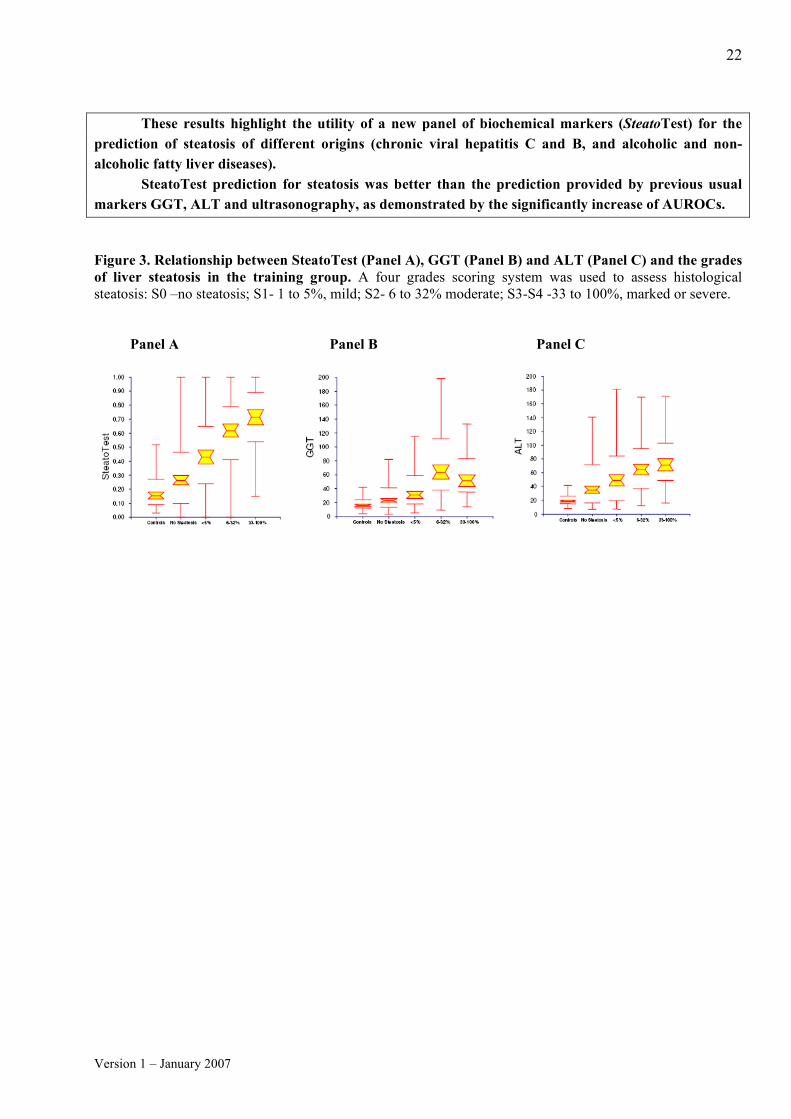
These results highlight the utility of a new panel of biochemical markers (SteatoTest) for the
prediction of steatosis of different origins (chronic viral hepatitis C and B, and alcoholic and non-alcoholic fatty liver diseases).
SteatoTest prediction for steatosis was better than the prediction provided by previous usual markers GGT, ALT and ultrasonography, as demonstrated by the significantly increase of AUROCs. Figure 3. Relationship between SteatoTest (Panel A), GGT (Panel B) and ALT (Panel C) and the grades of liver steatosis in the training group. A four grades scoring system was used to assess histological steatosis: S0 –no steatosis; S1- 1 to 5%, mild; S2- 6 to 32% moderate; S3-S4 -33 to 100%, marked or severe.
Panel A Panel B Panel C

Version 1 – January 2007
23
6.2.3. SteatoTest external validation in CYTOL Study Group NAFLD patients SteatoTest was validated in a fourth independent group of NAFLD patients from the multicenter prospective CYTOL study cohort. In this independent group of patients the diagnostic value by AUROC (SE) for Steatosis more than 5% was 0.78 (SE=0.04). (Figure 4)
Figure 4. SteatoTest diagnostic value for 126 NAFLD patients of CYTOL prospective study group
6.2.4. Steatosis improvement by SteatoTest after HCV treatment7
The presence of steatosis at liver biopsy is often associated with chronic HCV infection and it was observed that steatosis diminishes in sustained viral responders (SVR).
The validation study of SteatoTest included 171 HCV patients before treatment. Among them, 75 patients with HCV were investigated twice (once before and then two years after treatment) permitted to assess the SteatoTest in HCV patients before and in HCV SVR after 2 years of follow-up. (Figure 5) Results of this analysis were not published in the validation study.
Mean SteatoTest improved significantly compared to baseline from 0.60 to 0.41 (p=0.001) after
2 years of follow-up in SVR patients. Figure 5. SteatoTest improvement in 75 HCV treated patients with Paired Biopsies (p=0.001)
0.4
0.6
0.8
Steatosis Improvement
Base l i n e 2 year

Version 1 – January 2007
24
6.3. NashTest – serum marker of non-alcoholic steatohepatitis (NASH) 6.3.1. Introduction
Non-alcoholic steatohepatitis (NASH) is a histological pattern of the non-alcoholic fatty liver disease (NAFLD) which manifest as an excessive accumulation of hepatic fat in the absence of alcohol consumption. NAFLD is an increasingly recognized cause of liver-related morbidity and mortality.76-78 Although the majority of patients do not develop complications, 28% may develop serious liver sequelae, including end-stage liver disease and hepatocellular carcinoma. Those at highest risk include patients with significant hepatic necro-inflammation and fibrosis. 76-81
Liver biopsy, therefore, has been recommended for confirming its diagnosis and for providing prognostic information.82 The diagnosis of advanced fibrosis or NASH could be very important for motivating patients to make diet or lifestyle modifications, for the intensive treatment of complications of the metabolic syndrome or for providing weight in favor of anti-obesity surgery. FibroTest6 and SteatoTest7 has demonstrated high predictive values for advanced fibrosis and steatosis, respectively, in patients with NAFLD.
Therefore, early detection of NASH along with advanced fibrosis is the first step reducing future cirrhosis-related death.
6.3.2. Discovery and external validation (CYTOL Study Group NAFLD patients) Diagnostic value of biochemical markers (NashTest) for the prediction of non-alcoholo steato hepatitis in patients with non-alcoholic fatty liver disease.9 Poynard T, Ratziu V, Charlotte F, Messous D, Munteanu M, Imbert-Bismut F, Massard J, Bonyhay L, Tahiri M, Thabut D, Cadranel JF, Le Bail B, de Ledinghen V, LIDO Study Group , CYTOL Study Group. BMC Gastroenterol. 2006; 6: 34.
An estimated 15 to 20% of the Western European population has steatosis,19 while more than half of Americans are overweight or obese. Because liver biopsy is impossible to perform in such large cohorts, authors have tried to identify simple non-invasive markers of liver injury in patients with NAFLD.
The aim of this study was to develop and validate the diagnostic utility of a new panel of biomarkers of non alcoholo steato-hepatitis (NASH), the NashTest in patients with non-alcoholic fatty liver disease (NAFLD). Study population Study population included a training group, an independent validation group and a control group of 383 prospectively included blood donors and healthy volunteers. The inclusion criteria were: suspected NAFLD having steatosis at liver biopsy. Exclusion criteria: no histological steatosis, daily alcohol consumption >50 g/d for males and >30 g/d for females during the preceding year, concomitant liver diseases, HIV antibodies, immunosuppression, and an interval >3 months between serum sampling and liver biopsy.
Training group: 238 patients were hospitalized for suspected NAFLD; 160 patients were included and 78 patients were excluded.
Version 1 – January 2007
25
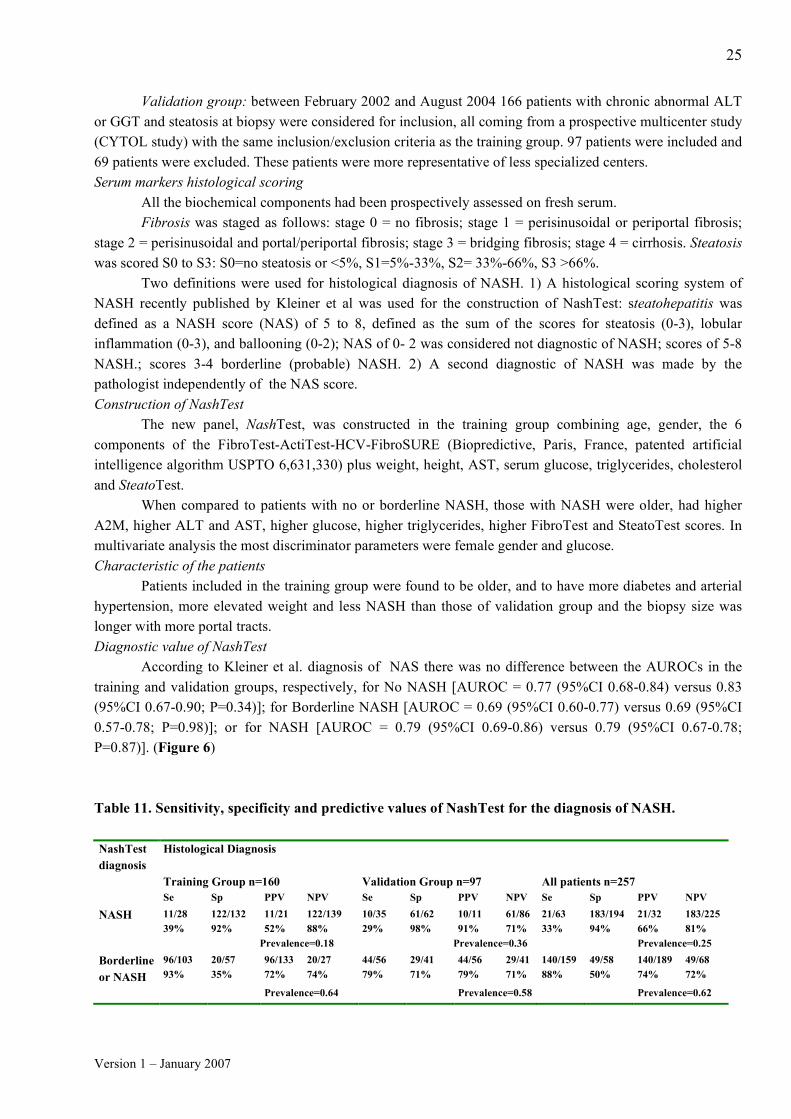
Validation group: between February 2002 and August 2004 166 patients with chronic abnormal ALT or GGT and steatosis at biopsy were considered for inclusion, all coming from a prospective multicenter study (CYTOL study) with the same inclusion/exclusion criteria as the training group. 97 patients were included and 69 patients were excluded. These patients were more representative of less specialized centers. Serum markers histological scoring
All the biochemical components had been prospectively assessed on fresh serum. Fibrosis was staged as follows: stage 0 = no fibrosis; stage 1 = perisinusoidal or periportal fibrosis;
stage 2 = perisinusoidal and portal/periportal fibrosis; stage 3 = bridging fibrosis; stage 4 = cirrhosis. Steatosis was scored S0 to S3: S0=no steatosis or <5%, S1=5%-33%, S2= 33%-66%, S3 >66%.
Two definitions were used for histological diagnosis of NASH. 1) A histological scoring system of NASH recently published by Kleiner et al was used for the construction of NashTest: steatohepatitis was defined as a NASH score (NAS) of 5 to 8, defined as the sum of the scores for steatosis (0-3), lobular inflammation (0-3), and ballooning (0-2); NAS of 0- 2 was considered not diagnostic of NASH; scores of 5-8 NASH.; scores 3-4 borderline (probable) NASH. 2) A second diagnostic of NASH was made by the pathologist independently of the NAS score. Construction of NashTest
The new panel, NashTest, was constructed in the training group combining age, gender, the 6 components of the FibroTest-ActiTest-HCV-FibroSURE (Biopredictive, Paris, France, patented artificial intelligence algorithm USPTO 6,631,330) plus weight, height, AST, serum glucose, triglycerides, cholesterol and SteatoTest.
When compared to patients with no or borderline NASH, those with NASH were older, had higher A2M, higher ALT and AST, higher glucose, higher triglycerides, higher FibroTest and SteatoTest scores. In multivariate analysis the most discriminator parameters were female gender and glucose. Characteristic of the patients Patients included in the training group were found to be older, and to have more diabetes and arterial hypertension, more elevated weight and less NASH than those of validation group and the biopsy size was longer with more portal tracts. Diagnostic value of NashTest According to Kleiner et al. diagnosis of NAS there was no difference between the AUROCs in the training and validation groups, respectively, for No NASH [AUROC = 0.77 (95%CI 0.68-0.84) versus 0.83 (95%CI 0.67-0.90; P=0.34)]; for Borderline NASH [AUROC = 0.69 (95%CI 0.60-0.77) versus 0.69 (95%CI 0.57-0.78; P=0.98)]; or for NASH [AUROC = 0.79 (95%CI 0.69-0.86) versus 0.79 (95%CI 0.67-0.78; P=0.87)]. (Figure 6) Table 11. Sensitivity, specificity and predictive values of NashTest for the diagnosis of NASH. NashTest diagnosis
Histological Diagnosis
Training Group n=160 Validation Group n=97 All patients n=257 Se Sp PPV NPV Se Sp PPV NPV Se Sp PPV NPV
NASH 11/28 39%
122/132 92%
11/21 52%
122/139 88%
10/35 29%
61/62 98%
10/11 91%
61/86 71%
21/63 33%
183/194 94%
21/32 66%
183/225 81%
Prevalence=0.18 Prevalence=0.36 Prevalence=0.25
Borderline or NASH
96/103 93%
20/57 35%
96/133 72%
20/27 74%
44/56 79%
29/41 71%
44/56 79%
29/41 71%
140/159 88%
49/58 50%
140/189 74%
49/68 72%
Prevalence=0.64 Prevalence=0.58 Prevalence=0.62

Version 1 – January 2007
26
Diagnostic value of NashTest for the diagnostic of NASH determined by the pathologist independent of NAS The AUROC for the diagnostic of NASH determined by the pathologist independent of NAS in the
overall population was 0.78 (95% CI 0.71-0.83) without significant difference between the raining and validation groups. Concordance between NashTest and histological diagnosis
Concordances of NashTest with biopsy results for predicting borderline NASH and NASH in the training (n=160), validation (n=97) groups and in all groups pooled together (n=257) were kappa (se) 0.28±0.05, 0.36±0.06 and 0.33±0.04, respectively.
Among 64/383 (17%) controls without biopsy and with more than 30% steatosis no one had NASH. Sensitivity analyses Sensitivity analyses of NashTest for the diagnosis of Nash vs No NASH or borderline and for the diagnosis of no NASH vs borderline NASH and NASH showed no significant differences in AUROCs, according to group, ALT values, alcohol consumption, exclusion of high risk of biomarkers failures, and quality of biopsy.
NashTest AUROCs for the diagnosis of NASH versus borderline or no NASH were unchanged in patients with ALT values lower than 50 IU/L versus ≥50UI/L which represents 50% of patients (0.78 vs 0.73, p NS); therefore NashTest could be used to diagnose NASH even in patients that are not eligible for liver biopsy. Analysis of discordance
A total of 11 (4%) clinically significant discordances (two stages or more) were been observed, nine attributable to NashTest failure (eight false negatives and one false positive) and two to biopsy (false negatives).
In the training group, there was a clinically significant (two stages or more) discordance in three patients, all with NT predicting NASH and biopsy showing no NASH. One of these cases had a good quality biopsy (30 mm non fragmented) but with piecemeal necrosis and no cause of NashTest false positive; two cases had a poor quality biopsy (15mm and five fragments, 22 mm and two fragments) with piece-meal necrosis at biopsy and no cause of NashTest false positive.
In the validation group there was clinically significant (two stages) discordance in eight patients (8%): all were predicted to have no NASH with NashTest and NASH at biopsy. None of these eight patients had a good quality biopsy. There was a very low triglyceride level (0.1 and 0.3 mmol/L) in two patients suggesting two instances of NashTest’s false negatives.
A new panel of biochemical markers (NashTest) is validated as a semi quantitative estimate with 3 classes: “No NASH”, “Borederline NASH”, “NASH”. In this study 4% of patients had discordances, 3.5% attributable to NashTest and 0.5% to biopsy.
These results highlight the utility of NashTest for patients with suspected NAFLD that will permit, along with previously validated FibroTest and SteatoTest, to reduce the use of liver biopsy, to identify the patients at risk and to reassure those without fibrosis or NASH.

Version 1 – January 2007
27
Figure 6. ROC curves of the NashTest for the diagnosis of NASH (Panel A) and No Nash (Panel B) in Training and in Validation Groups.
Panel A Panel B

Version 1 – January 2007
28
6.4. AshTest - marker of gravity of the alcoholic steatohepatitis (ASH) 6.4.1. Introduction
Chronic alcoholic liver disease (ALD) affects millions of individuals worldwide and is a major cause
of liver transplantation and death. 15–40% of ALD patients may develop end-stage liver disease, digestive hemorrhage and hepatocellular carcinoma. Those at the highest risk include patients with cirrhosis and alcoholic steato-hepatitis (ASH).72, 83-87
ASH is a necrotizing inflammatory lesion that in its severe form - Maddrey discriminant function (DF) >32 - is associated with high mortality88 despite corticosteroid treatment.89-90 Accessibility of transjugular liver biopsy permitting the diagnosis of ASH is low in many centers, dramatically reducing the proportion of patients treated with corticosteroids.91
6.4.2. Discovery and validation The diagnostic value of biomarkers (AshTest) for the prediction of alcoholic steato hepatitis in patients with chronic alcoholic liver disease8 Thabut D, Naveau S, Charlotte F, Massard J, Ratziu V, Imbert-Bismut F, Cazals-Hatem D, Abella A, Messous D, Beuzen F, Munteanu M, Taieb J, Moreau R, Lebrec D, Poynard T. J Hepatol. 2006; 44: 1175-85
The objectives of the current study were to evaluate the diagnostic utility of a new panel (AshTest) for the detection of alcoholic steato-hepatitis (ASH) in patients with chronic alcoholic liver disease (ALD).
Inclusion criteria were self-reported daily alcohol consumption > 50 g of pure ethanol during the
preceding year. Non-inclusion criteria were concomitant liver diseases, HIV antibodies and immunosuppression, non-available serum or biopsy or more than 1 month apart between both.
A total of 720 subjects were analyzed and were included: 70 patients in the training group, 62 in validation group 1 - called severe patients-, 93 in validation group 2-non-severe patients-, and 299 apparently healthy blood donors in the control group.
The main histological end point was the presence of ASH, defined by the presence of both polymorphonuclear neutrophil infiltrate (PMN) and hepatocellular necrosis. The secondary end points included ASH features: necrosis, PMN, Mallory bodies and ballooning, and a scoring system of ASH combining the detailed alcoholic features. Each feature was scored from 0 to 2 with a total score ranging from 0 to 8 with a four-grade scoring system: 0, no ASH; 1–2, mild; 3–4, moderate; 5–8, severe ASH. Fibrosis staging was adapted from the METAVIR: F0, no fibrosis; F1, fibrosis without septa; F2, few septa; F3, numerous septa, F4 cirrhosis.
The prevalence of histological diagnosis of ASH was different in the three groups, whatever its definition: the association of PMN and necrosis was more frequent (60%) in the training group vs the validation groups (19% vs 24%); and there was an absence of any ASH features in 13%, 48% and 30% of the groups, respectively. The prevalence of cirrhosis was similar in the training group (81%) and validation group 1 (90%) but lower in validation group 2 (25%).

Version 1 – January 2007
29
Construction of the test A new panel (AshTest), was constructed combining differently the six components of the FibroTest– ActiTest (patented artificial intelligence algorithm USPTO 6,631,330), with the serum AST activity and new algorithms adjusted by age and gender. The combination of the components was totally different from that of FibroTest–ActiTest.
AshTest provides a numerical quantitative estimate of liver ASH ranging from 0.00 to 1.00, corresponding to an ASH scoring system of grades ASH0–ASH1 to ASH3. (Table 12)
Table 12. Panel A. Conversion between the AshTest results and the corresponding histological grade. Panel B. Median AshTest values in blood donors and in patients according ASH grade at liver biopsy. Panel A. Panel B.
Diagnosis of alcoholic steatohepatitis (ASH)
The most significant components associated with the presence of ASH were BILI, GGT, and APOA1. In logistic regression analysis, the most significant component was APOA1, with an odds ratio=8.9, P=0.007. There was a dramatic decrease of serum apoA1 according to PMN infiltrate: 1.29 (0.04) g/L in 133 patients without PMN, 0.68 (0.09) in 57 patients with mild and 0.51 (0.07) in patients with severe PMN infiltrate (P<0.0001 between no vs either mild or severe PMN infiltrate). Diagnostic value of AshTest
For the main endpoint, ASH diagnosed as the presence of both necrosis and PMN infiltrate, AshTest had higher AUROCs in the training and validations groups 1 and 2, respectivement: [0.90, 0.88, 0.89] than Maddrey-DF [0.75, 0.64, 0.83] and the AST/ALT ratio [0.80, 0.79, 0.76] (all P<0.05 except between AshTest and AST/ALT in validation group 2-not severe patients).
The AUROC (se) of AshTest [0.89 (0.05)] in the integrated database (n=225) was higher than the AUROCs of each component and of Maddrey-DF and AST/ALT for each group (Table 13 and Figure 8)
An AshTest score of 0.50 had similar excellent diagnostic values in the training and validation groups: 88%, 92% and 59% sensitivity; and 79%, 72% and 94% specificity, respectively, higher than Maddrey-DF and the AST/ALT ratio.
There was a very significant overall correlation between AshTest and the ASH grades in all patients from controls to severe ASH. For AshTest there was a significant difference between all grades except between ASH grade 0 and 1. For Maddrey-DF and the AST/ALT ratio there was no significant difference between ASH grades 0 and 1 and between ASH grades 2 and 3. (Figure 7, Panels A, B and C, respectively)
AshTest Predicted histological grade
0.0000 – 0.1700 ASH0 – ASH1 0.1701 – 0.5535 ASH1 – ASH2 0.5536 – 0.7799 ASH2 0.7800 – 1.0000 ASH3
Category Median AshTest Value
Blood donors 0.005 No ASH 0.05 ASH grade 1 0.05 ASH grade 2 0.64 ASH grade 3 0.84

Version 1 – January 2007
30
Table 13. AUROCs of AshTest, AST - ALT ratio and Maddrey DF for the diagnosis of ASH (defined as presence of necrosis and PMN infiltrate) and its different components.
Diagnostic panel Alcoholic
hepatitis Hepatocellular necrosis
Polymorphonuclear infiltrate
Mallory bodies
Ballooning
Training group AshTest 0.90 0.68 0.87 0.75 0.78 AST/ALT 0.80 0.61 0.81 0.66 0.70 Maddrey 0.75 0.66 0.74 0.54 0.70
Validation group 1 AshTest 0.88 0.79 0.82 0.80 0.72 AST/ALT 0.79 0.63 0.65 0.77 0.69 Maddrey 0.64 0.63 0.67 0.61 0.64
Validation group 2 AshTest 0.89 0.64 0.87 0.90 0.74 AST/ALT 0.76 0.64 0.77 0.80 0.67 Maddrey 0.83 0.63 0.81 0.76 0.74
All groups AshTest 0.89 0.66 0.87 0.85 0.76 AST/ALT 0.78 0.60 0.76 0.76 0.69 Maddrey 0.78 0.60 0.78 0.72 0.71
Sensibility analysis according to the length of biopsy
When the AUROCs of AshTest, Maddrey-DF and AST/ALT ratio were compared according to the length of biopsy, there were always slightly better in patients with biopsies of 15 mm or more meanwhile NS, For biopsies higher and less than 15 mm leght, respectively AUROCs for AshTest were always significantly higher vs Maddrey-DF (P=0.005 and p=0.0004) and vs the AST/ALT ratio (P=0.01 and p=0.001).
Analysis of discordance
In the training and the two validation groups there were 39/225 (17%) cases of discordance between the diagnosis of ASH predicted by AshTest and that predicted by liver biopsy. Failure attributable to biopsy (false negative) was suspected in 15 cases (7%). Nine cases (3%) were indeterminate as small and fragmented biopsies but no sign of ASH. The 16 remaining cases (7%) were classified as false negatives of AshTest.
This study suggests that AshTest diagnostic value by AUROCs is significant better than Maddrey-DF at a cut-off of 32, which should not be used to make therapeutic decisions. Similarly, AshTest have better sensitivity and specificity in comparison with AST/ALT ratio for the diagnostic of severe alcoholic steatohepatitis.
AshTest is focused on the diagnosis of advanced ASH (with ASH defined as necrosis and PMN) in order to replace the transvenous liver biopsy with biomarkers in severe patients who could benefit from early treatment with corticosteroids.

Version 1 – January 2007
31
Figure 7. Box plots of AshTest (Panel A), Maddrey (Panel B) and AST/ALT (Panel B) ratio according to severity of alcoholic hepatitis (n=225). Panel A Panel B Panel C
Figure 8. AUROC curves of AshTest (solid black line), Maddrey (grey line) and AST/ALT ratio (dotted line) for the diagnosis of alcoholic hepatitis (n=225).

Version 1 – January 2007
32
7. Screening strategies with non-invasive biomarkers: FibroMAX (FibroTest, SteatoTest, NashTest) 7.1. Efficacy of screening of hyperlipidemics with non-invasive biomarkers Screening for liver disease using noninvasive biomarkers (FibroTest-SteatoTest-NashTest -FIBROSURE™) in patients with hyperlipidemia.92 Ratziu V, Giral P, Munteanu M, Messous D, Mercadier A, Bernard M, Morra R, Imbert-Bismut F, Bruckert E, Poynard T. Aliment Pharmacol Ther. 2007; 25: 207-218
Mortality related to complications of cirrhosis is increasing in patients with insulin-resistance factors.78 Hyperlipidemic patients could have increased serum levels of GGT or ALT and frequently have multiple risk factors of insulin resistance.93 Liver biopsy could not be performed in such a great number of patients and has the disadvantage of the sampling error, which has been well demonstrated for hepatitis C and also recently for non-alcoholic fatty liver disease (NAFLD).18 Two studies demonstrated that biomarkers had less sampling errors than small and fragmented liver biopsies for clinical endpoints.94,95
Non-invasive screening methods should be developed for hyperlipidemics to identify patients with advanced liver fibrosis (F2F3F4) or with steatohepatitis (NASH). Sensitivity analysis performed on studies which validated biomarkers (NashTest and SteatoTest) with liver biopsy, found identical diagnostic value of NashTest and SteatoTest according to the presence or absence of diabetes and hypertriglyceridemia.7,9
The main aim was to use non-invasive surrogate biomarker FibroTest, fully validated in several
pathologies, and newly developped biomarkers, SteatoTest and NashTest, previously validated in non-alcoholic steatosis (NAFLD), to assess the prevalence of advanced liver disease in a large population of hyperlipidemic patients free of other liver pathology.
A consecutive cohort of hyperlipidemics (HCV, HBV negative, hyperlipidemia secondary to renal
disease or hypothyroidism excluded) was prospectively followed in a lipid center and the sera (stored at –80° C) were retrospectively analyzed; a control group of blood donors (BD) was prospectively included (diabetics BD were excluded).
Advanced fibrosis, predicted when FibroTest was greater than 0.48, was defined as many septa, numerous septa, or cirrhosis. Advanced steatosis (more than 5%) was predicted when SteatoTest was greater than 0.57. The diagnosis of NASH was predicted in the three categories according to Kleiner et al: NASH (NAS 5-8), Borderline NASH (NAS 3-4), No NASH (NAS of 0-2).
A total of 2,933 subjects were pre-included; 54 hyperlipidemics and 34 BD were then excluded as high risk profile, 30 hyperlipidemics and 78 BD for missing data, leaving a total of 2,834 included subjects (51% female, median age 49 years, 1,909 hyperlipidemics and 925 BD). Among hyperlipidemics included, 83% had cholesterol >200mg/dl, 59% HDL-C <1.03mmol/L in males and <1.29mmol/L in females, 40% TG >=1.70mmol/L, 36% BMI >27, central obesity (by waist>102cm in male and >88cm female), 54% arterial hypertension or treatment, and 15% had fasting glucose >6.1mmol or diabetes treatment. GGT or ALT were elevated more than 50 IU/L in only 24% hyperlipidemics. Prevalence of liver fibrosis predicted by FibroTest, factors of advanced fibrosis
Presumed advanced fibrosis (F2F3F4) was predicted by FibroTest in 53/1909 (2.8%) hyperlipidemics, this included 31 F2, 14 F3, 3 F3F4 and 5 F4 versus none (0%) among the 925 BD (P<0.0001). Among diabetic hyperlipidemics patients the prevalence of F2F3F4 was higher (6.1%), with a maximum in patients with HOMA over 3.0 (9.5%).

Version 1 – January 2007
33
Clinical characteristics significantly associated with presumed fibrosis at FibroTest in univariate analysis were age, male gender, waist circumference (p<0.001). Drugs and alcohol consumption were not associated with fibrosis. In multivariate logistic regression taking in account metabolic factors not included in FibroTest algorithm, triglycerides increase and HDL-C decrease were risk factors of fibrosis. The prevalence of presumed advanced fibrosis increased linearly according to the number of metabolic syndrome factors (P<0.0001), reaching 9.4% in hyperlipidemic patients with 5 factors. Prevalence of steatosis predicted by SteatoTest, risk factors of severe steatosis
Advanced steatosis in 569/1893 hyperlipidemic patients (30%) versus 8/164 (5%) BD (P<0.0001); The prevalence of advanced steatosis was higher for type 2 diabetic hyperlipidemics (66%). The prevalence of presumed steatosis increased according to the number of metabolic syndrome factors, reaching 96% in hyperlipidemics with 5 factors, p<0.0001. Prevalence of steato-hepatitis predicted by NashTest, risk factors for NASH The highest prevalence of presumed NASH was observed among type 2 diabetic patients (23.6%), in patient with hypertriglyceridemia or on fibrate treatment (16%) and in patients with central obesity (15%). NASH prevalence was higher in hyperlipidemics with metabolic syndrome versus hyperlipidemics without (18.4% vs 1.8%, p<0.0001) and the prevalence increased lineary (p<0.0001) with the number of metabolic factors (0% with no factor to 50.9% in hyperlipidemics with 5 factors). Prevalence of liver injury according to the number of metabolic factors
The prevalence of presumed advanced fibrosis increased linearly according to the number of metabolic syndrome factors (P<0.0001), reaching 9.4% in hyperlipidemic patients with 5 factors.
The prevalence of presumed advanced steatosis increased according to the number of metabolic syndrome factors, reaching 96% in hyperlipidemics with 5 factors, p<0.0001.
NASH prevalence was higher in hyperlipidemics with metabolic syndrome versus hyperlipidemics without (18.4% vs 1.8%, p<0.0001) and the prevalence increased lineary (p<0.0001) with the number of metabolic factors (0% with no factor to 50.9% in hyperlipidemics with 5 factors). (Figure 9) Sensitivity analysis Fifty percent of patients were treated with lipid lowering agents (50% had statins) and this didn’t have an impact on presumed steatosis and NASH.
The use of biomarkers allows the estimation of the prevalence of advanced fibrosis, steatosis and steatohepatitis and their risk factors in a large sample of hyperlipidemic patients. The estimated prevalence.
The estimated prevalence of liver injury was 30% for advanced steatosis and 7% for NASH; hyperlipidemics had 3% advanced fibrosis compared to 0% in 925 blood donors. There was a clear increase of risk when two metabolic syndrome factors or more where present. The highest prevalence has been observed for hyperlipidemic diabetic patients: advanced steatosis 66%, NASH 24% and advanced fibrosis 6%.
The use of these biomarkers should help the clinician to reassure patients with only steatosis and to better manage patients with severe injuries such as advanced fibrosis and NASH.

Version 1 – January 2007
34
Figure 9. Prevalence (%) of liver injury (steatosis, NASH and fibrosis) according to the number of metabolic risk factors.
0
10
20
30
40
50
60
70
80
90
100
Steatosis NASH Fibrosis
0
1
2
3
4
5

Version 1 – January 2007
35
7.2. Efficacy of screening of diabetics with non-invasive biomarkers Efficacy of screening for advanced fibrosis (AF) in diabetic patients (DB) using non-invasive biomarkers: FibroTest -FibroMAX and Fibroscan. 96 Jacqueminet S, Morra R, Munteanu M, Devers L, Messous D, Bernard M, Jeanne S, Sachon C, Heurtier A, Bonnefont-Rousselot D, Mercadier A, Imbert Bismut F, Ratziu V, Grimaldi A, Poynard T. J Hepatol. 2006; 44 : S260 (Abstract) Diabetics are at risk of non-alcoholic fatty liver disease (NAFLD) leeding to cirrhosis and liver cancer. Due to high prevalence of diabetes liver biopsy cannot be performed to identify advanced fibrosis.
The primary aim was to identify advanced fibrosis (many septa F2, numerous septa F3 and cirrhosis F4) using non-invasive fibrosis biomarkers, FibroTest-FibroSURE in type 2 diabetics and concomitantly to estimate the prevalence of severe steatosis (more than 30%) and non-alcoholic steatohepatitis (NASH) using previously validated non-invasive biomarkers, SteatoTest and NashTest respectively.
The secondary aim was to confirm the clinical interest of the screening by FibroTest by reinvestigation of suspected advanced fibrosis with FibroScan (FSc).
Consecutive diabetics seen in a diabetes unit, were prospectively included, as well as a prospective control group of blood donors (BD). Security algorithms permitted to exclude high-risk (HR) profiles of serum biomarkers. FibroMax was performed blinded to all characteristics. Advanced fibrosis, predicted when FibroTest was greater than 0.48, was defined as many septa, numerous septa, or cirrhosis. Advanced steatosis (more than 5%) was predicted when ST was greater than 0.57. The diagnosis of NASH was predicted in the three categories according to Kleiner et al: NASH (NAS 5-8), Borderline NASH (NAS 3-4), No NASH (NAS 0-2).
Diabetics predicted advanced fibrosis (AF) at FibroTest were re-investigated by a hepatologist with FSc, APRI, and if necessary, ultrasonography, endoscopy or biopsy. Diabetics with previous suspected advanced fibrosis (pAF) were analyzed only for FibroTest validation purpose and diabetics without pAF as a true “naïve” population (nP). From 2,401 subjects pre-included, 252 were excluded (75 HR and 177 reinvestigated), 1,997 were included: 1,161 diabetics and 988 BD. 54% diabetics were male, mean age 54yrs, 68% diabetics type 2; 81% had fasting glucose ≥6.1 mmol/L, 68% had glycohaemoglobin ≥7.5%, 39% cholesterol ≥2.00 g/L, 27% triglycerides≥1.5g/L, 53% BMI ≥27, 50% arterial hypertension, 47% no alcohol consumption, 40% <50g/d, and 13% >50 g/d. Blood donors were younger (36years), had lower BMI (p<0.0001) and less blood donors had none alcohol consumption. Prevalence of hepatic lesions predicted by biomarkers In 1,161 diabetics, FibroTest predicted 94 (8.1%) advanced fibrosis: 28 F4, 26 F3 and 40 F2, versus 0 in BD (P<0.0001); 25 diabetics of the 94 had previous suspected advanced fibrosis (pAF) and 69 were a true “naïve” diabetic population (nP). FibroTest predicted 69 advanced fibrosis among 1136 nP diabetics (6.1%). Among 94 F2F3F4, 49 diabetics (12 pAF and 37 nP) from 94 AF have been reinvestigated at the time of this writing:
-among 25 diabetics known as pAF 12 were reinvestigated and all were confirmed as AF by Fibroscan (Fibroscan range 10.2-75kPa) that is 100% PPV in per protocol and 48% (12/25) in intention to detect analysis.

Version 1 – January 2007
36
-among 69 nP, 37 were reinvestigated and AF was confirmed in 25 (range FS 6.9-34.3 kPa, 8 biopsies and 2 endoscopies), yielding a PPV of FibroTest = 67.6% (25/37) in per protocol and 36.2% (25/69) in intention to detect analysis For the 25 nP diabetics reinvestigated and with FibroTest results confirmed, the repartition of fibrosis
was as follows: 10 F2, 8 F3 and 7 cirrhosis (2 with confirmed and one suspected hepatocellular carcinoma, 1 moderate varices). The cause of advanced fibrosis was NAFLD alone in 15/25 (NASH in 7 and borderline NASH in 6) and NAFLD + HCV in 3, NAFLD + alcohol in 4 and NAFLD + metastasis, PBC and HBV, one in each respectively.
In multivariate analysis two factors were strongly associated (p<0.0001) with AF: type 2 diabetes (88%) and age more than 45 years (97%). In this high risk group for advanced fibrosis, the prevalence of predicted AF = 9.1% (62/679) vs 1.5% (7/457) in the non-high risk group (p<0.0001) and 0% in blood donors. The positive predictive value of FibroTest for confirmed AF in the high risk group = 25/35 (71.4%) in per protocol and 25/62 (40.3%) in intention to detect analysis. Steatosis and NASH predicted by SteatoTest and NashTest 388/912 (42.5%) diabetics had steatosis predicted by SteatoTest versus 11/222 (5%) BD (p<0.0001). In type 2 diabetics with advanced fibrosis versus no or minimal fibrosis, steatosis was predicted by SteatoTest in 74% versus 59%, respectively (p=0.03). 63/778 (8%) diabetics had NASH detected by NashTest versus no BD (p<0.0001). In type 2 diabetics with advanced fibrosis versus no or minimal fibrosis, NASH was predicted by NashTest in 22% versus 9%, respectively (p=0.005).
A screening strategy using FibroTest detected advanced fibrosis (F2F3F4) in 6.1% of diabetics followed in a tertiary center and not suspected previously of liver disease. 36% of these had already been confirmed including 7 asymptomatic cirrhosis. The prevalence of predicted NASH in diabetics estimated by NashTest is 8% vs 0 blood donors (p<0.0001).
This study strongly suggests that non-invasive biomarkers could be very useful for the screening of advanced fibrosis and NASH in type 2 diabetics older than 45 years to prevent liver mortality. (Figure 10)

Version 1 – January 2007
37
8. Conclusion
More than 170,000,000 people worldwide are chronically infected with the hepatitis C virus (HCV), more than 350,000,000 with the hepatitis B virus (HBV) and more than one billion are at risk of alcoholic and non alcoholic steatosis. These four diseases are responsible for more than 500, 000 annual cases of liver cancer and similar numbers of digestive hemorrhage and ascites episodes. Major breakthroughs have been achieved in recent years in for the specific diagnosis and treatment of these diseases.
Unfortunately, even in developed countries, mortality due to chronic liver diseases is increasing due to a lack of detection and treatment.
FibroMax’s tests (FibroTest, SteatoTest, ActiTest, NashTest and AshTest) are simple and non-
invasive alternatives to liver biopsy. The liver biopsy, though considered the gold standard, does not have the expected advantages of
a first line procedure to assess the severity of chronic liver diseases or acute hepatitis in excessive drinkers. The main disadvantages of liver biopsy are sampling errors, cost and severe adverse events.
FibroMax will be useful in decreasing the human, social and economic costs of the management of chronic liver diseases.
The early use of these biomarkers will allow for faster and simpler access to the healthcare system for patients before the occurrence of end stage liver diseases.

Version 1 – January 2007
38
9. FibroMAX pack: how and when to use non-invasive biomarkers, recommended algorithms 9.1. Best management of the patients with metabolic risk factors (overweight, dyslipidemia, diabetes). FibroMAX pack: FibroTest, SteatoTest and NashTest
The need of mass screening for significant liver injury for providing prognostic information in patients with NAFLD is increasing due to the epidemics of obesity and diabetics.19
Two recent studies92,96 (see Chapter 7) proved the efficacy of the screening with the new generation tests of FibroMax (in the combination FibroTest, SteatoTest and NashTest) patients with metabolic risk factors in particular hyperlipidemics and diabetic subjects. 6-7,9 These tests will allow better identification and estimation of the severity of those patients at risk (fibrosis and NASH) and reassurance for patients without fibrosis or NASH among those with steatosis.
Figure 10. Proposed screening strategy of advanced fibrosis, steatosis and NASH in NAFLD patients.
Type2 DB >45yrs Overweight, Metabolic
sd. Hyperlipidemics Screening FibroMAX
F0F1, No NASH
No or minimal fibrosis Absent NASH
F2, borderline NASH
Septal fibrosis Borderline NASH
F3F4, NASH Pre-cirrhosis/cirrhosis Present NASH
Excluded High risk of
false positive / negative
Every 5 years FibroMAX :
FibroTest SteatoTest + NashTest
Every year FibroMAX: FibroTest
SteatoTest + NashTest Reducing risk factors
Every year FibroMAX: Fibroscopy (OV) ECHO (nodule) αFP

Version 1 – January 2007
39
9.2. Best management of the patients with excessive alcohol intake. FibroMAX pack: FibroTest, SteatoTest and AshTest
Chronic alcoholic liver disease (ALD) affects millions of individuals worldwide and is a major cause of liver transplantation and death. Those ALD patients at the highest risk to develop complications and end-stage liver disease include patients with cirrhosis and alcoholic steato-hepatitis (ASH) 72, 83-87. ASH is a necrotizing inflammatory lesion that in its severe form (Maddrey-DF >32) is associated with high mortality 88 despite corticosteroid treatment. 89-90 The use of non-invasive biomarkers validated for the prediction of fibrosis5 and ASH8 is expected to increase the proportion of patients with severe ASH treated with with corticosteroids without liver biopsy. (Figure 11). Figure 11. Proposed screening strategy of severe alcoholic steatohepatitis (ASH) in excessive drinkers. Panel A. ASH screening and treatment strategy. Panel B. Fibrosis screening strategy in ALD patient.
Excessive drinker SCREENING ASH with
FibroMAX AshTest
AshTest <0.50
AshTest >0.50 Severe ASH No Biopsy
Excluded High risk of
false positive / negative
No need of specific treatment
(corticosteroids)
Maddrey-DF <32 Benefit-risk of corticosteroids?
Maddrey-DF >32 Specific treatment:
corticosteroids
Excessive drinker SCREENING FibroMAX
FibroTest + SteatoTest + AshTest if suspicion of ASH
F0F1
No or minimal fibrosis
F2, borderline NASH
Septal fibrosis
F3F4, NASH Pre-cirrhosis/cirrhosis
Excluded High risk of
false positive / negative
Every 5 years FibroMAX :
Every year FibroMAX
Every year FibroMAX: Fibroscopy (OV) ECHO (nodule) αFP

Version 1 – January 2007
40
9.3. Best management of the patients with chronic viral hepatitis 1,72
FibroMAX pack: FibroTest, SteatoTest and ActiTest Figure 12. Recommended algorithm for FibroTest-ActiTest-FIBROSURE™ or alternative prescription.
Treatment
Severe-Fibrosis Cirrhosis:
FibroTest >0.58
or Severe Activity:
ActiTest >0.60
Treatment
or Follow-Up
FibroTest-ActiTest
every 6 months
Moderate Fibrosis
FibroTest 0.32-0.58
Moderate Activity
ActiTest 0.37-0.60
Follow-up
FibroTest-ActiTest
every 12 months
No or Minimal Fibrosis
FibroTest 0.00-0.31
No or Minimal Activity
ActiTest 0.00-0.36
No Biopsy
Yes
No risk of false positive
No risk of false negative
Treatment
Or
Follow-up
Risk of false positive
Risk of false negative
FibroTest-ActiTest
Interpretable?
Genotype
Viral Load
FibroTest-ActiTest
HCV RNA detectable
No (extreme values)
Biopsy? Fibroscan?
< 5%of cases
WARNING95% of cases
OK

Version 1 – January 2007
41
10. References
1. Poynard T, Imbert-Bismut F, Munteanu M, Messous D, Myers RP, Thabut D, Ratziu V, Mercadier A, Benhamou Y, Hainque B. Overview of the diagnostic value of biochemical markers of liver fibrosis (FibroTest) and necrosis (ActiTest) in patients with chronic hepatitis C. Comp Hepatol 2004; 3: 8. 2. Poynard T, Halfon P, Castera L, Ratziu V, Imbert-Bismut F, Naveau S, Thabut D, Lebrec D, Zoulim F, Munteanu M, Bourlière M, de Ledinghen V. Meta-analysis of FibroTest for the the diagnosis of fibrosis in the four more frequent liver diseases. Gastroenterol Clin Biol. 2006; 30: 1057 (Abstract) 3. Myers RP, Tainturier MH, Ratziu V, Piton A, Thibault V, Imbert-Bismut F, Messous D, Charlotte F, Di Martino V, Benhamou Y, Poynard T. Prediction of liver histological lesions with biochemical markers in patients with chronic hepatitis B. J Hepatol. 2003; 39: 222-30. 4. Poynard T, Zoulim F, Ratziu V, Degos F, Imbert-Bismut F, Deny P, Landais P, El Hasnaou A, Slama A, Blin P, Thibault V, Parvaz P, Munteanu M, Trepo C. Longitudinal assessment of histology surrogate markers (FibroTest–ActiTest) during lamivudine therapy in patients with chronic hepatitis B infection. Am J Gastroenterol 2005; 100: 1970-80. 5. Naveau S, Raynard B, Ratziu V, Abella A, Imbert-Bismut F, Messous D, Beuzen F, Capron F, Thabut D, Munteanu M, Chaput JC, Poynard T. Biomarkers for the prediction of liver fibrosis in patients with chronic alcoholic liver disease (ALD). Clin Gastroenterol Hepatol. 2005; 3: 167-74. 6. Ratziu V, Massard J, Charlotte F, Messous D, Imbert-Bismut F, Bonyhay L, Tahiri M, Munteanu M, Thabut D, Cadranel JF, Le Bail B, De Ledinghen V, Poynard T, the LIDO Study Group and the CYTOL Study Group Diagnostic value of biochemical markers (FibroTest-FibroSURE) for the prediction of liver fibrosis in patients with non-alcoholic fatty liver disease. BMC Gastroenterology 2006, 6:6. 7. Poynard T, Ratziu V, Naveau S, Thabut D, Charlotte F, Messous D, Capron D, Abella A, Massard J, Ngo Y, Munteanu M, Mercadier A, Manns M and Albrecht J. The diagnostic value of biomarkers (SteatoTest) for the prediction of liver steatosis. Comp Hepatol. 2005; 4: 10. 8. Thabut D, Naveau S, Charlotte F, Massard J, Ratziu V, Imbert Bismut F, Cazals-Hatem D, Abella A, Messous D, Beuzen F, Munteanu M, Taieb J, Moreau R, Lebrec D, Poynard T. The diagnostic value of biomarkers (AshTest) for the prediction of alcoholic steato-hepatitis in patients with chronic alcoholic liver disease. J Hepatol. 2006; 44: 1175-85. 9. Poynard T, Ratziu V, Charlotte F, Messous D, Munteanu M, Imbert-Bismut F, Massard J, Bonyhay L, Tahiri M, Thabut D, Cadranel JF, Le Bail B, de Ledinghen V and the LIDO Study Group and the CYTOL study group. Diagnostic value of biochemical markers (NashTest) for the prediction of non alcoholo steato hepatitis in patients with non-alcoholic fatty liver disease. BMC Gastroenterol. 2006; 6: 34. 10. Cadranel JF, Rufat P, Degos F. Practices of Liver Biopsy in France: Results of a Prospective Nationwide Survey. Hepatology 2000; 32: 477-481. 11. Association Française pour Etude Foie. Recommandations pour la pratique clinique pour la réalisation de la ponction biopsie hépatique. http://www.meditis.net/pagepro.asp. 12. Wong JB, Koff RS. Watchful waiting with periodic liver biopsy versus immediate empirical therapy for histologically mild chronic hepatitis C. A cost-effectiveness analysis. Ann Intern Med 2000; 133: 665-75. 13. Bonny C, Rayssiguier R, Ughetto S, Aublet-Cuvelier B, Baranger J, Blanchet G, Delteil J, Hautefeuille P, Lapalus F, Montanier P, Bommelaer G, Abergel A. Medical practices and expectations of general practitioners in relation to hepatitis C virus infection in the Auvergne region. Gastroenterol Clin Biol 2003; 27: 1021-25.

Version 1 – January 2007
42
14. Maharaj B, Maharaj RJ, Leary WP, Cooppan RM, Naran AD, Pirie D, Pudifin DJ. Sampling variability and its influence on the diagnostic yield of percutaneous needle biopsy of the liver. Lancet 1986; 8480: 523-5. 15. Regev A, Berho M, Jeffers LJ, Milikowski C, Molina EG, Pyrsopoulos NT, Feng ZZ, Reddy KR, Schiff ER. Sampling error and intraobserver variation in liver biopsy in patients with chronic HCV infection. Am J Gastroenterol 2002; 97: 2614-8. 16. Colloredo G, Guido M, Sonzogni A, Leandro G. Impact of liver biopsy size on histological evaluation of chronic viral hepatitis: the smaller the sample, the milder the disease. J Hepatol 2003; 39: 239-44. 17. Bedossa P, Dargère D, Paradis V. Sampling variability of liver fibrosis in chronic hepatitis C. Hepatology 2003; 38; 1449-57. 18. Ratziu V, Charlotte F, Heurtier A, Gombert S, Giral P, Bruckert E, Grimaldi A, Capron F, Poynard T for the LIDO Study Group. Sampling variability of liver biopsy in nonalcoholic fatty liver disease. Gastroenterology 2005; 128: 1898-906. 19. Bellentani S, Bedogni G, Miglioli L, Tiribelli C: The epidemiology of fatty liver. Eur J Gastroenterol Hepatol 2004, 16:1087-93. 20. Bellentani S, Saccoccio G, Masutti F, Croce LS, Brandi G, Sasso F, Cristanini G, Tiribelli C: Prevalence of and risk factors for hepatic steatosis in Northern Italy. Ann Intern Med 2000, 132:112-7. 21. Marceau P, Biron S, Hould FS, Marceau S, Simard S, Thung SN, Kral JG: Liver pathology and the metabolic syndrome X in severe obesity. J Clin Endocrinol Metab 1999, 84:1513-1517. 22. Loguercio C, De Simone T, D'Auria MV, de Sio I, Federico A, Tuccillo C, Abbatecola AM, Del Vecchio Blanco C: Italian AISF Clinical Group. Non-alcoholic fatty liver disease: a multicentre clinical study by the Italian Association for the Study of the Liver. Dig Liver Dis 2004, 36:398-405. 23. Dixon JB, Bhathal PS, O'Brien PE: Nonalcoholic fatty liver disease: predictors of nonalcoholic steatohepatitis and liver fibrosis in the severely obese. Gastroenterology 2001, 121:91-100. 24. Ong JP, Elariny H, Collantes R, Younoszai A, Chandhoke V, Reines HD, Goodman Z, Younossi ZM: Predictors of nonalcoholic steatohepatitis and advanced fibrosis in morbidly obese patients. Obes Surg 2005, 15:310-5. 25. Boza C, Riquelme A, Ibanez L, Duarte I, Norero E, Viviani P, Soza A, Fernandez JI, Raddatz A, Guzman S, Arrese M: Predictors of nonalcoholic steatohepatitis (NASH) in obese patients undergoing gastric bypass. Obes Surg 2005, 15:1148-53. 26. Haukeland JW, Konopski Z, Linnestad P, Azimy S, Marit Loberg E, Haaland T, Birkeland K, Bjoro K: Abnormal glucose tolerance is a predictor of steatohepatitis and fibrosis in patients with non-alcoholic fatty liver disease. Scand J Gastroenterol 2005, 40:1469-77. 27. Park KS, Lee YS, Park HW, Seo SH, Jang BG, Hwang JY, Cho KB, Hwang JS, Ahn SH, Kang YN, Kim GC: Factors associated or related to with pathological severity of non-alcoholic fatty liver disease. Korean J Intern Med 2004, 19:19-26. 28. Imbert-Bismut F, Ratziu V, Pieroni L, Charlotte F, Benhamou Y, Poynard T: Biochemical markers of liver fibrosis in patients with hepatitis C virus infection: a prospective study. Lancet 2001, 357:1069-75. 29. Koruk M, Taysi S, Savas MC, Yilmaz O, Akcay F, Karakok M: Serum levels of acute phase proteins in patients with nonalcoholic steatohepatitis. Turk J Gastroenterol 2003, 14:12-7. 30. Barrett AJ, Starkey PM: The interaction of alpha 2-macroglobulin with proteinases. Characteristics and specificity of the reaction, and a hypothesis concerning its molecular mechanism. Biochem J 1973, 133:709-24.

Version 1 – January 2007
43
31. Gray RS, James K, Merriman J, Starkey IR, Elton RA, Clarke BF, Duncan LJ: Alpha 2-macroglobulin and proliferative retinopathy in type 1 diabetes. Horm Metab Res 1982, 14:389-92. 32. Chu CT, Rubenstein DS, Enghild JJ, Pizzo SV: Mechanism of insulin incorporation into alpha 2-macroglobulin: implications for the study of peptide and growth factor binding. Biochemistry 1991, 30:1551-60. 33. Westwood M, Aplin JD, Collinge IA, Gill A, White A, Gibson JM: alpha 2-macroglobulin: a new component in the insulin-like growth factor/insulin-like growth factor binding protien-1 axis. J Biol Chem 2001, 276:41668-74. 34. Castera L, Hartmann DJ, Chapel F, Guettier C, Mall F, Lons T, et al. Serum laminin and type IV collagen are accurate markers of histologically severe alcoholic hepatitis in patients with cirrhosis. J Hepatol 2000; 32: 412–418. 35. Annoni G, Colombo M, Cantaluppi MC, Khlat B, Lampertico P, Rojkind M. Serum type III procollagen peptide and laminin (Lam-P1) detect alcoholic hepatitis in chronic alcohol abusers. Hepatology 1989; 9: 693–697. 36. Nojgaard C, Johansen JS, Christensen E, Skovgaard LT, Price PA, Becker U. Serum levels of YKL-40 and PIIINP as prognostic markers in patients with alcoholic liver disease. J Hepatol 2003;39:179–186. 37. Chossegros P. Extracellular matrix serum markers (ECMSM) in alcoholic liver disease. J Hepatol 1995; 22: 96–99. 38. Vergani C, Trovato G, Delu A, Pietrogrande M, Dioguardi N. Serum total lipids, lipoprotein cholesterol, and apolipoprotein A in acute viral hepatitis and chronic liver disease. J Clin Pathol 1978; 31: 772–778. 39. Tada N, Nestel PJ, Fidge N, Campbell G. Abnormal apolipoprotein composition in alcoholic hepatitis. Biochim Biophys Acta 1981; 664: 207–220. 40. Grimbert S, Trinchet JC,HartmannDJ,Munz C, GarnierM,Mal F, et al. Comparison of six potential serum markers of hepatic fibrosis in alcoholic disease of the liver.Gastroenterol Clin Biol 1993;17:570–577. 41. Coetzee GA, Strachan AF, van der Westhuyzen DR, Hoppe HC, Jeenah MS, de Beer FC. Serum amyloid A-containing human high density lipoprotein 3. Density, size, and apolipoprotein composition. J Biol Chem 1986;261:9644–9651. 42. Shephard EG, de Beer FC, de Beer MC, Jeenah MS, Coetzee GA, van der Westhuyzen DR. Neutrophil association and degradation of normal and acute-phase high-density lipoprotein 3. Biochem J 1987; 248:919–926. 43. Blackburn Jr WD, Dohlman JG, Venkatachalapathi YV, Pillion DJ, Koopman WJ, Segrest JP, et al. Apolipoprotein A-I decreases neutrophil degranulation and superoxide production. J Lipid Res 1991; 32: 1911–1918. 44. Park CT, Wright SD. Plasma lipopolysaccharide-binding protein is found associated with a particle containing apolipoprotein A-I, phospholipid, and factor H-related proteins. J Biol Chem 1996;271: 18054–18060. 45. Furlaneto CJ, Ribeiro FP, Hatanaka E, Souza GM, Cassatella MA, Campa A. Apolipoproteins A-I and A-II downregulate neutrophil functions. Lipids 2002;37:925–928. 46. Cabana VG, Feng N, Reardon CA, Lukens J, Webb NR, de Beer FC, et al. Influence of apoA-I and apoE on the formation of serum amyloid A-containing lipoproteins in vivo and in vitro. J Lipid Res 2004; 45: 317–325. 47. He R, Sang H, Ye RD. Serum amyloid A induces IL-8 secretion through a G protein-coupled receptor, FPRL1/LXA4R. Blood 2003; 101:1572–1581.

Version 1 – January 2007
44
48. Cogny A, Paul JL, Atger V, Soni T, Moatti N. Structural changes of high-density-lipoprotein apolipoproteins following incubation with human polymorphonuclear cells. Eur J Biochem 1994; 222: 965–973. 49. Bergt C, Marsche G, Panzenboeck U, Heinecke JW, Malle E, Sattler W. Human neutrophils employ the myeloperoxidase/hydrogen peroxide/chloride system to oxidatively damage apolipoprotein A-I. Eur J Biochem 2001; 268: 3523–3531. 50. Moudry R, Spycher MO, Doran JE. Reconstituted high density lipoprotein modulates adherence of polymorphonuclear leukocytes to human endothelial cells. Shock 1997;7:175–181. 51. Badolato R, Wang JM, Stornello SL, Ponzi AN, Duse M, Musso T. Serum amyloid A is an activator of PMN antimicrobial functions: induction of degranulation, phagocytosis, and enhancement of anti- Candida activity. J Leukoc Biol 2000; 67: 381–386. 52. La Haute Autorité de Santé (HAS) in France – The HAS recommandations for the management of the chronic hepatitis C using non-invasive biomarkers. AFEF Oct. 2006 53. Munteanu M, Messous D, Thabut D, Imbert-Bismut F, Jouys M, Massard J, Piton A, Bonyhay L, Ratziu V, Hainque B, Poynard T. Intra-individual fasting versus postprandial variation of biochemical markers of liver fibrosis (FibroTest) and activity (ActiTest). Comp Hep. 2004; 23: 3. 54. Messous D, Munteanu M, Morra R, Piton A, Poynard T, Hainque B, Imbert-Bismut F. Time impact of serum storage temperature on stability of important liver enzymes and proteins, and on FibroTest-ActiTest results. Clinica Chimica Acta. 2005; 335: 400. 55. Poynard, T, Halfon P, Castera L, Munteanu M, Imbert Bismut F, Ratziu V, Bourliere M, de Ledinghen V, FibroPaca study group. Prevalence of fibrosis stages is a major factor of variability when assessing the area under the ROC curves (AUROC) in the diagnostic evaluation of liver fibrosis markers. Gastroenterol Clin Biol. 2006; 30: 1039 (Abstract) 56. Poynard T, Imbert-Bismut F, Ratziu V, Chevret S, Jardel C, Moussalli J, Messous D, Degos F. Biochemical markers of liver fibrosis in patients infected by Hepatitis C Virus: Longitudinal validation in a randomized trial. J Viral Hep. 2002; 9: 128-33. 57. Myers RP, de Torres M, Imbert-Bismut F, Ratziu V, Charlotte F, Poynard T. Biochemical markers of fibrosis in patients with chronic hepatitis C: a comparison with prothrombin time, platelet count and the age-platelet index. Dig Dis Sci 2003; 48: 146-53. 58. Rossi E, Adams L, Prins A, Bulsara M, De Boer B, Garas G, MacQuillan G, Speers D, Jeffrey G. Validation of the FibroTest Biochemical Markers Score in Assessing Liver Fibrosis in Hepatitis C Patients. Clin. Chem. 2003; 49: 450-454. [Corresponding previously published abstract: Adams L, Rossi E, DeBoer B, Speers D, Macquillan G, Garas G, Jeffrey G. Use of FibroTest to predict liver fibrosis in hepatitis C: a replacement for liver biopsy? Gastroenterology 2002; 122: 1615A. (Abstract)] 59. Myers RP, Benhamou Y, Imbert-Bismut F, Thibault V, Bochet M, Charlotte F, Ratziu V, Bricaire F, Katlama C, Poynard T. Serum biochemical markers accurately predict liver fibrosis in HIV and hepatitis C virus-coinfected patients. AIDS 2003; 17: 721-25. 60. Poynard T, McHutchison J, Manns M, Myers RP, Albrecht J. Biochemical surrogate markers of liver fibrosis and activity in a randomized trial of peginterferon alfa-2b and ribavirin. Hepatology. 2003; 38: 481-92. 61. Halfon P, Bourliere M, Deydier R, Portal. I, Renou R, Bertrand J, Trana A, Rosenthal A, Rotily M, Sattonet A. Independent prospective multicenter validation of biochemical markers (FibroTest-ActiTest) for the prediction of liver fibrosis and activity in patients with chronic hepatitis C. Am J Gastroenterol. 2006; 101: 547–555.

Version 1 – January 2007
45
62. Callewaert N, Van Vlierberghe H, Van Hecke A, Laroy W, Delanghe J, Contreras R. Noninvasive diagnosis of liver cirrhosis using DNA sequencer-based total serum protein glycomics. Nat. Med. 2004; 10: 1-6. 63. Thabut D, Trabut JB, Massard J, Rudler M, Munteanu M, Messous D, Poynard T. Non-invasive diagnosis of large oesophageal varices with FibroTest in patients with cirrhosis: a preliminary retrospective study. Liver Int. 2006;26:271-8 64. Sène D, Limal N, Messous D, Ghillani-Dalbin P, Charlotte F, Halfon P, Thiollière JM, Piette J-C, Imbert-Bismut F, Poynard T, Cacoub P. Biochemical markers of liver fibrosis and activity as non invasive alternatives to liver biopsy in patients with chronic hepatitis C and mixed cryoglobulinemia vasculitis. Clin Biochem. 2006; 39: 715-21. 65. Varaut A, Fontaine H, Serpaggi J, Verkarre V, Vallet-Pichard A, Nalpas B, Imbert Bismuth F, Lebray P, Pol S. Diagnostic accuracy of the FibroTest in hemodialysis and renal transplant patients with chronic hepatitis C virus. Transplantation. 2005; 80: 1550-5. 66. Castéra L, Vergniol J, Foucher J, Le Bail B, Chanteloup E, Haaser M, Darriet M, Couzigou P, De Lédinghen V. Prospective comparison of transient elastography, FibroTest, APRI, and liver biopsy for the assessment of fibrosis in chronic hepatitis C. Gastroenterology. 2005; 128: 343-50. 67. Colletta C, Smirne C, Fabris C, Toniutto P, Rapetti R, Minisini R, Pirisi M. Value of two noninvasive methods to detect progression of fibrosis among HCV carriers with normal aminotransferases. Hepatology. 2005; 42: 838-45. 68. Calès P, Oberti F, Michalak S, Hubert-Fouchard I, Rousselet MC, Konate A, Gallois Y, Ternisien C, Chevailler A, Lunel F. A novel panel of blood markers to assess the degree of liver fibrosis. Hepatology. 2005; 42: 1373-81. 69. Wilson LE, Torbenson M, Astemborski J, Faruki H, Spoler C, Rai R, Mehta S, Kirk GD, Nelson K, Afdhal N, Thomas DL. Progression of liver fibrosis among injection drug users with chronic hepatitis C. Hepatology. 2006; 43: 788-95. 70. McCullough AJ: The clinical features, diagnosis and natural history of nonalcoholic fatty liver disease. Clin Liver Dis 2004, 8:521-33. 71. Clark JM, Brancati FL, Diehl AM: The prevalence and etiology of elevated aminotransferase levels in the United States. Am J Gastroenterol 2003, 98:960-967. 72. Levitsky J, Mailliard ME: Diagnosis and therapy of alcoholic liver disease. Semin Liver Dis 2004, 24:233-47. 73. El-Serag HB, Tran T, Everhart JE: Diabetes increases the risk of chronic liver disease and hepatocellular carcinoma. Gastroenterology 2004, 126:460-468. 74. Dam-Larsen S, Franzmann M, Andersen IB, Christoffersen P, Jensen LB, Sorensen TI, Becker U, Bendtsen F: Long term prognosis of fatty liver: risk of chronic liver disease and death. Gut 2004, 53:750-755. 75. Bravo AA, Sheth SG, Chopra S: Liver biopsy. N Engl J Med 2001, 344:495-500. 76. Sanyal AJ: AGA technical review on nonalcoholic fatty liver disease. Gastroenterology 2002, 123:1705-25. 77. Angulo P: Nonalcoholic fatty liver disease. N Engl J Med 2002, 346:1221-31. 78. Charlton M: Nonalcoholic fatty liver disease: a review of current understanding and future impact. Clin Gastroenterol Hepatol 2004, 2:1048-58. 79. Bugianesi E, Leone N, Vanni E, Marchesini G, Brunello F, Carucci P, Musso A, De Paolis P, Capussotti L, Salizzoni M, Rizzetto M: Expanding the natural history of nonalcoholic steatohepatitis: From cryptogenic cirrhosis to hepatocellular carcinoma. Gastroenterology 2002, 123:134-140.

Version 1 – January 2007
46
80. Ratziu V, Bonyhay L, Di Martino V, Charlotte F, Cavallaro L, Sayegh-Tainturier MH, Giral P, Grimaldi A, Opolon P, Poynard T: Survival, liver failure, and hepatocellular carcinoma in obesity-related cryptogenic cirrhosis. Hepatology 2002, 35:1485-93. 81. Ratziu V, Giral P, Charlotte F, Bruckert E, Thibault V, Theodorou I, Khalil L, Turpin G, Opolon P, Poynard T: Liver fibrosis in overweight patients. Gastroenterology 2000, 118:1117-1123. 82. Talwalkar JA: Motion – all patients with NASH need to have a liver biopsy: arguments for the motion. Can J Gastroenterol 2002, 16:718-21. 83. Diehl AM. Liver disease in alcohol abusers: clinical perspective. Alcohol 2002; 27: 7–11. 84. Maher JJ. Alcoholic steatosis and steatohepatitis. Semin Gastrointest Dis 2002; 13: 31–39. 85. Chikritzhs TN, Jonas HA, Stockwell TR, Heale PF, Dietze PM. Mortality and life-years lost due to alcohol: a comparison of acute and chronic causes. Med J Aust 2001; 174: 281–284. 86. Menon KV, Gores GJ, Shah VH. Pathogenesis, diagnosis, and treatment of alcoholic liver disease. Mayo Clin Proc 2001; 76: 1021–1029. 87. Tome S, Lucey MR. Current management of alcoholic liver disease. Aliment Pharmacol Ther 2004; 19: 707–714. 88. Orrego H, Blake JE, Blendis LM, Medline A. Prognosis of alcoholic cirrhosis in the presence and absence of alcoholic hepatitis. Gastroenterology 1987;92:208–214. 89. Mathurin P, Duchatelle V, Ramond MJ, Degott C, Bedossa P, Erlinger S, et al. Survival and prognostic factors in patients with severe alcoholic hepatitis treated with prednisolone. Gastroenterology 1996; 110:1847–1853. 90. Mathurin P, Mendenhall CL, Carithers Jr RL, Raymond MJ, Maddrey WC, Garstide P, et al. Corticosteroids improve short-term survival in patients with severe alcoholic hepatitis (AH): individual data analysis of the last three randomized placebo controlled double blind trials of corticosteroids in severe AH. J Hepatol 2002; 36: 480–487. 91. Menon KV, Gores GJ, Shah VH. Pathogenesis, diagnosis, and treatment of alcoholic liver disease. Mayo Clin Proc 2001;76: 1021–1029. 92. Ratziu V, Giral P, Munteanu M, Messous D, Mercadier A, Bernard M, Morra R, Imbert-Bismut F, Bruckert E, Poynard T. Screening for liver disease using noninvasive biomarkers (FibroTest-SteatoTest-NashTest -FIBROSURE™) in patients with hyperlipidemia. Aliment Pharmacol Ther. 2007; 25: 207-218 Bruckert E, Giral P, Ratziu V, Poynard T, Chapman MJ, Opolon P, Turpin G. A constellation of cardiovascular risk factors is associated with hepatic enzyme elevation in hyperlipidemic patients. Metabolism 51:1071-1076, 2002 93. Poynard T, Munteanu M, Imbert-Bismut F, Charlotte F, Messous D, Dominique Thabut D, Thibaut V, Benhamou Y, Ratziu V. Prospective analysis of discordant results between biochemical markers and biopsy in patients with chronic hepatitis C. Clin Chem 50:1344-1355, 2004 94. Ngo Y, Munteanu M, Messous D, Charlotte F, Imbert-Bismut F, Thabut D, Lebray P, Thibault V, Benhamou Y, Moussalli J, Ratziu V, Poynard T. A prospective analysis of prognostic value of biomarkers (FibroTest) in patients with chronic hepatitis C (CHC) Clin Chem. 2006; 52: 1887-96. 95. Jacqueminet S, Morra R, Munteanu M, Devers L, Messous D, Bernard M, Jeanne S, Sachon C, Heurtier A, Bonnefont-Rousselot D, Mercadier A, Imbert Bismut F, Ratziu V, Grimaldi A, Poynard T. Efficacy of screening for advanced fibrosis (AF) in diabetic patients (DB) using non-invasive biomarkers: FibroTest-FibroMAX and Fibroscan. J Hepatol. 2006; 44 : S260 (Abstract)


![Investigator’s Brochure - Usona Institute · 2020. 8. 31. · Investigator’s Brochure PRODUCT: Psilocybin, [3-[2-(dimethylamino)ethyl]-1H-indol-4-yl] dihydrogen phosphate IND#:](https://img.dokumen.tips/doc/110x75/60bf754598371c2bf443a3ec/investigatoras-brochure-usona-institute-2020-8-31-investigatoras-brochure.jpg)