Embed Size (px)
Citation preview

Institute of Animal Nutrition and Nutritional Physiology
(Director: Prof. Dr. K. Eder)
of the
Faculty of Agricultural Sciences, Nutritional Sciences and Environmental Management
of
Justus-Liebig-University Giessen
(Dean: Prof. Dr. Dr.-Ing. Peter Kämpfer)
“Investigations on the effect of nicotinic acid supplementation on muscle fiber
distribution and muscle metabolic phenotype in pig and sheep”
Dissertation
to obtain the academic degree of
Doctor of Agriculture (Dr. agr.)
Submitted by
Muckta Khan (MS in Animal Science)
Born on 04.12.1979 in Tangail, Bangladesh
Supervisors: Prof. Dr. K. Eder
Prof. Dr. F. C. Mooren
Giessen 2013

Table of contents
I
TABLE OF CONTENTS
List of tables …………………………………………………………………..... III
List of figures …………………………………………………………………... III
List of abbreviations …………………………………………………………… IV
1 INTRODUCTIONS ……………………………………………………………. 1
1.1 Background ……………………………………………………………... 1
1.2 Niacin ……………………………………………………………………. 4
1.2.1 Nutritional function of niacin ……………………………………. 4
1.2.2 Pharmacological use of nicotinic acid …………………………... 5
1.2.3 Nicotinic acid receptor ………………………………………… 6
1.2.4 Mechanisms of antidyslipidemic effects of nicotinic acid-
prevailing hypothesis …………………………………………….
6
1.3 Skeletal muscle ………………………………………………………….. 7
1.3.1 Skeletal muscle fiber types ……………………………………… 8
1.3.2 Skeletal muscle plasticity and molecular mechanism of fiber type
switching …………………………………………………………
10
1.4 Genes involved in fatty acid catabolism pathways, thermogenesis and
angiogenesis ……………………………………………………………...
10
2 AIMS AND HYPOTHESES …………………………………………………... 12
3 ORIGINAL WORKS ………………………………………………………...... 14
3.1 Study 1: Niacin supplementation increases the number of oxidative
type I fibers in skeletal muscle of growing pigs ……………………….
15
3.2 Study 2: Niacin supplementation induces type II to type I muscle
fiber transition in skeletal muscle of sheep …………………………….
23
4 DISCUSSION ………………………………………………………………….. 33
5 SUMMARY ……………………………………………………………………. 41
6 ZUSAMMENFASSUNG ……………………………………………………… 44
7 REFERENCES ………………………………………………………………… 47

Table of contents
II
Enclosures:
Erklärung
Curriculum vitae
Acknowledgements

Table of contents
III
LIST OF TABLES
Table Nr. Title
1 Chemical name and structure of vitamers of niacin …………….. 4
2 Effects of nicotinic acid (>1.5 g / day) on plasma lipid profile at
a glance ……………………………………………………………..
6
3 Properties of different types of skeletal muscle fibers …………... 9
LIST OF FIGURES
Figure Nr. Title
1 Structure of skeletal muscle ………………………………………. 8
2 Prevailing mechanisms underlying the antidyslipidemic effects
of nicotinic acid …………………………………………………….
34
3 Diagrammatical picture of potential mechanisms underlying the
lipid- lowering effect of nicotinic acid …………………………….
35

Abbreviations
IV
LIST OF ABBREVIATIONS ANOVA Analysis of variance
ATP Adenosine triphosphate
BHBA β-hydroxybutyrate
CACT Carnitine acylcarnitine translocase
cDNA Complementary deoxyribonucleic acid
CETP Cholesterol ester transfer protein
CoA Coenzyme A
COX Cytochrome c oxidase
CPT Carnitine palmitoyltransferase
FATP Fatty acid transport protein
G Gastrocnemius
GPR G protein-coupled receptor
G protein Guanine nucleotide binding protein
HCA Hydroxy-carboxilic acid
HDL High-density lipoprotein
HM Human
HSL Hormone-sensitive lipase
LD Longissimus dorsi
LDL Low-density lipoprotein
Lp(a) Lipoprotein (a)
M. Muscle
MACP Mitochondrial anion carrier proteins
MHC Myosin heavy chain
MLC Myosin light chains
mRNA Messenger Ribonucleic acid
MYH Myosin heavy chain encoded gene
NA Nicotinic acid
NAD Nicotinamide adenine dinucleotide

Abbreviations
V
NADP Nicotinamide adenine dinucleotide phosphate
NAM Nicotinamide
NEB Negative energy balance
OCTN Novel organic cation transporter
PDE-3B Phosphodiesterase-3B
PGC Peroxisome proliferator-activated receptor-gamma coactivator
PKA Protein kinase A
PPAR Peroxisome proliferator-activated receptor
PUMA-G Protein upregulated in macrophages by interferon-λ
QF Quadriceps femoris
qPCR Quantitative polymerase chain reaction
RNA Ribonucleic acid
SD Standard deviations
SDHA Succinate dehydrogenase subunit A
SLC Solute carrier
SM Semimembranosus
ST Semitendinosus
TAG Triacylglycerols
TCA Tricarboxylic acid
UCP Uncoupling proteins
VEGF Vascular endothelial growth factor
VLDL Very low-density lipoprotein

Introduction
1
1. INTRODUCTION
1.1 Background
For more than five decades nicotinic acid (NA) has been used as a lipid-lowering drug (Karpe
and Frayn, 2004; Bodor and Offermanns, 2008). At pharmacological doses, NA shows
remarkable lipid-lowering activities, particularly on triacylglycerols (TAG), but also on total
cholesterol, low-density lipoprotein (LDL) cholesterol, very low-density lipoprotein (VLDL)
cholesterol and, interestingly, NA increases high-density lipoprotein (HDL) cholesterol
(Carlson, 2005; Gille et al., 2008; Kamanna and Kashyap, 2008) but to date, the underlying
lipid-lowering mechanism of NA is only partially understood. However, the inhibition of
lipolysis by NA in adipocytes through binding with the NA receptor G protein-coupled
receptor 109A (GPR109A) causes reduction of plasma free fatty acids (FFA, also called non-
esterified fatty acids, NEFA), which are substrates for hepatic TAG synthesis and VLDL
formation and synthesis, is endorsed as the basic mechanism for the lipid-lowering effects of
NA (Gille et al., 2008; Kamanna and Kashyap, 2008). But this classic view of lipid-lowering
mechanism of NA has been put into question because the circulating FFA level even become
increased during long-term (at least 2 weeks) NA treatment due to a profound rebound on
lipolysis even though its lipid-lowering effect keeps on (Choi et al., 2011). Moreover, very
recently Lauring et al. (2012) throw a challenge to this classic view by revealing that
GPR109A is not the major molecular target responsible for NA lipid efficacy. In this
circumstance, the explanation of the lipid-lowering effect of NA by the reduced FFAs
delivery to the liver is obscure.
Skeletal muscle is the major tissue for whole body glucose and fatty acid metabolism (Wang
et al., 2004) and recently it has been found that NA has widespread effects on gene expression
in major other tissues of lipid metabolism than adipose tissue, such as skeletal muscle (Choi et
al., 2011), raising the possibility of another underlying explanation of lipid-lowering effect of
NA. Skeletal muscle fibers are generally classified as type I (oxidative/slow) and type II
(glycolytic/fast) fibers. They display marked differences in respect to contraction, metabolism,
and susceptibility to fatigue. Type I fibers are mitochondria rich and mainly use oxidative
metabolism for energy production, on the other hand fast-twitch glycolytic type II fibers
utilize glucose for energy production (Pette and Staron, 1990; Olson and Williams, 2000).
Adult skeletal muscle shows marked plasticity and can undergo transformation between
different fiber types in response to physical activity, such as exercise or modulation of
motoneuron activity, mechanical loading/unloading or obesity (Pette, 1998; Olson and

Introduction
2
Williams, 2000; Hood, 2001; Cassano et al., 2006; Fujita et al., 2012). Notably, it has been
shown in humans (Watt et al., 2004) and recently in rats (Ringseis et al., 2013) that high dose
of NA induces the expression of two transcription factors, peroxisome proliferator-activated
receptor (PPAR) δ and PPARγ coactivator-1α (PGC-1α) in skeletal muscle. Both of these
transcription factors are key regulators of muscle fiber composition and the muscle’s
metabolic phenotype because they control genes involved in muscle fiber switching, fatty acid
utilization, oxidative phosphorylation, mitochondrial biogenesis and function (Wang et al.,
2004; Schuler et al., 2006) and angiogenesis (Chinsomboon et al., 2009). Based on the
observation that NA up-regulates key regulators (PPARδ and PGC-1α) of fiber switching in
skeletal muscle, it has been already investigated whether NA supplementation can inhibit the
obesity-induced muscle fiber transition from oxidative type I to glycolytic type II and
increases the number of type I fibers in skeletal muscle of obese Zucker rats (Ringseis et al.,
2013). Indeed, in this study, it was found that NA favored muscle fiber transition from type II
to type I in obese Zucker rats (Ringseis et al., 2013). Moreover, it was also found that the
expression of genes involved in fatty acid transport, mitochondrial fatty acid import and
oxidation, oxidative phosphorylation and angiogenesis and key regulators of muscle fiber
switching PPARδ, PGC-1α and PGC-1β in skeletal muscle were elevated by NA treatment
(Ringseis et al., 2013). PGC-1β (another member of PGC-1 family) has been less extensively
studied than PGC-1α, but recently it has been found that PGC-1β is a potential mediator of the
development of oxidative sub-type IIX fibers in skeletal muscle of mice (Arany et al., 2007).
PGC-1β also contributes to the regulation of contractile and metabolic phenotype of the
skeletal muscle (Mortensen et al., 2006). It was also revealed that PGC-1β in skeletal muscle
increases mitochondrial biogenesis, expression of genes encoding mitochondrial proteins and
mitochondrial activity (Arany, 2008).
However, there is no investigation, to our knowledge, whether NA treatment also causes type
II to type I muscle fiber switching and increases the type I fiber content of skeletal muscles in
healthy non-ruminant and ruminant farm animals. Thus, on the base of these literature
findings it has been hypothesized in the present thesis that NA treatment causes similar
effects, namely transition of type II fiber to type I fiber in pig as a model of non-ruminant
(study 1) and in sheep as a model of ruminant (study 2).
Contextual talk of study 1: According to Liaubet et al. (2011), muscle fiber characteristics
play a key role in meat quality of farm animals. Fiber type, fiber area, oxidative and glycolytic
capacity, glycogen and lipid contents of muscle may strongly affect the energy metabolism of

Introduction
3
live animals as well as the postmortem conversion of muscle to meat, thus affecting ultimate
quality of meat (Karlsson et al., 1999; Ryu and Kim, 2005; Choe et al., 2008; Choi and Kim,
2009). Muscles with a higher percentage of type I fibers and lower percentage of type IIb
fibers showing lower lightness and drip loss of meat (Ryu and Kim, 2005; Choe et al., 2008;
Ryu et al., 2008). Pre-slaughter metabolic response that takes place in different fiber types is
an important factor for post-mortem changes and meat quality of meat producing animals
(Karlsson et al., 1999), since oxidative muscles with a high percentage of type I fibers have a
lower glycolytic potential (Monin et al., 1987; Fernandez et al., 1994) a darker color (Warner
et al., 1993; Brewer et al., 2001) and a higher ultimate pH (Monin et al., 1987; Warner et al.,
1993). Additionally, muscles with higher amount of oxidative fibers have a tendency to
develop dark, firm and dry pork in response to intense physical activity and/or high
psychological stress levels associated to preslaughter handling. Conversely, muscles with
higher amount of glycolytic fibers may develop pale, soft, and exudative pork (Hambrecht et
al., 2005). Therefore, a NA-induced change in the muscle’s fiber type distribution (type II to
type I muscle fiber switching) may influence meat quality of pigs.
Contextual talk of study 2: Ketosis (Hyperketonemia) and fatty liver (Hepatic lipidosis) are
two common diseases, which are characterized by altered energy metabolism of high-yielding
dairy cows (Block et al., 2001; Xu and Wang, 2008). During transition period (defined as 3
weeks prepartum until 3 weeks postpartum) of high-yielding dairy cows, a negative energy
balance (NEB) is observed because of the increased requirement of energy for high milk
production on the one side and a depression in the energy intake on the other side (Brockman,
1979; Xu et al., 2008; Pescara et al., 2010). In severe NEB animals start to mobilize body fat
(adipose tissue) and release excessive amounts of FFAs which are quickly circulated to the
liver, converted to acetyl-CoA by β-oxidation, overwhelming liver’s ability to handle these
excessive amount of acetyl-CoA either through tricarboxylic acid (TCA) cycle or through
conversion to TAG and release in the form of lipoproteins. Then these huge volumes of
acetyl-CoA are converted to ketone bodies, resulting in ketosis, or FFAs are deposited as
TAG in hepatocytes resulting in fatty liver (Grummer, 1993; Vazquez-Añon et al., 1994).
Since skeletal muscle, particularly type I fibers significantly contributes to whole body fatty
acid utilization, an increased capacity of oxidative type I fiber for fatty acid utilization is
expected to be useful during conditions where fatty acids are available at increased levels,
such as in ketosis or fatty liver of high-yielding cows.

Introduction
4
1.2 Niacin
Niacin or vitamin B3 is a water soluble vitamin of the vitamin B complex, which is a vital
element of human and animal nutrition. It has two vitamers called NA (pyridine 3-carboxylic
acid) and nicotinamide (NAM, pyridine 3-carboxylic acid amide), both are biologically active
forms of niacin, which are very stable in light, heat and alkali, and therefore also stable in
feed (Pond et al., 2005). In addition to feed as a source of niacin, almost all species are
capable to synthesise niacin from tryptophan (Pond et al., 2005; McDowell, 2005) and
quinolinate (Henderson, 1983). In many countries, especially in North America, the term
‘niacin’ means exclusively for NA (Harmeyer and Kollenkirchen, 1989; Bender, 2003). Thus
causes some confusion between the generic and specific terms. NA acts in two aspects, one is
as ‘vitamin’, effective in milligram doses and the other is as ‘lipid drug’, effective in gram
doses; but interestingly although NA and NAM, chemically quite alike, and nutritionally
equivalent, NAM has no plasma lipid-lowering property (Parsons and Flinn, 1959; DiPalma
and Thayer, 1991; Carlson, 2005; Lukasova, et al., 2011). The chemical name and structure of
both forms of niacin are presented in Table 1.
Table 1: Chemical name and structure of vitamers of niacin
Nicotinic acid Nicotinamide
Chemical name Pyridine 3-carboxylic acid
Pyridine 3-carboxylic acid amide
Chemical formula C6H5NO2
C6H6N2O
Structure
(Adapted from Bender, 2003)
1.2.1 Nutritional function of niacin
Both vitamers of niacin (NA and NAM) are the direct precursors of two important coenzymes
nicotinamide adenine dinucleotide (NAD) and nicotinamide adenine dinucleotide phosphate
(NADP), which have great importance in lipid, carbohydrate and protein metabolism (Bender,
2003; Pond et al., 2005). NAD and NADP, synthesized from niacin are involved as proton

Introduction
5
and electron carriers in a wide variety of energy-yielding oxidation and reduction reactions,
which occur in animal and human tissues (Bender, 2003). Almost all cellular metabolisms are
involved NAD/NADH or NADP/NADPH linked schemes, therefore, cellular functions as
well as life itself would be impaired for the deficiency of niacin, and for that niacin is a
critical nutrient for human and animal body (Henderson, 1983).
1.2.2 Pharmacological use of nicotinic acid
NA, but not NAM, has been used for decades as a lipid-lowering drug (Hotz, 1983; Knopp,
1999; Karpe and Frayn, 2004; Bodor and Offermanns, 2008). It is the earliest lipid-regulating
drug used in the treatment of lipid disorders and atherosclerotic coronary heart disease
(Kamanna et al., 2009). In the landmark study, Altschul et al. (1955) reported, that NA in
gram doses lowered plasma cholesterol in normal as well as hypercholesterolemic subjects.
This milestone finding was consequently confirmed in numerous studies and NA has been
gained the name ‘the broad-spectrum lipid drug’ (Carlson, 1990). At pharmacological
doses, NA decreases TAG, total cholesterol, VLDL, LDL, and lipoprotein(a) [Lp(a)] as well
as increases HDL levels in blood plasma (Meyers et al., 2004; Carlson, 2005; Gille et al.,
2008) (Table 2). The anti-lipolytic effect of NA was first found in rabbits (Altschul and
Herman, 1954), later in mice (Carlson and Hanngren, 1964), goats (Schultz et al., 1968),
sheep (Nye and Buchanan, 1969) and cows (Schultz, 1971). NA is also known as an
antiketogenic substance (Flachowsky, 1993), because the direct effect of NA on ketone bodies
(β-hydoxybutyrate, BHBA) in dairy cows has been broadly observed (Waterman et al., 1972;
Fronk and Schultz, 1979; Dufva et al., 1983; Jaster et al., 1983; Erickson et al., 1992; Al-
Abbasy, 2013). The antiketogenic effect of NA is based on the antilipolytic action of the
substrates (Waterman and Schultz, 1973; Pires and Grummer, 2007; Al-Abbasy, 2013). In
dairy cows, NA can decrease the plasma level of FFA and BHBA, resulting in reduced
prevalence of metabolic disorders, such as ketosis and fatty liver by inhibiting TAG lipolysis
(Schwab et al., 2005; Pires and Grummer, 2007). In humans, high doses of NA (3 g/day)
decrease total plasma levels of cholesterol by almost 10% in healthy volunteers and by more
than 20% in hypercholesterolemic patients (Altschul et al., 1955; Parsons and Flinn, 1959).
NAM has no effect on the plasma lipid or lipoprotein concentration, undoubtedly indicating
that the antilipolytic effect of NA is distinct to its role as a vitamin.

Introduction
6
Table 2: Effects of nicotinic acid (>1.5 g / day) on plasma lipid profile at a glance
VLDL (25–40%) ↓
LDL (6–22%) ↓
HDL (18–35%) ↑
Total cholesterol (4–16%) ↓
TAG (21–44%) ↓
Lp(a) (16–36%) ↓
(Addapted from review Gille et al., 2008)
1.2.3 Nicotinic acid receptor
About 50 years ago the rapid uptake, preferential distribution and accumulation of NA in
adipose tissue was described by Carlson and Hanngren (1964). After that, specific binding
sites for NA on plasma membranes of adipocytes and spleen cells were demonstrated
(Lorenzen et al., 2001). In 2003, three independent research groups identified a G protein-
coupled receptor as a specific and high affinity receptor for NA which mediates the
antilipolytic effects of NA (Soga et al., 2003; Tunaru et al., 2003; Wise et al., 2003). The
receptor was termed as GPR109A (HM74A in human and PUMA-G in mice, no specific term
for sheep or pig has been found) and is expressed mainly in adipocytes and immune cells. In
line with bioinformatics data NA receptor belongs to a subfamily of G protein-coupled
receptors that includes GPR109A and GPR81, both of which are expressed in humans and in
rodent species. A third member of this receptor family, GPR109B (HM74), has also been
found (in humans, but not in rodent species) as a low-affinity receptor for NA (Soga et al.,
2003; Wise et al., 2003). GPR81, GPR109A and GPR109B have recently been renamed
hydroxy-carboxylic acid receptor 1, 2 and 3 (HCA1, HCA2 and HCA3), respectively
(Offermanns et al., 2011). The endogenous ligand for GPR109A is BHBA (Gille et al., 2008).
1.2.4 Mechanisms of antidyslipidemic effects of nicotinic acid-prevailing hypothesis
Although NA has the extraordinary capability to decrease TAG, VLDL cholesterol, LDL
cholesterol and Lp(a), as well as to increase HDL cholesterol levels and thus improves the
total plasma lipid profile, the underlying mechanisms by how NA exerts its antidyslipidemic
effect have remained unclear (Gille et al., 2008; Kamanna et al., 2009; Chapman et al., 2010;
Lukasova et al., 2011; Lauring et al., 2012; Offermanns, 2012). One of the well-established
classic views of action of NA is “FFA hypothesis” (Lauring et al., 2012). According to this
classic view, the antilipolytic effect in adipocytes causing reduction of plasma FFAs

Introduction
7
concentrations, which modulates hepatic TAG synthesis and VLDL formation and synthesis,
and subsequently results in decrease plasma levels of LDL cholesterol (Carlson and
Hanngren, 1964; Wang et al., 2001; Gille et al., 2008; Kamanna and Kashyap, 2008). NA
binds to the GPR109A receptor in adipose tissue and activation of GPR109A by NA leads to
inhibition of adenylyl cyclase activity and, consequently decreases cellular cyclic adenosine
monophosphate (cAMP) levels. Decreased cAMP in adipocytes leads to an inactivation of
protein kinase A (PKA), and accordingly decreases phosphorylation of hormone-sensitive
lipase (HSL) and perilipin, which are obligatory for TAG hydrolysis. Reducing these enzyme
activities leads to decrease TAG lipolysis, consequently reduce FFA production. The
decreased FFA levels, induced by NA, resulted in a substrate shortage for hepatic TAG
synthesis. Accordingly, less TAG and VLDL are produced in liver, and thus, plasma levels of
TAG and VLDL as well as LDL are dropped (Gille et al., 2008; Kamanna and Kashyap,
2008). The mechanism by which NA increases the plasma HDL cholesterol is less clear, but
has been shown to require the presence of cholesterol ester transfer protein (CETP)
(Hernandez et al., 2007; van der Hoorn et al., 2008). However, this long-standing FFA
hypothesis of NA efficacy has been put into question because the circulating FFA level even
become increased during long-term NA treatment due to a profound rebound on lipolysis even
though its lipid-lowering effect keeps on (Choi et al., 2011). Some other previous studies have
also questioned the FFA hypothesis because of the marked “rebound” or “baseline over-
shoot” of both acute and more chronic dosing of NA (Jin et al., 1997; Wang et al., 2001; de
Grooth et al., 2004; Ganji et al., 2004; Lamon-Fava et al., 2008; Hernandez et al., 2010),
suggesting that the fundamental mechanisms other than anti-lipolysis may be responsible for
lipid efficacy (Wang et al., 2001; Lukasova, et al., 2011).Very recently, Lauring et al. (2012)
provided additional evidence, that is very much contradictory to the prevailing FFA
hypothesis. By using a humanized genetic mouse model and dyslipidemic patients, treated
with NA and GPR109A agonists, Lauring et al. (2012) strongly suggest that GPR109A is not
the major molecular target responsible for NA lipid efficacy and thus the long-standing FFA
hypothesis has been challenged, but they did not investigate the mechanism further. The
underlying mechanism is not discovered, so far.
1.3 Skeletal muscle
In mammals, skeletal muscle constitutes up to 50% of total body mass and thus making it the
largest organ of the body (Ehrenborg and Krook, 2009) which is mainly involved in the

Introduction
8
implementation of voluntary movement. It is also called voluntary muscle because its
activities are usually under conscious regulation. It is also known as striated muscle because it
contains fibers in an arrangement of altering dark and light bands, which create a striated
appearance under the microscope. Skeletal muscles are the major site for carbohydrate and
fatty acid metabolism, and heat generation (Kiens, 2006; Schuler et al., 2006; Houmard,
2008). As it constitutes a large part of the total body mass, by considering the whole volume,
skeletal muscle metabolism affects the metabolic budget of the whole organism (Ehrenborg
and Krook, 2009). The distinctive characteristics of skeletal muscle is its diversify
composition with a large number of different types of muscle fibers (muscle cells), which
differ according to their molecular, contractile and metabolic properties, and thus, can
contribute to a diversity of functional capabilities (Pette and Staron, 2001) (structure of
skeletal muscle Figure 1).
Figure 1 Structure of skeletal muscle (Adapted from URL, 2013)
1.3.1 Skeletal muscle fiber types
The functional unit of skeletal muscle tissue is the muscle fiber (cell), which may extend the
entire length of the muscle (Karlsson et al., 1999). The muscle fibers are multinucleated, long,
cylindrical cells, and composed of myofibrils, which constitute the contractile apparatus of the

Introduction
9
muscle. Skeletal muscle fibers are generally classified into two broad categories: Type I and
Type II fibers. They exhibit clear differences according to their contraction, metabolism and
susceptibility to fatigue capabilities. Type I fibers are mitochondria rich, and also called
oxidative, because these fibers use oxidative metabolism to generate adenosine triphosphate
(ATP). They are also fatigue-resistant or slow twitch fibers, because they take more time for
contraction, again also known as red fibers, because they contain oxygen binding protein
myoglobin. Functionally, type I fibers are used for daily living aerobic activities requiring low
level force production, such as walking, maintaining posture or holding head by neck muscle.
Type II fibers have low level of mitochondria, and are also known as glycolytic, because these
fibers use glycolytic metabolism to generate ATP and are susceptible to fatigue. They are also
known as fast twitch fibers, because the contraction time is fast, again also called white fibers,
because of absence or very low myoglobin content. Functionally, type II fibers are used for
anaerobic activities such as locomotion, racing 400 meters or for short anaerobic high force
producing activities such as sprinting, hurdling, weight lifting, jumping, kicking or biting.
Type II fibers comprise two subtypes, IIa/IIx and IIb depending upon species. The oxidation
and contraction ability of type IIa/IIx place between type I and IIb (Booth and Thomason,
1991; Berchtold et al., 2000; Olson and Williams, 2000; Wang et al., 2004; Schiaffino and
Reggiani 2011). The major characteristics of different types of muscle fibers are summarized
in Table 3.
Table 3: Properties of different types of skeletal muscle fibers
Type I Type IIa/IIx Type IIb
Speed of contraction Slow Fast Very fast
Resistance to fatigue High Intermediate Low
Activity used for Aerobic Long term anaerobic Short term anaerobic
Force production Low High Very high
Metabolic type Oxidative Oxido-glycolytic Glycolytic
Oxidative (aerobic) capacity High Intermediate Low
Glycolytic (anaerobic) capacity Low High High
Mitochondrial density High High/medium Low
Capillary density High Medium/low Low
Myoglobin content High High Low
(Adapted from Lefaucheur and Gerrard, 2000)

Introduction
10
1.3.2 Skeletal muscle plasticity and molecular mechanism of fiber type switching
Skeletal muscle tissue exhibits a unique capacity to undergo adaptive changes in response to
functional demands by changing their phenotypic profiles, leading to a gradual switch from
one fiber type to another, and this process is known as muscle plasticity (Jorquera, et al.,
2013). It shows remarkable plasticity and has the ability to convert between different fibers
types in response to exercise training or modulation of motoneuron activity (Pette and Staron,
1997; Booth and Thomason, 1991; Jarvis et al., 1996; Pette, 1998; Olson and Williams, 2000;
Hood, 2001). Numerous factors, in particular altered neuromuscular activity, mechanical
loading/unloading, circulating factors including different hormones (especially thyroid
hormones) and aging are recognized to affect muscle fiber type composition (Schiaffino and
Reggiani, 2011). The transformation of muscle fiber from fast-to-slow type is likely to be
mediated by a calcium signalling pathway that involves calcineurin, calmodulin-dependent
kinase, and the transcriptional cofactor PGC-1α (Naya et al., 2000; Olson and Williams,
2000; Lin et al., 2002a; Wu et al., 2001; Pette and Staron, 2001).
1.4 Genes involved in fatty acid catabolism pathways, thermogenesis and angiogenesis
The first step of the oxidative pathway is the transport of fatty acids from the cytoplasm into
the mitochondrial matrix. This step is controlled by the carnitine palmitoyltransferase (CPT)
system (McGarry and Brown, 1997). The protein encoded by CPT1B gene is carnitine
palmitoyl- transferase 1B [also known as muscle-type CPT1 (M)] (Price et al., 2003), a
member of the carnitine/choline acetyltransferase family, is the integral rate-controlling
enzyme of the long-chain fatty acid β-oxidation pathway in the mitochondria of muscle fiber.
This enzyme is located on the outer mitochondrial membrane and required for the net
transport of long-chain fatty acetyl-CoAs from the cytoplasm into the mitochondria (McGarry
et al., 1978; Ramsay et al., 2001). Fatty acid transport protein 1 (FATP1), also named solute
carrier family 27 member 1 (SLC27A1), gene encodes a member of a family of fatty acid
transport proteins, which are involved in transport of long-chain fatty acids across the cell
membrane (Martin et al., 2000). Moreover, FATP1 also has a role in mitochondrial fatty acid
oxidation in collaboration with CPT1 (Sebastián et al., 2009). Carnitine-acylcarnitine
translocase (CACT), also known as SLC25A20, embedded in the inner mitochondrial
membrane, is essential for mitochondrial oxidation of long-chain fatty acids (Indiveri et al.,
1997), because this protein catalyzes a mole-to-mole exchange of carnitines and
acylcarnitines, so that the fatty acid moieties can be translocated into the mitochondrial matrix

Introduction
11
(Peluso et al., 2005). Novel organic cation transporter 2 (OCTN2), also named SLC22A5, is
the second member of the OCTN family, positioned within the cell membrane (Wu et al.,
1998; Ohashi et al., 2001). It is a physiologically important Na+ dependent transporter for
carnitine, which is a hydrophilic nutrient essential to carry long-chain fatty acids into
mitochondria for β-oxidation (Tamai et al., 1998; Ohashi et al., 2001). Cytochrome c oxidase
(COX), a terminal enzyme of the respiratory chain of mitochondria, is a key enzyme of
aerobic respiration, meaning a decrease of COX activity decreases ATP production (Villani
and Attardi, 1997; Hosler et al., 2006; Pacelli et al., 2011; Yoshikawa et al., 2011; Hüttemann
et al., 2012). COX4/1, COX5A and COX6A1 are subunits of COX, which are embedded in
the inner mitochondrial membrane and catalyze the transfer of electrons from cytochrome c to
molecular oxygen and contribute to a proton electrochemical gradient across the inner
mitochondrial membrane (Villani et al., 1998; Shoubridge, 2001; Cui et al., 2006). Succinate
dehydrogenase (SDH) is a multimeric enzyme that is bound to the inner membrane of
mitochondria (Oyedotun and Lemire 2004). The SDHA protein is the active subunit of SDH
that performs the conversion of succinate, and it also helps to transfer electrons to the
oxidative phosphorylation pathway. In oxidative phosphorylation, the electrons help to create
an electrical charge that provides energy for the production of the cell's main energy source
ATP (Kantorovich et al., 2010). The uncoupling protein (UCP) is a subfamily of the larger
family of mitochondrial anion carrier proteins (MACP), located in the inner mitochondrial
membrane (Krauss et al., 2005). These anion-carrier proteins transport protons (H+) to the
mitochondrial matrix and in turn dissipate the proton motive force as heat and uncouple the
substrate oxidation from the production of ATP, also referred to as the mitochondrial proton
leak. UCP2 and UCP3 are the member of UCP expressed in several tissues and thought to
participates in thermogenesis (Dulloo and Samec, 2001; Henry et al., 2011). They play a role
in uncoupling oxidative phosphorylation, as a result energy is dissipated in the form of heat,
and maintains energy homeostasis (Krauss et al., 2005; Liu et al., 2013). Type I fibers exhibit
a higher expression of angiogenic factors, such as vascular endothelial growth factor (VEGF).
VEGF subunit A (VEGFA) is one of the most potent inducers of angiogenesis and
vasculogenesis, and is a key regulator of both physiological and pathological angiogenesis. It
causes proliferation, sprouting, migration and tube formation of endothelial cells (Ferrara et
al., 2003). This also contributes to the preferential use of fatty acids by type I fibers, because
angiogenic factors increase capillary density and thereby blood perfusion (Hagberg et al.,
2010).

Aims and hypotheses
12
2. AIMS AND HYPOTHESES
The overall aim for the present PhD studies was, to investigate the effect of NA
administration at a pharmacological dose on fiber type distribution and metabolic phenotype
of different skeletal muscles of pig as a model for non-ruminants and sheep as a model for
ruminants.
Study 1: Khan M, Ringseis R, Mooren FC, Krüger K, Most E, Eder K (2013) Niacin
supplementation increases the number of oxidative type I fibers in skeletal muscle of growing
pigs. BMC Veterinary Research 9:177.
General aim of study 1: In obese Zucker rats, it was observed that NA supplementation
switches muscle fiber from glycolytic type II to oxidative type I in skeletal muscle and these
effects were likely mediated by the induction of key regulators of fiber transition, PGC-1α
and PGC-1β, leading to muscle fiber switching and up-regulation of genes involved in
mitochondrial fatty acid import and oxidation, citrate cycle, oxidative phosphorylation,
mitochondrial biogenesis (Ringseis et al., 2013). In contrast, it has not been known whether
high levels of NA also causes type II to type I muscle fiber switching in metabolically healthy
animals. This question may be of particular interest in farm animals used for meat production,
such as growing pigs because a change in the muscle’s fiber type distribution is expected to
influence meat quality. To address this issue, the aim of the present study was to investigate
whether NA administration also influences fiber distribution and the metabolic phenotype of
different skeletal muscles in pig as a model for non-ruminant farm animals.
Specific hypotheses of study 1: The following three hypotheses were tested in the present
study-
(i) NA supplementation switches muscle fiber from type II (fast-glycolytic) to type I
(slow- oxidative), and thereby induces an oxidative metabolic phenotype of skeletal
muscle in pigs.
(ii) The relative mRNA levels of key regulators of fiber transition, PGC-1α and PGC-1β
are upregulated in NA treated pigs compared to control pigs.
(iii) The relative mRNA levels of genes involved in mitochondrial fatty acid catabolism
(CACT, FATP1, OCTN2), citrate cycle (SDHA), oxidative phosphorylation (COX4/1,

Aims and hypotheses
13
COX6A1), and thermogenesis (UCP2, UCP3) in skeletal muscle are higher in the NA
group compared to control group pigs.
Study 2: Khan M, Couturier A, Kubens JF, Most E, Mooren FC, Krüger K, Ringseis R, Eder
K (2013) Niacin supplementation induces type II to type I muscle fiber transition in skeletal
muscle of sheep. Acta Veterinaria Scandinavica, 55:85.
General aim of study 2: It has been observed that NA supplementation increases the number
of type I fibers in skeletal muscle of obese Zucker rats (Ringseis et al., 2013) and pigs (Study
1), and these effects were likely mediated by the induction of key regulators of fiber
transition, PPARδ, PGC-1α and PGC-1β, leading to type II to type I fiber transition and
upregulation of genes involved in fatty acid oxidation, mitochondrial oxidative
phosphorylation, and angiogenesis (Ringseis et al., 2013). The aim of the present study was to
investigate whether NA administration also influences fiber type distribution and the
metabolic phenotype of different skeletal muscles in sheep as a model for ruminant farm
animals.
Specific hypotheses of study 2: The following three hypotheses were tested in the present
study-
(i) NA supplementation induces muscle fiber transition from type II (fast-glycolytic) to
type I (slow-oxidative), and thereby creates an oxidative metabolic phenotype of
skeletal muscle in sheep.
(ii) The relative mRNA and protein levels of key regulators of fiber transition (PGC-1α,
PGC-1β and PPARδ) are upregulated in NA treated sheep than in control sheep.
(iii) The relative mRNA levels of genes involved in mitochondrial fatty acid uptake
(CPT1B, SLC25A20), TCA cycle (SDHA), mitochondrial respiratory chain (COX5A,
COX6A1), and angiogenesis (VEGFA) in skeletal muscle are higher in the NA treated
sheep compared to control sheep.

Original works
14
3. Original works

Khan et al. BMC Veterinary Research 2013, 9:177http://www.biomedcentral.com/1746-6148/9/177
RESEARCH ARTICLE Open Access
Niacin supplementation increases the number ofoxidative type I fibers in skeletal muscle ofgrowing pigsMuckta Khan1, Robert Ringseis1, Frank-Christoph Mooren2, Karsten Krüger2, Erika Most1 and Klaus Eder1*
Abstract
Background: A recent study showed that niacin supplementation counteracts the obesity-induced muscle fiberswitching from oxidative type I to glycolytic type II and increases the number of type I fibers in skeletal muscle ofobese Zucker rats. These effects were likely mediated by the induction of key regulators of fiber transition, PGC-1αand PGC-1β, leading to muscle fiber switching and up-regulation of genes involved in mitochondrial fatty acidimport and oxidation, citrate cycle, oxidative phosphorylation, mitochondrial biogenesis. The aim of the presentstudy was to investigate whether niacin supplementation causes type II to type I muscle and changes themetabolic phenotype of skeletal muscles in growing pigs.
Results: 25 male, 11 wk old crossbred pigs (Danzucht x Pietrain) with an average body weight of 32.8 ± 1.3(mean ± SD) kg were randomly allocated to two groups of 12 (control group) and 13 pigs (niacin group) whichwere fed either a control diet or a diet supplemented with 750 mg niacin/kg diet. After 3 wk, the percentagenumber of type I fibers in three different muscles (M. longissismus dorsi, M. quadriceps femoris, M. gastrocnemius) wasgreater in the niacin group and the percentage number of type II fibers was lower in the niacin group than in thecontrol group (P < 0.05). The mRNA levels of PGC-1β and genes involved in mitochondrial fatty acid catabolism(CACT, FATP1, OCTN2), citrate cycle (SDHA), oxidative phosphorylation (COX4/1, COX6A1), and thermogenesis(UCP3) in M. longissimus dorsi were greater in the niacin group than in the control group (P < 0.05).
Conclusions: The study demonstrates that niacin supplementation induces type II to type I muscle fiber switching,and thereby an oxidative metabolic phenotype of skeletal muscle in pigs. Given that oxidative muscle types tend todevelop dark, firm and dry pork in response to intense physical activity and/or high psychological stress levelspreslaughter, a niacin-induced change in the muscle´s fiber type distribution may influence meat quality of pigs.
Keywords: Niacin, Pig, Muscle fiber transition, Oxidative type I fiber
BackgroundNiacin, also called nicotinic acid, is a water-solublevitamin which belongs to the vitamin B complex and isessential for the metabolism of carbohydrates, fats andmany other substances. At pharmacological doses, niacinexerts pronounced lipid-lowering activities, particularlyon triacylglycerols (TAG), but also on total cholesteroland LDL cholesterol [1], and, interestingly, niacin increa-ses HDL cholesterol [2]. Besides these well-documented
* Correspondence: [email protected] of Animal Nutrition and Nutrition Physiology,Justus-Liebig-University Giessen, Heinrich-Buff-Ring 26-32, Giessen 35390,GermanyFull list of author information is available at the end of the article
© 2013 Khan et al.; licensee BioMed Central LtCommons Attribution License (http://creativecreproduction in any medium, provided the or
effects on blood lipid profile, high doses of niacin werealso shown to cause profound, but less recognized changesin gene expression in several tissues [3]. In this regard it isworth mentioning, that studies in both, humans [4] andrats [5] revealed that high levels of niacin cause an up-regulation of transcription factors in skeletal muscles, likePPARγ coactivator-1α (PGC-1α) and PGC-1β, which arekey regulators of fiber distribution in skeletal muscle [6,7].In principle, two major fiber types of skeletal muscle canbe distinguished: type II fibers, also called glycolytic fibers,which have few mitochondria and largely generateATP through glycolytic metabolism, and type I fibers,also called oxidative fibers, which are mitochondria-rich and utilize mainly oxidative phosphorylation for
d. This is an Open Access article distributed under the terms of the Creativeommons.org/licenses/by/2.0), which permits unrestricted use, distribution, andiginal work is properly cited.

Khan et al. BMC Veterinary Research 2013, 9:177 Page 2 of 8http://www.biomedcentral.com/1746-6148/9/177
energy production [8,9]. Remarkably, the type II to type Ifiber distribution in a given muscles displays high plasti-city and can be induced to switch depending on variousfactors, like exercise, mechanical unloading or obesity[10-13]. Since the muscle´s fiber distribution determinesits metabolic phenotype, fiber switching induced by exer-cise, mechanical unloading or obesity results in a changeof the functional and metabolic phenotype of skeletalmuscle [10-13]. Based on the observation that niacin up-regulates key regulators of fiber switching in skeletalmuscle, it has been investigated whether niacin supple-mentation can prevent the obesity-induced muscle fiberswitching from type I to type II and causes an elevation inthe number of type I fibers in skeletal muscle of obeseZucker rats [5]. This study indeed showed that niacinprevents the obesity-induced muscle fiber switching fromtype I to type II and elevates the number of type I fibers inskeletal muscle of obese Zucker rats [5]. Corresponding tothis niacin-induced increase in the muscle´s type I fibercontent niacin supplementation to the obese Zucker ratscaused the development of a more oxidative metabolicphenotype of skeletal muscle as evidenced by an increasedexpression of genes involved in mitochondrial fatty acidimport and oxidation, citrate cycle, oxidative phosphory-lation, mitochondrial biogenesis and angiogenesis [5]. Thisobvious improvement in the muscle´s capacity for oxida-tive utilization of fatty acids has likely contributed, at leastpartially, to the strong lowering effect of niacin on bloodlevels of TAG and non-esterified fatty acids (NEFA) in theobese Zucker rats [5], which are characterized by mark-edly elevated blood levels of TAG and NEFA.It is currently unknown whether high levels of niacin
also causes type II to type I muscle fiber switching inmetabolically healthy animals. This question may be ofparticular interest in farm animals used for meat pro-duction like growing pigs because a change in themuscle´s fiber type distribution is expected to influencemeat quality considering that several studies havereported that oxidative muscles with a high percentageof type I fibers have a lower glycolytic potential [14,15],a darker color [16,17] and a higher ultimate pH [14,16].In addition, it was shown that oxidative muscle typestend to develop dark, firm and dry pork in response tointense physical activity and/or high psychological stresslevels preslaughter [18]. Therefore, the present studyaimed to investigate whether niacin supplementationcauses type II to type I muscle fiber switching, thereby,resulting in an increased type I fiber percentage inskeletal muscle of growing pigs.
MethodsAnimals, housing, and experimental designThe experiment was performed at the Institute ofAnimal Nutrition and Nutrition Physiology, University
of Giessen, Germany. A total of 25 male, 11 wk oldcrossbred pigs (Danzucht × Pietrain) with an averagebody weight of 32.8 ± 1.3 (mean ± SD) kg were randomlyallocated to two groups of 12 (control group) and 13pigs (niacin group), respectively. The pigs were keptindividually in pens in a room under controlledtemperature at 23 ± 2°C and relative humidity at 55 to60% with light from 06.00 to 18.00 hrs. Both groups ofpigs received a nutritionally adequate commercial diet(RWZ-UNIVERSAL-START HE Press, RWZ, Köln,Germany) for growing pigs containing (in g/kg) wheat(226), barley (200), soybean meal (149), triticale (100),corn (100), wheat gluten (100), dried distiller´s grains(31), rapeseed meal (20), wheat bran (20), calcium car-bonate (16.1), vegetable oil (10), sodium chloride (3.9),monocalcium phosphate (2), and vitamin-mineral pre-mix (22). The vitamin-mineral premix provided 34 mgof niacin per kg diet, a dose which is sufficient to meetthe niacin requirement of growing pigs [19]. In the nia-cin group, the commercial diet was supplemented withadditional 750 mg of niacin (obtained from Lonza, Basel,Switzerland) per kg as a pharmacological dose. The dietsand water were given ad libitum. The feeding experi-ment lasted 21 days. All experimental procedures werein strict accordance with the recommendations in theguidelines for the care and use of laboratory animals[20] and the Appendix A of European Convention forthe Protection of Vertebrate Animals used for Experi-mental and other Scientific Purposes. In accordance witharticle 4 par. 3 of the German Animal Welfare Law allanimals were humanely killed for scientific purposeapproved by the Animal Welfare Officer of the Justus-Liebig-University.
Sample collectionAfter 21 days the animals were slaughtered after a 12 hfasting period at a commercial slaughterhouse near bythe Institute. Blood samples were taken into EDTA poly-ethylene tubes (Sarstedt, Nürnbrecht, Germany) andplasma was collected by centrifugation (1,100 × g;10 min, 4°C). Samples from three different skeletalmuscles [M. longissimus dorsi (LD), M. quadricepsfemoris (QF), M. gastrocnemius (G)] were excised andsamples were shock frozen with liquid nitrogen and storedat −80°C pending analysis.
Determination of type I and type II fiber percentages inskeletal muscleDetermination of type I and type II fiber percentages inskeletal muscle was carried out as recently described indetail [5]. In brief, 30 μm thick, serial cross sectionswere prepared using a cryostat microtome, mounted oncover slips and stained for myosin ATPase (mATPase)using a modified method of Hämäläinen and Pette [21].
Khan et al. BMC Veterinary Research 2013, 9:177 Page 3 of 8http://www.biomedcentral.com/1746-6148/9/177
Subsequently, the sections were analyzed by lightmicroscopy (Leica DMI 6000B) for calculating the type Iand type II fiber percentages.
Determination of TAG and NEFA concentrations in plasmaConcentrations of TAG and NEFA in plasma weredetermined by enzymatic reagent kits from MerckEurolab (ref. 113009990314) and from Wako Chemicals(ref. RD291001200R), respectively.
Determination of nicotinic acid and nicotineamideconcentrations in plasmaConcentrations of nicotinic acid and nicotineamide inplasma were determined by LC-MS/MS according to themethod from Liu et al. [22].
RNA isolation, cDNA synthesis and qPCR analysisRNA isolation, cDNA synthesis and qPCR analysis wereperformed as described recently in detail [23]. In brief,total RNA was extracted from 50–60 mg skeletal musclealiquots using peqGOLD TriFast™ RNA Extraction reagent(Peqlab, Erlangen, Germany) according to the manu-facturer´s protocol, and RNA concentration and puritywere estimated from the optical density at 260 and280 nm (Infinite 200 M microplate reader, Tecan,Männedorf, Switzerland). cDNA synthesis was carried outwithin one week after RNA isolation using dT18 primerand M-MuLV Reverse Transcriptase (MBI Fermentas,St. Leon-Rot, Germany). qPCR analysis was performedusing KAPA SYBR FAST qPCR Universal Mastermix(Peqlab, Erlangen, Germany) and gene-specific primerpairs which are listed in Table 1. Calculation of geneexpression data and normalization by GeNorm normali-zation factor were carried out as described recently [23].The normalization factor was calculated as the geometricmean of expression data of the three most stable out offive tested potential reference genes. Means and SD werecalculated from normalized expression data for samples ofthe same treatment group. The mean of the group controlgroup was set to 1 and mean and SD of the niacin groupwere scaled proportionally. Data on qPCR performancefor genes measured in skeletal muscle are shown inTable 1.
Statistical analysisData were statistically analysed by one-way ANOVAusing the Minitab Statistical Software (Rel. 13.0, StateCollege, PA, USA). Means of the two groups werecompared by Fisher’s multiple range test. Means wereconsidered significantly different for P < 0.05. Datapresented are shown as means ± SD.
ResultsFeed intake, body weight development, carcass weightsand feed conversion ratiosFeed intake, initial and final body weights, total and dailybody weight gain, carcass weights and feed conversionratio did not differ between the control group and theniacin group (Table 2).
Concentrations of nicotinic acid and its metabolitenicotineamide in plasmaThe plasma concentrations of nicotinic acid (NA) andits metabolite nicotineamide (NAM) were greater in theniacin group than in the control group (NA: < 5 ng/mL(limit of detection) vs. 32.0 ± 13.0 ng/mL; NAM: 0.34 ±0.07 vs. 3.88 ± 2.02 μg/mL; control group vs. niacingroup; P < 0.05).
Concentrations of TAG and NEFA in plasmaIn order to assess whether lipid concentrations inplasma are influenced by niacin supplementation, wemeasured the concentrations of TAG and NEFA inplasma of the pigs. The plasma concentrations of both,TAG and NEFA were not different between the twogroups of pigs (TAG: 0.51 ± 0.12 vs. 0.51 ± 0.10 mmol/L;NEFA: 0.47 ± 0.27 vs. 0.65 ± 0.21 mmol/L; control groupvs. niacin group).
Fiber type distribution of different skeletal musclesTo study whether niacin supplementation causes type IIto type I fiber switching, we determined the fiber typedistribution in different skeletal muscles (LD, QF andG). The percentage number of type I fibers in all threemuscles considered was greater in the niacin group thanin the control group, whereas the percentage number oftype II fibers was less in niacin group than in the controlgroup (P < 0.05, Figure 1).
Transcript levels of genes encoding fiber-specific MHCisoforms and regulators of muscle fiber distribution inLD muscleIn order to explore whether the niacin-induced fiberswitching is reflected by changes in the expression offiber-specific MHC isoforms, we determined the tran-script levels of different MHC isoforms, from whichthree isoforms exist in pigs, namely one type I isoform(MHCI encoded by MYH7) and two type II isoforms(MHCIIA encoded by MYH2, and MHCIIB encoded byMYH4), in LD muscle. In line with the decreased type IIfiber percentage the transcript levels of MYH2 andMYH4, which are expressed in type II fibers, weresignificantly reduced (P < 0.05) or tended to be reduced(P < 0.15), respectively, in LD muscle in the niacin groupcompared to the control group (Table 3). The transcriptlevel of the MHC isoform MYH7, which is expressed in

Table 1 Characteristics and performance data of primers used for qPCR
Gene Forward primer (3′-5′) Product length (bp) NCBI Genbank Slope R2# Efficiency*
Reverse primer (5′-3′)
Reference genes
ATP5G1 CAGTCACCTTGAGCCGGGCGA 94 NM_001025218 −3.42 0.999 1.96
TAGCGCCCCGGTGGTTTGC
ACTB GACATCCGCAAGGACCTCTA 205 XM_003124280 −3.60 0.998 1.89
ACATCTGCTGGAAGGTGGAC
RPS9 GTCGCAAGACTTATGTGACC 325 XM_003356050 −3.64 0.999 1.88
AGCTTAAAGACCTGGGTCTG
Target genes
COX4/1 GTGGAACTGTACCGCCTGAA 257 XM_003355730 −3.44 1.000 1.95
TTGTCGTAGTCCCACTTGGC
COX6A1 CTCAGCTCGCATGTGGAAGA 139 NM_001190221 −3.34 0.996 1.99
GATGCGAAGATGGGGGTAGG
CACT/SLC25A20 GCAAAGCCCATTAGCCCTCT 235 XM_003483178 −3.21 0.988 2.05
GAGCACATCCTCTGGGTGTT
PPARGC1A TAAAGATGCCGCCTCTGACT 168 NM_213963 −3.94 0.993 1.79
TGACCGAAGTGCTTGTTCAG
PPARGC1B AAGTGCGGCTTCGTCACCTA 216 XM_003124093 −3.28 0.998 2.02
GCTGTCGAAATCCATGGCTT
SLC22A5 TGCATTTGGCTACATGCTGC 174 XM_003123912 −3.76 0.995 1.85
ATGATCACCTCAGCTTCCTG
SDHA CTACGCCCCCGTCGCAAAGG 380 DQ402993 −3.24 1.000 2.03
AGTTTGCCCCCAGGCGGTTG
MYH2 GGCCCTTTGATGCCAAGACA 188 NM_214136 −3.45 1.000 1.95
GGCCATGTCCTCGATCTTGT
MYH4 GTGCCCTGCTGCCATCAATA 363 NM_001123141 −3.53 1.000 1.92
TGCGTAACGCTCTTTGAGGT
MYH7 TGCCAGCTTGAGCCTCTTTC 380 NM_213855 −3.33 0.999 2.00
GTAGCGCTCCTTGAGGTTGT
FATP1 GGTTCCAGCCTGTTGAATGT 275 NM_001083931 −3.44 0.990 1.95
AACAAAACCTTGGTGCTTGG
UCP2 AGTGTGAGACCTGACGAAGC 435 NM_214289 −3.64 0.996 1.88
GCTTGACGGAGTCGTAGAGG
UCP3 GCCACTTTGTCTCTGCCTTC 219 NM_214049 −3.49 0.998 1.93
CAAACATCACCACGTTCCAG#Coefficient of determination of the standard curve.*The efficiency is determined by [10(−1/-slope].
Khan et al. BMC Veterinary Research 2013, 9:177 Page 4 of 8http://www.biomedcentral.com/1746-6148/9/177
type I fibers, in LD muscle tended to be increased in theniacin group compared to the control group (P < 0.15,Table 3).To elucidate the mechanisms underlying type II to
type I fiber transition in skeletal muscle of pigs inresponse to niacin supplementation, we determined thetranscript levels of two key regulators of muscle fiber
transition, PGC-1α and PGC-1β, in LD muscle. Thetranscript level of PGC-1β in LD muscle was greater inthe niacin group than in the control group (P < 0.05;Table 3). In addition, the transcript level of PGC-1α inLD muscle was numerically greater in the niacin groupthan in the control group but this effect was not signifi-cant (P > 0.05; Table 3).
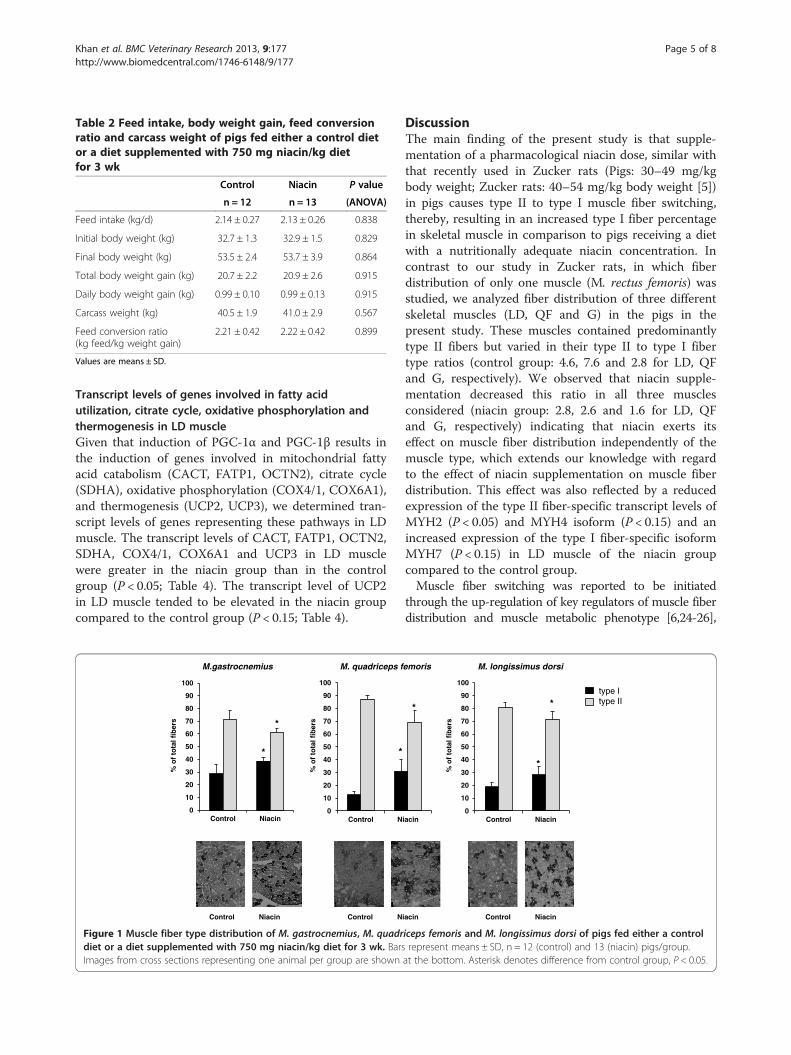
Table 2 Feed intake, body weight gain, feed conversionratio and carcass weight of pigs fed either a control dietor a diet supplemented with 750 mg niacin/kg dietfor 3 wk
Control Niacin P value
n = 12 n = 13 (ANOVA)
Feed intake (kg/d) 2.14 ± 0.27 2.13 ± 0.26 0.838
Initial body weight (kg) 32.7 ± 1.3 32.9 ± 1.5 0.829
Final body weight (kg) 53.5 ± 2.4 53.7 ± 3.9 0.864
Total body weight gain (kg) 20.7 ± 2.2 20.9 ± 2.6 0.915
Daily body weight gain (kg) 0.99 ± 0.10 0.99 ± 0.13 0.915
Carcass weight (kg) 40.5 ± 1.9 41.0 ± 2.9 0.567
Feed conversion ratio(kg feed/kg weight gain)
2.21 ± 0.42 2.22 ± 0.42 0.899
Values are means ± SD.
Khan et al. BMC Veterinary Research 2013, 9:177 Page 5 of 8http://www.biomedcentral.com/1746-6148/9/177
Transcript levels of genes involved in fatty acidutilization, citrate cycle, oxidative phosphorylation andthermogenesis in LD muscleGiven that induction of PGC-1α and PGC-1β results inthe induction of genes involved in mitochondrial fattyacid catabolism (CACT, FATP1, OCTN2), citrate cycle(SDHA), oxidative phosphorylation (COX4/1, COX6A1),and thermogenesis (UCP2, UCP3), we determined tran-script levels of genes representing these pathways in LDmuscle. The transcript levels of CACT, FATP1, OCTN2,SDHA, COX4/1, COX6A1 and UCP3 in LD musclewere greater in the niacin group than in the controlgroup (P < 0.05; Table 4). The transcript level of UCP2in LD muscle tended to be elevated in the niacin groupcompared to the control group (P < 0.15; Table 4).
M.gastrocnemius M. quadriceps f
*
*
0
10
20
30
40
50
60
70
80
90
100
Control Niacin
*
0
10
20
30
40
50
60
70
80
90
100
Control N
% o
fto
tal f
iber
s
% o
fto
tal f
iber
s
Control Niacin Control N
Figure 1 Muscle fiber type distribution of M. gastrocnemius, M. quadrdiet or a diet supplemented with 750 mg niacin/kg diet for 3 wk. BarsImages from cross sections representing one animal per group are shown
DiscussionThe main finding of the present study is that supple-mentation of a pharmacological niacin dose, similar withthat recently used in Zucker rats (Pigs: 30–49 mg/kgbody weight; Zucker rats: 40–54 mg/kg body weight [5])in pigs causes type II to type I muscle fiber switching,thereby, resulting in an increased type I fiber percentagein skeletal muscle in comparison to pigs receiving a dietwith a nutritionally adequate niacin concentration. Incontrast to our study in Zucker rats, in which fiberdistribution of only one muscle (M. rectus femoris) wasstudied, we analyzed fiber distribution of three differentskeletal muscles (LD, QF and G) in the pigs in thepresent study. These muscles contained predominantlytype II fibers but varied in their type II to type I fibertype ratios (control group: 4.6, 7.6 and 2.8 for LD, QFand G, respectively). We observed that niacin supple-mentation decreased this ratio in all three musclesconsidered (niacin group: 2.8, 2.6 and 1.6 for LD, QFand G, respectively) indicating that niacin exerts itseffect on muscle fiber distribution independently of themuscle type, which extends our knowledge with regardto the effect of niacin supplementation on muscle fiberdistribution. This effect was also reflected by a reducedexpression of the type II fiber-specific transcript levels ofMYH2 (P < 0.05) and MYH4 isoform (P < 0.15) and anincreased expression of the type I fiber-specific isoformMYH7 (P < 0.15) in LD muscle of the niacin groupcompared to the control group.Muscle fiber switching was reported to be initiated
through the up-regulation of key regulators of muscle fiberdistribution and muscle metabolic phenotype [6,24-26],
emoris M. longissimus dorsi
*
iacin
*
*
0
10
20
30
40
50
60
70
80
90
100
Control Niacin
type Itype II
% o
fto
tal f
iber
s
iacin Control Niacin
iceps femoris and M. longissimus dorsi of pigs fed either a controlrepresent means ± SD, n = 12 (control) and 13 (niacin) pigs/group.at the bottom. Asterisk denotes difference from control group, P < 0.05.
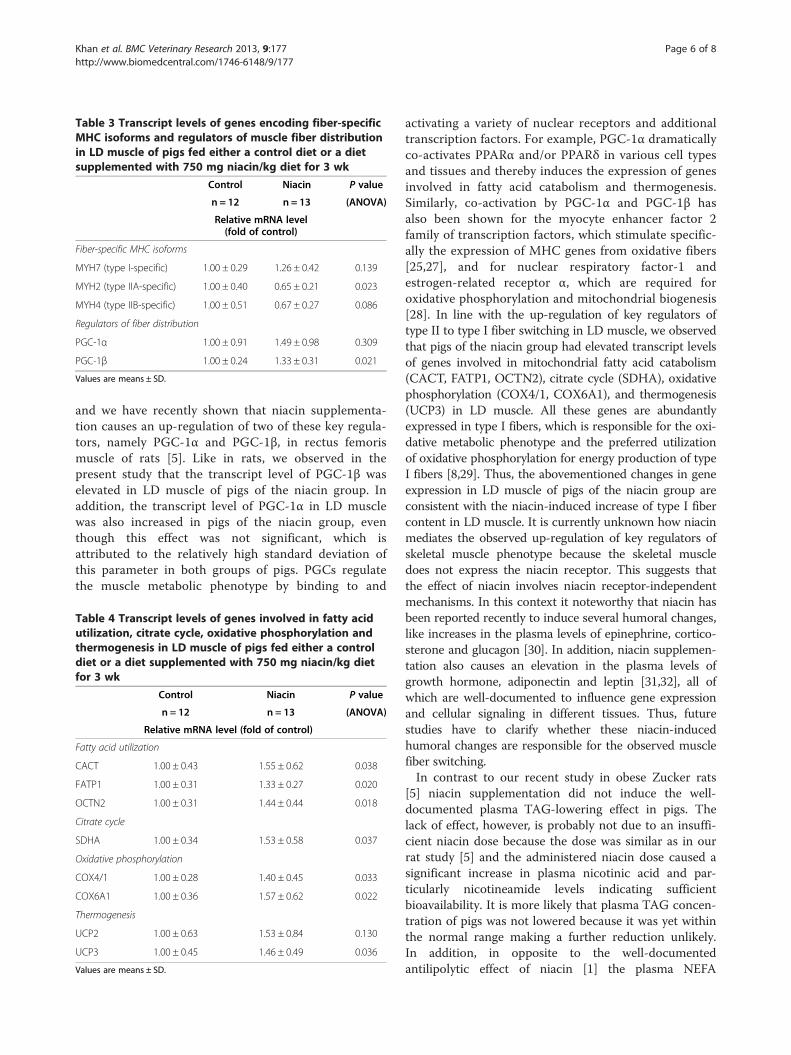
Table 3 Transcript levels of genes encoding fiber-specificMHC isoforms and regulators of muscle fiber distributionin LD muscle of pigs fed either a control diet or a dietsupplemented with 750 mg niacin/kg diet for 3 wk
Control Niacin P value
n = 12 n = 13 (ANOVA)
Relative mRNA level(fold of control)
Fiber-specific MHC isoforms
MYH7 (type I-specific) 1.00 ± 0.29 1.26 ± 0.42 0.139
MYH2 (type IIA-specific) 1.00 ± 0.40 0.65 ± 0.21 0.023
MYH4 (type IIB-specific) 1.00 ± 0.51 0.67 ± 0.27 0.086
Regulators of fiber distribution
PGC-1α 1.00 ± 0.91 1.49 ± 0.98 0.309
PGC-1β 1.00 ± 0.24 1.33 ± 0.31 0.021
Values are means ± SD.
Khan et al. BMC Veterinary Research 2013, 9:177 Page 6 of 8http://www.biomedcentral.com/1746-6148/9/177
and we have recently shown that niacin supplementa-tion causes an up-regulation of two of these key regula-tors, namely PGC-1α and PGC-1β, in rectus femorismuscle of rats [5]. Like in rats, we observed in thepresent study that the transcript level of PGC-1β waselevated in LD muscle of pigs of the niacin group. Inaddition, the transcript level of PGC-1α in LD musclewas also increased in pigs of the niacin group, eventhough this effect was not significant, which isattributed to the relatively high standard deviation ofthis parameter in both groups of pigs. PGCs regulatethe muscle metabolic phenotype by binding to and
Table 4 Transcript levels of genes involved in fatty acidutilization, citrate cycle, oxidative phosphorylation andthermogenesis in LD muscle of pigs fed either a controldiet or a diet supplemented with 750 mg niacin/kg dietfor 3 wk
Control Niacin P value
n = 12 n = 13 (ANOVA)
Relative mRNA level (fold of control)
Fatty acid utilization
CACT 1.00 ± 0.43 1.55 ± 0.62 0.038
FATP1 1.00 ± 0.31 1.33 ± 0.27 0.020
OCTN2 1.00 ± 0.31 1.44 ± 0.44 0.018
Citrate cycle
SDHA 1.00 ± 0.34 1.53 ± 0.58 0.037
Oxidative phosphorylation
COX4/1 1.00 ± 0.28 1.40 ± 0.45 0.033
COX6A1 1.00 ± 0.36 1.57 ± 0.62 0.022
Thermogenesis
UCP2 1.00 ± 0.63 1.53 ± 0.84 0.130
UCP3 1.00 ± 0.45 1.46 ± 0.49 0.036
Values are means ± SD.
activating a variety of nuclear receptors and additionaltranscription factors. For example, PGC-1α dramaticallyco-activates PPARα and/or PPARδ in various cell typesand tissues and thereby induces the expression of genesinvolved in fatty acid catabolism and thermogenesis.Similarly, co-activation by PGC-1α and PGC-1β hasalso been shown for the myocyte enhancer factor 2family of transcription factors, which stimulate specific-ally the expression of MHC genes from oxidative fibers[25,27], and for nuclear respiratory factor-1 andestrogen-related receptor α, which are required foroxidative phosphorylation and mitochondrial biogenesis[28]. In line with the up-regulation of key regulators oftype II to type I fiber switching in LD muscle, we observedthat pigs of the niacin group had elevated transcript levelsof genes involved in mitochondrial fatty acid catabolism(CACT, FATP1, OCTN2), citrate cycle (SDHA), oxidativephosphorylation (COX4/1, COX6A1), and thermogenesis(UCP3) in LD muscle. All these genes are abundantlyexpressed in type I fibers, which is responsible for the oxi-dative metabolic phenotype and the preferred utilizationof oxidative phosphorylation for energy production of typeI fibers [8,29]. Thus, the abovementioned changes in geneexpression in LD muscle of pigs of the niacin group areconsistent with the niacin-induced increase of type I fibercontent in LD muscle. It is currently unknown how niacinmediates the observed up-regulation of key regulators ofskeletal muscle phenotype because the skeletal muscledoes not express the niacin receptor. This suggests thatthe effect of niacin involves niacin receptor-independentmechanisms. In this context it noteworthy that niacin hasbeen reported recently to induce several humoral changes,like increases in the plasma levels of epinephrine, cortico-sterone and glucagon [30]. In addition, niacin supplemen-tation also causes an elevation in the plasma levels ofgrowth hormone, adiponectin and leptin [31,32], all ofwhich are well-documented to influence gene expressionand cellular signaling in different tissues. Thus, futurestudies have to clarify whether these niacin-inducedhumoral changes are responsible for the observed musclefiber switching.In contrast to our recent study in obese Zucker rats
[5] niacin supplementation did not induce the well-documented plasma TAG-lowering effect in pigs. Thelack of effect, however, is probably not due to an insuffi-cient niacin dose because the dose was similar as in ourrat study [5] and the administered niacin dose caused asignificant increase in plasma nicotinic acid and par-ticularly nicotineamide levels indicating sufficientbioavailability. It is more likely that plasma TAG concen-tration of pigs was not lowered because it was yet withinthe normal range making a further reduction unlikely.In addition, in opposite to the well-documentedantilipolytic effect of niacin [1] the plasma NEFA

Khan et al. BMC Veterinary Research 2013, 9:177 Page 7 of 8http://www.biomedcentral.com/1746-6148/9/177
concentration in pigs of the niacin group was also notreduced but even increased, at least numerically. Thisresult, however, is in agreement with recent observationsthat chronic niacin administration for at least 2 weeksresults in elevated plasma NEFA levels [33]. The basisfor this rebound phenomenon on lipolysis during long-term niacin treatment is only incompletely understood,but recent findings indicate that niacin favors an in-crease in the net rate of lipolysis through reducing TAGsynthesis and expression of perilipin in adipocytes [34].
ConclusionsThe present study demonstrates that niacin supplemen-tation induces type II to type I muscle fiber switching,and thereby an oxidative metabolic phenotype of skeletalmuscle in pigs as a farm animal model. The observedup-regulation of key regulators of fiber distribution inskeletal muscle in response to niacin supplementation islikely causative for the induction of muscle fiberswitching in pigs. Given that oxidative muscle types tendto develop dark, firm and dry pork in response tointense physical activity and/or high psychological stresslevels preslaughter [18], a niacin-induced change in themuscle´s fiber type distribution may influence meatquality of pigs which would be worth of being investi-gated in future studies.
AbbreviationsCACT: Carnitine-acylcarnitine translocase; COX: Cytochrome c oxidase;FATP: Fatty acid transport protein; G: Gastrocnemius; HDL: High-densitylipoprotein; LD: Longissimus dorsi; LDL: Low-density lipoprotein;MHC: Myosin heavy chain; MYH: Myosin heavy chain encoded gene;NA: Nicotinic acid; NAM: Nicotineamide; NEFA: Non-esterified fatty acids;OCTN: Novel organic cation transporter; PGC-1: Peroxisome proliferator-activated receptor-gamma coactivator-1; PPAR: Peroxisome proliferator-activated receptor; QF: Quadriceps femoris; SDHA: Succinate dehydrogenasesubunit A; TAG: Triacylglycerol; UCP: Uncoupling protein.
Competing interestsThe authors declare that they have no competing interests.
Authors’ contributionsMK conducted the animal experiment, performed fiber typing, PCR analyses,blood lipid analyses, statistical analyses, and wrote the manuscript, RRparticipated in the design and coordination of the study, supervised PCRanalyses, and statistical analysis and helped to draft the manuscript, FCM andKK analysed data from muscle fiber typing, EM performed nicotinic acid andnicotineamide analyses in blood, KE conceived of the study, participated inits design and coordination and helped to draft the manuscript. All authorsread and approved the final manuscript.
Author details1Institute of Animal Nutrition and Nutrition Physiology,Justus-Liebig-University Giessen, Heinrich-Buff-Ring 26-32, Giessen 35390,Germany. 2Department of Sports Medicine, Justus-Liebig-University Giessen,Kugelberg 62, Giessen 35394, Germany.
Received: 10 June 2013 Accepted: 2 September 2013Published: 9 September 2013
References1. Gille A, Bodor ET, Ahmed K, Offermanns S: Nicotinic acid: Pharmacological
effects and mechanisms of action. Annu Rev Pharmacol Toxicol 2008,48:79–106.
2. Kashyap K u: Mechanism of action of niacin. Am J Cardiol 2008,101:20B–26B.
3. Choi S, Yoon H, Oh KS, Oh YT, Kim YI, Kang I, Youn JH: Widespread effects ofnicotinic acid on gene expression in insulin-sensitive tissues: implicationsfor unwanted effects of nicotinic acid treatment. Metab 2011, 60:134–144.
4. Watt MJ, Southgate RJ, Holmes AG, Febbraio MA: Suppression of plasmafree fatty acids upregulates peroxisome proliferator-activated receptor(PPAR) α and δ and PPAR coactivator 1α in human skeletal muscle, butnot lipid regulatory genes. J Mol Endocrinol 2004, 33:533–544.
5. Ringseis R, Rosenbaum S, Gessner DK, Herges L, Kubens JF, Mooren FC,Krüger K, Eder K: Supplementing obese Zucker rats with niacin inducesthe transition of glycolytic to oxidative skeletal muscle fibers. J Nutr 2013,143:125–131.
6. Schuler M, Ali F, Chambon C, Duteil D, Bornert JM, Tardivel A, Desvergne B,Wahli W, Chambon P, Metzger D: PGC1α expression is controlled inskeletal muscles by PPAR β, whose ablation results in fiber-typeswitching, obesity, and type 2 diabetes. Cell Metab 2006, 4:407–414.
7. Chinsomboon J, Ruas J, Gupta RK, Thom R, Shoag J, Rowe GC, Sawada N,Raghuram S, Arany Z: The transcriptional coactivator PGC-1alphamediates exercise-induced angiogenesis in skeletal muscle. Proc NatlAcad Sci U S A 2009, 106:21401–21406.
8. Peter JB, Barnard RJ, Edgerton VR, Gillespie CA, Stempel KE: Metabolicprofiles of three fiber types of skeletal muscle in guinea pigs andrabbits. Biochem 1972, 11:2627–2633.
9. Barnard RJ, Edgerton VR, Furukawa T, Peter JB: Histochemical, biochemical,and contractile properties of red, white, and intermediate fibers.Am J Physiol 1971, 220:410–414.
10. Waters RE, Rotevatn S, Li P, Annex BH, Yan Z: Voluntary running inducesfiber type-specific angiogenesis in mouse skeletal muscle. Am J PhysiolCell Physiol 2004, 287:C1342–C1348.
11. Cassano P, Sciancalepore AG, Pesce V, Flück M, Hoppeler H, Calvani M,Mosconi L, Cantatore P, Gadaleta MN: Acetyl-L-carnitine feeding tounloaded rats triggers in soleus muscle the coordinated expression ofgenes involved in mitochondrial biogenesis. Biochim Biophys Acta 2006,1757:1421–1428.
12. Fujita N, Nagatomo F, Murakami S, Kondo H, Ishihara A, Fujino H: Effects ofhyperbaric oxygen on metabolic capacity of the skeletal muscle in type2 diabetic rats with obesity. Scientific World Journal 2012, 2012:637978.
13. Nagatomo F, Fujino H, Kondo H, Gu N, Takeda I, Ishioka N, Tsuda K,Ishihara A: PGC-1α mRNA level and oxidative capacity of the plantarismuscle in rats with metabolic syndrome, hypertension, and type 2diabetes. Acta Histochem Cytochem 2011, 44:73–80.
14. Monin G, Mejenes-Quijano A, Talmant A, Sellier P: Influence of breed andmuscle metabolic type on muscle glycolytic potential and meat pH inpigs. Meat Sci 1987, 20:149–158.
15. Fernandez X, Meunier-Salaün M-C, Ecolan P: Glycogen depletion accordingto muscle and fibre types in response to dyadic encounters in pigs (Susscrofa domesticus)–relationships with plasma epinephrine andaggressive behaviour. Comp Biochem Physiol A Physiol 1994, 109:869–879.
16. Warner RD, Kauffman RG, Russell RL: Quality attributes of major porcinemuscles: a comparison with the Longissimus Lumborum. Meat Sci 1993,33:359–372.
17. Brewer MS, Zhu LG, Bidner B, Meisinger DJ, McKeith FK: Measuring porkcolor: effects of bloom time, muscle, pH and relationship to instrumentalparameters. Meat Sci 2001, 57:169–176.
18. Hambrecht E, Eissen JJ, Newman DJ, Smits CHM, Verstegen MWA, denHartog LA: Preslaughter handling effects on pork quality and glycolyticpotential in two muscles differing in fiber type composition. J Anim Sci2005, 83:900–907.
19. German Society for Nutrition Physiology (GfE): Empfehlungen zurEnergie- und Nährstoffversorgung von Schweinen. Frankfurt am Main,Germany: DLG-Verlag; 2006.
20. National Research Council: Guide for the care and use of laboratory animals.Washington DC: National Institutes of Health; 1985. Publication no. 85–23 (rev.).
21. Hämäläinen N, Pette D: The histochemical profiles of fast fiber types IIB,IID, and IIA in skeletal muscles of mouse, rat, and rabbit. J HistochemCytochem 1993, 41:733–743.

Khan et al. BMC Veterinary Research 2013, 9:177 Page 8 of 8http://www.biomedcentral.com/1746-6148/9/177
22. Liu M, Zhang D, Wang X, Zhang L, Han J, Yang M, Xiao X, Zhang Y, Liu H:Simultaneous quantification of niacin and its three main metabolites inhuman plasma by LC–MS/MS. J Chromatogr B 2012, 904:107–114.
23. Keller J, Ringseis R, Koc A, Lukas I, Kluge H, Eder K: Supplementation withl-carnitine downregulates genes of the ubiquitin proteasome system inthe skeletal muscle and liver of piglets. Anim 2012, 6:70–78.
24. Wang YX, Zhang CL, Yu RT, Cho HK, Nelson MC, Bayuga-Ocampo CR,Ham J, Kang H, Evans RM: Regulation of muscle fiber type and runningendurance by PPARδ. PLoS Biol 2004, 2:e294.
25. Lin J, Wu H, Tarr PT, Zhang C, Wu Z, Boss O, Michael LF, Puigserver P,Isotani E, Olson EN, Lowell BB, Bassel-Duby R, Spiegelman BM:Transcriptional co-activator PGC-1α drives the formation of slow-twitchmuscle fibres. Nat 2002, 418:797–801.
26. Lin J, Handschin C, Spiegelman BM: Metabolic control through the PGC-1family of transcription coactivators. Cell Metab 2005, 1:361–370.
27. Arany Z, Lebrasseur N, Morris C, Smith E, Yang W, Ma Y, Chin S, SpiegelmanBM: The transcriptional coactivator PGC-1beta drives the formation ofoxidative type IIX fibers in skeletal muscle. Cell Metab 2007, 5:35–46.
28. Shao D, Liu Y, Liu X, Zhu L, Cui Y, Cui A, Qiao A, Kong X, Liu Y, Chen Q,Gupta N, Fang F, Chang Y: PGC-1 beta-regulated mitochondrialbiogenesis and function in myotubes is mediated by NRF-1 and ERRalpha. Mitochondrion 2010, 10:516–27.
29. Pette D, Staron RS: Cellular and molecular diversities of mammalianskeletal muscle fibers. Rev Physiol Biochem Pharmacol 1990, 116:1–76.
30. Quabbe HJ, Luyckx AS, L'age M, Schwarz C: Growth hormone, cortisol, andglucagon concentrations during plasma free fatty acid depression:different effects of nicotinic acid and an adenosine derivative (BM11.189). J Clin Endocrinol Metab 1983, 57:410–414.
31. Westphal S, Borucki K, Taneva E, Makarova R, Luley C: Extended-releaseniacin raises adiponectin and leptin. Atheroscler 2007, 193:361–365.
32. Plaisance EP, Grandjean PW, Brunson BL, Judd RL: Increased total andhigh-molecular weight adiponectin after extended-release niacin.Metab 2008, 57:404–409.
33. Poynten AM, Gan SK, Kriketos AD, O´Sullivan A, Kelly JJ, Ellis BA, ChisholmDJ, Campbell LV: Nicotinic acid-induced insulin resistance is related toincreased circulating fatty acids and fat oxidation but not muscle lipidcontent. Metab 2003, 52:699–704.
34. Rasouli N, Hale T, Kahn SE, Spencer HJ, Elbein SC: Effects of short-termexperimental insulin resistance and family history of diabetes onpancreatic β-cell function in nondiabetic individuals. J Clin EndocrinolMetab 2005, 90:5825–5833.
doi:10.1186/1746-6148-9-177Cite this article as: Khan et al.: Niacin supplementation increases thenumber of oxidative type I fibers in skeletal muscle of growing pigs.BMC Veterinary Research 2013 9:177.
Submit your next manuscript to BioMed Centraland take full advantage of:
• Convenient online submission
• Thorough peer review
• No space constraints or color figure charges
• Immediate publication on acceptance
• Inclusion in PubMed, CAS, Scopus and Google Scholar
• Research which is freely available for redistribution
Submit your manuscript at www.biomedcentral.com/submit

Khan et al. Acta Veterinaria Scandinavica 2013, 55:85http://www.actavetscand.com/content/55/1/85
RESEARCH Open Access
Niacin supplementation induces type II to type Imuscle fiber transition in skeletal muscle of sheepMuckta Khan1, Aline Couturier1, Johanna F Kubens1, Erika Most1, Frank-Christoph Mooren2, Karsten Krüger2,Robert Ringseis1 and Klaus Eder1*
Abstract
Background: It was recently shown that niacin supplementation counteracts the obesity-induced muscle fibertransition from oxidative type I to glycolytic type II and increases the number of type I fibers in skeletal muscle ofobese Zucker rats. These effects were likely mediated by the induction of key regulators of fiber transition, PPARδ(encoded by PPARD), PGC-1α (encoded by PPARGC1A) and PGC-1β (encoded by PPARGC1B), leading to type II totype I fiber transition and upregulation of genes involved in oxidative metabolism. The aim of the present studywas to investigate whether niacin administration also influences fiber distribution and the metabolic phenotype ofdifferent muscles [M. longissimus dorsi (LD), M. semimembranosus (SM), M. semitendinosus (ST)] in sheep as a modelfor ruminants. For this purpose, 16 male, 11 wk old Rhoen sheep were randomly allocated to two groups of 8 sheepeach administered either no (control group) or 1 g niacin per day (niacin group) for 4 wk.
Results: After 4 wk, the percentage number of type I fibers in LD, SM and ST muscles was greater in the niacingroup, whereas the percentage number of type II fibers was less in niacin group than in the control group(P < 0.05). The mRNA levels of PPARGC1A, PPARGC1B, and PPARD and the relative mRNA levels of genes involved inmitochondrial fatty acid uptake (CPT1B, SLC25A20), tricarboxylic acid cycle (SDHA), mitochondrial respiratory chain(COX5A, COX6A1), and angiogenesis (VEGFA) in LD, SM and ST muscles were greater (P < 0.05) or tended to begreater (P < 0.15) in the niacin group than in the control group.
Conclusions: The study shows that niacin supplementation induces muscle fiber transition from type II to type I, andthereby an oxidative metabolic phenotype of skeletal muscle in sheep as a model for ruminants. The enhanced capacityof skeletal muscle to utilize fatty acids in ruminants might be particularly useful during metabolic states in which fattyacids are excessively mobilized from adipose tissue, such as during the early lactating period in high producing cows.
Keywords: Niacin, Sheep, Muscle fiber transition, Oxidative type I fiber
BackgroundPharmacological doses of niacin have long been knownto lower the levels of blood lipids, especially triacylglyc-erols (TAG), but the mechanism underlying this effect isonly incompletely understood. Even though it has beenestablished that niacin inhibits lipolysis in adipocytesthrough binding to the niacin-receptor HCA2 and there-by reduces the supply of non-esterified fatty acids (NEFA)for hepatic TAG synthesis [1], this effect can only insuffi-ciently explain the lipid-lowering effect because blood
* Correspondence: [email protected] of Animal Nutrition and Nutrition Physiology,Justus-Liebig-University Giessen, Heinrich-Buff-Ring 26-32, 35390 Giessen,GermanyFull list of author information is available at the end of the article
© 2013 Khan et al.; licensee BioMed Central LtCommons Attribution License (http://creativecreproduction in any medium, provided the or
NEFA levels even become elevated during long-term nia-cin treatment due to a strong rebound phenomenon onlipolysis while the TAG lowering effect remains [2]. How-ever, less well-documented niacin treatment also causessignificant changes in gene expression in other tissuesthan adipose tissue, like skeletal muscle [2], a tissue whichdue to its great mass is particularly important for wholebody fatty acid utilization. Noteworthy, it has beenrecently shown in humans that niacin administration in-duces the expression of two transcription factors, peroxi-some proliferator-activated receptor δ (PPARδ, encodedby PPARD) and PPARγ coactivator-1α (PGC-1α, encodedby PPARGC1A) in skeletal muscle [3]. Both transcriptionfactors are key regulators of muscle fiber composition andthe muscle’s metabolic phenotype because they control
d. This is an open access article distributed under the terms of the Creativeommons.org/licenses/by/2.0), which permits unrestricted use, distribution, andiginal work is properly cited.
Khan et al. Acta Veterinaria Scandinavica 2013, 55:85 Page 2 of 10http://www.actavetscand.com/content/55/1/85
genes involved in muscle fiber switching, fatty acidutilization, oxidative phosphorylation, mitochondrial bio-genesis and function [4,5], and angiogenesis [6]. Skeletalmuscle contains two major types of muscle fibers whichdiffer in their contractile proteins and their metabolic cap-acity [7]. The type II fibers (“glycolytic fibers”) have a littlenumber of mitochondria and largely generate ATPthrough glycolytic metabolism, whereas type I fibers (“oxi-dative fibers”) are mitochondria-rich and thus utilizemainly oxidative phosphorylation [8,9]. Interestingly, thedistribution of type I and type II fibers of skeletal musclesshows high plasticity and can be altered by diverse factors,such as exercise, mechanical unloading, obesity or dia-betes, resulting in a change of the muscle’s functional andmetabolic phenotype [10-13]. In an attempt to studywhether the induction of PPARδ and PGC-1α in skeletalmuscle by pharmacological niacin doses leads to a changeof muscle fiber distribution and the muscle’s metabolicphenotype, we have previously tested the effect of niacinsupplementation at a dose used for reduction of serumlipids in obese Zucker rats [14] and pigs [15]. Both studiesrevealed that niacin supplementation induces muscle fibertransition from type II to type I and increases the numberof type I fibers in skeletal muscle [14,15]. Moreover, wefound that the expression of genes involved in fatty acidtransport, mitochondrial fatty acid import and oxidation,oxidative phosphorylation and angiogenesis and genesencoding PPARδ, PGC-1α and PGC-1β (encoded byPPARGC1B), which, like PGC-1α, is a key regulator ofskeletal muscle’s oxidative and contractile phenotype [16],in skeletal muscle is elevated by niacin treatment [14,15].Thus, these findings suggest that niacin induces a changein the muscle metabolic phenotype which is indicative ofan increased capacity of muscle for oxidative utilization offatty acids and which might be useful during metabolicstates where TAG and NEFA are strongly elevated, suchas during early lactation in high producing dairy cows[17]. However, whether niacin treatment also causes typeII to type I muscle fiber switching and increases the type Ifiber content of skeletal muscles in ruminants has notbeen investigated yet. Thus, the present study aimed toinvestigate whether niacin administration at a pharma-cological dose influences fiber distribution and the meta-bolic phenotype of different skeletal muscles in sheep asa model for ruminants. Niacin was administrated bydrenching ensuring that the main part of the adminis-trated niacin bypasses the rumen and reaches the smallintestine.
MethodsAnimals, housing, and experimental designThe experiment was located at the Research Station ofthe Institute of Animal Breeding and Genetics at theUniversity of Giessen, Germany. A total of 16 male, 11
wk old Rhoen sheep with an average body weight of29.6 ± 3.0 (mean ± SD) kg were randomly allocated totwo groups of 8 sheep each (control group and niacingroup). All sheep within one group were kept togetherin a barn on straw. All sheep received hay ad libitumand 1.5 kg concentrate per day and sheep. The hay con-tained (% of dry matter) 47.5% nitrogen-free extractablesubstances, 30.3% crude fiber, 7.0% crude protein, 6.1%crude ash and 1.1% crude fat. The concentrate (RWZ-Schaf 18 Uni Press, RWZ, Köln) consisted of (g/kg):Root pulp (250), wheat (200), dried distillers grains withsolubles (120), wheat bran (104), wheat gluten feed(100), rapeseed extraction meal (100), soybean extractionmeal (37), calcium carbonate (22), soy hulls (20), molasses(20), vinasse (10), monocalcium phosphate (8), sodiumchloride (1.9), magnesium oxide (1.6) and a premix sup-plying vitamins and minerals (5.5; amounts of vitaminsand minerals supplied per kg: vitamin A, 8,000 IE; vitaminD3, 1,000 IE; vitamin E, 65 mg; zinc, 40 mg as zinc sulfatemonohydrate; manganese, 20 mg as manganese (II) sulfatemonohydrate; selenium, 0.2 mg as sodium selenite; cobalt,0.2 mg as cobalt (II) sulfate monohydrate; iodine, 0.1 mgas calcium iodate). According to the manufacturer’sdeclaration the concentrate contained 10.6 MJ ME/kgand 18% crude protein. Additionally, sheep of the niacingroup received 1 g niacin (obtained from Lonza, Basel,Switzerland) dissolved in 100 ml drinking water bydrenching daily at eleven a.m. Sheep of the controlgroup were given the same amount of drinking water bydrenching without addition of niacin. Since the concen-trate did not contain any supplemental niacin, the sheepof the control group received only the niacin containedin the hay and the feed components of the concentrate,from which no actual concentrations of niacin are avail-able. Based on literature data, the niacin concentrationin hay and concentrate is below 100 mg/kg dry matter[18]. The experimental period during which sheep wereadministered either no (control group) or 1 g niacin perday (niacin group) lasted for 4 wk. Water was given adlibitum. All experimental procedures were in strict ac-cordance with the recommendations in the guidelinesfor the care and use of laboratory animals [19] and theAppendix A of European Convention for the Protectionof Vertebrate Animals used for Experimental and otherScientific Purposes. In accordance with article 4 par. 3of the German Animal Welfare Law all animals werehumanely killed for scientific purpose approved by theAnimal Welfare Officer of the Justus-Liebig-University.
Sample collectionAfter 4 wk the animals were slaughtered at a commercialslaughterhouse located in the near of the Research Sta-tion. Blood samples were taken into EDTA polyethylenetubes (Sarstedt, Nürnbrecht, Germany) and plasma was

Khan et al. Acta Veterinaria Scandinavica 2013, 55:85 Page 3 of 10http://www.actavetscand.com/content/55/1/85
collected by centrifugation (1,100 × g; 10 min, 4°C).Samples from three different skeletal muscles [M. longissi-mus dorsi (LD), M. semimembranosus (SM), M. semitendi-nosus (ST)] were excised nearly at the same location andsamples were shock frozen with liquid nitrogen and storedat −80°C pending analysis.
Muscle fiber typingFiber typing was performed as recently described in de-tail [14]. In brief, 30 μm thick, serial cross sections weretaken using a cryostat microtome, mounted on coverslips and stained for myosin ATPase (mATPase) using amodified method of Hämäläinen and Pette [20]. In brief,sections were pre-incubated for 5 min in sodium acetate(54.3 mM) – sodium barbital (32.6 mM) solution ad-justed with hydrogen chloride to pH 4.6. After washing,the sections were incubated for 30 min at 37°C in sub-strate solution (2.7 mM ATP, 100 mM glycin, 54 mMcalcium (II) chloride, 100 mM sodium chloride, pH ad-justed to 9.6). Following incubation in 1% calcium (II)chloride and 2% cobalt (II) chloride, a black insolublecompound was developed in 1% ammonium sulfide for50 s leading to a black staining of type I fibers and greystaining of type II fibers. Subsequently, the sections wereanalyzed by light microscopy (Leica DMI 6000B) for cal-culating the type I and type II fiber percentages. Fibertyping was carried out in the best five images out of tenstained sections per muscle and animal, and all fiberswithin a 100 cm2 area were calculated. This area corre-sponded to about 60 fibers. Thus, a total of 300 fiberswere calculated per animal and muscle.
Determination of nicotinic acid and nicotinamideconcentrations in plasmaConcentrations of nicotinic acid and nicotineamide inplasma were determined by LC-MS/MS according to themethod from Liu et al. [21].
Determination of plasma lipidsThe plasma concentrations of TAG and NEFA weremeasured using enzymatic reagent kits from MerckEurolab (ref. 113009990314) and from Wako Chemicals(ref. RD291001200R), respectively.
RNA isolation and qPCR analysisRNA isolation, cDNA synthesis qPCR analysis were per-formed as described recently in detail [22]. In brief, totalRNA was isolated from 25–30 mg skeletal muscle aliquotsusing Trizol™ reagent (Invitrogen, Karlsruhe, Germany),and RNA concentration and purity were estimated fromthe optical density at 260 and 280 nm (Infinite 200 Mmicroplate reader, Tecan, Männedorf, Switzerland).RNA integrity was assessed by confirming intact bandscorresponding to the 18S and 28S ribosomal RNA
subunits using 1% agarose gel electrophoresis. FollowingcDNA synthesis within one week after RNA isolationusing dT18 primer and M-MuLV Reverse Transcriptase(MBI Fermentas, St. Leon-Rot, Germany), qPCR ana-lysis was performed as described recently in detail [22].Features of gene-specific primer pairs are listed in Table 1.Calculation of gene expression data and normalization byGeNorm normalization factor were carried out as de-scribed recently [22]. The normalization factor was calcu-lated as the geometric mean of expression data of thethree most stable out of six tested potential referencegenes (RPL19, YWHAZ, RPS26, MDH1, B2M, andGAPDH). In each muscle the three most stable referencegenes were the same (the stability score M as calculatedby GeNorm is shown in brackets): LD muscle: RPL19(0.025), YWHAZ (0.026), and RPS26 (0.029); SM muscle:RPL19 (0.026), YWHAZ (0.028), and RPS26 (0.028); STmuscle: RPL19 (0.033), YWHAZ (0.037), and RPS26(0.040). Means and SD were calculated from normalizedexpression data for samples of the same treatment group.The mean of the group control was set to 1 and mean andSD of the niacin group were scaled proportionally. Dataon qPCR performance for target and reference genes mea-sured in skeletal muscle are shown in Table 2.
ImmunoblottingPreparation of homogenates, determination of proteinconcentration and immunoblotting were performed asdescribed recently in detail [23]. In brief, proteins wereseparated by 12,5% SDS-PAGE, transferred to a nitrocel-lulose membrane and incubated with primary antibodiesagainst PGC-1α (dilution 1:1000; polyclonal anti-PGC-1αantibody; Millipore, Temecula, CA), PPARδ (dilution 1:1000;polyclonal anti-PGC-1α antibody; Abcam, Cambridge, UK),and glyceraldehyde-3-phosphate dehydrogenase (GAPDH)(dilution 1:5000; monoclonal anti-GAPDH antibody, Abcam,Cambridge, UK) as a reference protein. Nitrocellulose mem-branes were washed, and subsequently incubated with ahorseradish peroxidase conjugated secondary monoclonalanti-mouse-IgG antibody (Abcam, Cambridge, UK) forGAPDH and polyclonal anti-rabbit-IgG antibody (Sigma-Aldrich, St. Louis, Germany) for PGC-1α, and PPARδ atroom temperature. Finally, blots were developed by eitherECL Select or ECL Prime (both GE Healthcare, Munich,Germany), respectively, and the intensities of the specificbands detected with a Bio-Imaging system (Syngene,Cambridge, UK) and quantified by Syngene GeneToolssoftware (nonlinear dynamics).
StatisticsData were statistically analysed by Student’s t-test usingthe Minitab Statistical Software (Rel. 13.0, State College,PA, USA). Means were considered significantly differentfor P < 0.05. Data presented are shown as means ± SD.

Table 2 qPCR performance data
Gene Slope R2# Efficiency*
B2M −3.20 0.999 2.05
COX5A −3.22 0.999 2.04
COX6A1 −2.99 0.997 2.16
CPT1B −3.79 0.996 1.84
GAPDH −2.97 0.999 2.17
MDH1 −3.21 0.999 2.05
MHCI −3.37 1.000 1.98
MHCIIA −3.21 0.998 2.05
MHCIIX −3.29 0.999 2.01
PPARD −3.05 0.967 2.13
PPARGC1A −3.34 0.999 1.99
PPARGC1B −3.29 0.956 2.01
RPL19 −3.31 0.997 2.00
RPS26 −3.72 0.998 1.86
SDHA −3.12 0.999 2.09
SLC25A20 −3.81 0.980 1.83
VEGFA −3.31 0.997 2.00
YWHAZ −3.34 0.993 1.99#Coefficient of determination of the standard curve.*The efficiency is determined by [10(−1/-slope].
Table 1 Characteristics of primers used for qPCR
Gene Forward primer (3′-5′) Reverse primer (5′-3′) Product length (bp) Tm (°C) NCBI Genbank
Reference genes
B2M GCGTATTCCAGAGGTCCAGG CGGCAGCTGTACTGATCCTT 234 60 NM_001009284
GAPDH GGCGTGAACCACGAGAAGTA GCAGGGATGATGTTTTGGGC 227 60 AF022183
MDH1 TACGTGTTCCCTGGAGTTGC TGCTTCCTTGTTTGGGGGTT 249 57 NM_001135220
RPL19 AGCCTGTGACTGTCCATTCC TTCTCGGGCATTCGAGCATT 118 57 JN811679
RPS26 ACAACGGTCGTGCCAAAAAG AAATCGGGGTGGAGGTGTTC 284 57 NM_001009435
YWHAZ AGACGGAAGGTGCTGAGAAA TGGGGATCAAGAACTTTTCCAA 120 57 JN811681
Target genes
COX5A GCTCGCTGGGTGACATACTT ACCTCTAGGATGCGAACTGC 173 60 AF233074
COX6A1 TGCAGCTGAGTCGGTGTATG GAACTCGGGTCTCTCCTCCT 161 60 GU585577
CPT1B GACGTTTCCATGGGACTGGT GCCAGCGTCTCCATTCGATA 389 60 NM_001009259
MHCI TCGTCAAGGCCACAATTTTG CTGTCGCAACACCTGGTCCT 100 60 AB058898
MHCIIA AAGCCTTTTGATGCCAAGACAT TTCACCGTCACTTTCCCACC 100 60 AB058896
MHCIIX CTTCGTGGCGGACCCTAAG CAGTTACTGTCGCCCCAGCT 100 60 AB058897
PPARD TCAGCGTGCACGTCTTCTAC CAGGAATTCCCGGGTGACAA 230 59 XM_004018769
PPARGC1A GGTGACCATGACTATTGTCAG CTCGGATTTCCTGGTCTTGAA 216 58 XM_004009738
PPARGC1B CTGGACCGAGTTCTCCATCC CACGTGCCCTTTCACCTGCA 244 61 XM_004008965
SDHA GTTTGAGCAGCACTGGAGGA AGTCGGTCTCGTTCAAAGTCC 110 60 DQ386895
SLC25A20 CCGAGGGATCTACAAGGGGA CCTTCATCCCGGATCAGCTC 288 61 NM_001127277
VEGFA GGACATCTTCCAGGAGTACC GCATGGTGATGTTGAACTCCT 137 58 EU857623
Khan et al. Acta Veterinaria Scandinavica 2013, 55:85 Page 4 of 10http://www.actavetscand.com/content/55/1/85
ResultsFinal body weight, body weight gain and carcass weightFinal body weights, daily body weight gain and carcassweights did not differ between the control group and theniacin group (Final body weight: 37.4 ± 2.3 vs. 37.8 ± 3.7 kg;daily body weight gain: 308 ± 50 vs. 308 ± 41 g; carcassweight: 17.2 ± 1.4 vs. 17.3 ± 2.4 kg; control group vs. niacingroup; n = 8/group).
Concentrations of nicotinic acid and its metabolitenicotinamide in plasmaThe plasma concentrations of nicotinic acid and its me-tabolite nicotinamide were greater in the niacin groupthan in the control group (nicotinic acid: 0.41 ± 0.31 vs.0.75 ± 0.42 μg/mL; nicotinamide: 0.46 ± 0.25 vs. 3.42 ±0.90 μg/mL; control group vs. niacin group; P < 0.05).
Lipid concentrations in plasmaIn order to assess the lipid-lowering properties of niacinin sheep, we determined the plasma concentrations ofNEFA and TAG. The plasma TAG concentration tendedto be lower in the niacin group than in the controlgroup (0.20 ± 0.02 vs. 0.17 ± 0.03 mmol/L; control groupvs. niacin group; P < 0.1). The plasma NEFA concentra-tion did not differ between the niacin and the controlgroup (0.32 ± 0.11 vs. 0.29 ± 0.14 mmol/L; control groupvs. niacin group).

Khan et al. Acta Veterinaria Scandinavica 2013, 55:85 Page 5 of 10http://www.actavetscand.com/content/55/1/85
Muscle fiber type composition and expression offiber-specific myosin heavy chain (MHC) isoformsin skeletal musclesTo evaluate an effect of niacin on fiber type distribution,muscle fiber typing and transcript level measurement offiber-specific MHC isoforms was carried out. As shownin Figure 1A, the percentage number of type I fibers inLD muscle, SM muscle and ST muscle was greater inthe niacin group than in the control group, whereas thepercentage number of type II fibers was less in niacingroup than in the control group (P < 0.05). The PCRprimers used to detect transcript levels of sheep MHCisoforms corresponding to MHCI, MHCIIA and MHCIIXhave been designed based on available sheep partial-
Control Niacin
ALD muscle
Type I fibers
Rel
ativ
e m
RN
Ale
vel
(fo
ldo
fco
ntr
ol )
Rel
ativ
e m
RN
Ale
vel
(fo
ldo
fco
ntr
ol)
Control
% o
fto
tal f
iber
s
% o
fto
tal f
iber
s
Control
0
10
20
30
40
50
60
70
80
90
100
Control
*
*
0
10
20
30
40
50
60
70
80
90
100
Control Niacin
B
SM mus
LD muscle SM mu
* *
0.00
0.50
1.00
1.50
2.00
MHCI MHCIIA MHCIIX
*
0.00
0.50
1.00
1.50
2.00
2.50
3.00
3.50
MHCI
Figure 1 Muscle fiber type distribution (A), and relative mRNA levelsST muscle of sheep administered either no (control group) or 1 g nian = 8 sheep/group. Representative images from fiber typing for each grou“black” areas being the type I fibers and the “grey” ones being the type II fgroup, P < 0.15.
length cDNA sequences [24]. Specific PCR primers forsheep MHCIIB transcripts could not be designed becauseno sheep MHCIIB cDNA sequence is available in nucleicacid databases. As shown in Figure 1B, the mRNA level oftype I-specific MHCI in SM muscle and ST muscle wasincreased in the niacin group compared to the controlgroup (P < 0.05). In LD muscle, the mRNA level of MHCIwas numerically greater in the niacin group relative to thecontrol group (P = 0.24). The mRNA level of MHCIIAwas decreased in LD muscle and SM muscle of the niacingroup compared to the control group (P < 0.05), but didnot differ between groups in ST muscle. The mRNA levelof MHCIIX in LD muscle and SM muscle was signifi-cantly less (P < 0.05) and tended to be less (P < 0.15),
*
*
0
10
20
30
40
50
60
70
80
90
100
Control Niacin
Type II fibers
Niacin
% o
fto
tal f
iber
s
Niacin Control Niacin
*
*
Niacin
cle ST muscle
scle ST muscle
* #
MHCIIA MHCIIX
*
0.00
0.50
1.00
1.50
2.00
2.50
3.00
3.50
4.00
4.50
5.00
MHCI MHCIIA MHCIIX
Rel
ativ
e m
RN
Ale
vel
(fo
ldo
fco
ntr
ol )
of fiber-specific MHC isoforms (B) of LD muscle, SM muscle, andcin per day (niacin group) for 4 wk. Bars represent means ± SD,p are shown below the graph showing fiber type distribution, with theibers. *different from control group, P < 0.05, #different from control

Khan et al. Acta Veterinaria Scandinavica 2013, 55:85 Page 6 of 10http://www.actavetscand.com/content/55/1/85
respectively, in the niacin group than in the control group.In ST muscle, the mRNA level of MHCIIX was not differ-ent between groups.
Expression of key regulators of muscle fiber transition inskeletal musclesTo explore the mechanisms underlying the niacin-induced muscle fiber transition we determined mRNAand/or protein levels of the key regulators of musclefiber transition, PGC-1α, PGC-1β and PPARδ, in thethree muscles. The mRNA level of PPARGC1A in all threemuscles was greater in the niacin group than in the controlgroup (P < 0.05; Figure 2). The mRNA level of PPARGC1Bwas greater in LD muscle (P < 0.05) and tended to begreater in SM muscle and ST muscle (P < 0.15) of the nia-cin group than in the control group (Figure 2). The mRNAlevel of PPARD was increased in LD muscle and STmuscle (P < 0.05) and tended to be increased in SM muscle(P < 0.15; Figure 2). The protein level of PGC-1α was ele-vated in LD muscle and SM muscle of the niacin groupcompared to the control group (P < 0.05), but did not differin ST muscle between groups (Figure 2). The protein levelof PPARδ in all three muscles did not differ betweengroups.
Expression of genes involved in fatty acid oxidation,mitochondrial respiratory chain and angiogenesis inskeletal musclesSince PGC-1α and PPARδ are important regulators ofgenes involved in fatty acid oxidation, mitochondrial re-spiratory chain and angiogenesis, we determined mRNAlevels of CPT1B and SLC25A20, which encode two en-zymes of the carnitine shuttle system, SDHA, whichencodes the tricarboxylic acid cycle (TCA) enzyme suc-cinate dehydrogenase, COX6A1 and COX5A, which en-code two subunits of the respiratory chain complex IV(cytochrome c oxidase), and VEGFA encoding the angio-genic factor VEGF-a. Relative mRNA levels of COX5A,COX6A1, VEGFA, CPT1B, and SLC25A20 in all threemuscles were greater in the niacin group than in thecontrol group (P < 0.05; Figure 3). In addition, the rela-tive mRNA level of SDHA in SM muscle and ST musclewas greater in the niacin group than in the controlgroup (P < 0.05; Figure 3). In LD muscle, the mRNAlevel of SDHA tended to be greater in the niacin groupthan in the control group (P < 0.15; Figure 3).
DiscussionIn the present study we tested the hypothesis that, likein rats and pigs [14,15], niacin supplementation inducesmuscle fiber transition from type II (glycolytic) to type I(oxidative), and thereby an oxidative metabolic pheno-type of skeletal muscle in sheep as a ruminant model.The dietary niacin dosage (1 g niacin per day) given to
the sheep related to 27–35 mg/kg body weight which isonly slightly below that given to the rats (40–54 mg/kgbody weight [14]) and pigs (30–49 mg/kg body weight[15]) in our recent studies and which was shown toinduce a muscle fiber switch from type II to type I inskeletal muscle. The niacin dosage administered bydrenching to the sheep of the niacin group was markedlyhigher than that taken up from the feed ration (hay andconcentrate) by the sheep of the control group, becauseaccording to literature data the native concentration ofniacin in hay and the main components of the concen-trate is below 100 mg/kg dry matter [18]. In line withthis, the niacin administration to the sheep caused a sig-nificant increase in the plasma concentration of the nic-otinic acid metabolite nicotinamide. In addition, it hasto be considered that the sheep used in this study hadalready fully developed rumen. This means that the nia-cin requirement for the sheep was covered from niacinsynthesized by the rumen microbes and that the niacinfrom the ingested hay and concentrate was largely de-graded by rumen microbes [25]. In contrast, the drench-ing procedure, which was used to administer the dailyniacin bolus, is a suitable approach to ensure that themain part of the administered niacin bypasses the rumenand reaches the small intestine. In the present study, weconsidered three different skeletal muscles, LD, SM andST, containing predominantly type II fibers (the type IIfiber percentage in all three muscles in the control groupwas approximately 81%), because we expected an effectof niacin only in skeletal muscles with a high percentageof type II fibers. The main finding of the present study isthat supplementation of niacin induces muscle fiberswitching also in skeletal muscles of sheep. Muscle fibertyping revealed that the type I fiber percentage in thethree muscles investigated increased from approximately18–20% in the control group to 30–31% in the niacingroup, whereas the type II fiber percentage decreasedfrom 81% to 69%. In line with this, we observed that themRNA level of the type I-specific MHCI was signifi-cantly greater in SM muscle and ST muscle and tendedto be greater in LD muscle, but the mRNA levels of typeII-specific MHC isoforms in LD and SM muscle wereless in the niacin group than in the control group.Regarding that muscle fiber transition is induced on
the molecular level by an increased activity of PGC-1α,PGC-1β and PPARδ [4,5,26,27], we determined themRNA and/or protein levels of these key regulators inthe three muscles. We found that the mRNA level ofPPARGGC1A in all three muscles was markedly ele-vated, and the mRNA levels of PPARGC1B and PPARDin all three muscles were either significantly increased ortended to be increased in the niacin group compared tothe control group. In addition, the protein level of PGC-1α in two of three muscles was greater in the niacin than

*
*
*
0.00
0.50
1.00
1.50
2.00
2.50
3.00
3.50
PPARGC1A PPARGC1B PPARD
*#
#
0.00
1.00
2.00
3.00
4.00
5.00
6.00
7.00
8.00
PPARGC1A PPARGC1B PPARD
*
#
*
0.00
1.00
2.00
3.00
4.00
5.00
6.00
7.00
8.00
9.00
10.00
PPARGC1A PPARGC1B PPARD
Rel
ativ
e m
RN
A le
vel
(fo
ld o
f co
ntr
ol)
R
elat
ive
mR
NA
leve
l(f
old
of
con
tro
l)
Rel
ativ
e m
RN
A le
vel
(fo
ld o
f co
ntr
ol)
Rel
ativ
e p
rote
in le
vel
(fo
ld o
f co
ntr
ol)
R
elat
ive
pro
tein
leve
l(f
old
of
con
tro
l)
Rel
ativ
e p
rote
in le
vel
(fo
ld o
f co
ntr
ol)
Niacin
Control
Niacin
Control
Niacin
Control
LD muscle
SM muscle
ST muscle
A B
PGC-1α
PPARδ
GAPDH
Control Niacin
*
0.00
0.20
0.40
0.60
0.80
1.00
1.20
1.40
1.60
1.80
PGC-1α PPARδ
*
0.00
0.50
1.00
1.50
2.00
2.50
3.00
3.50
PGC-1α PPARδ
PGC-1α
PPARδ
GAPDH
Control Niacin
PGC-1α
PPARδ
GAPDH
Control Niacin
Niacin
Control
Niacin
Control
Niacin
Control
0.00
0.50
1.00
1.50
2.00
PGC-1α PPARδ
LD muscle
SM muscle
ST muscle
Figure 2 (See legend on next page.)
Khan et al. Acta Veterinaria Scandinavica 2013, 55:85 Page 7 of 10http://www.actavetscand.com/content/55/1/85
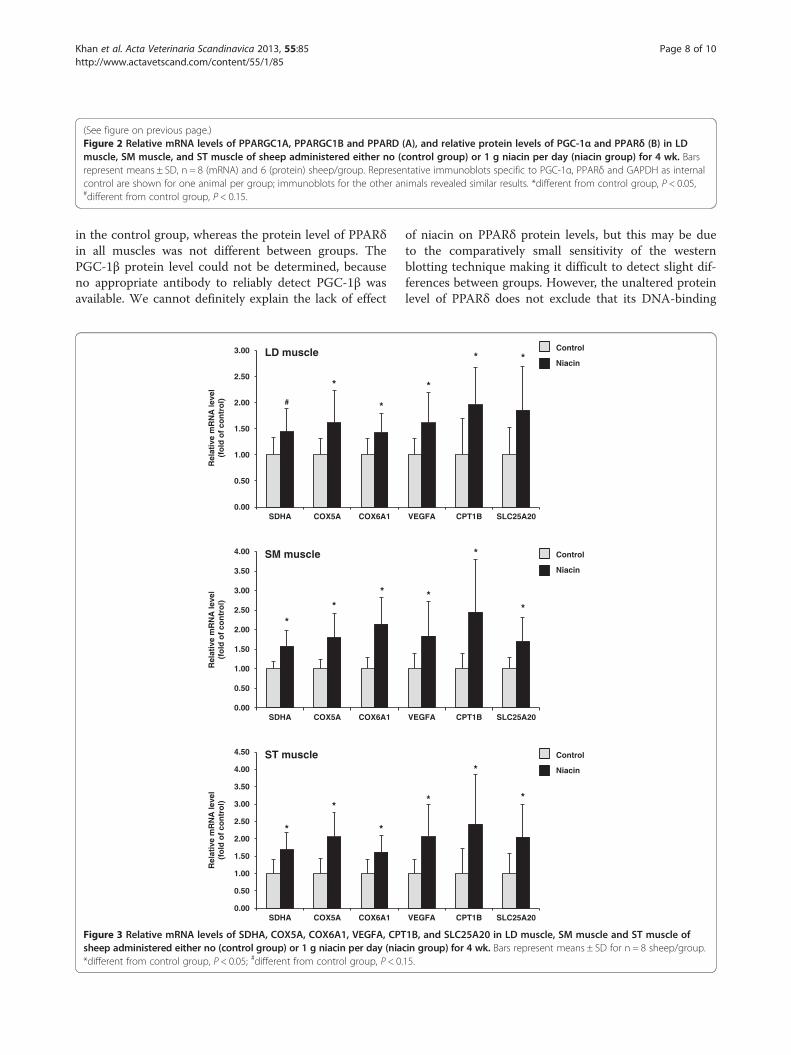
(See figure on previous page.)Figure 2 Relative mRNA levels of PPARGC1A, PPARGC1B and PPARD (A), and relative protein levels of PGC-1α and PPARδ (B) in LDmuscle, SM muscle, and ST muscle of sheep administered either no (control group) or 1 g niacin per day (niacin group) for 4 wk. Barsrepresent means ± SD, n = 8 (mRNA) and 6 (protein) sheep/group. Representative immunoblots specific to PGC-1α, PPARδ and GAPDH as internalcontrol are shown for one animal per group; immunoblots for the other animals revealed similar results. *different from control group, P < 0.05,#different from control group, P < 0.15.
Khan et al. Acta Veterinaria Scandinavica 2013, 55:85 Page 8 of 10http://www.actavetscand.com/content/55/1/85
in the control group, whereas the protein level of PPARδin all muscles was not different between groups. ThePGC-1β protein level could not be determined, becauseno appropriate antibody to reliably detect PGC-1β wasavailable. We cannot definitely explain the lack of effect
Rel
ativ
e m
RN
Ale
vel
(fo
ldo
fco
ntr
ol )
Rel
ativ
e m
RN
Ale
vel
(fo
ldo
fco
ntr
ol)
Rel
ativ
e m
RN
Ale
vel
(fo
ldo
fco
ntr
ol)
LD muscle
SM muscle
ST muscle
#
*
*
0.00
0.50
1.00
1.50
2.00
2.50
3.00
SDHA COX5A COX6A1
*
**
0.00
0.50
1.00
1.50
2.00
2.50
3.00
3.50
4.00
SDHA COX5A COX6A1
*
*
*
0.00
0.50
1.00
1.50
2.00
2.50
3.00
3.50
4.00
4.50
SDHA COX5A COX6A1
Figure 3 Relative mRNA levels of SDHA, COX5A, COX6A1, VEGFA, CPTsheep administered either no (control group) or 1 g niacin per day (nia*different from control group, P < 0.05; #different from control group, P < 0.
of niacin on PPARδ protein levels, but this may be dueto the comparatively small sensitivity of the westernblotting technique making it difficult to detect slight dif-ferences between groups. However, the unaltered proteinlevel of PPARδ does not exclude that its DNA-binding
Niacin
Control
Niacin
Control
Niacin
Control
*
* *
VEGFA CPT1B SLC25A20
*
*
*
VEGFA CPT1B SLC25A20
*
*
*
VEGFA CPT1B SLC25A20
1B, and SLC25A20 in LD muscle, SM muscle and ST muscle ofcin group) for 4 wk. Bars represent means ± SD for n = 8 sheep/group.15.

Khan et al. Acta Veterinaria Scandinavica 2013, 55:85 Page 9 of 10http://www.actavetscand.com/content/55/1/85
activity was increased because it is known that PGC-1αand PGC-1β, whose genes expression was clearly in-creased, act as coactivators of PPARδ and enhance thetransactivation activity of PPARδ [28]. Therefore, ourfinding suggests that niacin supplementation increasesthe transcriptional activity of these critical regulators ofmuscle fiber transition, and thus provides an explanationfor the increased type I fiber content in skeletal musclesof niacin-treated sheep.Type I fibers, also called slow-twitch oxidative fibers,
contain a high number of mitochondria, have a high oxi-dative capacity, and preferentially use fatty acids for en-ergy production [8,9]. This oxidative metabolic phenotypeof type I fibers is the consequence of a markedly higherexpression of genes involved in fatty acid transport anduptake, β-oxidation, carnitine shuttle, TCA cycle and re-spiratory chain compared to glycolytic type II fibers[26,27]. In addition, type I fibers exhibit a higher expres-sion of angiogenic factors, like VEGFA, which favors thepreferential use of fatty acids by type I fibers because an-giogenic factors increase capillary density and therebyblood perfusion but also the expression of fatty acid trans-port proteins [29]. In the present study we could demon-strate that several genes encoding proteins involved inoxidative metabolism (SDHA, COX5A, COX6A1, VEGFA,CPT1B, SLC25A20) were up-regulated in the muscles ofthe niacin group compared to the control group which isin line with the niacin-induced changes in fiber type distri-bution and expression of MHC isoforms. Although we didnot provide data showing that the increased expression ofoxidative genes is also accompanied by an enhanced activ-ity of the encoded enzymes and an elevated capillary dens-ity, we suggest that the niacin-induced changes in skeletalmuscle mRNA levels are indicative of an improved oxida-tive capacity because it is well known that the changes inthe muscle’s metabolic and contractile phenotype are in-duced at the transcriptional level through an enhanced ac-tivity of PGC-1α and PPARδ [26,27].
ConclusionsThe results of this study show that niacin supplementationin sheep as a model for ruminants induces muscle fibertransition from type II (glycolytic) to type I (oxidative)being indicative of a change of the muscle’s metabolicphenotype towards a more oxidative one. An enhancedcapacity of skeletal muscle to utilize fatty acids in rumi-nants might be particularly useful during metabolic statesin which fatty acids are extensively mobilized from adi-pose tissue, such as during the early lactating period inhigh producing cows. In addition, considering that sev-eral studies have reported that oxidative muscles with ahigh percentage of type I fibers have a lower glycolyticpotential, a darker color and a higher ultimate pH[30-32], the niacin-induced change in the muscle’s fiber
type distribution may influence meat quality. At least inpigs it was demonstrated that oxidative muscle typestend to develop dark, firm and dry pork in response tointense physical activity and/or high psychological stresslevels preslaughter [33]. Thus future studies have to in-vestigate whether niacin administration influences meatquality from sheep.
Competing interestsThe authors declare that they have no competing interests.
Authors’ contributionsMK conducted the animal experiment, performed fiber typing, PCR analyses,blood lipid analyses and statistical analyses, and wrote the manuscript. ACand JFK performed immunoblotting. EM performed nicotinic acid andnicotinamide determination in blood. FCM and KK analysed data frommuscle fiber typing. RR supervised PCR analyses, immunoblotting andstatistical analysis and helped to draft the manuscript. KE conceived of thestudy, participated in its design and coordination and helped to draft themanuscript. All authors read and approved the final manuscript.
Author details1Institute of Animal Nutrition and Nutrition Physiology,Justus-Liebig-University Giessen, Heinrich-Buff-Ring 26-32, 35390 Giessen,Germany. 2Department of Sports Medicine, Justus-Liebig-University Giessen,Kugelberg 62, 35394 Giessen, Germany.
Received: 8 May 2013 Accepted: 12 November 2013Published: 22 November 2013
References1. Gille A, Bodor ET, Ahmed K, Offermanns S: Nicotinic acid: pharmacological
effects and mechanisms and mechanisms of action. Annu Rev PharmacolToxicol 2008, 48:79–106.
2. Choi S, Yoon H, Oh KS, Oh YT, Kim YI, Kang I, Youn JH: Widespread effectsof nicotinic acid on gene expression in insulin-sensitive tissues: implica-tions for unwanted effects of nicotinic acid treatment. Metabolism 2011,60:134–144.
3. Watt MJ, Southgate RJ, Holmes AG, Febbraio MA: Suppression of plasmafree fatty acids upregulates peroxisome proliferator-activated receptor(PPAR) α and δ and PPAR coactivator 1α in human skeletal muscle, butnot lipid regulatory genes. J Mol Endocrinol 2004, 33:533–544.
4. Wang YX, Zhang CL, Yu RT, Cho HK, Nelson MC, Bayuga-Ocampo CR, Ham J,Kang H, Evans RM: Regulation of muscle fiber type and running enduranceby PPARδ. PLoS Biol 2004, 2:e294.
5. Schuler M, Ali F, Chambon C, Duteil D, Bornert JM, Tardivel A, Desvergne B,Wahli W, Chambon P, Metzger D: PGC1α expression is controlled in skeletalmuscles by PPAR β, whose ablation results in fiber-type switching, obesity,and type 2 diabetes. Cell Metab 2006, 4:407–414.
6. Chinsomboon J, Ruas J, Gupta RK, Thom R, Shoag J, Rowe GC, Sawada N,Raghuram S, Arany Z: The transcriptional coactivator PGC-1alpha mediatesexercise-induced angiogenesis in skeletal muscle. Proc Natl Acad Sci USA2009, 106:21401–21406.
7. Pette D, Staron RS: Cellular and molecular diversities of mammalianskeletal muscle fibers. Rev Physiol Biochem Pharmacol 1990, 116:1–76.
8. Peter JB, Barnard RJ, Edgerton VR, Gillespie CA, Stempel KE: Metabolicprofiles of three fiber types of skeletal muscle in guinea pigs andrabbits. Biochemistry 1972, 11:2627–2633.
9. Barnard RJ, Edgerton VR, Furukawa T, Peter JB: Histochemical, biochemical,and contractile properties of red, white, and intermediate fibers. Am JPhysiol 1971, 220:410–414.
10. Waters RE, Rotevatn S, Li P, Annex BH, Yan Z: Voluntary running inducesfiber type-specific angiogenesis in mouse skeletal muscle. Am J PhysiolCell Physiol 2004, 287:C1342–1348.
11. Cassano P, Sciancalepore AG, Pesce V, Flück M, Hoppeler H, Calvani M,Mosconi L, Cantatore P, Gadaleta MN: Acetyl-L-carnitine feeding tounloaded rats triggers in soleus muscle the coordinated expression ofgenes involved in mitochondrial biogenesis. Biochim Biophys Acta 2006,1757:1421–1428.

Khan et al. Acta Veterinaria Scandinavica 2013, 55:85 Page 10 of 10http://www.actavetscand.com/content/55/1/85
12. Fujita N, Nagatomo F, Murakami S, Kondo H, Ishihara A, Fujino H:Effects of hyperbaric oxygen on metabolic capacity of the skeletalmuscle in type 2 diabetic rats with obesity. Scientific World Journal2012, 2012:637978.
13. Nagatomo F, Fujino H, Kondo H, Gu N, Takeda I, Ishioka N, Tsuda K, Ishihara A:PGC-1α mRNA level and oxidative capacity of the plantaris muscle inrats with metabolic syndrome, hypertension, and type 2 diabetes. ActaHistochem Cytochem 2011, 44:73–80.
14. Ringseis R, Rosenbaum S, Gessner DK, Herges L, Kubens JF, Mooren FC,Krüger K, Eder K: Supplementing obese Zucker rats with niacin inducesthe transition of glycolytic to oxidative skeletal muscle fibers. J Nutr 2013,143:125–131.
15. Khan M, Ringseis R, Mooren FC, Krüger K, Most E, Eder K: Niacinsupplementation increases the number of oxidative type I fibers inskeletal muscle of growing pigs. BMC Vet Res 2013, 9:177.
16. Arany Z, Lebrasseur N, Morris C, Smith E, Yang W, Ma Y, Chin S, Spiegelman BM:The transcriptional coactivator PGC-1β drives the formation of oxidativetype IIX fibers in skeletal muscle. Cell Metab 2007, 5:35–46.
17. Bell AW: Lipid metabolism in liver and selected tissues and in the wholebody of ruminant animals. Prog Lipid Res 1980, 18:117–164.
18. Jeroch H, Flachowsky G, Weißbach F: Futtermittelkunde. Stuttgart: GustavFischer Verlag; 1993.
19. National Research Council: Guide for the care and use of laboratory animals.Washington DC: National Institutes of Health; 1985. Publicationno. 85–23 (rev.).
20. Hämäläinen N, Pette D: The histochemical profiles of fast fiber types IIB,IID, and IIA in skeletal muscles of mouse, rat, and rabbit. J HistochemCytochem 1993, 41:733–743.
21. Liu M, Zhang D, Wang X, Zhang L, Han J, Yang M, Xiao X, Zhang Y, Liu H:Simultaneous quantification of niacin and its three main metabolites inhuman plasma by LC–MS/MS. J Chromatogr B 2012, 904:107–114.
22. Keller J, Ringseis R, Koc A, Lukas I, Kluge H, Eder K: Supplementation withl-carnitine downregulates genes of the ubiquitin proteasome system inthe skeletal muscle and liver of piglets. Animal 2012, 6:70–78.
23. Ringseis R, Mooren F, Keller J, Couturier A, Wen G, Hirche F, Stangl GI, Eder K,Krüger K: Regular endurance exercise improves the diminished hepaticcarnitine status in mice fed a high-fat diet. Mol Nutr Food Res 2011,55(Suppl 2):S193–202.
24. Hemmings KM, Parr T, Daniel ZCTR, Picard B, Buttery PJ, Brameld JM:Examination of myosin heavy chain isoform expression in ovine skeletalmuscles. J Anim Sci 2009, 87:3915–3922.
25. Santschi DE, Berthiaume R, Matte JJ, Mustafa AF, Girard CL: Fate ofsupplementary B-vitamins in the gastrointestinal tract of dairy cows.J Dairy Sci 2005, 88:2043–2054.
26. Lin J, Wu H, Tarr PT, Zhang C, Wu Z, Boss O, Michael LF, Puigserver P, Isotani E,Olson EN, Lowell BB, Bassel-Duby R, Spiegelman BM: Transcriptionalco-activator PGC-1α drives the formation of slow-twitch muscle fibres.Nature 2002, 418:797–801.
27. Lin J, Handschin C, Spiegelman BM: Metabolic control through the PGC-1family of transcription coactivators. Cell Metab 2005, 1:361–370.
28. Yu S, Reddy JK: Transcription coactivators for peroxisome proliferator-activated receptors. Biochim Biophys Acta 2007, 1771:936–951.
29. Hagberg CE, Falkevall A, Wang X, Larsson E, Huusko J, Nilsson I, van Meeteren LA,Samen E, Lu L, Vanwildemeersch M, Klar J, Genove G, Pietras K, Stone-Elander S,Claesson-Welsh L, Ylä-Herttuala S, Lindahl P, Eriksson U: Vascular endothelialgrowth factor B controls endothelial fatty acid uptake. Nature 2010,464:917–921.
30. Monin G, Mejenes-Quijano A, Talmant A, Sellier P: Influence of breed andmuscle metabolic type on muscle glycolytic potential and meat pH inpigs. Meat Sci 1987, 20:149–158.
31. Fernandez X, Meunier-Salaün M-C, Ecolan P: Glycogen depletion accordingto muscle and fibre types in response to dyadic encounters in pigs(Sus scrofa domesticus)–relationships with plasma epinephrine andaggressive behaviour. Comp Biochem Physiol A Physiol 1994, 109:869–879.
32. Brewer MS, Zhu LG, Bidner B, Meisinger DJ, McKeith FK: Measuring porkcolor: effects of bloom time, muscle, pH and relationship to instrumentalparameters. Meat Sci 2001, 57:169–176.
33. Hambrecht E, Eissen JJ, Newman DJ, Smits CHM, Verstegen MWA, denHartog LA: Preslaughter handling effects on pork quality and glycolyticpotential in two muscles differing in fiber type composition. J Anim Sci2005, 83:900–907.
doi:10.1186/1751-0147-55-85Cite this article as: Khan et al.: Niacin supplementation induces type IIto type I muscle fiber transition in skeletal muscle of sheep. ActaVeterinaria Scandinavica 2013 55:85.
Submit your next manuscript to BioMed Centraland take full advantage of:
• Convenient online submission
• Thorough peer review
• No space constraints or color figure charges
• Immediate publication on acceptance
• Inclusion in PubMed, CAS, Scopus and Google Scholar
• Research which is freely available for redistribution
Submit your manuscript at www.biomedcentral.com/submit

Discussion
33
4. DISCUSSION
The overall aim of the present thesis was to test the hypothesis that, like in obese Zucker rats
(Ringseis et al., 2013) NA supplementation induces muscle fiber transition from type II
(glycolytic) to type I (oxidative), and thereby increases an oxidative metabolic phenotype of
skeletal muscle in pig as a non-ruminant model and sheep as a ruminant model of farm
animals. Although NA is only necessary in minor quantities to meet metabolic requirements
(NRC, 2001) for the normal functioning of the body, pharmacological doses of NA have the
capability to inhibit lipolysis (Pires et al., 2007). NA has been shown to reduce total
cholesterol and LDL cholesterol levels by an average of 20 to 30%, TAG levels by 35 to 55%,
and increase HDL cholesterol levels by 20 to 35% (Berge et al., 1961; Rivin, 1962; Knopp et
al., 1985; Alderman et al., 1989). These findings have led to the use of high doses of NA, for
the treatment of hypertriglyceridemia/hypercholesterolemia for more than five decades
(Bodor and Offermanns, 2008). The lipid-lowering effects of NA have been extensively
investigated, and traditionally attributed to its antilipolytic effect in adipocytes (Carlson and
Hanngren, 1964; Lukasova et al., 2011), the prevailing mechanisms underlying the
antidyslipidemic effects of NA are shown in Figure 2. NA can decrease the concentration of
FFA and BHBA in blood thus reducing the incidence of ketosis and fatty liver in lactating
dairy cows by inhibiting TAG lipolysis (Schwab et al., 2005; Pires and Grummer, 2007; Pires
et al., 2007). However, the circulating FFA level rebound due to long-term NA treatment
even though its lipid-lowering effects persists (Jin et al., 1997; Wang et al., 2001; de Grooth
et al., 2004; Ganji et al., 2004; Lamon-Fava et al., 2008; Hernandez et al., 2010; Choi et al.,
2011). Thus, in spite of a long history of clinical use, the precise mechanism by which NA
lowers circulating lipids, remains unclear. Nevertheless, it does not appear to be related to
vitamin coenzyme actions because NAM does not have a similar effect (Altschul et al., 1955;
Carlson, 2005). In search for a novel mechanism underlying lipid-lowering effect of NA, in
the present thesis studies, it has been demonstrated for the first time that NA induces muscle
fiber transition from type II (glycolytic) to type I (oxidative) in metabolically healthy growing
pig and sheep. The diagrammatical picture of potential mechanisms underlying the lipid-
lowering effect of NA is presented in Figure 3.
In the present studies, the dietary NA doses given to pigs, related to 30-49 mg/kg body
weight and to sheep, related to 27-35 mg/kg body weight, which is only slightly below that
given to Zucker rats in the recent study (40-54 mg/kg body weight) (Ringseis et al., 2013),
and which was shown to induce a muscle fiber switch from type II to type I in rectus femoris
muscle of Zucker rats. Doses of NA of the Zucker rats study chosen were based on amounts
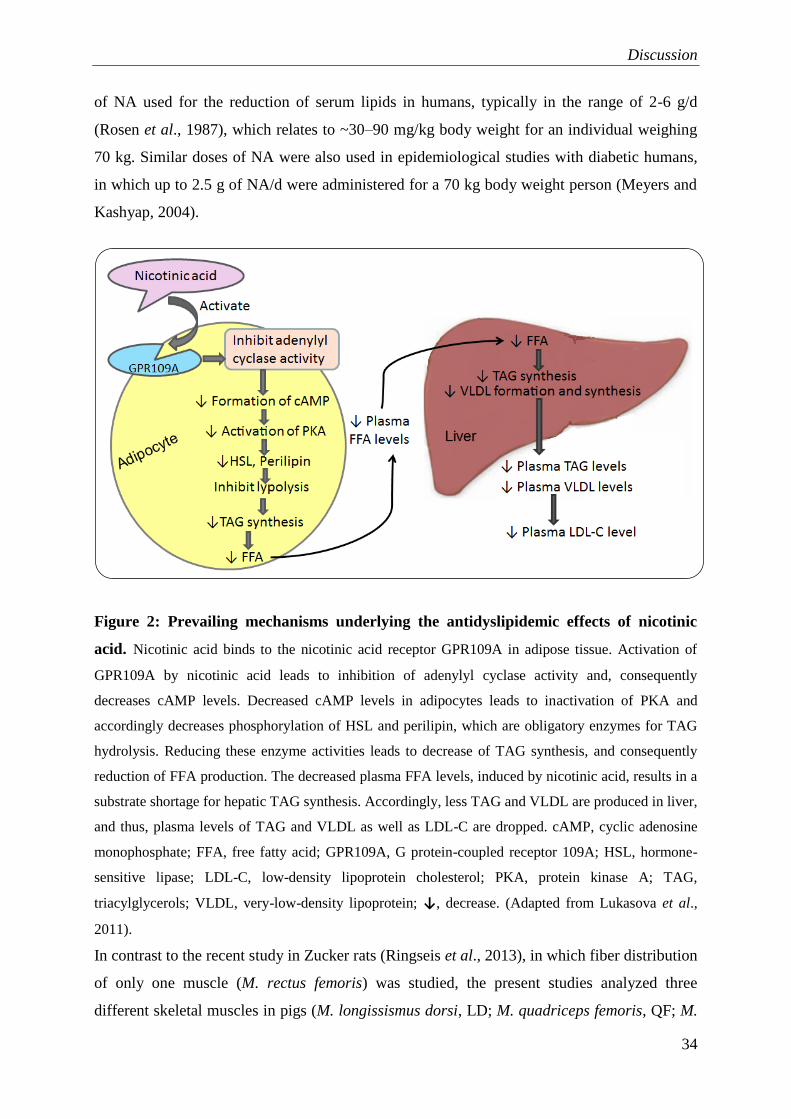
Discussion
34
of NA used for the reduction of serum lipids in humans, typically in the range of 2-6 g/d
(Rosen et al., 1987), which relates to ~30–90 mg/kg body weight for an individual weighing
70 kg. Similar doses of NA were also used in epidemiological studies with diabetic humans,
in which up to 2.5 g of NA/d were administered for a 70 kg body weight person (Meyers and
Kashyap, 2004).
Figure 2: Prevailing mechanisms underlying the antidyslipidemic effects of nicotinic
acid. Nicotinic acid binds to the nicotinic acid receptor GPR109A in adipose tissue. Activation of
GPR109A by nicotinic acid leads to inhibition of adenylyl cyclase activity and, consequently
decreases cAMP levels. Decreased cAMP levels in adipocytes leads to inactivation of PKA and
accordingly decreases phosphorylation of HSL and perilipin, which are obligatory enzymes for TAG
hydrolysis. Reducing these enzyme activities leads to decrease of TAG synthesis, and consequently
reduction of FFA production. The decreased plasma FFA levels, induced by nicotinic acid, results in a
substrate shortage for hepatic TAG synthesis. Accordingly, less TAG and VLDL are produced in liver,
and thus, plasma levels of TAG and VLDL as well as LDL-C are dropped. cAMP, cyclic adenosine
monophosphate; FFA, free fatty acid; GPR109A, G protein-coupled receptor 109A; HSL, hormone-
sensitive lipase; LDL-C, low-density lipoprotein cholesterol; PKA, protein kinase A; TAG,
triacylglycerols; VLDL, very-low-density lipoprotein; ↓, decrease. (Adapted from Lukasova et al.,
2011).
In contrast to the recent study in Zucker rats (Ringseis et al., 2013), in which fiber distribution
of only one muscle (M. rectus femoris) was studied, the present studies analyzed three
different skeletal muscles in pigs (M. longissismus dorsi, LD; M. quadriceps femoris, QF; M.

Discussion
35
gastrocnemius, G) in study 1 and in sheep (LD; M. semimembranosus, SM; M.
semitendinosus, ST) in study 2. All of these muscles contained predominantly type II fibers
(the type II fiber percentage in LD, QF and G muscles in the control group pigs were 81%,
87% and 71%, respectively; in LD, SM, and ST muscles in the control group sheep were
81%, 81% and 82%, respectively), because an effect of NA was expected only in skeletal
muscles with a high percentage of type II fibers. A similar fiber type composition was also
found in rats in the study of Delp and Duan (1996). As expected, muscle fiber typing revealed
that the type I fiber percentage in all three muscles investigated increased from approximately
13-29% in pigs of the control group up to 28-39% in pigs of the NA group, whereas the type
II fiber percentage decreased from 71-87% to 61-72% in study 1. In study 2, the type I fiber
percentage in all three muscles studied increased from about 18-19% in sheep of the control
group up to 30-32% in sheep of the NA group, whereas the type II fiber percentage decreased
from 81-82% to 68-70%. This suggests that the effect of NA on muscle fiber distribution is
largely independent of the muscle type, providing that the muscle contains a sufficient
number of type II fibers.
Figure 3: Diagrammatical picture of potential mechanisms underlying the lipid-
lowering effect of nicotinic acid. Administration of nicotinic acid induces type II to type I muscle
fibers transition in skeletal muscle, which increases the whole body oxidative capacity, and ultimately
decreases the level of plasma lipids. ↑, increase; ↓, decrease.

Discussion
36
Myosin is one of the most abundant proteins in the body and is essential for the body
movement. It is a large protein molecule, which is responsible for muscle contraction,
composed of six amino acid chains: two myosin heavy chains (MHC) and four myosin light
chains (MLC) (Sciote and Morris, 2000). Skeletal muscle fiber can be distinguished by their
MHC isoforms. In line with this, it was observed that the NA-induced fiber switching is also
reflected by changes in the transcript levels of genes encoding fiber-specific MHC isoforms.
Relative mRNA level of the type I fiber-specific MHCI isoform (encoded by MYH7 gene)
tended (P < 0.15) to be higher and type II fiber-specific MHCIIA isoform (encoded by MYH2
gene), and MHCIIB isoform (encoded by MYH4 gene) were reduced or tended (P < 0.15) to
be reduced, respectively, in LD muscle in the NA group compared to the control group of pigs
in study 1. Similarly in study 2, relative mRNA level of the type I-specific MHCI was higher
in SM and ST muscles and tended (P < 0.15) to be higher in LD muscle, but the relative
mRNA levels of type II-specific MHC isoforms (MHCIIA, MHCIIX) in LD and SM muscle
were lower in the NA group compared to the control group of sheep.
It is known that muscle fiber switching is initiated through the upregulation of key regulators
of muscle fiber distribution and muscle metabolic phenotype (Lin et al., 2002b; Wang et al.,
2004; Lin et al., 2005; Schuler et al., 2006) and recently it has been shown that NA
supplementation results in an upregulation of three of these key regulators, namely PPARδ,
PGC-1α and PGC-1β in rectus femoris muscle of rats (Ringseis et al., 2013). PPARδ is the
most abundant PPAR isotype in skeletal muscle (Braissant et al., 1996; Muoio et al., 2002; de
Lange et al., 2006) and has a higher expression in oxidative type I muscle fibers than
glycolytic type II muscle fibers (Wang et al., 2004). PPARδ is involved in many different
biological activities such as lipid and lipoprotein metabolism (Leibowitz et al., 2000; Risérus
et al., 2008), skeletal muscle lipid oxidation (Wang et al., 2004), mitochondrial respiration
(Luquet et al., 2003), thermogenesis (Guardiola-Diaz et al., 1999), and skeletal muscle fiber
type distribution (Wang et al., 2004). Short-term exercise (Watt et al., 2004; Mahoney et al.,
2005), endurance training (Russell et al., 2003; Fritz et al., 2006) and supplemental NA
(Ringseis et al., 2013) lead to increased relative mRNA levels of PPARδ in human and rodent
skeletal muscle. Similarly in sheep there was a significant effect of NA on relative mRNA
levels of PPARδ in LD and ST muscles, and tended (P < 0.15) to be increased in SM muscle
(study 2). To determine the translation level of PPARδ relative mRNA into protein, the
protein levels were analyzed of three muscles by western blot analysis, but the protein level of
PPARδ in any muscle of sheep was not different between groups. It is not clear, why there
was no effect of NA on PPARδ protein levels, but this may be due to the comparatively small

Discussion
37
sensitivity of the western blotting technique making it difficult to detect slight differences
between groups. It was observed, that the transcript levels of relative mRNA of PPARδ in all
three muscles were also not so abundant in both groups. So, the unaltered protein level of
PPARδ does not exclude that its DNA-binding activity was increased because it is known that
PGC-1α and PGC-1β, whose relative mRNA expressions was clearly increased, act as
coactivators of PPARδ and enhance the transactivation activity of PPARδ (Yu and Reddy,
2007).
PGC-1α is a transcription coactivator that coactivates a broad range of transcription factors
that are involved in a wide variety of biological responses including adaptive thermogenesis,
glucose/fatty acid metabolism and fiber type switching in skeletal muscle (Lin et al., 2002b;
Puigserver and Spiegelman, 2003; Lin et al., 2005; Liang and Ward 2006). PGC-1α is also
known as a master regulator of mitochondrial biogenesis (Wu et al., 1999; Fernandez-Marcos
and Auwerx, 2011). PGC-1α is preferentially expressed in type I-rich and type IIA-rich
muscle beds (Lin et al., 2002a). Like PGC-1α, PGC-1β is another member of PGC-1 family
(Puigserver and Spiegelman, 2003; Lin et al., 2002b), also a key regulator of fatty acid
oxidation, oxidative phosphorylation, mitochondrial biogenesis (Liang and Ward 2006, Arany
et al., 2007). PGC-1β is also involved in the regulation of skeletal muscle fiber transition
(conferred a switch toward a more slow myofibers phenotype) (Mortensen et al., 2006). Both
PGC-1α and PGC-1β are more highly expressed in oxidative fibers (Lin et al., 2002a; Arany
et al., 2007), and particularly PGC-1α expression in human and rodent skeletal muscle is
strongly induced by short-term exercise and endurance training (Baar et al., 2002; Russell et
al., 2003; Norrbom et al., 2004; Koves et al., 2005). Though PGC-1β is highly expressed in
skeletal muscle, it does not seem to be regulated by endurance exercise and/or have not been
studied extensively (Meirhaeghe et al., 2003; Arany, 2008). However, in another study it was
demonstrated that PGC-1β knockout causes a decrease of mitochondrial volume, a reduced
expression of genes of the electron transport chain, and a mitochondrial respiration defect in
skeletal muscle of rats (Mortensen et al., 2006). As expected, the relative mRNA levels of
PGC-1α in LD muscle of pigs were numerically increased in NA group in study 1, even
though this effect was not significant, which is attributed to the relatively high standard
deviation of this parameter in both groups of pigs. Moreover, the relative mRNA level of
PGC-1α in all three muscles and protein levels in two skeletal muscles (LD and SM) of sheep
(study 2) were elevated in the NA group compared to control group. As predicted, it has been
observed in study 1 and 2 that, the transcript level of PGC-1β was higher or tended (P < 0.15)
to be higher in all analyzed muscle of pigs and sheep of the NA group compared to control

Discussion
38
group. Thus, the findings of the present studies, suggest that NA supplementation increases
the transcriptional activity of these critical key regulators (PPARδ, PGC-1α and PGC-1β) of
muscle fiber transition, and thus provides an explanation for the increased type I fiber content
in skeletal muscles of NA-treated animals.
Type I fibers, also called slow-twitch oxidative fibers, contain a high number of mitochondria,
have a high oxidative capacity, and preferentially use fatty acids for energy production
(Barnard et al., 1971; Peter et al., 1972). This oxidative metabolic phenotype of type I fibers
is reflected by an elevated expression of genes involved in fatty acid transport and uptake, β-
oxidation, carnitine shuttle, TCA cycle, respiratory chain and oxidative phosphorylation. So,
relative mRNA levels of genes involved in mitochondrial fatty acid uptake and oxidation
(CACT/ SLC25A20- in study 1 and 2; CPT1B- in study 2), mitochondrial fatty acid
transport (FATP1- in study 1), carnitine uptake (OCTN2- in study 1), oxidative
phosphorylation (COX4/1- in study 1; COX5A- in study 2; COX6A1- in study 1 and 2),
citrate cycle (SDHA- in study 1 and 2) and thermogenesis (UCP2, UCP3- in study 1) were
determined in different skeletal muscle of pig and sheep. All of these genes are abundantly
expressed in type I fibers, which is responsible for the oxidative metabolic phenotype and
preferred oxidative phosphorylation for energy production (Peter et al., 1972; Pette and
Staron, 1990). As expected, the relative mRNA levels of all of these genes were higher in the
NA group compared to control group [only UCP2 had tendency (P < 0.15) to increase] in both
pig and sheep of the present studies. Thus, abovementioned changes in skeletal muscle gene
expression induced by NA indicate that as the oxidative type I fibers are increased, the
capacity of the skeletal muscle for oxidative utilization of fatty acids has also increased by
NA administration.
As VEGFA is one of the most potent inducers of angiogenesis and vasculogenesis, a key
regulator of both physiological and pathological angiogenesis (Ferrara et al., 2003; Roy et al.,
2006) and type I fibers exhibit a higher expression of this angiogenic factor, the relative
mRNA level of this gene was measured in study 2. As expected, the relative mRNA level of
VEGFA was higher in the NA group compared to control group in all three muscles of sheep.
This suggests that angiogenesis was stimulated by NA leading to a higher capillary density
which also contributes to an increased utilization of fatty acids in skeletal muscle (Ringseis et
al., 2013). Indeed, VEGFs increase capillary density as well as the expression of endothelial
cell fatty acid transport proteins and thus enhancing fatty acid uptake from blood into skeletal
muscle (Hagberg et al., 2010).

Discussion
39
In contrast to the recent study in obese Zucker rats (Ringseis et al., 2013), NA
supplementation did not induce the well-documented plasma TAG-lowering effect in pigs,
while TAG levels tended (P < 0.15) to be lower in the NA group than in the control group of
sheep. It is not quite surprising because with similar dose of NA there were also no effect of
NA on plasma TAG in healthy human subjects (Poynten et al., 2003). The lack of effect,
however, is probably not due to an insufficient NA dose because the dose was similar as used
in the obese Zucker rat study (Ringseis et al., 2013) and the administered NA dose caused a
significant increase in plasma NA, particularly NAM levels, indicating sufficient
bioavailability in both studies. It is more likely that plasma TAG concentration of pigs was
not lowered because it was yet within the normal range making a further reduction unlikely.
In opposite to the well-documented antilipolytic effect of NA (Gille et al., 2008; Morey et al.,
2011) the plasma FFA concentration of NA group was also not reduced in sheep, but even
increased in pigs, at least numerically. The potential explanation for the non-reduced plasma
FFA levels of NA treatment is rebound of plasma FFA. The increased FFA levels of pigs
(study 1) and the baseline plasma FFA levels in sheep (study 2) are in agreement with the
observations that chronic NA administration for at least 2 weeks results in elevated plasma
FFA levels (Alvarsson and Grill, 1996; Poynten et al., 2003), and this rebound increased up to
fasting FFA levels have been observed in case of more than 2 weeks of NA treatment
(Poynten et al., 2003). It is well recognized that, both oral and intravenous administration of
NA lead to dramatic and acute reductions of plasma FFA, followed by a rebound and
subsequent return to baseline (Pereira, 1967; Waterman and Schultz, 1972; Waterman et al.,
1972; Jaster et al., 1983; Carlson, 2005; Pires and Grummer, 2007). The basis for this
rebound phenomenon on lipolysis during long-term NA treatment is not clear, but recent
findings indicate that chronic NA treatment in rats resulted in the significant decrease of
phosphodiesterase-3B (PDE-3B) gene expression, which might have led to increase cAMP
level (a major regulator of lipolysis in adipocytes) and thus increase lipolysis to cause the
FFA rebound (Oh et al., 2011). Moreover, the relative mRNA expression of several key
enzymes of TAG synthesis was markedly decreased, suggesting the possibility that decreased
TAG synthesis contributes to the FFA rebound (Oh et al., 2011). A meta-analysis of multiple
studies involving NA feeding to dairy cows showed no statistical effects of NA in plasma
FFA and BHBA concentrations (Schwab et al., 2005).
The underlying mechanism how NA switches fiber types cannot be resolved from the present
thesis studies, but the possibility is that the effect of NA involves NA receptor-independent

Discussion
40
mechanisms, because the skeletal muscle does not express NA receptor. In this line it is
remarkable that NA has been reported to induce several humoral changes, such as increases in
the plasma levels of epinephrine, corticosterone and glucagon (Quabbe et al., 1983).
Furthermore, NA supplementation also causes an elevation in the plasma levels of growth
hormone, adiponectin and leptin, all of which are recognized to influence gene expression and
cellular signalling in different tissues (Westphal et al., 2007; Plaisance et al., 2008). Hence,
future studies remain to figure out whether these NA-induced humoral changes are
responsible for the observed muscle fiber switching.
In conclusion, the results of the present thesis studies show that NA supplementation to pig
and sheep induces a switch from type II to type I fibers with profound changes in the skeletal
muscle metabolic phenotype. Thus, NA supplementation induces type II to type I muscle fiber
switching, and thereby an oxidative metabolic phenotype of skeletal muscle in pigs. It is
recognized that muscle fiber’s composition affects the energy metabolism during postmortem
conversion of muscle to meat, hence affecting ultimate meat quality (Karlsson et al., 1999;
Monin and Ouali, 1992). Given that oxidative muscle types tend to develop dark, firm and dry
pork in response to intense physical activity and/or high psychological stress levels
preslaughter, a NA-induced change in the muscle fiber type distribution may improve meat
quality of pigs. Furthermore, the NA-induced switch from type II to type I in skeletal muscle
indicates an increased capacity of skeletal muscle for oxidative utilization of fatty acids.
Therefore, the results suggest that an increased utilization of fatty acids by increased type I
fibers, which significantly contributes to whole-body fatty acid utilization, and ultimately
contributes to the lipid-lowering effects of NA treatment. Thus, findings of the study 2 might
be most appropriate in the circumstances in which farms are experiencing unusually high
incidence rates of metabolic disorders like ketosis and/or fatty liver of high yielding dairy
cows.

Summary
41
5. SUMMARY
Nicotinic acid (NA) is the oldest lipid-lowering drug and has been used for more than five
decades in the treatment of atherosclerosis and metabolic disorders. The lipid-lowering
mechanism of NA has been extensively investigated and traditionally attributed to its
antilipolytic effect on adipocytes through binding with the NA receptor G-protein-coupled
receptor 109A (GPR109A). However, the circulating free fatty acid (FFA) level rebound and
over-shoot the baseline due to long-term NA treatment even though its lipid-lowering effects
persist. Thus, despite a long history of clinical use, to date the precise mechanism by which
NA lowers plasma lipid is far from clear. In such a context, in the present thesis it has been
hypothesized that NA induces type II to type I muscle fiber transition, thereby increasing the
oxidative capacity of overall skeletal muscle, which may be the background mechanism of
lipid-lowering properties of NA. It has been already found that NA supplementation
counteracts the obesity-induced muscle fiber transition from oxidative type I to glycolytic
type II and increases the number of type I fibers in skeletal muscle of obese Zucker rats.
These effects were likely mediated by the induction of key regulators of fiber transition,
peroxisome proliferator-activated receptor δ (PPARδ), PPARγ coactivator-1α (PGC-1α) and
PPARγ coactivator-1β (PGC-1β), leading to type II to type I fiber transition and upregulation
of genes involved in fatty acid oxidation, mitochondrial oxidative phosphorylation, and
angiogenesis. So, the main intention of the present thesis studies was to investigate the
hypothesis that, whether NA administration also influences fiber type distribution and thereby
the metabolic phenotype of different skeletal muscles in two farm animal species, namely in
pig as a model of non-ruminants (study 1) and in sheep as a model of ruminants (study 2).
In order to investigate the hypotheses of study 1, twenty five male, 11 weeks old crossbred
pigs (Danzucht x Pietrain) with an average body weight of 32.8 ± 1.3 (mean ± SD) kg were
randomly allocated to two groups of 12 in control group and 13 pigs in NA group which were
fed either a control or a diet supplemented with 750 mg NA/kg diet for 3 weeks. Fiber typing
was performed in three different skeletal muscles (M. Longissimus dorsi, LD; M. Quadriceps
femoris, QF; M. Gastrocnemius, G) and quantitative polymerase chain reaction (qPCR) was
performed in LD muscle only. The percentage numbers of type I fibers in three different
skeletal muscles were higher in the NA group and the percentage numbers of type II fibers
were lower in the NA group compared to the control group. In line with this, the relative
mRNA level of the type I fiber-specific myosin heavy chain, MYH7 gene tended (P < 0.15) to
be higher; type II fiber-specific MYH2 and MYH4 genes were reduced or tended (P < 0.15) to
be reduced, respectively, in LD muscle in the NA group compared to the control group of

Summary
42
pigs. The relative mRNA levels of key regulators of muscle fiber transition, PGC-1β was
increased and PGC-1α was numerically increased by NA treatment. Genes involved in
mitochondrial fatty acid utilization and thermogenesis [carnitine acylcarnitine translocase,
fatty acid transport protein1, novel organic cation transporter 2, succinate dehydrogenase
subunit A (SDHA), cytochrome c oxidase 4/1 and 6A1, (COX4/1 COX6A1) and uncoupling
proteins 3] measured in LD muscle were higher in the NA treated pigs compared to control
pigs.
In order to investigate the hypotheses of study 2, sixteen male, 11 weeks old Rhoen sheep
with an average body weight of 29.6 ± 3.0 (mean ± SD) kg were randomly allocated to two
groups of 8 sheep each and treated either without (control group) or with 1 g NA per day (NA
group) for 4 weeks. After 4 weeks, the percentage numbers of type I fibers in three different
skeletal muscles (LD; M. Semimembranosus, SM; M. Semitendinosus, ST) were higher in the
NA treated sheep, whereas the percentage numbers of type II fibers were lower in the NA
group compared to the control group of sheep. This effect was also reflected by the NA
induced increase in the transcript level of fiber type I specific myosin heavy chain I, (MHCI)
isoform in SM and ST muscles or tended (P < 0.15) to be increased in LD muscle; the fiber
type II specific MHCIIA isoform was lowered in LD and SM muscles; fiber type II specific
MHCIIX isoform was lowered in LD and tended (P < 0.15) to be lowered in SM muscle by
NA treatment. The relative mRNA levels of the key regulators of muscle fiber transition,
PGC-1α, PGC-1β and PPARδ, in all three muscles were higher or tended (P < 0.15) to be
higher in the NA treated group compared to the control group sheep. Moreover, the protein
level of PGC-1α was elevated in two muscles (LD and SM) of the NA group compared to the
control group. In line with this, it was observed that the relative mRNA levels of genes
involved in fatty acid oxidation and angiogenesis [SDHA, carnitine palmitoyltransferase 1B,
solute carrier family 25 member 20, COX5A, COX6A1 and vascular endothelial growth
factor A] in all three skeletal muscles of sheep were elevated by NA treatment.
In conclusion, the overall finding of the present PhD thesis is that NA causes type II (fast-
glycolytic) to type I (slow-oxidative) fiber switch and thereby increases the oxidative capacity
in different types of skeletal muscle of pigs and sheep. This increased oxidative skeletal
muscle capacity induced by NA might improve the pork quality because the oxidative muscle
types tend to develop dark, firm and dry pork in response to intense physical activity and/or
high psychological stress levels preslaughter. As well as the increased oxidative capacity of
skeletal muscle to utilize fatty acids in ruminants could be particularly useful during

Summary
43
metabolic states in which fatty acids are excessively mobilized from adipose tissue, such as in
ketosis and/or fatty liver of high yielding dairy cows.

Zusammenfassung
44
6. ZUSAMMENFASSUNG
Nikotinsäure (NA) ist das älteste lipidsenkende Medikament und wird bereits seit mehr als
fünf Jahrzehnten bei der Behandlung von Atherosklerose und Stoffwechselkrankheiten
eingesetzt. Der lipidsenkende Effekt der Nikotinsäure wurde intensiv untersucht und ist
gekennzeichnet durch einen antilipolytischen Effekt auf Adipozyten, der durch die Bindung
an den Nikotinsäurerezeptor GpR109A vermittelt wird. Während der Langzeittherapie mit
Nikotinsäure kommt es zu einem Rebound-Effekt mit überschießenden Konzentrationen an
freien Fettsäuren im Plasma, wobei jedoch der lipidsenkende Effekt erhalten bleibt. Trotz der
langen Historie der klinischen Verwendung, ist der genaue Mechanismus der lidpidsenkenden
Wirkung noch nicht eindeutig geklärt. In diesem Zusammenhang soll die vorliegende
Dissertation die Hypothese überprüfen, dass Nikotinsäure den Übergang von Typ-II-
Muskelfasern zu Typ-I- Muskelfasern induziert und somit die oxidative Kapazität des
Skelettmuskels erhöht, was einen zugrundeliegenen lipidsenkenden Mechanismus der
Nikotinsäure darstellten könnte. Es ist bereits bekannt, dass die Supplementierung von
Nikotinsäure der Adipositas-induzierten Muskelfaserumwandlung von oxidativen Typ-I
Muskelfasern zu glykolytischen Typ-II Fasern entgegenwirkt und die Anzahl der Typ-I
Muskelfasern im Skelettmuskel von adipösen Zucker-Ratten erhöht. Dieser Effekt wird
wahrscheinlich über die Aktivierung der Hauptregulatoren der Muskelfaserumwandlung
erreicht, zu denen der peroxisome proliferator-activated receptor gamma coactivator 1-alpha
(PGC-1α), der peroxisome proliferator-activated receptor gamma coactivator 1-beta (PGC-
1β) und der peroxisome proliferator-activated receptor delta (PPARδ) gehören. Dessen
Aktivierung führt zu einer Umwandlung von Typ-II Muskelfasern zu Typ-I Muskelfasern und
einer Hochregulierung von Genen, die bei der Fettsäureoxidation, der oxidativen
Phosphorylierung sowie der Angiogenese involviert sind. Das Ziel der vorliegenden
Dissertation bestand darin, die Hypothese zu untersuchen, dass die Verabreichung von
Nikotinsäure die Muskelfaserverteilung und den metabolischen Phänotyp ausgewählter
Skelettmuskeln beim Schwein, als Model eines Nichtwiederkäuers (Studie 1), und beim Schaf
(Studie 2), als Model eines Wiederkäuers, beeinflusst.
Um die Hypothese der ersten Studie zu untersuchen, wurden 25 männliche Schweine im Alter
von 11 Wochen und einem durchschnittlichen Körpergewicht von 32,8 ± 1,3 kg (Mittelwert ±
SD) zufällig 2 Gruppen zugeordnet. Die 12 Schweine der Kontrollgruppe bekamen ein
Kontrollfutter, während den 13 Schweinen der Behandlungsgruppe das Kontrollfutter mit
Zusatz von 750 mg Nikotinsäure/kg Ration verabreicht wurde. Die Muskelfasertypisierung
wurde mit Proben des M. longissimus dorsi (LD), M. quadriceps femoris (QF) und M.

Zusammenfassung
45
gastrognemicus (G) vorgenommen. Zusätzlich wurden quantitative PCR-Analysen mit LD-
Proben durchgeführt. Durch die Gabe von Nikotinsäure erhöhte sich der prozentuale Anteil
von Typ-I-Muskelfasern signifikant in allen ausgewählten Muskeln (LD, QF, G), während
sich der prozentuale Anteil der Typ-II-Muskelfasern verringerte, im Vergleich mit der
Kontrollgruppe.
In Übereinstimmung dazu waren die relativen mRNA-Konzentrationen des Typ-I-
spezifischen Gens myosin heavy chain, MYH7 im LD der Behandlungsgruppe tendenziell
höher (P < 0.15) und die der Typ-II-spezifischen Gene MYH2 und MYH4 signifikant bzw.
tendenziell (P < 0.15) vermindert, im Vergleich zur Kontrollgruppe. Die relativen mRNA-
Konzentrationen der Hauptregulatoren waren nach Behandlung mit Nikotinsäure im Falle von
PGC1β signifikant erhöht und bei PGC1α numerisch erhöht. Für die Gene des
mitochondrialen Fettsäurestoffwechsels [carnitine acylcarnitine translocase, fatty acid
transport protein1, novel organic cation transporter 2, succinate dehydrogenase subunit A,
(SDHA), cytochrome c oxidase 4/1 und 6A1, (COX4/1 und COX6A1) und der Thermogenese
uncoupling proteins 3] konnte ein signifikanter Anstieg der relativen mRNA-Konzentrationen
im LD in der Gruppe mit Nikotinsäuresupplementierung gezeigt werden.
Zur Überprüfung der Hypothese der zweiten Studie wurde ein vierwöchiger Versuch mit 16
männlichen, 11 Wochen alten Rhönschafen durchgeführt, welche ein durchschnittliches
Körpergewicht von 29,6 ± 3,0 kg (Mittelwert ± SD) hatten und zufällig der Kontrollgruppe
(Kontrollration ohne Nikotinsäure) oder der Behandlungsgruppe (Kontrollration plus 1 g
Nikotinsäure/Tag) zugeordnet wurden.
Die vierwöchige Nikotinsäuresupplementierung der Schafe führte zu einer prozentualen
Erhöhung der Typ-1-Muskelfasern in den ausgewählten Muskeln LD, M. semimebranosus
(SM) und M. Semitendinosus (ST), wohingegen der prozentuale Anteil der Typ-II
Muskelfasern im Vergleich zur Kontrollgruppe geringer war. Dieser Effekt äußerte sich auch
in den erhöhten relativen mRNA-Konzentrationen der spezifischen myosin heavy chain,
MHCI Isoform im Muskel SM und ST (P < 0.05) und LD (P < 0.15) sowie in den
Transkriptleveln der MHCIIX-Isoform, die verringert waren in den Muskeln SM (P < 0.05)
und LD (P < 0.15), verglichen mit der Kontrollgruppe. Auch die relativen mRNA-
Konzentrationen der Hauptregulatoren der Muskelfaserumwandlung, PGC1α, PGC1ß und
PPARδ, waren in den drei ausgewählten Muskeln signifikant oder tendenziell signifikant
erhöht in der Gruppe mit Nikotinsäuresupplementierung. Darüber hinaus konnte auch ein
Anstieg der Proteinkonzentration von PGC1α in den Muskeln LD und SM nach Gabe von
Nikotinsäure mittels Western Blot Analysen nachgewiesen werden. Damit einhergehend

Zusammenfassung
46
zeigten die ausgewählten Gene des Fettsäurestoffwechsels und der Angiogenese (SDHA,
carnitine palmitoyltransferase 1B, solute carrier family 25 member 20, COX5A, COX6A1
und vascular endothelial growth factor A) in allen drei Muskeln der Schafe der Niacingruppe
erhöhte relative mRNA-Konzentrationen.
Zusammenfassend bestätigt die vorliegende Dissertation, dass Nikotinsäure ursächlich für die
Muskelfaserumwandlung von (schnellen-glykolytischen) Typ-II Fasern zu (langsamen-
oxidativen) Typ-I Fasern ist und damit die oxidative Kapazität in den verschiedenen
ausgewählten Muskeln von Schwein und Schaf erhöht. Diese gesteigerte oxidative Kapazität,
die durch Nikotinsäure induziert wird, verbessert möglicherweise die Fleischqualität, da die
oxidativen Muskelfasern aufgrund der intensiven körperlichen Aktivität und/oder des hohen
psychischen Stresslevels unmittelbar vor der Schlachtung die Entstehung von dunklem,
festem und trockenem Fleisch begünstigen. Die erhöhte oxidative Kapazität der
Skelettmuskulatur könnte auch in Situationen, die mit einer erhöhten Stoffwechselrate
assoziiert sind, wie zum Beispiel Ketose oder Fettleber bei der hochleistenden Milchkuh,
vorteilhalt sein, da somit möglicherweise die Metabolisierung von Fettsäuren verbessert
werden kann.

References
47
7. REFERENCES
Al-Abbasy EG (2013) Effect of adding two levels of niacin in milk production and controlling
indicators of ketosis in friesian cows postpartum. Br J Dairy Sci 3: 1-4.
Alderman JD, Pasternak RC, Sacks FM, Smith HS, Monrad ES, Grossman W (1989) Effect
of a modified well-tolerated niacin regimen on serum total cholesterol, high density
lipoprotein cholesterol and the cholesterol to high density lipoprotein ratio. Am J Cardiol 64:
725-729.
Altschul R, Herman IH (1954) Influence of oxygen inhalation on cholesterol metabolism.
Arch Biochem 51: 308-309.
Altschul R, Hoffer A, Stephen JD (1955) Influence of nicotinic acid on serum cholesterol in
man. Arch Biochem Biophys 54: 558-559.
Alvarsson M, Grill V (1996) Impact of nicotinic acid treatment on insulin secretion and
insulin sensitivity in low and high insulin responders. Scand J Clin Lab Invest 56: 563-570.
Arany Z (2008) PGC-1 coactivators and skeletal muscle adaptations in health and disease.
Curr Opin Genet Dev 18: 426-434.
Arany Z, Lebrasseur N, Morris C, Smith E, Yang W, Ma Y, Chin S, Spiegelman BM (2007)
The transcriptional co activator PGC-1beta drives the formation of oxidative type IIX fibers in
skeletal muscle. Cell Metab 5: 35-46.
Baar K, Wende AR, Jones TE, Marison M, Nolte LA, Chen M, Kelly DP, Holloszy JO (2002)
Adaptations of skeletal muscle to exercise: rapid increase in the transcriptional coactivator
PGC-1. FASEB J 16: 1879-1886.
Barnard RJ, Edgerton VR, Furukawa T, Peter JB (1971) Histochemical, biochemical, and
contractile properties of red, white, and intermediate fibers. Am J Physiol 220: 410-414.
Bender, DA (2003) Nutritional Biochemistry of the Vitamins. 2nd
edition. New York:
Cambridge University Press.
Berchtold MW, Brinkmeier H, Muntener M (2000) Calcium ion in skeletal muscle: Its crucial
role for muscle function, plasticity, and disease. Physiol Rev 80: 1215-1265.

References
48
Berge KG, Achor RWP, Christensen NA, Mason HL, Barker NW (1961)
Hypercholesterolemia and nicotinic acid. Am J Med 31: 24-35.
Block SS, Butler WR, Ehrhardt RA, Bell AW, Van Amburgh ME, Boisclair YR (2001)
Decreased concentration of plasma leptin in periparturient dairy cows is caused by negative
energy balance. J Endocrinol 171: 339-348.
Bodor ET, Offermanns S (2008). Nicotinic acid: an old drug with a promising future. British
Journal of Pharmacology 153: S68-S75.
Booth FW, Thomason DB (1991). Molecular and cellular adaptation of muscle in response to
exercise: perspectives of various models. Physiol Rev 71: 541-585.
Braissant O, Foufelle F, Scotto C, Dauca M, Wahli W (1996) Differential expression of
peroxisome proliferator-activated receptors (PPARs): tissue distribution of PPAR-alpha, -
beta, and -gamma in the adult rat. Endocrinology 137: 354-366.
Brewer MS, Zhu LG, Bidner B, Meisinger DJ, McKeith FK (2001) Measuring pork color:
effects of bloom time, muscle, pH and relationship to instrumental parameters. Meat Sci 57:
169-176.
Brockman RP (1979) Roles for Insulin and Glucagon in the Development of Ruminant
Ketosis-A Review. Can vet J 20: 121-126.
Carlson LA (1990) The broad spectrum hypolipidaemic drug nicotinic acid. J Drug Dev 3:
223-226.
Carlson LA (2005) Nicotinic acid: the broad-spectrum lipid drug. A 50th anniversary review.
Journal of Internal Medicine 258: 94-114.
Carlson LA, Hanngren Å (1964) Initial distribution in mice of 3H-labelled nicotinic acid
studied by autoradiography. Life Sci 3: 867-871.
Cassano P, Sciancalepore AG, Pesce V, Flück M, Hoppeler H, Calvani M, Mosconi L,
Cantatore P, Gadaleta MN (2006) Acetyl-L-carnitine feeding to unloaded rats triggers in
soleus muscle the coordinated expression of genes involved in mitochondrial biogenesis.
Biochim Biophys Acta 1757: 1421-1428.

References
49
Chapman MJ, Redfern JS, McGovern ME, Giral P (2010) Niacin and fibrates in atherogenic
dyslipidemia: Pharmacotherapy to reduce cardiovascular risk. Pharmacol Ther 126: 314-345.
Chinsomboon J, Ruas J, Gupta RK, Thom R, Shoag J, Rowe GC, Sawada N, Raghuram S,
Arany Z (2009) The transcriptional coactivator PGC-1alpha mediates exercise-induced
angiogenesis in skeletal muscle. Proc Natl Acad Sci USA, 106: 21401-21406.
Choe JH, Choi YM, Lee SH, Shin HG, Ryu YC, Hong KC, Kim BC (2008). The relation
between glycogen, lactate content and muscle fiber type composition, and their influence on
postmortem glycolytic rate and pork quality. Meat Science 80: 355-362.
Choi S, Yoon H, Oh KS, Oh YT, Kim YI, Kang I, Youn JH (2011) Widespread effects of
nicotinic acid on gene expression in insulin-sensitive tissues: implications for unwanted
effects of nicotinic acid treatment. Metabolism 60: 134-144.
Choi YM, Kim BC (2009) Muscle fiber characteristics, myofibrillar protein isoforms, and
meat quality. Livestock Science 122: 105-118.
Christensen NA, Achor RWP, Berge KG, Mason HL (1961) Nicotinic acid treatment of
hypercholesteremia, comparison of plain and sustained action preparations, and report of two
cases of jaundice. J Am Med Assoc 177: 546-550.
Cui XS, Li XY, Jeong YJ, Jun JH, Kim NH (2006) Gene expression of cox5a, 5b, or 6b1 and
their roles in preimplantation mouse embryos. Biol Reprod 74: 601-610.
de Grooth GJ, Klerkx AH, Stroes ES, Stalenhoef AF, Kastelein JJ, Kuivenhoven JA (2004) A
review of CETP and its relation to atherosclerosis. J Lipid Res 45: 1967-1974.
de Lange P, Farina P, Moreno M, Ragni M, Lombardi A, Silvestri E, Burrone L, Lanni A,
Goglia F (2006) Sequential changes in the signal transduction responses of skeletal muscle
following food deprivation. FASEB J 20: 2579-2581.
Delp MD, Duan C (1996) Composition and size of type I, IIA, IID/X, and IIB fibers and
citrate synthase activity of rat muscle. J Appl Physiol 80: 261-270.
DiPalma JR and Thayer WS (1991) Use of niacin as a drug. Annu Rev Nutr 11: 169-187.
Dufva GS, Bartley EE, Dayton AD, Riddell DO (1983) Effect of niacin supplementation on
milk production and ketosis of dairy cattle. J Dairy Sci 66: 2329-2336.

References
50
Dulloo AG, Samec S (2001) Uncoupling proteins: their roles in adaptive thermogenesis and
substrate metabolism reconsidered. Br J Nutr 86: 123-139.
Ehrenborg E, Krook A (2009) Regulation of skeletal muscle physiology and metabolism by
peroxisome proliferator-activated receptor delta. Pharmacol Rev: 61: 373-393.
Erickson PS, Murphy MR, Clark JH (1992) Supplementation of dairy cow diets with calcium
salts of long-chain fatty acids and nicotinic acid in early lactation. J Dairy Sci 75: 1078-1089.
Fernandez X, Meunier-Salaün M-C, Ecolan P (1994) Glycogen depletion according to muscle
and fibre types in response to dyadic encounters in pigs (Sus scrofa domesticus)-relationships
with plasma epinephrine and aggressive behaviour. Comp Biochem Physiol A Physiol 109:
869-879.
Fernandez-Marcos PJ, Auwerx J (2011) Regulation of PGC-1α, a nodal regulator of
mitochondrial biogenesis. Am J Clin Nutr 93: 884S-890S.
Ferrara N, Gerber HP, LeCouter J (2003) The biology of VEGF and its receptors. Nat Med 9:
669-676.
Flachowsky, G. (1993) Niacin in dairy and beef cattle nutrition, Archiv für Tierernaehrung,
43: 195-213.
Fritz T, Krämer DK, Karlsson HK, Galuska D, Engfeldt P, Zierath JR, Krook A (2006) Low-
intensity exercise increases skeletal muscle protein expression of PPAR delta and UCP3 in
type 2 diabetic patients. Diabetes Metab Res Rev 2: 492-498.
Fronk TJ, Schultz LH (1979) Oral nicotinic acid as a treatment for ketosis. J Dairy ScL 62:
1804-1807.
Fujita N, Nagatomo F, Murakami S, Kondo H, Ishihara A, Fujino H (2012) Effects of
hyperbaric oxygen on metabolic capacity of the skeletal muscle in type 2 diabetic rats with
obesity. Scientific World Journal 2012: 637978.
Ganji SH, Tavintharan S, Zhu D, Xing Y, Kamanna VS, Kashyap ML (2004) Niacin
noncompetitively inhibits DGAT2 but not DGAT1 activity in hepG2 cells. J Lipid Res 45:
1835-1845.

References
51
Gille A, Bodor ET, Ahmed K, Offermanns S (2008) Nicotinic acid: Pharmacological effects
and mechanisms and mechanisms of action. Annu Rev Pharmacol Toxicol 48: 79-106.
Grummer RR (1993) Etiology of lipid-related metabolic disorders in periparturient dairy
cows. J. Dairy Sci 76: 3882-3896.
Guardiola-Diaz HM, Rehnmark S, Usuda N, Albrektsen T, Feltkamp D, Gustafsson JA,
Alexson SE (1999) Rat peroxisome proliferator-activated receptors and brown adipose tissue
function during cold acclimatization. J Biol Chem 274: 23368-23377.
Hagberg CE, Falkevall A, Wang X, Larsson E, Huusko J, Nilsson I, van Meeteren LA, Samen
E, Lu L, Vanwildemeersch M, Klar J, Genove G, Pietras K, Stone-Elander S, Claesson-Welsh
L, Ylä-Herttuala S, Lindahl P, Eriksson U (2010) Vascular endothelial growth factor B
controls endothelial fatty acid uptake. Nature 464: 917-921.
Hambrecht E, Eissen JJ, Newman DJ, Smits CHM, Verstegen MWA, den Hartog LA (2005)
Preslaughter handling effects on pork quality and glycolytic potential in two muscles differing
in fiber type composition. J Anim Sci 83: 900-907.
Harmeyer J, Kollenkirchen U (1989) Thiamin and niacin in ruminant nutrition. Nutr Res Rev
2: 201-225.
Henderson LM (1983) Niacin. Annu Rev Nutr 3: 289-307.
Henry BA, Andrews ZB, Rao A, Clarke IJ (2011) Central leptin activates mitochondrial
function and increases heat production in skeletal muscle. Endocrinology 152: 2609-2618.
Hernandez C, Molusky M, Li Y, Li S, Lin JD (2010) Regulation of hepatic ApoC3 expression
by PGC-1β mediates hypolipidemic effect of nicotinic acid. Cell Metab 12: 411-419.
Hernandez M, Wright SD, Cai TQ (2007) Critical role of cholesterol ester transfer protein in
nicotinic acid-mediated HDL elevation in mice. Biochem Biophys Res Commun 355: 1075-
1080.
Hood DA (2001) Invited review: Contractile activity-induced mitochondrial biogenesis in
skeletal muscle. J Appl Physiol 90: 1137-1157.
Hosler JP, Ferguson-Miller S, Mills DA (2006) Energy transduction: proton transfer through
the respiratory complexes. Annu Rev Biochem 75: 165-187.
References
52
Hotz W (1983) Nicotinic acid and its derivatives: a short survey. Adv Lipid Res 20:195-217.
Houmard JA (2008) Intramuscular lipid oxidation and obesity. Am J Physiol Regul Integr
Comp Physiol 294: R1111-R1116.
Hüttemann M, Helling S, Sanderson TH, Sinkler C, Samavati L, Mahapatra G, Varughese A,
Lu G, Liu J, Grossman LI, Doan JW, Marcus K, Lee I (2012) Regulation of mitochondrial
respiration and apoptosis through cell signaling: cytochrome c oxidase and cytochrome c in
ischemia/reperfusion injury and inflammation. Biochim Biophys Acta 1817: 598-609.
Indiveri C, Iacobazzi V, Giangregorio N, Palmieri F (1997) The mitochondrial carnitine
carrier protein: cDNA cloning, primary structure and comparison with other mitochondrial
transport proteins. Biochem J 321: 713-719.
Jarvis JC, Mokrusch T, Kwende MM, Sutherland H, Salmons S (1996) Fast-to-slow
transformation in stimulated rat muscle. Muscle Nerve 19: 1469-1475.
Jaster EH, Bell DF, McPherron TA (1983) Nicotinic Acid and Serum Metabolite
Concentrations of Lactating Dairy Cows Fed Supplemental Niacin. J Dairy Sci 66: 1039-
1045.
Jin FY, Kamanna VS, Kashyap M L (1997) Niacin decreases removal of high-density
lipoprotein apolipoprotein A-I but not cholesterol ester by Hep G2 cells. Implication for
reverse cholesterol transport. Arterioscler Thromb Vasc Biol 17: 2020-2028.
Jorquera G, Altamirano F, Contreras-Ferrat A, Almarza G, Buvinic S, Jacquemond V,
Jaimovich E, Casas M (2013) Cav1.1 controls frequency-dependent events regulating adult
skeletal muscle plasticity. J Cell Sci 126: 1189-1198.
Kamanna VS, Ganji SH, Kashyap ML (2009) Niacin: An old drug rejuvenated. Curr
Atheroscler Rep 11: 45-51.
Kamanna VS, Kashyap ML (2008) Mechanism of Action of Niacin. Am J Cardiol 101: 20B-
26B.
Kantorovich V, King KS, Pacak K (2010) SDH-related pheochromocytoma and
paraganglioma. Best Pract Res Clin Endocrinol Metab 24: 415-24.
References
53
Karlsson AH, Klont RE, Fernandez X (1999) Skeletal muscle fibres as factors for pork
quality. Livestock Production Science. 60: 255-269.
Karpe F, Frayn KN (2004) The nicotinic acid receptor-a new mechanism for an old drug.
Lancet 363: 1892-1894.
Kiens B (2006) Skeletal muscle lipid metabolism in exercise and insulin resistance. Physiol
Rev 86: 205-243.
Knopp RH (1999) Drug treatment of lipid disorders. N Engl J Med 341: 498-511.
Knopp RH, Ginsberg J, Albers JJ (1985) Contrasting effects of unmodified and time- release
forms of niacin on lipoproteins in hyperlipidemic subjects: clues to mechanism of action of
niacin. Metabolism 34: 642-650.
Koves TR, Li P, An J, Akimoto T, Slentz D, Ilkayeva O, Dohm GL, Yan Z, Newgard CB,
Muoio DM (2005)Peroxisome proliferator-activated receptor-gamma co-activator 1alpha-
mediated metabolic remodeling of skeletal myocytes mimics exercise training and reverses
lipid-induced mitochondrial inefficiency. J Biol Chem 280: 33588-33598.
Krauss S, Zhang CY, Lowell BB (2005) The mitochondrial uncoupling-protein homologues.
Nature Reviews Molecular Cell Biology 6: 248-261.
Lamon-Fava S, Diffenderfer MR, Barrett PH, Buchsbaum A, Nyaku M, Horvath KV,
Asztalos BF, Otokozawa S, Ai M, Matthan NR, Lichtenstein AH, Dolnikowski GG, Schaefer
EJ (2008) Extended-release niacin alters the metabolism of plasma apolipoprotein (Apo) A-I
and ApoB-containing lipoproteins. Arterioscler ThrombVasc Biol 28: 1672-1678.
Lauring B, Taggart AKP, Tata JR, Dunbar R, Caro L, Cheng K, Chin J, Colletti SL, Cote J,
Khalilieh SLiu J, Luo WL, MacLean AA, Peterson LB, Polis AB, Sirah W, Wu T-J, Liu X,
Jin L, Wu K, Boatman PD, Semple G, Behan DP, Connolly DT, Lai E, Wagner JA, Wright
SD, Cuffie C, Mitchel YB, Rader DJ, Paolini JF, Waters MG, Plump A (2012) Niacin lipid
efficacy is independent of both the niacin receptor GPR109A and free fatty acid suppression.
Sci Transl Med 4: 148ra115.
Lefaucheur L, Gerrard D (2000) Muscle fiber plasticity in farm mammals. J Anim Sci 77: 1-
19.

References
54
Leibowitz MD, Fiévet C, Hennuyer N, Peinado-Onsurbe J, Duez H, Bergera J, Cullinan CA,
Sparrow CP, Baffic J, Berger GD, Santini C, Marquis RW, Tolman RL, Smith RG, Moller
DE, Auwerx J (2000) Activation of PPAR delta alters lipid metabolism in db/db mice. FEBS
Lett 473: 333-336.
Liang H, Ward WF (2006) PGC1α: a key regulator of energy metabolism. Adv Physiol Educ
30: 145-151.
Liaubet L, Lobjois V, Faraut T, Tircazes A, Benne F, Iannuccelli N, Pires J, Glénisson J,
Robic A, Le Roy P, SanCristobal M, Cherel P (2011) Genetic variability of transcript
abundance in pig peri-mortem skeletal muscle: eQTL localized genes involved in stress
response, cell death, muscle disorders and metabolism. BMC Genomics 12: 548.
Lin J, Handschin C, Spiegelman BM (2005) Metabolic control through the PGC-1 family of
transcription coactivators. Cell Metab 1: 361-370.
Lin J, Puigserver P, Donovan J, Tarr P, Spiegelman BM (2002b) Peroxisome proliferator-
activated receptor gamma coactivator 1beta (PGC-1beta), a novel PGC-1-related transcription
coactivator associated with host cell factor. J Biol Chem 277: 1645-1648.
Lin J, Wu H, Tarr PT, Zhang C, Wu Z, Boss O, Michael LF, Puigserver P, Isotani E, Olson
EN, Lowell BB, Bassel-Duby R, Spiegelman BM (2002a) Transcriptional co-activator PGC-
1α drives the formation of slow-twitch muscle fibres. Nature 418: 797-801.
Liu J, Li J, Li WJ, Wang CM (2013) The role of uncoupling proteins in diabetes mellitus. J
Diabetes Res 2013: 585897.
Lorenzen A, Stannek C, Lang H, Andrianov V, Kalvinsh I, Schwabe U (2001)
Characterization of a G protein-coupled receptor for nicotinic acid. Mol Pharmacol 59: 349-
357.
Lukasova M, Hanson J, Tunaru S, Offermanns S (2011) Nicotinic acid (niacin): New lipid-
independent mechanisms of action and therapeutic potentials. Trends in Pharmacological
Sciences 32: 700-707.
Luquet S, Lopez-Soriano J, Holst D, Fredenrich A, Melki J, Rassoulzadegan M, Grimaldi PA
(2003) Peroxisome proliferator-activated receptor delta controls muscle development and
oxidative capability. FASEB J 17: 2299-2301.

References
55
Mahoney DJ, Parise G, Melov S, Safdar A, Tarnopolsky MA (2005) Analysis of global
mRNA expression in human skeletal muscle during recovery from endurance exercise.
FASEB J 19: 1498-1500.
Martin G, Nemoto M, Gelman L, Geffroy S, Najib J, Fruchart J C, Roevens P, de Martinville
B, Deeb S, Auwerx J (2000) The Human Fatty Acid Transport Protein-1 (SLC27A1; FATP-1)
cDNA and Gene: Organization, Chromosomal Localization, and Expression. Genomics 66:
296-304.
McDowell LR (2005) Vitamin nutrition of livestock animals: overview from vitamin
discovery to today. In Vitamin Nutrition of Livestock Animals, Conference Proceedings of
the Canadian Society of Animal Science, Cincinnati, 24 July 2005, pp. 1-15. Lennoxville,
Quebec: Dairy and Swine Research and Development Centre Agriculture and Agri-Food
Canada.
McGarry JD, Brown NF (1997) The mitochondrial carnitine palmitoyltransferase system.
From concept to molecular analysis. Eur J Biochem 244: 1-14.
McGarry JD, Leatherman GF, Foster DW (1978) Carnitine palmitoyltransferase I. The site of
inhibition of hepatic fatty acid oxidation by malonyl-CoA. J Biol Chem 253: 4128-4136.
Meirhaeghe A, Crowley V, Lenaghan C, Lelliott C, Green K, Stewart A, Hart K, Schinner S,
Sethi JK, Yeo G, Brand MD, Cortright RN, O’Rahilly S, Montague C, and Vidal-Puig AJ
(2003) Characterization of the human, mouse and rat PGC1 beta (peroxisome-proliferator-
activated receptor-gamma co-activator 1 beta) gene in vitro and in vivo. Biochem J 373: 155-
165.
Meyers CD, Kamanna VS, Kashyap ML (2004) Niacin therapy in atherosclerosis. Curr Opin
Lipidol 15: 659-665.
Meyers CD, Kashyap ML (2004) Management of the metabolic syndrome-nicotinic acid.
Endocrinol Metab Clin North Am 33: 557-575.
Monin G, Mejenes-Quijano A, Talmant A, Sellier P (1987) Influence of breed and muscle
metabolic type on muscle glycolytic potential and meat pH in pigs. Meat Sci 20: 149-158.

References
56
Morey SD, Mamedova LK, Anderson DE, Armendariz C K, Titgemeyer EC, Bradford BJ
(2011) Effects of encapsulated niacin on metabolism and production of periparturient dairy
cows. J Dairy Sci 94: 5090-5104.
Mortensen OH, Frandsen L, Schjerling P, Nishimura E, Grunnet N (2006) PGC-1alpha and
PGC-1beta have both similar and distinct effects on myofiber switching toward an oxidative
phenotype. Am J Physiol Endocrinol Metab 291: E807-E816.
Muoio DM, MacLean PS, Lang DB, Li S, Houmard JA, Way JM, Winegar DA, Corton JC,
Dohm GL, Kraus WE (2002) Fatty acid homeostasis and induction of lipid regulatory genes
in skeletal muscles of peroxisome proliferator-activated receptor (PPAR) alpha knock-out
mice. Evidence for compensatory regulation by PPAR delta. J Biol Chem 277: 26089-26097.
Naya FJ, Mercer B, Shelton J, Richardson JA, Williams RS, Olson EN (2000) Stimulation of
slow skeletal muscle fiber gene expression by calcineurin in vivo. J Biol Chem 275: 4545-
4548.
Norrbom J, Sundberg CJ, Ameln H, Kraus WE, Jansson E, Gustafsson T (2004) PGC-1alpha
mRNA expression is influenced by metabolic perturbation in exercising human skeletal
muscle. J Appl Physiol 96: 189-194.
NRC (2001) Nutrient Requirements of Dairy Cattle. 7th rev. ed. Natl. Acad. Sci., Washington,
DC.
Nye ER, Buchanan H (1969) Short term effect of nicotinic acid on plasma level and turnover
of free fatty acids in sheep and man. J Lipid Res 10: 193-196.
Offermanns S (2012) It ain’t over 'til the fat lady sings. Sci Transl Med 4:148fs130.
Offermanns S, Colletti SL, Lovenberg TW, Semple G, Wise A, IJzerman AP (2011)
International Union of Basic and Clinical Pharmacology. LXXXII. Nomenclature
andclassification of hydroxy-carboxylic acid receptors (GPR81, GPR109A, and GPR109B).
Pharmacol Rev 63: 269-290.
Oh YT, Oh KS, Choi YM, Jokiaho A, Donovan C, Choi S, Kang I, Youn JH (2011)
Continuous 24-h nicotinic acid infusion in rats causes FFA rebound and insulin resistance by
altering gene expression and basal lipolysis in adipose tissue. Am J Physiol Endocrinol Metab
300: E1012-E1021.

References
57
Ohashi R, Tamai I, Nezu J, Nikaido H, Hashimoto N, Oku A, Sai Y, Shimane M, Tsuji A
(2001) Molecular and physiological evidence for multifunctionality of carnitine/organic
cation transporter OCTN2. Mol Pharmacol 59: 358-366.
Olson EN, Williams RS (2000) Remodeling muscles with calcineurin. Bioessays 22: 510-519.
Oyedotun KS, Lemire BD (2004) The quaternary structure of the Saccharomyces cerevisiae
succinate dehydrogenase. Homology modeling, cofactor docking, and molecular dynamics
simulation studies. J Biol Chem 279: 9424-9431.
Pacelli C, Latorre D, Cocco T, Capuano F, Kukat C, Seibel P, Villani G (2011) Tight control
of mitochondrial membrane potential by cytochrome c oxidase. Mitochondrion 11: 334-341.
Parsons WB, Flinn JH (1959) Reduction of serum cholesterol levels and beta-lipoprotein
cholesterol levels by nicotinic acid. Arch Intern Med 103: 783-790.
Peluso G, Petillo O, Margarucci S, Grippo P, Melone MA, Tuccillo F, Calvani M (2005).
Differential carnitine/acylcarnitine translocase expression defines distinct metabolic
signatures in skeletal muscle cells. J Cell Physiol 203: 439-46.
Pereira JN (1967) The plasma free fatty acid rebound induced by nicotinic acid. J Lipid Res 8:
239-244.
Pescara JB, Pires JAA, Grummer RR (2010) Antilipolytic and lipolytic effects of
administering free or ruminally protected nicotinic acid to feed-restricted Holstein cows. J
Dairy Sci 93: 5385-5396.
Peter JB, Barnard RJ, Edgerton VR, Gillespie CA, Stempel KE (1972) Metabolic profiles of
three fiber types of skeletal muscle in guinea pigs and rabbits. Biochemistry 11: 2627-2633.
Pette D (1998) Training effects on the contractile apparatus. Acta Physiol Scand 162: 367-
376.
Pette D, Staron RS (1990) Cellular and molecular diversities of mammalian skeletal muscle
fibers. Rev Physiol Biochem Pharmacol 116: 1-76.
Pette D, Staron RS (1997). Mammalian skeletal muscle fiber type transitions. Int Rev Cytol
170: 143-223.

References
58
Pette D, Staron RS (2001) Transitions of muscle fiber phenotypic profiles. Histochemistry
and Cell Biology 115: 359-372.
Pires JAA, Grummer RR (2007) The use of nicotinic acid to induce sustained low plasma
nonesterified fatty acids in feed-restricted Holstein cows. J Dairy Sci 90: 3725-3732.
Pires JAA, Pescara JB, Grummer RR (2007) Reduction of plasma NEFA concentration by
nicotinic acid enhances the response to insulin in feed-restricted Holstein cows. J Dairy Sci
90: 4635-4642.
Plaisance EP, Grandjean PW, Brunson BL, Judd RL (2008) Increased total and high-
molecular weight adiponectin after extended-release niacin. Metabolism 57: 404-409.
Pond WG, Church DC, Pond KR, Schoknecht PA (2005) Basic animal nutrition and feeding.
5th
edition. Hoboken, NJ: John Wiley & Sons, Inc.
Poynten AM, Gan SK, Kriketos AD, O´Sullivan A, Kelly JJ, Ellis BA, Chisholm DJ,
Campbell LV (2003) Nicotinic acid-induced insulin resistance is related to increased
circulating fatty acids and fat oxidation but not muscle lipid content. Metabolism 52: 699-704.
Price NT, Jackson VN, van der Leij FR, Cameron JM, Travers MT, Bartelds B, Huijkman
NC, Zammit VA (2003) Cloning and expression of the liver and muscle isoforms of ovine
carnitine palmitoyltransferase 1: residues within the N-terminus of the muscle isoform
influence the kinetic properties of the enzyme. Biochem J 372: 871-879.
Puigserver P, Spiegelman BM (2003) Peroxisome proliferator-activated receptor-gamma
coactivator 1 alpha (PGC-1 alpha): transcriptional coactivator and metabolic regulator.
Endocr Rev 24: 78-90.
Quabbe HJ, Luyckx AS, L'age M, Schwarz C (1983) Growth hormone, cortisol, and glucagon
concentrations during plasma free fatty acid depression: different effects of nicotinic acid and
an adenosine derivative (BM 11.189). J Clin Endocrinol Metab 57: 410-414.
Ramsay RR, Gandour RD, van der Leij FR (2001) Molecular enzymology of carnitine
transfer and transport. Biochim Biophys Acta 1546: 21-43.
Ringseis R, Rosenbaum S, Gessner DK, Herges L, Kubens JF, Mooren FC, Krüger K, Eder K
(2013) Supplementing obese Zucker rats with niacin induces the transition of glycolytic to
oxidative skeletal muscle fibers. J Nutr 143: 125-131.

References
59
Risérus U, Sprecher D, Johnson T, Olson E, Hirschberg S, Liu A, Fang Z, Hegde P, Richards
D, Sarov-Blat L, Strum JC, Basu S, Cheeseman J, Fielding BA, Humphreys SM, Danoff T,
Moore NR, Murgatroyd P, O'Rahilly S, Sutton P, Willson T, Hassall D, Frayn KN, Karpe F.
(2008) Activation of peroxisome proliferator activated receptor (PPAR) delta promotes
reversal of multiple metabolic abnormalities, reduces oxidative stress, and increases fatty acid
oxidation in moderately obese men. Diabetes 57: 332-339.
Rivin AU (1962) Hypercholesterolemia-use of niacin and niacin combinations in therapy.
Calif Med 96: 267-269.
Rosen H, Rakita RM, Waltersdorph AM, Klebanoff SJ (1987) Myeloperoxidase mediated
damage to the succinate oxidase system of Escherichia coli. Evidence for selective
inactivation of the dehydrogenase component. J Biol Chem 242: 15004-15010.
Roy H, Bhardwaj S, Ylä-Herttuala S (2006) Biology of vascular endothelial growth factors.
FEBS Lett 580: 2879-2887.
Russell AP, Feilchenfeldt J, Schreiber S, Praz M, Crettenand A, Gobelet C, Meier CA, Bell
DR, Kralli A, Giacobino JP, Dériaz O (2003) Endurance training in humans leads to fiber
type-specific increases in levels of peroxisome proliferator-activated receptor-gamma
coactivator-1 and peroxisome proliferator-activated receptor-alpha in skeletal muscle.
Diabetes 52: 2874-2881.
Ryu YC, Choi YM, Lee SH, Shin HG, Choe JH, Kim JM, Hong KC, Kim BC (2008)
Comparing the histochemical characteristics and meat quality traits of different pig breeds.
Meat Science 80: 363-369.
Ryu YC, Kim BC (2005) The relationship between muscle fiber characteristics, postmortem
metabolic rate, and meat quality of pig longissimus dorsi muscle. Meat Science 71: 351-357.
Schiaffino S, Reggiani C (2011) Fiber types in mammalian skeletal muscles. Physiol Rev 91:
1447-1531.
Schuler M, Ali F, Chambon C, Duteil D, Bornert JM, Tardivel A, Desvergne B, Wahli W,
Chambon P, Metzger D (2006) PGC1α expression is controlled in skeletal muscles by PPAR
β, whose ablation results in fiber-type switching, obesity, and type 2 diabetes. Cell Metab 4:
407-414.

References
60
Schultz L, Yamdagni HS, Gill R (1968) Effect of nicotinic acid on lipid metabolism in
ruminants. J Dairy Sci 51: 955. Abstr.
Schultz LH (1971) Management and nutritional aspects of ketosis. J Dairy Sci 54: 962-973.
Schwab EC, Caraviello DZ, Shaver RD (2005) Review: A meta-analysis of lactation
responses to supplemental dietary niacin in dairy cows. Prof Anim Sci 21: 239-247.
Sciote JJ, Morris TJ (2000) Skeletal muscle function and fibre types: the relationship between
occlusal function and the phenotype of jaw-closing muscles in human. J Orthod 27: 15-30.
Sebastián D, Guitart M, García-Martínez C, Mauvezin C, Orellana-Gavaldà JM, Serra D,
Gómez-Foix AM, Hegardt FG, Asins G (2009) Novel role of FATP1 in mitochondrial fatty
acid oxidation in skeletal muscle cells. J Lipid Res 50: 1789-1799.
Shoubridge EA (2001) Cytochrome c oxidase deficiency. Am J Med Genet 106: 46-52.
Soga T, Kamohara M, Takasaki J, Matsumoto S-H, Saito T, Ohishi T, Hiyama H, Matsuo A,
Matsushime H, Furuichi K (2003) Molecular identification of nicotinic acid receptor.
Biochem Biophys Res Commun 303: 364-369.
Tamai I, Ohashi R, Nezu J, Yabuuchi H, Oku A, Shimane M, Sai Y, Tsuji A (1998)
Molecular and functional identification of sodium ion-dependent, high affinity human
carnitine transporter OCTN2. J Biol Chem 273: 20378-20382.
Tunaru S, Kero J, Schaub A, Wufka C, Blaukat A, Pfeffer K, Offermanns S (2003) PUMA-G
and HM74 are receptors for nicotinic acid and mediate its anti-lipolytic effect. Nat Med 9:
352-355.
URL (2013) ‹http://www.ptdirect.com/training-design/anatomy-and-
physiology/musculoskeletal-system/skeletal-muscle-2013-anatomy-and-fiber-types›, accessed
24.09.2013.
van der Hoorn JW, de Haan W, Berbée JF, Havekes LM, Jukema JW, Rensen PC, Princen
HM. (2008) Niacin increases HDL by reducing hepatic expression and plasma levels of
cholesteryl ester transfer protein in APOE*3Leiden.CETP mice. Arterioscler Thromb Vasc
Biol 8: 2016-2022.

References
61
Vazquez-Añon M, Bertics S, Luck M, Grummer RR, Pinheiro J (1994) Peripartum liver
triglyceride and plasma metabolites in dairy cows. J Dairy Sci 77: 1521-1528.
Villani G, Attardi G, (1997) In vivo control of respiration by cytochrome c oxidase in wild-
type and mitochondrial DNA mutation-carrying human cells. Proc Natl Acad Sci USA 94:
1166-1171.
Villani G, Greco M, Papa S, Attardi G (1998) Low reserve of cytochrome c oxidase capacity
in vivo in the respiratory chain of a variety of human cell types. J Biol Chem 273: 31829-
31836.
Wang W, Basinger A, Neese RA, Shane B, Myong SA, Christiansen M, Hellerstein MK
(2001) Effect of nicotinic acid administration on hepatic very low density lipoprotein-
triglyceride production. Am J Physiol Endocrinol Metab 280: E540-E547.
Wang YX, Zhang CL, Yu RT, Cho HK, Nelson MC, Bayuga-Ocampo CR, Ham J, Kang H,
Evans RM (2004) Regulation of muscle fiber type and running endurance by PPARδ. PLoS
Biol 2: e294.
Warner RD, Kauffman RG, Russell RL (1993) Quality attributes of major porcine muscles: A
comparison with the Longissimus Lumborum. Meat Sci 33: 359-372.
Waterman R, Schultz LH (1972) Nicotinic acid loading of normal cows: Effects on blood
metabolites and excretory forms. J Dairy Sci 55: 1511-1513.
Waterman R, Schultz LH (1973) 1 Carbon 14-Labeled Palmitic Acid Metabolism in Fasted,
Lactating Goats Following Nicotinic Acid Administration. J Dairy Sci 56: 1569-1574.
Waterman R, Schwalm JW, Schultz LH (1972) Nicotinic acid treatment of bovine ketosis I.
Effects on circulatory metabolites and inter-relationships. J Dairy Sci 55: 1447-1453.
Watt MJ, Southgate RJ, Holmes AG, Febbraio MA (2004) Suppression of plasma free fatty
acids upregulates peroxisome proliferator-activated receptor (PPAR) alpha and delta and
PPAR coactivator 1alpha in human skeletal muscle, but not lipid regulatory genes. J Mol
Endocrinol 33: 533-544.
Westphal S, Borucki K, Taneva E, Makarova R, Luley C (2007) Extended-release niacin
raises adiponectin and leptin. Atherosclerosis 193: 361-365.

References
62
Wise A, Foord SM, Fraser NJ, Barnes AA, Elshourbagy N, Eiler M, Ignar DM, Murdock PR,
Steplewski K, Green A, Brown AJ, Dowell SJ, Szekeres PG, Hassall DG, Marshall FH,
Wilson S, Pike NB (2003) Molecular identification of high and low affinity receptors for
nicotinic acid. J Biol Chem 278: 9869-9874.
Wu H, Rothermel B, Kanatous S, Rosenberg P, Naya FJ, Shelton JM, Hutcheson KA, DiMaio
JM, Olson EN, Bassel-Duby R, Williams RS (2001) Activation of MEF2 by muscle activity is
mediated through a calcineurin-dependent pathway. EMBO J 20: 6414-6423.
Wu X, Prasad PD, Leibach FH, Ganapathy V (1998) cDNA sequence, transport function and
genomic organization of human OCTN2, a new member of the organic cation transporter
family. Biochem Biophys Res Commun 246: 589-595.
Wu Z, Puigserver P, Andersson U, Zhang C, Adelmant G, Mootha V, Troy A, Cinti S, Lowell
B, Scarpulla RC, Spiegelman BM (1999). Mechanisms controlling mitochondrial biogenesis
and respiration through the thermogenic coactivator PGC-1. Cell 98: 115-124.
Xu C, Wang Z (2008) Comparative proteomic analysis of livers from ketotic cows. Veterinary
Research Communications 32: 263-273.
Xu C, Wang Z, Liu GW, Li XB, Xie GH, Xia C, Zhang HY (2008) Metabolic characteristic
of the liver of dairy cows during ketosis based on comparative proteomics. Asian Aust J Anim
Sci 21: 1003-1008.
Yoshikawa S, Muramoto K, Shinzawa-Itoh K (2011) Proton-pumping mechanism of
cytochrome c oxidase. Annu Rev Biophys 40: 205-223.
Yu S, Reddy JK (2007) Transcription coactivators for peroxisome proliferator-activated
receptors. Biochim Biophys Acta 1771: 936-951.

Erklärung
Erklärung
„Ich erkläre: Ich habe die vorgelegte Dissertation „Investigations on the effect of nicotinic
acid supplementation on muscle fiber distribution and muscle metabolic phenotype in
pig and sheep“ selbstständig und ohne unerlaubte fremde Hilfe und nur mit den Hilfen
angefertigt, die ich in der Dissertation angegeben habe. Alle Textstellen, die wörtlich oder
sinngemäß aus veröffentlichten Schriften entnommen sind, und alle Angaben, die auf
mündlichen Auskünften beruhen, sind als solche kenntlich gemacht. Bei den von mir
durchgeführten und in der Dissertation erwähnten Untersuchungen habe ich die Grundsätze
guter wissenschaftlicher Praxis, wie sie in der „Satzung der Justus-Liebig-Universität Gießen
zur Sicherung guter wissenschaftlicher Praxis“ niedergelegt sind, eingehalten.“
Gießen, den ……………………………….
Muckta Khan

Der Lebenslauf wurde aus der elektronischen Version der Arbeit entfernt.
The curriculum vitae was removed from the electronic version of the paper.

Acknowledgement
ACKNOWLEDGEMENT
First of all, I would like to express my honest gratefulness to my dissertation supervisor
Professor Dr. Klaus Eder, Director, Institute of Animal Nutrition and Nutritional Physiology,
Justus- Liebig- University, Giessen, Germany. Dr. Eder a man of excellence, from whom I
always received scholastic guidance, constructive suggestions and encouragements in the
journey of my PhD degree. Moreover, he also supports me to defense with academic and non-
academic mental stress, for that, it has been possible for me to finish my degree in time. I will
be grateful to him forever. Thanks a lot Dr. Eder from my heart!
I am grateful to my second supervisor Professor Dr. Frank-Christoph Mooren, Department of
Sports Medicine, Justus-Liebig-University Giessen, Germany, agreeing to supervise me and
helping to enrich the quality of the thesis.
I would especially like to express my heartiest thanks to Dr. Robert Ringseis, for his endless
helping attitude. His valuable suggestions, constructive criticism, and much more supports to
prepare the manuscript are unforgettable. Thank you very much Dr. Ringseis.
I do hereby acknowledge and express my great thanks to Dr. Karsten Krüger, Dr. Gaiping
Wen, Dr. Erika Most, Dr. Janine Keller, Xiaodan and Aline from whom I have learned
various laboratory analyses.
It’s my pleasure to extend my heartiest gratefulness to technical staff members Christian,
Helmut, Marco, Silke, Frauke, Anja, Susanne, Nicole, Dominik, and Annika for their support
in rearing experimental animals, sample collections and laboratory analysis.
I am grateful to my colleagues Denise, Tini, Janine, Aline, Xiaodan, Susann, Gloria, Jule,
Ines, Anja, Lisa, Birthe, Uzman, Anna, Johana and Katharina for their cooperation, scholarly
interactions and friendliness behavior that I always received in my German life. Especially I
would like to express my heartily feelings and love to Denise, a girl full of kind and
intellectual, from whom I had received many helps and suggestions both in academic and
non-academic aspects.
I would like to express my respects and thanks to my parents, brothers, sisters, teachers,
colleagues, relatives and friends, and all other well-wishers, whose blessings,
encouragement, mental support and sympathy were affluence to complete my study.
Last but not least, I would like to express my deepest recognitions to my husband Humayun
Kabir, whose support was always with me. I wish to convey my salute to him. I would wish to
give my love to my little daughters Fariha and Fatima, who were my mental pleasure of these
hard times.
Above all, I am obligated to Almighty Allah for granting me knowledge, healthiness, patience
and strength to carry out this study and enabling me to its completion.


![FORTIFICATION OF WHEAT FLOUR WITH FOLIC ACID AND …), nicotinic acid or nicotinamide and calcium carbonate in the UK [13], the mandatory fortification of flour with folic acid is](https://img.dokumen.tips/doc/110x75/5e34c20a75af48166c6f89b2/fortification-of-wheat-flour-with-folic-acid-and-nicotinic-acid-or-nicotinamide.jpg)


![烟酸 ( Nicotinic Acid )、 烟酰胺 和 NAD + [Co I] 、 NADP + [Co II]](https://img.dokumen.tips/doc/110x75/56814ea8550346895dbc537e/-nicotinic-acid-nad-co-i-nadp-co.jpg)
