Embed Size (px)
Citation preview

Wear 255 (2003) 206–218
Investigations of sand–water induced erosive wear of AISI 304Lstainless steel pipes by pilot-scale and laboratory-scale testing
R.J.K. Wooda,∗, T.F. Jonesba Surface Engineering and Tribology Group, School of Engineering Sciences, University of Southampton, Highfield, Southampton SO17 1BJ, UK
b School of Chemical, Environmental and Mining Engineering, University of Nottingham, University Park, Nottingham NG7 2RD, UK
Abstract
The repair costs of erosion damage caused by solid particle impingement from transporting slurries and other particle-laden liquidsin pipes can be extremely high. In the absence of accurate predictive models, routine monitoring of the pipe wall thickness or theuse of sacrificial coupons are required to warn of erosion damage or impending loss of containment. Apart from advantages for plantmaintenance, the environmental, safety and production implications are enormous. Identification of critical pipe components susceptibleto high levels of damage, and innovative ways to ameliorate the damage, has been an active topic of research for decades. Recent workat University of Nottingham and University of Southampton [Wear 250 (1–12) (2001) 771] has sought definitions of flow fields andparticle dispersions and their relationship to erosive wear to facilitate the development of new designs and geometries for slurry handlingequipment.
This paper covers research that has been aimed at determining the distribution of erosion rates and the erosion mechanisms that occurover wetted surfaces within pilot-scale pipe systems handling water–sand mixtures at 10% by volume concentrations and at a mean fluidvelocity of approximately 3 m/s. Experiments are presented which have been conducted on a test section consisting of an upstream straightpipe section followed by a bend (with a radius of curvature of 1.2 bore diameter) within a 78 mm diameter pipe test loop. The wholeloop and test section was manufactured from AISI 304L stainless steel. The wall wear rates, obtained by gravimetric measurements, as afunction of time are discussed. Circumferential erosion penetration and mechanisms at discrete locations have been measured by surfaceprofilometry on replicas and scanning electron microscopy after cutting-up the pipe sections. The erosion rates and patterns are comparedto those predicted by erosion models linked to computational models for the impact velocity and impact angle in bend and straight sections.Bend wear patterns are further compared to flow visualisation results from a transparent flow loop and electrical resistance tomography(ERT) to confirm the placement of particle burdens. The erosion rates, expressed as volume loss per impact (determined gravimetrically andvia computer models) in bends are found to agree well with simple laboratory-scale water–sand jet impingement tests on planar stainlesssteel samples. The pipe loss data alone represents a significant resource for future erosion researchers to reference.© 2003 Elsevier Science B.V. All rights reserved.
Keywords: CFD; Erosion; Pipes; Modelling
1. Introduction
Efficient transportation of particle-bearing fluids and slur-ries is essential to many key industrial processes. An unfor-tunate consequence is damage from particle impingement,particularly at bends. Accurate prediction of this conse-quence is not possible for a number of reasons not least theprobabilistic nature of the impacts themselves and the inho-mogeneous nature of the pipe surfaces. Routine monitoringof pipe walls or the implantation and regular inspection ofsacrificial coupons can be used to schedule replacements or
∗ Corresponding author. Tel.:+44-238-059-4881;fax: +44-238-059-3230.E-mail address: [email protected] (R.J.K. Wood).
maintenance, but the identification of the sections most atrisk is still difficult.
The propensity to wear of bends and straights has beenstudied in a collaboration between the University of Not-tingham and University of Southampton[1,3,4]. This paperconcerns the rates and mechanisms of erosion for specificpipe geometries. Pilot-scale pipe loop tests using sand andwater mixtures, laboratory-scale sample testing and mod-elling had to be brought to bear on the problem. The labo-ratory work included free water–sand jet impingement testson planar stainless steel samples. Typical pipeline transportflow velocities have been studied which generate asymmet-ric solid dispersions.
Vital to the modelling effort was the calculation of theposition of particles in the pipe. Although not availablefor sand/water, electrical resistance tomography (ERT), and
0043-1648/03/$ – see front matter © 2003 Elsevier Science B.V. All rights reserved.doi:10.1016/S0043-1648(03)00095-4

R.J.K. Wood, T.F. Jones / Wear 255 (2003) 206–218 207
Nomenclature
Ck cutting characteristic velocity (m/s)Cv solids volume fraction (–)D diameter of a pipe bore (m)Fm average feed per size class of particle (kg)Ft total feed of particles (kg)Is number of impacts (impacts/s)L/D length to diameter ratio (–)Mp particle mass (kg)n velocity ratio exponent (2.54 for carbon steel,
Hashish[2]) (–)Qv volume flow rate (m3/s)rp particle radius (m)RMC root-mean-cube size between sieves,
3√
(upper size3 + lower size3)/2 (�m)Rc radius of curvature of a pipe bend (m)Rf roundness factor for particle (value 0–1) (–)S50 (d50) median sieve size of particles (�m)Up particle impact velocity (m/s)V flow velocity (m/s)Vl rate of volume loss (m3/s)Vu erosion rate (�m3/impact)
Greek lettersα angle of impingementρp density of particle (kg/m3)σ plastic flow stress for target (Pa)φ erosion efficiency, the ratio of impacting
solids to total solids loading (%)
flow visualisation results were available for 2 mm beads ina straight pipe of 50 mm bore.
2. Slurry erosion modelling
Slurry erosion is a complex and under-researched areaand robust models have yet to be developed. This is certainlytrue for erosion of pipelines and the problem is compoundedby the fact that most published literature on the wear ofpipework relates to pneumatic conveying systems. Meng andLudema[5] quotes 33 independent parameters in a recentreview of 22 erosion models and predictive equations foundin the literature.
Bends are an important part of most practical pipe con-figurations. Understanding the particle trajectories throughbends is of great importance if wear rates are to be pre-dicted at specific locations. Blanchard et al.[6] attempteda two-dimensional model of particle trajectories in liquidflows within bends but with limited success due to the in-ability of the model to predict secondary flows. Forder[7]has studied solid particle trajectories in liquid flows in pipebend geometry before modelling more complex flows in
choke valves using a commercial CFD code. He extendeda commercial CFD programme to include a predictive ero-sion element based on a combined deformation and cuttingerosion model. The model was tested by comparing the pre-dicted wear rates and wear locations in pipe bends with theexperimental air/sand erosion results of Bourgoyne[8], withexcellent correlations. Further experimental wear results forpipe bends could be used to test this approach in the fu-ture such as reported by King et al.[9] and Wiedenroth[10] for a limited range of bend geometries, materials andsolid–liquid flows. Chen et al.[11] has included a stochasticrebound model in a similar approach to Forder to investigatethe modelling of erosion in elbows and plugged tees. Thestochastic rebound model was found to have little effect onthe predicted erosion of elbows subjected sand–water mix-tures while differences were seen in the plugged tee geom-etry exposed to air–sand flows.
However, Wiedenroth found the erosion rate to be propor-tional toV2.4, whereV is the mean particle velocity taken asbeing equal to the flow velocity, for pipework downstreamfrom an elbow in a 125 mm diameter steel pipework sys-tem tested at 8.2 m/s with 30% concentration of 990�m di-ameter sand. This confirms that erosion models based on aparticle velocity raised to a power of approximately 2.5 areapplicable to pipe geometries. Symbols and their definitionswas found in Nomenclature.
The redistribution of solids inside horizontal bends formultisized particulate slurries has been experimentally stud-ied by Ahmed et al.[12]. Conclusions from this work pointto the redistribution of large particles outwards to the likelycause of rapid bend erosion. A simple approach to erosionmodelling might involve a single function to characteriseerosion over the wide range of particle sizes and velocitiesencountered in industry. However, this would ignore param-eters, such as corrosion rate, squeeze film damping, Clarkand Burmeister[13], centrifugal particle redistribution, par-ticle rebound, asymmetry of flow patterns and particle frag-mentation/degradation on impact.
Both the straight section and bend geometry were grid-ded into a computational fluid dynamics (CFD) model. Thedata used for the erosion prediction are given inTable 1(along with data for plastic beads used in visualisation
Table 1Values of parameters used in the computational models
Parameters Value forcase 1sand/water
Value forcase 2beads/water
Volume flow rate,Qv (m3/s) 0.01 0.002Pipe bore (m) 0.078 0.05Particle velocity on entry,Up (m/s) 3 1Particle density,ρp (kg/m3) 2650 1480Roundness factor,Rf 0.5 0.5Plastic flow stress,σ (Pa) 1E+09 1E+09Particle radius,rp (m) 5E−04 1E−03Velocity ratio exponent,n 2.54 2.54Particle mass,Mp (kg) 1.4E−06 6.2E−06

208 R.J.K. Wood, T.F. Jones / Wear 255 (2003) 206–218
Fig. 1. Model results for planes on the straight (0◦) and 45◦ around the bend. (a) Impact velocity of sand particles with the inner surface of the pipewall for case 1. (b) Angle of impact of particles with inner surface of the pipe wall. Mean inlet free stream velocity of 3 m/s, 10% by volume solidconcentration and sand diameter of 1 mm.
experiments). Two-planes are analysed: one transverse planemid-way along the straight, and the other at 45◦ around thecurvature of the bend.
A CFD code [Fluent Version 5.4, Fluent Inc., CenterraResearch Park, 10 Cavendish Court, Lebanon, NH 03766,USA] with an algebraic slip mixture model and adiscretephase model was used to track the sand particles withinthe horizontal bend and straight geometries. The authorsused the well-respectedk–ε turbulence closure model, wherek refers to the turbulent kinetic energy (J) andε refersto its local rate of dissipation (J/s). The development oftwo-equation turbulence models in the 1970s is well de-scribed by Spalding and Launder[27]. Modest computationtimes with thek–ε model routinely allowed several sets ofconditions to be tested in the compass of a single day. Vali-dations of the model for swirling pipeflow are described byJones and Ganeshalingam[28].
By tracking the path of sand particles through the bendgeometry, the number of particles which became “trapped”on the surface (i.e. those that may represent impact) couldbe evaluated. The starting locations of the particles wererandomly distributed at the inlet to the bend geometry. Thisanalysis showed that on average between 8 and 20% ofparticles impinge on the bend surface at plane 45◦ while40% impinge on the straight at plane 0◦. Although this isa simple model which assumes no inlet swirl or particlecloud shielding of the surface or possible particle–particleinteractions, it does provide an order of magnitude check
on the likely probability of impingement rates and allows atypical erosion efficiencyφ to be set at 0.2.
Table 1represents two cases in which the particle burdenwould be asymmetrically placed:
Case 1. It represents a mixture of sand and water tested atan axial velocity of 3 m/s. These were used for theerosion study.
Case 2. It represents a mixture of water and barium-dopedplastic beds at a relatively low axial velocity (1 m/s).These were only used for the flow visualisation andERT experiments.
To obtain the near wall particle velocities the Fluent Ver-sion 5.4 CFD code with an algebraic slip mixture model wasused and the results for case 1 is plotted inFig. 1. For aninlet free stream velocity of 3 m/s and spherical particles of1 mm diameter with a density of 2650 kg/m3 and Rc/D =1.2, D = 77.8 mm, the average near wall particle velocitywas 2.22 m/s or 74% of free steam velocity for the bendplane at 45◦.
3. Experimental work
3.1. Case 1: pilot-scale work on sand and water
The pilot-scale sand/water rig is sketched inFig. 2. Thepipe loop was constructed in the horizontal plane with a

R.J.K. Wood, T.F. Jones / Wear 255 (2003) 206–218 209
Fig. 2. Slurry loop layout showing approximate dimensions and approximate position of components straight 43 and bend 65.
Fig. 3. Drawings of bend 65 and straight section 43 used in the working section.
valve to allow flow to be diverted to another loop as neces-sary. A high power gate stirrer was installed to help to dis-tribute the solids in the tank. Pipe components were made ofAISI 304L stainless steel with a nominal wall thickness of5 mm. The pipes were of 80 mm nominal bore, although theactual mean of a series of measurements was 77.8 mm. Bend65 had the greatest curvature of the whole loop (Rc/D = 1.2)and, with its upstream straight 43 is analysed for its flowcharacteristics and propensity to wear in this paper. Detailsof these components are shown inFig. 3.
3.2. Sand erodent details
The subangular to subrounded silica sand used, in bothpilot loop and laboratory jet impingement tests was fromthe Leighton Buzzard Quarry of Hepworth Minerals andChemicals Ltd. and had a size distribution is shown inFig. 4.The density of the silica sand was 2650 kg/m3 with a nominalhardness of 1100 HV.
3.3. Sand volume fraction calibration
A calibration study was first undertaken to ascertain theactual concentration (by volume) in the pipe (“in situ” con-centration) when a given bulk quantity of sand had beenloaded. A full load of water (1500 l) was metered and thelarge gate stirrer in the tank was started before a series of
weight of sand were added. Large-bin samples were takenfrom the circulating mixture to calculate the in situ concen-tration for the knowntotal concentration (obtained from thetotal volume of sand and the total volume of water). Thiscalibration was then used to determine the sand weight re-quired for a given in situ concentration (by volume).
3.4. Sand competency
Following the calibration study a series of tests weredone to investigate the competence of the sand erodent after
Fig. 4. Sand size distribution for the bend and jet impingement tests.

210 R.J.K. Wood, T.F. Jones / Wear 255 (2003) 206–218
prolonged circulation in the rig. After each test, a sampleof the sand was taken. The sample was classified by size sothat the performance of different size classes could be ex-amined. A small subsample of each size class (usually about100 grains) was carefully separated and imaged with a mi-croscope. A simple estimate of the curvature of the sharpcorners was provided by thecircularity metric
Circularity = (particle perimeter)2
particle area(1)
A further aspect of degradation was expected to be an equal-ising effect on the dimensions of the grains. Long grainswould be expected to be shortened by the attrition process.This effect could be expressed as anaspect ratio. This met-ric uses the longest axial dimension of the plane profile ofthe particle and the maximum width measured in this planeat right angles to this axis
Aspect ratio
= length of the major axis
width measured at right angles to the major axis(2)
Hence degradation could be shown as a locus on a graph ofmean circularity (over the subsample) against mean aspectratio. A typical locus is shown inFig. 5 for a test in whichsand at 10% concentration by volume was pumped at 3 m/sfor 14 h. The expected reduction in both aspect ratio andcircularity was evident in most size classes (bearing in mindthe smallness of the subsample for microscope imaging),but for the largest size class a slight increase in aspect ratiowas indicated in some samples. For the same test the usedsand showed a reduction of the median sizeS50 from 940to 920�m.
Tests were carried out at a range of concentrations from5 to 18% by volume and velocities from 3 to 7 m/s. In mostcases the shape change was significant whatever the condi-tions. It was concluded that sand should be changed at the
Fig. 5. Degradation of particle shape by size class after 14 h of pumping (concentration of sand 10% by volume, velocity 3 m/s).
most frequent interval (i.e. after every test) to ensure its ef-ficiency as an erodent.
For the pilot study, a slurry of 10% concentration by vol-ume of sand in water (pH 10, Cl 500 ppm) was circulatedaround the loop at a flow rate of 0.01 m3/s to give a meanflow velocity of 3 m/s over 210 h. Following a test (7 or14 h of running at a specific test condition), the sand slurrywas emptied and retained in tanks. Sand was sampled fordegradation tests as described above before being discarded.The loops were then carefully dismantled for cleaning andweighing.
3.5. Gravimetric technique
Pipe sections were prepared for weighing by firstly thor-oughly rinsing with water to remove any sand and thencleaned with warm 5% citric acid to remove calcite depositson internal surfaces. This was necessary to allow the changein mass of the pipe sections to be attributed solely to erosion.The pipes were then allowed to air dry, usually overnight,prior to weighing.
Weighing was carried out on a bespoke apparatus consist-ing of four Ohaus® Explorer electronic balances controlledby means of the RS232 interface and a single personal com-puter. The final mass of each pipe section could be comparedto the initial mass at the start of the test series to provide atotal mass loss for the 210 h runtime.
3.6. Case 2: experimental setups for ERT usingbead/water mixtures
A 50 mm bore hydraulic conveying pipe loop composedof transparent 1 m flanged sections in a vertical plane wasused for the experiments. The pumped media comprisedwater and cylindrical non-conductive beads (diameter 2 mmand relative density 1.45) as a simulant for an industrial

R.J.K. Wood, T.F. Jones / Wear 255 (2003) 206–218 211
Fig. 6. Typical ERT location (after swirl pipe in this case) and the tomographic sensor.
settling slurry (coal particles have a relative density of ap-proximately 1.4 for example). ERT sensors were fitted at150, 370, 885 and 1150 mm separately and away from theoutlet of a straight pipe givingL/D ratios of 3, 7.4, 17.7and 23.L/D ratio is defined as the ratio of the downstreamdistance (L) to the pipe diameter (D). A series of concen-trations (3, 6, 9 and 12%) and flow velocities (0.5, 1, 1.5,2 and 2.5 m/s) were used in the experiments. Each plane ofERT sensors was fitted with 16 electrodes, evenly distributedalong the inner wall of the pipe. The size of each stainlesssteel electrode was 6 mm wide by 18 mm in length.Fig. 6shows the installed ERT sensor atL/D = 3.
Measurements were made using a commercial ITS-P2000ERT system[14]. A current injection protocol based on exci-tation of adjacent electrodes using 10 kHz alternating currentwas used. The gains of pre-amplifiers for all measurementwere acquired by automatic calibrations. Both single planeand the two-plane arrangements were used in measurements.Images were reconstructed using a sensitivity-coefficientback-projection algorithm.
3.7. Laboratory-scale work
The jet impingement test used a 5.4 mm diameter jet noz-zle to generate a free jet of 3.5 m/s that impinged at 90◦onto a planar sample of AISI 304L stainless steel. The testwas conducted for 6 h with a slurry (pH 10, Cl 500 ppm)containing 4.1% sand by volume. The bend, straight and theplanar samples had an initial surface roughnessRa of 6.5and 0.28�m, respectively. The jet impingement rig was de-signed according to a similar rig developed at the Universityof Cambridge[15] and is a once through system (avoidingthe effects of recirculation and the blunting or fragmentationof sand particles). The test solution was circulated aroundthe rig via a centrifugal pump situated at the bottom of therig. The solid particles from the tank were drawn into the jetthrough an ejector assembly. It was then mixed with the testsolution before exiting through the outer nozzle as a free jet.
3.8. Gravimetric technique
Samples pre- and post-tests were carefully cleaned withwarm 5% citric acid to remove any calcite deposits on inter-nal surfaces and dried before weighing on a precision massbalance to within±0.1 mg.
4. Analysis of results
4.1. Case 1: gravimetric results from the sand/waterpilot rig
Large differences between values of wear rates per wettedarea for different pipe geometries were noted. For example,for bend 65, it was nearly five times greater than the valuefor the preceding straight 43 (seeTable 2).
The mass loss can be viewed as a time series. The slopeof this function was positive although the rate appeared tovary during the tests. This variation was noticeable in bothcomponents (seeFig. 7).
4.2. Case 2: ERT and flow visualisation results
A typical flow regime from the flow of 2 mm non-conduc-tive beads in a conventional cylindrical pipe of 50 mm boreis revealed by tomographic and photographic evidence inFig. 8. The straight pipe shows that in asymmetric flow asmall region of the wetted area can be in use by the particleburden. The evidence from gravimetric tests indicates thatuse of the wetted area by the particle burden is important
Table 2Total mass loss and estimated wear rate
Component Final massloss (210 h)
Rate ofwear (g/h)
Rate of wear perwetted area (g/(h m2))
Bend 9.45 0.05 0.78Straight 4.75 0.02 0.16

212 R.J.K. Wood, T.F. Jones / Wear 255 (2003) 206–218
Fig. 7. Wall wastage for pilot-scale tests, 1 mm sand, 10% by volume and 3 m/s flow velocity.
in the wall wastage which results from the flow. In anotherway, the position of the particles in the pipe, and the kineticenergy of those particles, are prime determinants of wear.
4.3. Surface examinations of internal pipe surfaces
Post-test surface analysis was performed on small sampleswhich had been cut from the pipe sections after the wear testwas complete. The overall eroded surface topography wasmeasured using a contact profilometer (Taylor Hobson FormTalysurf 120L, Leicester, UK) while the erosion mechanismspresent on the surface were identified using a FEG-SEM.
Fig. 9a shows the topography of the top of the straightsection 43 of pipe, at position A, there is little or no evi-dence of erosion damage of the pipe surface. This is to beexpected as the flow is asymmetric with most solids be-
Fig. 8. Tomographic and photographic evidence of the flow patterns of a bead–water mixture comprising 2 mm beads of relative density 1.45 with meanconcentration 6% by volume, and overall mean flow velocity 1 m/s.
ing transported in the bottom 25% of the pipe cross-sectionminimising sand impingement at position A. Thus, the to-pography at position A is that of the ‘as-received’ state withthe original manufacturing marks still visible. In contrast,Fig. 9b shows the topography at position E (bottom) and thesurface has been clearly eroded and/or polished (removal ofmanufacture marks, etc.) resulting in a rippled surface finishwith a wavelength of approximately 0.5 mm. The erosion islikely to result from low angle (<6◦) impingements as pre-dicted by the CFD model is shown inFig. 1b.
SEM investigations of straight pipe erosion mechanismsare shown inFigs. 10 and 11. Fig. 10shows the surface atposition A in the straight pipe at different magnificationsand is consistent with that of the as-manufactured surfacefinish. There appears to be no significant erosion impactdamage although a few individual impact craters are seen

R.J.K. Wood, T.F. Jones / Wear 255 (2003) 206–218 213
Fig. 9. 3D Talysurf images of the straight pipe section after 210 h (arrows indicate flow direction).
Fig. 10. SEM micrographs showing surface morphology of straight position A (top) (after 210 h).

214 R.J.K. Wood, T.F. Jones / Wear 255 (2003) 206–218
Fig. 11. SEM micrographs showing the surface morphology of the straight position E (top) (after 210 h).
due to impacts from the relatively few sand particles that areentrained into the energetic upper fluid flow.
Fig. 11a shows that the as-manufactured surface finish hasbeen removed at position E in the straight pipe. InFig. 11b,the impact features reveal that the erosion processes occurredby a simultaneous plastic deformation and micro-cutting ofthe stainless steel pipe surface, similar to type II cuttingmentioned by Hutchings[16] when erodent rolls backwardson impact and efficiently machine the surface.
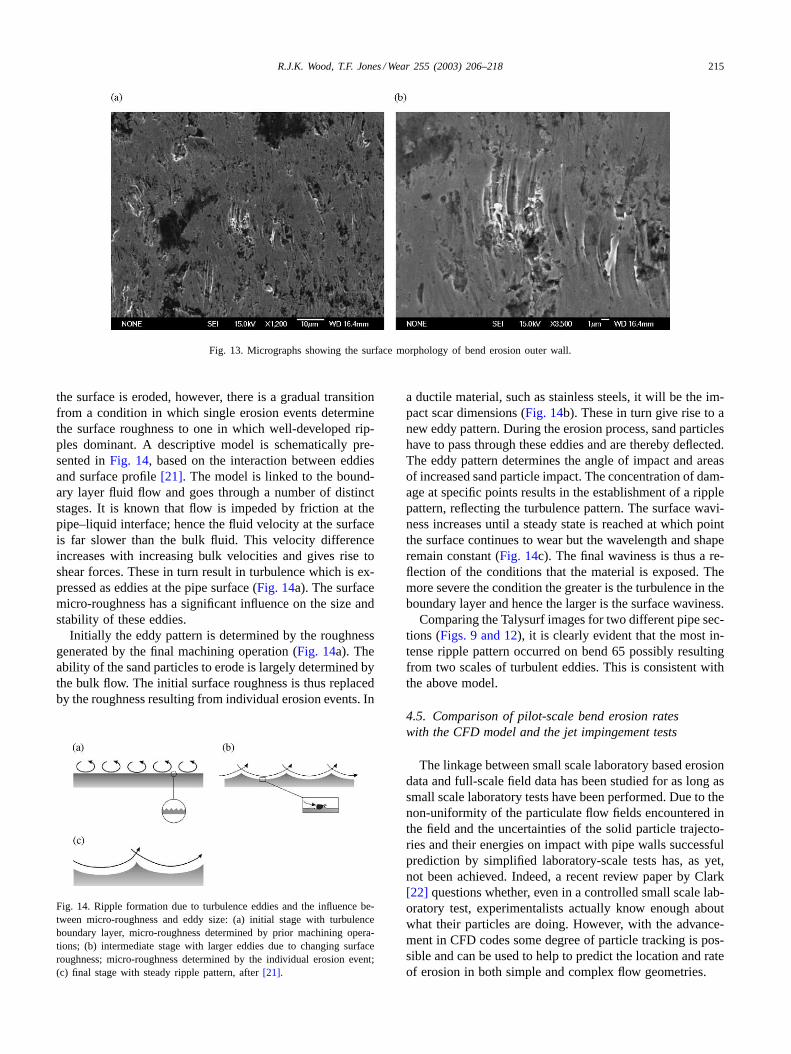
Fig. 12 shows the typical topography of bend 65 at po-sition E (bottom) of the 45◦ plane whileFig. 13shows theSEM micrographs. The surface has been clearly eroded withevidence of low angle impingements with extensive plasticdeformation and cutting (type II) resulting in the removal ofthe as-manufactured surface morphology. The damage pat-terns are consistent with the impact angles predicted by theCFD modelling is shown inFig. 1b. In Fig. 12there are twoscales of damage visible. A large ripple pattern with a 2 mm
Fig. 12. 3D Talysurf image of a replica of the bend section at plane 45◦ after 140 h.
wavelength perpendicular to the flow direction and 12�min depth. Within these features are numerous small ripplesagain perpendicular to the flow direction but 25�m in wave-length and only 0.5�m deep.Fig. 14shows that both theseripple features are a result of multiple craters from sand im-pacts. Some impact scars are clearly seen and are 1–2�mwide and 5�m long (far smaller contact area that the nom-inal size of the sand particles would suggest).
4.4. Discussion of mechanisms/patterns ofsurface damage
The formation of waves or ripples on the surface of ma-terials subject to small-angle impingement erosion has beenwidely observed and models for its formation described[17–21].
Typically ripple formation occurs in a uniform and steadyfluid flow. In addition, ripples do not form immediately when
R.J.K. Wood, T.F. Jones / Wear 255 (2003) 206–218 215
Fig. 13. Micrographs showing the surface morphology of bend erosion outer wall.
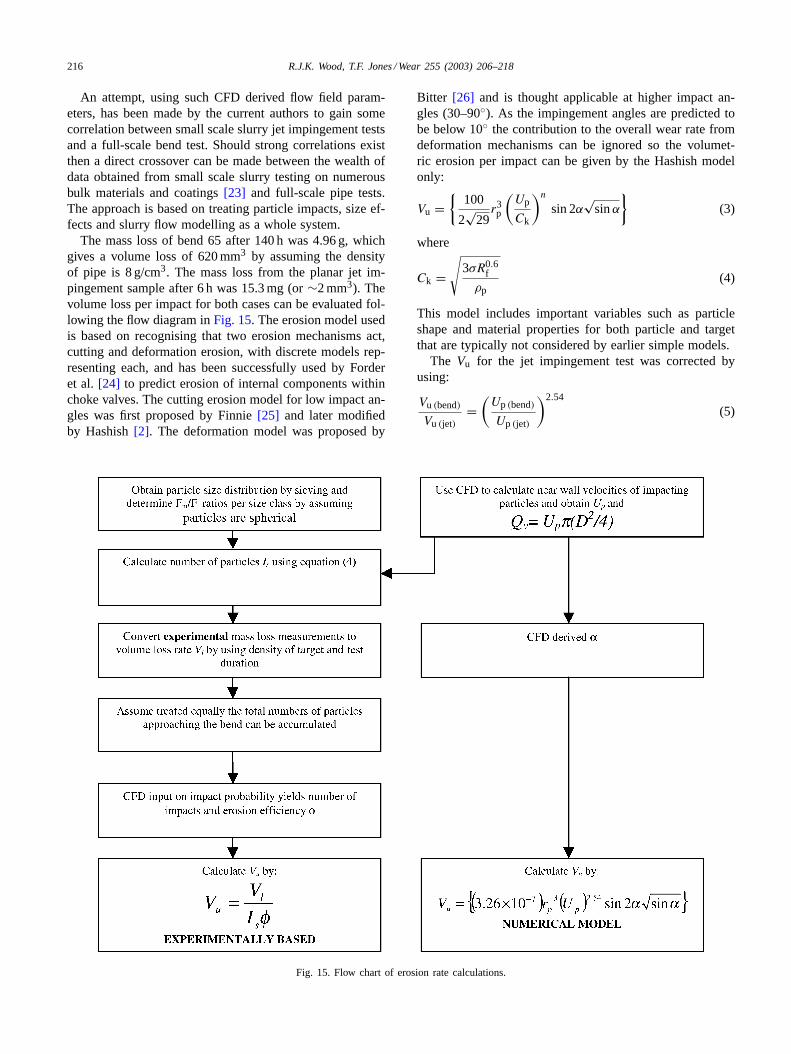
the surface is eroded, however, there is a gradual transitionfrom a condition in which single erosion events determinethe surface roughness to one in which well-developed rip-ples dominant. A descriptive model is schematically pre-sented inFig. 14, based on the interaction between eddiesand surface profile[21]. The model is linked to the bound-ary layer fluid flow and goes through a number of distinctstages. It is known that flow is impeded by friction at thepipe–liquid interface; hence the fluid velocity at the surfaceis far slower than the bulk fluid. This velocity differenceincreases with increasing bulk velocities and gives rise toshear forces. These in turn result in turbulence which is ex-pressed as eddies at the pipe surface (Fig. 14a). The surfacemicro-roughness has a significant influence on the size andstability of these eddies.
Initially the eddy pattern is determined by the roughnessgenerated by the final machining operation (Fig. 14a). Theability of the sand particles to erode is largely determined bythe bulk flow. The initial surface roughness is thus replacedby the roughness resulting from individual erosion events. In
Fig. 14. Ripple formation due to turbulence eddies and the influence be-tween micro-roughness and eddy size: (a) initial stage with turbulenceboundary layer, micro-roughness determined by prior machining opera-tions; (b) intermediate stage with larger eddies due to changing surfaceroughness; micro-roughness determined by the individual erosion event;(c) final stage with steady ripple pattern, after[21].
a ductile material, such as stainless steels, it will be the im-pact scar dimensions (Fig. 14b). These in turn give rise to anew eddy pattern. During the erosion process, sand particleshave to pass through these eddies and are thereby deflected.The eddy pattern determines the angle of impact and areasof increased sand particle impact. The concentration of dam-age at specific points results in the establishment of a ripplepattern, reflecting the turbulence pattern. The surface wavi-ness increases until a steady state is reached at which pointthe surface continues to wear but the wavelength and shaperemain constant (Fig. 14c). The final waviness is thus a re-flection of the conditions that the material is exposed. Themore severe the condition the greater is the turbulence in theboundary layer and hence the larger is the surface waviness.
Comparing the Talysurf images for two different pipe sec-tions (Figs. 9 and 12), it is clearly evident that the most in-tense ripple pattern occurred on bend 65 possibly resultingfrom two scales of turbulent eddies. This is consistent withthe above model.
4.5. Comparison of pilot-scale bend erosion rateswith the CFD model and the jet impingement tests
The linkage between small scale laboratory based erosiondata and full-scale field data has been studied for as long assmall scale laboratory tests have been performed. Due to thenon-uniformity of the particulate flow fields encountered inthe field and the uncertainties of the solid particle trajecto-ries and their energies on impact with pipe walls successfulprediction by simplified laboratory-scale tests has, as yet,not been achieved. Indeed, a recent review paper by Clark[22] questions whether, even in a controlled small scale lab-oratory test, experimentalists actually know enough aboutwhat their particles are doing. However, with the advance-ment in CFD codes some degree of particle tracking is pos-sible and can be used to help to predict the location and rateof erosion in both simple and complex flow geometries.
216 R.J.K. Wood, T.F. Jones / Wear 255 (2003) 206–218
An attempt, using such CFD derived flow field param-eters, has been made by the current authors to gain somecorrelation between small scale slurry jet impingement testsand a full-scale bend test. Should strong correlations existthen a direct crossover can be made between the wealth ofdata obtained from small scale slurry testing on numerousbulk materials and coatings[23] and full-scale pipe tests.The approach is based on treating particle impacts, size ef-fects and slurry flow modelling as a whole system.
The mass loss of bend 65 after 140 h was 4.96 g, whichgives a volume loss of 620 mm3 by assuming the densityof pipe is 8 g/cm3. The mass loss from the planar jet im-pingement sample after 6 h was 15.3 mg (or∼2 mm3). Thevolume loss per impact for both cases can be evaluated fol-lowing the flow diagram inFig. 15. The erosion model usedis based on recognising that two erosion mechanisms act,cutting and deformation erosion, with discrete models rep-resenting each, and has been successfully used by Forderet al. [24] to predict erosion of internal components withinchoke valves. The cutting erosion model for low impact an-gles was first proposed by Finnie[25] and later modifiedby Hashish[2]. The deformation model was proposed by
Fig. 15. Flow chart of erosion rate calculations.
Bitter [26] and is thought applicable at higher impact an-gles (30–90◦). As the impingement angles are predicted tobe below 10◦ the contribution to the overall wear rate fromdeformation mechanisms can be ignored so the volumet-ric erosion per impact can be given by the Hashish modelonly:
Vu ={
100
2√
29r3p
(Up
Ck
)n
sin 2α√
sinα
}(3)
where
Ck =√
3σR0.6f
ρp(4)
This model includes important variables such as particleshape and material properties for both particle and targetthat are typically not considered by earlier simple models.
The Vu for the jet impingement test was corrected byusing:
Vu (bend)
Vu (jet)=
(Up(bend)
Up(jet)
)2.54
(5)

R.J.K. Wood, T.F. Jones / Wear 255 (2003) 206–218 217
Table 3Values of parameters used in evaluating erosion rates from actual bend mass loss data, CFD predictions and jet impingement tests
Bend with Rc/D = 1.2 CFD+ erosion model ofRc/D = 1.2 bend
Jet impingement
Experimental measurementsMass loss (g) 4.96 0.0153Volume loss (mm3) 620 2
CalculationsBore (mm) 77.8 77.8 5.4Inlet particle velocity (m/s) 3 3 3.5Near wall particle velocity,Up (m/s) 2.22 2.22 3.5Volumetric flow rate,Qv (m3/s) 0.0106 NA 8× 10⁻⁵
Solids concentration by volume,Cv 0.1 0.1 0.041Solids flow rate,Qs (m3/s) 0.00106 NA 3.28× 10⁻⁶
RMC diameter of particle (�m) 995.4 995.4 995.4Number of impacts,Is (impacts/s) 2.8× 10⁶ NA 8.72 × 10³
Erosion efficiency,φ (%) 8–20 100 100Test duration,t (h) 140 NA 6Raw erosion rate,Vu (�m3/impact) 2.2–5.5 5.5 10.2
Corrected erosion rate,Vu for Up = 2.22 m/s (�m3/impact) 2.2–5.5 5.5 3.2
For the jet erosion case, hold-up was ignored (zero slip) andall particles are assumed to impinge (erosion efficiency=100%). TheVu derived from actual mass loss measurementsof the bend (range between 2.2 and 5.5�m3/impact) and jetimpingement samples (3.2�m3/impact) are in good agree-ment. The CFD and erosion model predicts an averageVuat the 45◦ plane of 5.5�m3/impact which is expected to bethe most severe and thus would have higher erosion rates.
Comparison of the predicted erosion rates for planes 45◦in the bend and plane 0◦ in the preceding straight havebeen reported earlier by the authors[3] and showed that therates at plane 45◦ are approximately three times those in thestraight. This compares reasonably well with the gravimetricresults from the loop tests, which integrate all planes in thecomponents, that show a five times difference, seeTable 3.
5. Conclusions
The erosion of an upstream straight followed by a bendwith a radius of curvature of 1.2 bore diameters within a78 mm diameter pipe test loop handling water–sand mix-tures at 10% by volume concentrations and at a mean fluidvelocity of approximately 3 m/s have been investigated ex-perimentally on a full-scale loop facility and by CFD mod-elling. The following main conclusions can be drawn:
1. The test sand was found to degrade in the erosion tests ofthe steel pipework and therefore needs regular replace-ment.
2. Flow visualisation on a transparent test section and ERTon the straight section verified the particle concentrationprofiles generated by the CFD code.
3. The erosion predictions derived from the CFD and ero-sion model were in good agreement with actual damagerates and patterns found in full-scale loop testing.
4. In addition, good agreement was also achieved when theCFD derived erosion rate values were compared to sim-ple laboratory-scale water–sand jet impingement tests onplanar stainless steel samples.
5. The bend wear patterns were found to consist of vari-ous scales of ripples, indicating sand was entrained intovarying levels of intensity and scales of turbulence nearto the walls. The bends appear to have at least two scalesof ripple wavelengths 2000 and 25�m while the straightappeared to have ripples of 500�m wavelength.
6. Type II micro-cutting was found to be the dominant ero-sion mechanism from impacts of angular sand at low an-gles to the surface.
Acknowledgements
The authors wish to thank BHR Group for their kindpermission to reproduce certain figures and text from paperspublished in the Hydrotransport conference series.
References
[1] R.J.K. Wood, T.F. Jones, N. Miles, J. Ganeshalingam, Upstreamswirl-induction for reduction of erosion damage from slurries inpipeline bends, Wear 250 (1–12) (2001) 771–779.
[2] M. Hashish, An improved model of erosion by solid particles, in:Proceedings of the Seventh International Conference on Erosionby Liquid and Solid Impact, Paper 66, Cavendish Laboratory,Cambridge, 1988.
[3] R.J.K. Wood, T.F. Jones, J. Ganeshalingam, M. Wang, Erosionmodelling of swirling and non-swirling slurries in pipes, in: BHRGroup, Proceedings of the Hydrotransport 15, Banff, Canada, June3–5, 2002, 497 pp.
[4] R.J.K. Wood, T.F. Jones, J. Ganeshalingam, Erosion in swirl inducingpipes, in: Proceedings of the ASME Fluids Engineering DivisionSummer Meeting, Paper FEDSM2002-31287, Montreal, Canada,ASME International, July 2002.
218 R.J.K. Wood, T.F. Jones / Wear 255 (2003) 206–218
[5] H.C. Meng, K.C. Ludema, Wear models and predictive equations—their form and content, Wear 181–183 (1995) 443–457.
[6] D.J. Blanchard, P. Griffith, E. Rabinowicz, Erosion of a pipe bendby solid particles entrained in water, J. Eng. Ind. 106 (1984) 213–217.
[7] A. Forder, A computational fluid dynamics investigation into theparticulate erosion of oilfield control valves, Ph.D. Thesis, Schoolof Engineering Sciences, University of Southampton, 2000.
[8] A.T. Bourgoyne, Experimental study of erosion in diverter systemsdue to sand production, in: Proceedings of the SPE/IADC DrillingConference, vol. 807, SPE/IADC 18716, Society of PetroleumEngineers, 1989.
[9] R. King, B. Jacobs, G. Jones, Factors affecting the design of slurrytransport systems for minimum wear, in: BHR Group, Proceedingsof the Pipe Protection Conference, vol. 67, Cannes, France, Elsevier,Amsterdam, 1991.
[10] W. Wiedenroth, An experimental study of wear of centrifugal pumpsand pipeline components, J. Pipelines 4 (1984) 223–228.
[11] X. Chen, B.S. McLaury, S.A. Shirazi, Effects of applying a stochasticrebound model in erosion prediction of elbow and plugged tee, in:Proceedings of the ASME 2002 Fluids Engineering Division SummerMeeting, Paper FEDSM2002-31289, Montreal, Que., Canada, ASMEInternational, July 14–18, 2002.
[12] M. Ahmed, S.N. Singh, V. Seshadri, Distribution of solid particlesin multisized particulate slurry flow through a 90◦ pipe bend inhorizontal plane, Bulk Solids Hand. 13 (2) (1993) 379–385.
[13] H. Clark, C. Burmeister, The influence of the squeeze film on particleimpact velocities in erosion, Int. J. Impact Eng. 12 (1992) 415–426.
[14] G.P. Lucas, J. Cory, R. Waterfall, W.W. Loh, F.J. Dickin, Mea-surement of the solids volume fraction and velocity distributions insolids–liquid flows using dual-plane electrical resistance tomography,J. Flow Meas. Instrum. 10 (4) (1999) 249–258.
[15] J.B. Zu, I.M. Hutchings, Design of a slurry erosion test rig, Wear140 (1990) 331–344.
[16] I.M. Hutchings, Tribology: Friction and Wear of EngineeringMaterials, Arnold, Paris, 1992, p. 175.
[17] G.R. Abrahamson, Permanent periodic surface deformations due toa travelling jet, J. Appl. Mech. E 83 (1961) 519–528.
[18] A.K. Cousens, I.M. Hutchings, in: J.E. Field, N.S. Corney (Eds.),Proceedings of the Sixth International Conference on Erosionby Liquid and Solid Impact, Paper 41, Cavendish Laboratory,Cambridge, 1983.
[19] G. Carter, The mechanism of ripple generation on sandblasted ductilesolids, in: M.J. Nobes, K.I. Arshak (Eds.), Wear, vol. 65, 1980,pp. 151–174.
[20] J. Stringer, I.G. Wright, in: J.E. Field, J.P. Dear (Eds.), Proceedingsof the Seventh International Conference on Erosion by Liquid andSolid Impact, Paper 47, Cavendish Laboratory, Cambridge, 1987.
[21] A. Karimi, R.K. Schmid, Ripple formation in solid liquid erosion,Wear 156 (1992) 33–47.
[22] H. Clark, Particle velocity and size effects in laboratory slurry erosionmeasurement, Tribol. Int. 35 (2002) 617–624.
[23] R.J.K. Wood, The erosion performance of candidate internal coatingsfor slurry handling and pipeline transport, in: Proceedings ofthe Hydrotransport 14, vol. 699, Maastricht, Holland, ProfessionalEngineering Publishing, 1999.
[24] A. Forder, M.T. Thew, D. Harrison, A numerical investigation ofsolid particle erosion experienced within oilfield control valves, Wear216 (1998) 184–193.
[25] I. Finnie, Some observations on the erosion of ductile metals, Wear19 (1972) 81–90.
[26] J.G.A. Bitter, A study of erosion phenomena: Part I, Wear 6 (1963)5–21.
[27] D.B. Spalding, B.E. Launder, Turbulence models and their applicationto the prediction of internal flows, Heat and Fluid Flow 2 (1972)43–54.
[28] T.F. Jones, J. Ganeshalingam, Towards optimal swirl-inducing pipe,in: BHR Group, Proceedings of the 15th International Conferenceon Hydrotransport, Banff, Canada, June 3–5, 2002, pp. 457–468.