Embed Size (px)
Citation preview

Investigations of Ammonia Nitrogen in Aquaculture:the Methodology, Concentrations,
Removal, and Pond Fertilization
by
Li Zhou
A dissertation submitted to the Graduate Faculty of
Auburn University
in partial fulfillment of the
requirements for the Degree of
Doctor of Philosophy
Auburn, Alabama
August 1, 2015
Key words:ammonia nitrogen; methodology,water quality,
fish toxicology, ion-exchange, fertilizer
Copyright 2015 by Li Zhou
Approved by
Claude Boyd, Chair, Professor, School of Fisheries, Aquaculture and Aquatic Sciences
Yolanda Brady, Associate Professor,School of Fisheries,Aquaculture and AquaticSciences
Jesse Chappell, Associate Professor,School of Fisheries, Aquaculture and Aquatic Sciences
Xiaoyu Li, Assistant Professor,Department of Mathematics and Statistics

ii
ABSTRACT
Four investigations were performed related to ammonia nitrogen in aquaculture.
The first investigation compared the precision and accuracy of (1) Nessler, (2)
phenate, (3) salicylate, and (4) ammonia electrode procedures for total ammonia nitrogen
(TAN) concentration determination in waters of aquaculture. Salicylate method was selected
as a standard method for its high precision and accuracy. Addition of Rochelle salt increased
the precision and accuracy for TAN analyses by the Nessler method. TAN analyses by the
phenate I and the salicylate methods were not different in freshwater. The salicylate kit
method is a suitable alternative to the standard salicylate method, while the Nessler kit is not.
Electrodes for sensing NH3 and NH4+ were less precise or accurate in most cases.
The second investigation assessed TANconcentration in 31ictalurid catfishponds on
six farms, in the Blackland Prairie region of Alabama (USA). Concentrations of TAN were
measured 26 times (weekly June through September and less frequently other months)
between May 2013 and May 2014. The farm average, annual TAN concentrations were 1.05-
1.78 mg L-1
at five farms and 4.17 mg L-1
at the other. Nearly half of the TAN concentrations
was< 1 mg L-1
, the majority was<5 mg L-1
, but some ranged from 5 to 15 mg L-1
.Analysis of
the literature on ammonia toxicity to channel catfish suggested that the no-observed-effect
level (NOEL) is around 1.0 mg L-1
NH3-N in ponds with pH of 7.5 and above where NH3-N
concentration fluctuates greatly because of daily change in temperature and especially
pH.The findings reveal that TAN concentrations often are at chronically toxic levels for
ictalurid catfish in Alabama ponds. There usually is no practical emergency treatment for
reducing

iii
NH3-N (or TAN) concentration in ponds exceeding the NOEL. Use of good management
practices is recommended to avoid excessively high TAN concentrations.
The third investigation studied the effectiveness of two processed samples of New
Zealand mordenite for possible use in removing total ammonia nitrogen (TAN) in
aquaculture application.The percentage reduction in TAN concentration in 100-mL solutions
held on a rotating shaker increased linearly with greater mordenite application rate, while the
amount of TAN removed per gram of mordenite (adsorptive efficiency) declined. Ammonia
removal and adsorptive efficiency decreased with increasing salinity up to 30 g L-1
. Although
mordenite is capable of reducing TAN concentration in water of laboratory tests, it probably
is not highly effective for this purpose in aquaculture ponds.
The fourth investigation studied the bluegill yield in response to nitrogen and
phosphorus versus phosphorus-only fertilization in ponds at different times since sediment
removal. The experiment was conducted in 40-yr-old research ponds at the Auburn
University E. W. Shell Fisheries Center from which sediment had been removed 2 to 9yr
earlier to restore bottoms nearly to their original soil composition. Bluegill production was
uncorrelated with time since sediment removal in ponds treated only with phosphate
fertilizer.Soluble reactive phosphorus and total ammonia concentration were correlated with
time since sediment removal(R2 = 0.312 and R
2 = 0.514, respectively, P < 0.05).Results
suggest pond managers might omit nitrogen fertilizer if phytoplankton blooms do not
waneafter only 2 yr of fertilization with nitrogen and phosphorus.

iv
Acknowledgments
I would like to express my gratitude to my major advisor, Dr. Claude E. Boyd for the
opportunities, patience, guidance, encouragement and assistant he has offered me throughout
my study. I would like to thank Dr. Xiaoyu Li, Dr. Yolanda Brady, Dr. Jesse Chappell and Dr.
Philip Chaney for their time and advice for my dissertation. I would like to thank my
colleagues in the water quality laboratory and friends I met in Auburn for their
accompaniment, support and encouragement. I specially thank Chinese Scholarship Council
for the finical support during my Ph.D. study. Most importantly, I thank my gorgeous family
for their endless love and unconditional support.
v
Table of Contents
Abstract .............................................................................................................................................. ii
Acknowledgments ............................................................................................................................ iv
List of Tables ................................................................................................................................... vii
List of Illustrations .......................................................................................................................... viii
I. INTRODUCTION ...................................................................................................................... 1
II. REVIEW OF LITERATURE ...................................................................................................... 4
III. AN ASSESSMENT OFNESSLER, PHENATE, SALICYLATE, AND ION SELECTIVE
ELECTRODE PROCEDURES FOR DETERMINATION OF TOTAL AMMONIA
NITROGE IN AQUACULTURE................................................................................................... 14
Abstract .............................................................................................................................. 14
Introduction ..................................................................................................................... 15
Background on Analytical Methods ................................................................................ 16
Materials and Methods ................................................................................................... 19
Results ................................................................................................................................ 21
Discussion .......................................................................................................................... 24
Conclusion ......................................................................................................................... 26
Literature Cited ............................................................................................................... 27
IV. AN ASSESSMENT OF TOTAL AMMONIA NITROGEN CONCENTRATION
INALABAMA NITROGEN CONCENTRATION IN ALABAMA (USA)
ICTALURIDCATFISH PONDS AND THE POSSIBLE RISK OF AMMONIA TOXICITY . 36
Abstract ............................................................................................................................ 36
Introduction ....................................................................................................................... 37
Materials and Methods ................................................................................................... 39

vi
Results ................................................................................................................. 41
Discussion ............................................................................................................................ 43
Conclusion ......................................................................................................................... 51
Literature Cited ............................................................................................................... 53
V. TOTAL AMMONIA NITROGEN REMOVAL FROM AQUEOUS SOLUTIONS
BYTHENATURAL ZEOLITE, MORDENITE: A LABORATORY TEST AND
EXPERIEMENT STUDY ............................................................................................................... 64
Abstract ............................................................................................................................ 64
Introduction ..................................................................................................................... 65
Materials and Methods ................................................................................................... 67
Results ............................................................................................................................... 68
Discussion .......................................................................................................................... 73
Literature Cited ............................................................................................................... 76
VI. BLUEGILL YIELD IN RESPONSE TO NITROGEN AND PHOSPHORUS
VERSUPHOSPHRUS-ONLY FERTILIZATION IN PONDS AT DIFFERENT TIMES
SINCESEDIMENT REMOVAL .................................................................................................... 88
Abstract ............................................................................................................................ 88
Introduction ..................................................................................................................... 89
Materials and Methods ................................................................................................... 91
Results and Discussion ..................................................................................................... 93
Literature Cited ............................................................................................................... 98
VII. AMMONIA MANAGEMENT ............................................................................................. 104
Literature Cited ............................................................................................................. 107

vii
List of Tables
III. 1. Detect range without dilution, references for analytical protocol for each of total
ammonia nitrogen (TAN) determination method in this study ..................................................... 29
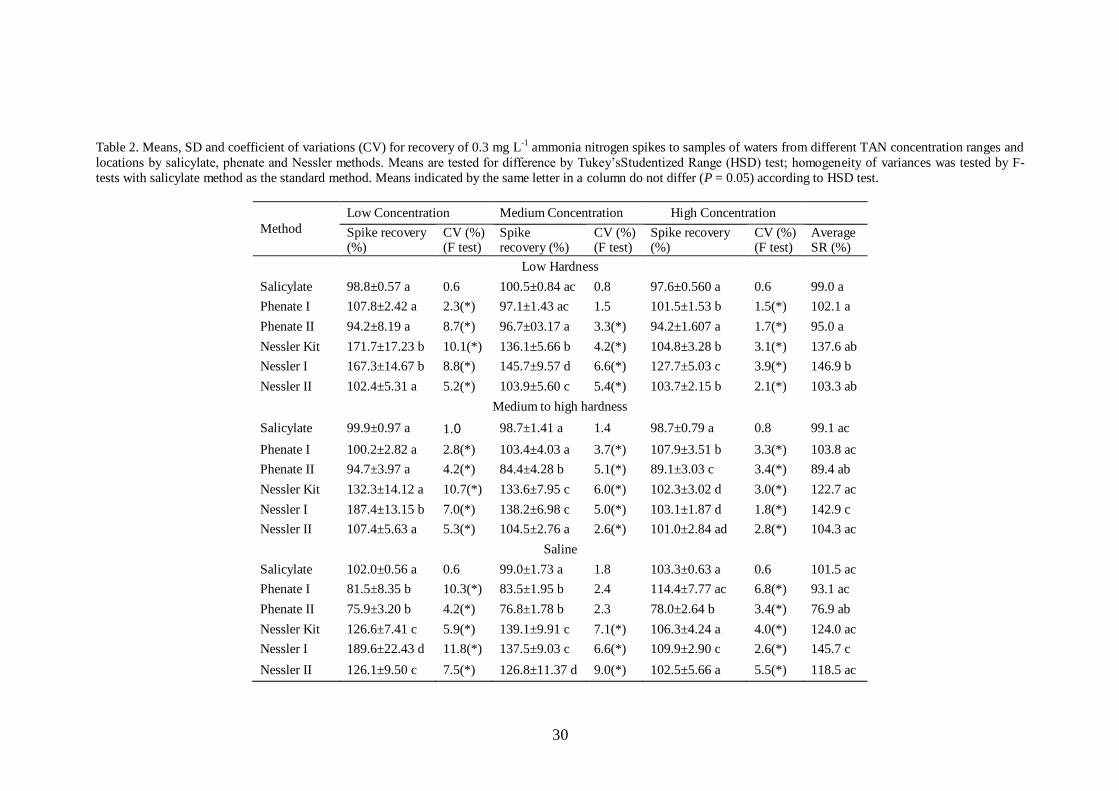
III. 2. Means, SD and coefficient of variations (CV) for recovery of 0.3 mg L-1
ammonia
nitrogen spikes to samples of waters from different TAN concentration ranges and locations
by salicylate, phenate and Nessler methods ................................................................................... 30
III. 3. Means, SD and coefficient of variations (CV) for recovery of 0.3 mg L-1
ammonia
nitrogen spikes to samples of waters from different TAN concentration ranges and locations
by salicylate, salicylate kit and ammonia probes........................................................................... 31
III. 4. Results of regression analyses of TAN concentrations measured by the salicylate
method (X) and the other method (Y) in freshwater ..................................................................... 32
III. 5. Means, SD and coefficient of variations (CV) for TAN determinations of ten replicates
of each sample from different TAN concentration ranges and locations by salicylate, phenate
and Nessler methods ........................................................................................................................ 33
III. 6. Means, SD and coefficient of variations (CV) for TAN determinations of ten replicates
of each sample from different TAN concentration ranges and locations by salicylate,
salicylate kit and ammonia probes .................................................................................................. 34
III. 7. Cost comparisons for chemicals used in different TAN determination methods in this
study.................................................................................................................................................. 35
IV. 1. Average pond size, feed input, production, aerator use, and nitrogen waste load over a
1-yr period for catfish farms of this study ...................................................................................... 55
V. 1. Physical and chemical properties of two, New Zealandmordenite samples ....................... 80
VI. 1. Pond renovation history and fertilization treatments in 2012 .......................................... 100
VI. 2. Mean (± standard deviation) concentrations of 12 water chemistry variables and
bluegill yield for ponds that were renovated 8 yr earlier ............................................................ 101

viii
List of Illustrations
IV. 1. Boxplots of total ammonia nitrogen (TAN) concentrations in ponds for six catfish
farms in west Alabama .................................................................................................................... 56
IV. 2. Summary of frequency distributions and cumulative percentiles of total ammonia
nitrogen (TAN) concentrations for the period May 2013 to May 2014 in 31 catfish ponds
located in west Alabama ................................................................................................................. 57
IV. 3. Fluctuations in total ammonia nitrogen (TAN) concentrations betweenMay 2013 and
May 2014 in three ponds each with high, medium, and low TAN concentrations ..................... 58
IV. 4. Fluctuation in pH over a 24-hr period in surface water (T) and bottom water (B) of
ponds with dense, medium and light plankton blooms ................................................................. 59
IV. 5. Temperature fluctuation patterns over a 24-hr period in surface water (T) and bottom
water (B) of ponds with dense, medium and light plankton blooms ............................................ 60
IV. 6. Distribution of total ammonia nitrogen (TAN) concentrations measured in spring,
summer, fall, and winter in 25 Alabama catfish ponds during the period 1990-92 (Schwartz
and Boyd) compared with the period 2013-14 (present study)..................................................... 61
IV. 7. The estimated no observed effect level (NOEL) for total ammonia nitrogen (TAN)
concentration to ictalurid catfish. The NOELs were estimated for average monthly water
temperatures at different pHs .......................................................................................................... 62
IV. 8. Cumulative percentage of ponds having total ammonia nitrogen (TAN) concentration
above the no observed effect level (NOEL) for each month at three pH levels .......................... 63
V. 1. Particle size of two, New Zealand mordenite samples ..................................................... 81
V. 2. Effect of total ammonia nitrogen(TAN) concentration on adsorptive and percentage
removal of TAN of two mordenite samples applied at 1 g 100 mL-1
........................................... 82
V. 3. Equilibrium isotherm data for ammonium uptake ontomordenite fitted to the Langmuir
and the Freundlich uptake models with two mordenite samples applied at 1 g 100
mL-1
.................................................................................................................................................. 83
V. 4. Effect of application rate of two mordenite samples on adsorptive efficiency and
percentage removal of total ammonia nitrogen (TAN) from solution containing 1 mg L-1
TAN .................................................................................................................................................. 84

ix
V. 5. Exponential relationship between percentage removal of total ammonia nitrogen (TAN)
from sample containing 5 mg L-1
TAN by two mordenite samples (1 g 100 mL-1
) at different
salinities ............................................................................................................................................ 85
V. 6. Cation preference oftwo mordenite samples applied at 1 g 100 mL-1
in water of
different cation concentration ......................................................................................................... 86
V. 7. Removal of total ammonia nitrogen (TAN) from water containing 3 mg L-1
TAN by
different application rate of mordenite sample 1 in aerated and non-aerated aquaria................. 87
VI. 1. Relationships between the mean concentrations of water chemistry variables and time
(in years) since sediment removal in 13 bluegill ponds that received phosphorus-only
fertilization .................................................................................................................................... .102
VI. 2. Upper: The harvest weights of bluegill and grass carp versus time (in years) since
sediment removal from 13 bluegill ponds that received phosphorus-only fertilization. Lower:
Harvest weight of bluegill in 15 ponds versus harvest weight of grass carp ............................. 103

1
I. INTRODUCTION
Aquaculture, accounts for nearly half of world’s food fish production, is one of
the fastest growing animal food sectors with its development, extension, and intensification
in almost every possible region of the world. Global food fish aquaculture production volume
increased at an average rate of 6.2 % per year between 2000 and 2012, more than doubled
from 32.4 million tonnes to 66.6 million tonnes. Global capture fishery although with a
production volume of 91.3 million tonnes in 2013, is considered to be stagnant.Many stocks
of the most productive species in world marine capture fishery are fully fished or overfished.
Therefore, with the global population growing by another 2 billion by 2050, aquaculture still
needs to reach 80 million tonnes to maintain the current level of per capita consumption
according to FAO’s estimates.
The use of increasingly intensive grow-out is a major reason for the increasing
production in aquaculture. Maintaining good water quality is of big concern in intensive
aquaculture systems. Ammonia nitrogen, resulting from high feeding rates in semi-intensive
and intensive systems, is one of the most important water quality variables that affect fish
behavior and health. It is the nextmost important factor after low dissolved oxygen in limiting
the amount offish that can be produced in a culture system. High concentrations of ammonia
nitrogen can be stressful or even lethal to fish.
Reliable measurement of TAN concentration is very important for farmers to
manage ponds and other culture systems or for scientists doing research on

2
ammonia nitrogen dynamics and effects in aquaculture systems. There are four basic methods
for measuring total ammonia nitrogen (TAN) in water: Nesslers; phenate; salicylate;
ammonia electrode. The Nesslers method may be conducted with and without use of
Rochelle salt solution, and there are two types of ammonia electrodes – one senses NH3 and
the other senses NH4+. Nesslers and salicylate methods are the basis for ammonia test kits
used by some farmers. The first investigation (Chapter III) evaluates the precision and
accuracy of different possible ways of measuring TAN concentrations at different
aquaculture facilities in Alabama. The goal is to reveal the most suitable method for saline
water and freshwaterand provide recommendations on the methods that should be used for
determining TAN concentrations in water samples.
Channel catfish Ictaluruspunctatusis one of important culture species in Southeastern
United States with steadily increasing production for more than two decades. The high
densities of culture species and high feeding rates result in higher than desirable TAN
concentrations. Some farmers even reported high TAN concentration of 10 mg L-1
with
ammonia kits in catfish ponds. The second investigation was conducted to determine the
range and fluctuation in TAN concentrations in Alabama commercial catfish ponds on a one-
year basis and to assess the possible risk of ammonia toxicity to catfish.
Ammonia nitrogen can be removed from water through air stripping, absorption, ion
exchange, and biological methods. Zeolite, used as an ion exchange medium, is widely
applied to ponds in Asia to remove ammonia nitrogen. However, there is no research findings
support this practice. The third investigation was conducted in a laboratory trial to evaluate
the ammonia nitrogen removal efficiency of two New Zealand zeolites – mordenite under
different conditions of water quality and to ascertain if the two New Zealand mordenite has
potential to lower TAN concentrations of aquaculture systems.

3
Excess load of nitrogen accompanied with phosphorus in effluent is the primary cause
for eutrophication. Avoiding overuse of nitrogen fertilizer such as ammonia nitrate ,
ammonia phosphate, and urea in aquaculture is one possible way to reduce the potential of
eutrophication. Nitrogen fertilizer has reported to be of little benefit in promoting some
culture species production in ponds with a 15-yr history of complete fertilization. The process
of nitrification of blue-green algae and nitrogen minimization of organic matter accumulated
from pond bottoms provide sufficient nitrogen source in older ponds. In the fourth
investigation, seventeen sportfish ponds that had been fertilized for 2 to 9 years since
renovation were selected to evaluate the response to nitrogen plus phosphorus fertilization
and phosphorus-only fertilization.The goal was to verify whether nitrogen fertilization in
older ponds was needed. Results suggest that nitrogen fertilization of sportfish ponds possibly
can be ceased after only 2 yr of fertilization with nitrogen and phosphorus.

4
II. REVIEW OF LITERATURE
Ammonia nitrogen is a nutrient in aquaculture
Nitrogen is an essential nutrient for all creatures in the world to grow and live. It is a
component of vital organic compounds such as amino acids, protein and DNA in organisms.
Nitrogen gas (N2), although accounts for 78% of the air by volume, cannot be directly
absorbed as nutrition by organisms. In aquatic environment, ammonia nitrogen is one of
important N forms that can be used by phytoplankton, algae, plants, heterotrophic bacteriaand
nitrifying bacteria (Montoya and Velasco,2000).
The ammonia nitrogen in aquaculture systems primarily comes from fertilizers such
as urea, ammonia phosphate and ammonia nitrate, fish via their waste and organic matter
decomposition (Boyd, 2001). Application of nitrogen fertilization promotes primary
productivity therefore enhances the production of the fish depend on the development of
autotrophic food webs (Boyd et al., 2008). In feed-based aquaculture, about 20–40% of
nitrogen in feed is recovered in harvest biomass. The remaining nitrogen can be regarded as
N excretion to N flow in aquaculture, which consists of 62% of dissolved N and 13% of
particulate N (Folke and Kautsky, 1989). Mineralization of organic matter from pond bottom
is another important source of ammonia. Hargreaves (1997) developed a mechanistic model
to simulate annual variation of ammonia concentration in commercial catfish ponds in the
southeastern United States. The model estimated that 25 to 33% of the ammonia in water
came from the sediment. Ammonia can also be added to ponds in process of nitrogen fixation
by heterocystos cyanobacteria. Acosta-Nassar et al. (1994) reported a 10% of N input by

5
nitrogen fixation in a tropical freshwater fish pond.
Generally, phytoplankton is considered to uptake most of ammonia nitrogen from
water. Phytoplankton prefers ammonia to nitrate as inorganic N source because nitrate
assimilation and incorporation is more energy-consuming (Hargreaves, 1998). Ammonia
concentrations are inversely related to phytoplankton density, increasing dramatically during
phytoplankton die-off and declining as phytoplankton increase (Krom et al., 1989; Tucker et
al., 1984). Another principle sink for ammonia is nitrification. Nitrification rate might exceed
phytoplankton uptake during cooler months (Hargreaves, 1997). Ammonia nitrogen could
also be removed from aquaculture systems through volatilization. Lorenzen et al. (1997)
estimated a 30% and 8% of added N were lost through volatilization from an intensive
shrimp pond and semi-intensive shrimp pond, respectively. NH4+ could be weakly absorbed
to the clay minerals or organic matter through ion exchange in the sediment. Acosta-Nassaret
al. (1994) found that roughly 2% of the added N in a freshwater fish pond was absorbed in
the sediment.
Ammonia nitrogen is a toxin in culture system
Ammonia nitrogen occurs in water as un-ionized ammonia (NH3) and ammonium ion
(NH4+):
NH3 + H2O = NH4+ + OH
– Kb = 10
-4.74 (1)
The ratio NH3:NH4+ increases with greater pH as obvious from Eq. 1. Moreover,
examination of Kb of Eq. 1 for different temperatures (Bates and Pinching, 1949) shows that
the NH3:NH4+ ratio also increases with rising temperature. The concentrations of each of the
two forms can be calculated with Eq. 1 using the measured pH and the appropriate Kb for the
observed water temperature. However, convenient tables for estimating the percentage of
TAN present as NH3-N at different pHs and water temperatures are available (Trussell, 1972;

6
Emerson et al., 1975), and even more convenient NH3-N calculators are available on-line –
an excellent one can be found at http://www.hbuehrer.ch/Rechner/Ammonia.html.
Biological membranes are more permeable to NH3 than to NH4+, and ammonia
toxicity is attributed primarily to NH3. Nevertheless, high NH4+ concentration in the water
interferes with the outward movement of ammonia through the gills (Liew et al., 2013). Thus,
NH4+ has some degree of toxicity, but much less than that of NH3. NH3 may cause toxicity to
nitrifying bacteria –Nitrosomonasspp. and Nitrobacterspp. bacteria so that the nitrification
process is inhibited (Russo 1985). The increased accumulation of ammonia or nitrite from the
bacterial inhibition in the aquatic environment intensifies the toxicity to aquatic animals and
beneficial bacteria (Russo 1985).
Ammonia toxicity is usually reported as 96-hr LC50–the lethal concentration of
ammonia (as NH3-N) that required to kill half of the tested population in 96 hours. The
tolerance of ammonia toxicity varies among different species. According to Boyd’s
summarization (2013), for example, the 96-hr LC50 for rainbow trout is between 0.32 to 0.93
mg L-1
; cutthroat trout, 0.50–0.80 mg L-1
; freshwater prawns, 2.00–2.50 mg L-1
; school
prawns, 1.39 mg L-1
; southern white shrimp, 0.69–1.20 mg L-1
; pacific white shrimp, 1.20–
2.95mg L-1
. In realty, producers are concerned over the sub-lethal effects of ammonia more
than the LC50. Much research of chronic exposure of ammonia on culture species was
conducted. Colt and Tchobanoglous (1978) showed the growth of juvenile channel catfish
was reduced by 50% at 0.517 mg L-1
NH3-N and no growth occurred at 0.967 mg L-1
during a
31 day growth trial when fish were exposed to concentrations of NH3-N ranging from 48 to
989 𝜇gL-1
. Foss et al. (2004) showed that the growth of juvenile Atlantic cod, Gadusmorhua,
was significantly reduce at NH3-N concentration of 0.17 mg L-1
during a 96 days at 13 °C
when fish were exposed to concentrations of NH3-N ranging from 0.0005 to 0.17𝑚gL-1
.
7
The sub-lethal or lethal effects of ammonia in sensitive fish that are reported include
gill damage,blood oxygen-carrying capacity reduction, lack and depletion of adenosine
triphosphate (ATP) in the brain, and the liver and kidneys malfunction (Arillo et al.1981;
Camargo and Alonso 2006; Lang et al. 1987; Russo 1985; Tomasso et al. 1980).
Several strategies for fish to avoid ammonia toxicity were found. Many fish have the
capacity to detoxify ammonia to glutamine when exposedto elevated environmental ammonia.
Increased concentration of brain glutamine also found in common carp Cyprinuscarpio
(Dabrowskaand Wlasow, 1986), the mudskippers, Periophthalmodonschlosseriand
Boleophthalmusboddaerti (Peng et al., 1998) when exposed to ammonia. Some fish can
convert ammonia to the less toxic urea, an more energy-consuming process (Atkinson and
Bourke,1987) found only in inland vertebrates and marine fish using urea as an osmotic filler.
However, Saha and Ratha (1987) found the air-breathing freshwater fish,
Heteropneustesfossilis, increasedurea synthesis when exposed to air. Randall et al. (1989)
reported that the Lake Magadi tilapia converted ammonia to only urea to survive the very
alkaline environment in Lake Magadi. Fish can also reduce ammonia production as a strategy
to reduce ammonia toxicity. Wilson et al. (1998) reported ammonia excretion and production
were inhibited in rainbow trout during severe alkaline exposure. Fish can also reduce
ammonia toxicity through ammonia volatilization (Tsui et al., 2002) and active excretion of
ammonium ion (Randall et al., 1999).
Ammonia nitrogen is a pollutant when discharged to the environment
The development of aquaculture has resulted in many adverse impacts on
environment and nature sources including destruction of sensitive aquatic ecosystems, excess
use of chemicals, invasion of foreign species, landscape modification, introduction of aquatic
animal disease and water pollution (Dierberg and Kiattisimukul, 1996; Goldburg and Triplett,

8
1997; Naylor et al., 1998, 2000). Water pollution through aquaculture discharge is received
the most complaint and attracted official attention worldwide.
Discharges from aquaculture contain organic matter, nutrients such as nitrogen (TAN
and nitrate) and phosphorus, and solids (Crippsand Bergheim, 2000; Bergheim and Brinker,
2003). Ammonia nitrogen is an important form of total nitrogen in aquaculture waste. The
total nitrogen produced within flow-through system is mainly discharged in the form of
ammonia nitrogen (Bergheim and Âsgård, 1996).It has generally been considered that the
dominant dissolved form of N in shrimp ponds was ammonia nitrogen (Lorenzen et al., 1997).
Ammonia is regarded as one of the most important pollutants in the aquatic environment for
its highly toxic nature discussed above and its ubiquity in surface water systems (Russo
1985). Many effluents need to be treated extensively in order to keep the ammonia levels in
surface water from being unacceptably high (Rand, 1995; USEPA, 2009).
Excess ammonia in effluent could accelerate eutrophication in receiving water bodies,
resulting in dissolved oxygen depletion and fish toxicity (Du et al., 2005). Alabaster (1982)
reported cage aquaculture increased the load of N, P, and organicmatter and enriched water
and underlying sediment. Tucker and Lloyd (1985) showed that effluent especially total
nitrogen and ammonia and chemical oxygen demand from channel catfish ponds was an
important point source of pollution. Similarity, Zieman et al. (1992) reported the increase of
total ammonia in the effluent from Hawaiian aquaculture facilities (freshwater fish,
freshwater prawn, marine fish, and marine shrimp ponds).Guo and Li (2003) showed that
mass-input of exogenousnutrients might cause negative effects on water quality in areas from
the cage to a distance of 50 moutwards.Herbeck et al. (2013) reported the input of
aquaculture effluents rich in dissolved inorganic and organic matter from ponds at the NE
coast of Hainai caused eutrophic conditions in the nearby coastal waters.

9
The national criteria for ammonia in fresh water in USEPA (2013) recommends an
criterion acute concentration of 17 mg L-1
total ammonia nitrogen and a criterion chronic
concentration of 1.9 mg L-1
total ammonia nitrogen at pH of 7 and temperature of 20 ℃. The
Global Aquaculture Alliance (GAA) effluent standard for TAN is 5 mg L-1
as an initial
standard and 3 mg L-1
as a target standard (Boyd, 2001; Tucker and Hargreaves, 2009). This
standard is based on intensive shrimp culture, where TAN concentration is very high–often
exceed 5 mg L-1
(Boyd, 2001).
Ammonia nitrogen can be removed by many techniques including earthen treatment
ponds or reservoirs, bio-filtration, periphytontreatment technique and bio-flocs technology.
Many studies on ammonia removal in aquaculture have been conducted. Ng et al. (1996)
removed 82% of ammonia in aquaculture influent by using a bench-scale fluidised bed
bioreactor when the reactor was loaded with ammonia-nitrogen (NH4-N)between 0.201 and
0.397 g m-2
day-1
. Shan and Obbard (2001) maintained concentration of TAN less than 0.5 mg
L-1
under a fed-batch condition of 3.2 mg TAN L-1
per day by using pellet immobilization of
indigenous nitrifying bacteria. Lyssenko and Wheaton (2006) removed ammonia by trickling
and submerged-upflowbiofilters for intensive recirculating aquaculture. Gendel andLahav
(2013) recommended a new method comprising ion exchange and electrochemical
regeneration to remove ammonia from fresh-water recirculated aquaculture systems.

10
LITERATURE CITED
Acosta-Nassar, M.V., Morell, J.M., Corredor, J.E., 1994. The nitrogen budget of a tropical
semi-intensive freshwater fish culture pond. J. World Aqua. Soc. 25, 261–270.
Alabaster, J.S., 1982. Report of the EIFAC workshop on fish-farm effluents, 26– 28 May
1981, Silkeborg, Denmark. EIFAC Tech. Pap. No. 41, FAO, Rome. 166 pp.
Arillo, A., Margiocco, C., Melodia, F., Mensi, P., Schenone, G., 1981. Ammonia toxicity
mechanism in fish: Studies on rainbow trout (SalmogairdneriRichardson.). Ecotoxicol.
Environ. Saf. 5: 16-328.
Atkinson, D.E., Bourke, E., 1987. Metabolic aspects of the regulation of systemic pH. Am. J.
Physiol, 252, 947-956.
Bates, R.G., Pinching, G.D. 1949. Acidic dissociation constant of ammonium ion at 0° to
50 °C, and the base strength of ammonia. J. Res. Nat. Bur. Stand. 42, 419-430.
Bergheim, A., Âsgård, T., 1996. Waste production from aquaculture. In: Baird, D.,Beveridge,
M.C.M., Kelly, L.A., Muir, J.F. (Eds.), Aquaculture and Water ResourceManagement,
Blackwell Science, Osney Mead, Oxford, United Kingdoms, pp. 50–80.
Bergheim, A., Brinker, A., 2003. Effluent treatment for flow through systems andEuropean
Environmental Regulations. Aquacult. Eng. 27, 61–77.
Boyd, C.E., 2001. Water quality standards: total ammonia nitrogen. The Advocate4, 84-85.
Boyd, C.E., 2013. Ammonia Toxicity Degrades Animal Health, Growth. The Advocate 1,40-
43.
Boyd, C.A., Penseng, P., Boyd, C.E. 2008. New nitrogen fertilization recommendations for
bluegill ponds in the southeastern United States. N. Am.J. Aquacult.70, 308-313.
Camargo J. Alonso, A., 2006. Ecological and toxicological effects of inorganic nitrogen
pollution in aquatic ecosystems: A global assessment. Environ. Internat. 32: 831-849.
Colt, J., Tchobanoglous, G., 1978. Chronic exposure of channel catfish, Ictaluruspunctatus,
to ammonia: effects on growth and survival. Aquaculture 15, 353-37.
Cripps, S.J., Bergheim, A., 2000. Solids management and removal for intensive landbased
aquaculture systems. Aquacult. Eng. 22, 33–56.
Dabrowska, H., Wlasow, T., 1986. Sublethal effect of ammonia on certain biochemical and
haematological indicators in common carp (Cyprinuscarpio L.). Comp. Biochem.
Physiol. 83C, 179–184.
Dierberg, F.E., Kiattisimukul, W., 1996. Issues, impacts, and implications of shrimp
aquaculture in Thailand. Environ. Manag. 20, 649– 666.
11
Du, Q., Liu, S., Cao, Z., Wang, Y., 2005. Ammonia removal from aqueous solution using
natural Chinese clinoptilolite. Sep. Purif Technol. 44, 229-234.
Emerson, K., Russo, R.C., Lund, R.E., Thurston, R.V., 1975. Aqueous ammonia equilibrium
calculations: effect of pH and temperature. J. Fish. Res. Board Can. 32, 2379-2383.
Folke, C., Kautsky, N., 1989. The role of ecosystems for a sustainable development of
aquaculture. Ambio. 18, 234–243.
Foss, A., Siikavuopio, S.I., Sæther, B.S., Evensen, T.H., 2004. Effect of chronic ammonia
exposure on growth in juvenile Atlantic cod. Aquaculture 237, 179-189.
Gendel, Y., Lahav, O., 2013. A novel approach for ammonia removal from fresh-water
recirculated aquaculture systems, comprising ion exchange and electrochemical
regeneration. Aquacult. Eng. 52, 27-38.
Goldburg, R., Triplett, T., 1997. Murky Waters: Environmental Effects of Aquaculture in the
United States. Environmental Defense Fund, Washington, DC. 198 pp.
Guo, L., Li, Z., 2003. Effects of nitrogen and phosphorus from fish cage-culture on the
communities of a shallow lake in middle Yangtze River basin of China. Aquaculture
226, 201-212.
Krom, M.D., Erez, J., Porter, C.B., Ellner, S., 1989. Phytoplankton nutrient uptake dynamics
in earthen marine fishponds under winter and summer conditions. Aquaculture 76,
237–253.
Lang, T., Peters, G., Hoffmann, R., Meyer, E., 1987. Experimental investigations on the
toxicity of ammonia: Effects on ventilation frequency, growth, epidermal mucous cells,
and gill structure of rainbow trout Salmogairdneri. Dis. Aquat. Org. 3: 159-165.
Liew, H.J., Sinha, A.K., Nawata, C.M., Blust, R., Wood, C.M., Boeck, G., 2013. Defferential
responses in ammonia excretion, sodium fluxes and gill permeability explain
ddifferent sensitivities to acute high environmental ammonia in three freshwater
teleosts. Aqua. Tox. 126, 63-76.
Lorenzen, K., Struve, J., Cowan, V.J., 1997. Impact of farming intensity and water
management on nitrogen dynamics in intensive pond culture: a mathematical model
applied to Thai commercial shrimp farms. Aquacult. Res. 28, 493–507.
Lyssenko, C., Wheaton, F., 2006. Impact of positive ramp short-term operating disturbances
on ammonia removal by trickling and submerged-upflow biofilters for intensive
recirculating aquaculture. Aquacult. Eng. 35, 26-37.
Hargreaves, J. A., 1997. A simulation model of ammonia dynamics in commerical catfish
ponds in the southeastern United States. Aquacult. Eng. 16, 27-43.
Hargreaves, J. A., 1998. Nitrogen biogeochemistry of aquaculture ponds. Aquaculture. 166,
181-212.

12
Herbeck, L. S., Unger, D., Wu, Y., Jennerjahn, T. C., 2013. Effluent, nutrient and organic
matter export from shrimp and fish ponds causing eutrophication in coastal and back-
reef waters of NE Hainan, tropical China. Cont. Shelf Res., 57, 92-104.
Montoya, R., Velasco, M., 2000. Role of bacteria on nutritional and management strategies in
aquaculture systems. The Advocate 4, 35-36.
Naylor, R.L., Goldburg, R.J., Mooney, H., Beveridge, M., Clay, J., Folke, C., Kautsky, N.,
Lubchenco, J.,Primavera, J., Williams, M., 1998. Nature’s subsidies to shrimp and
salmon farming. Science 282, 883– 884.
Naylor, R.L., Goldburg, R.J., Primavera, J.H., Kautsky, N., Beveridge, M.C.M., Clay, J.,
Folke, C., Lubchenco, J., Mooney, H., Troell, M., 2000. Effect of aquaculture on
world fish supplies. Nature 405, 1017– 1024.
Ng, W.J., Kho, K., Ong, S.L., Sim, T.S., Ho, J.M., 1996. Ammonia removal from aquaculture
water by means of fluidised technology. Aquaculture 139, 55-62.
Peng, K.W., Chew, S.F., Lim, C.B., Kuah, S.S.L., Kok, W.K., Ip, Y.K., 1998. The
mudskippers Periophthalmodonschlosseri and Boleophthalmusboddaerti can tolerate
environmental NH3concentrationsof 446 and 36 𝜇 M, respectively. Fish Physiol.
Biochem. 19, 59–69.
Rand, G.M., 1995. Fundamentals of aquatic toxicology: effects, environmental fate and risk
assessment. CRC Press, Baca Rato, FL.
Randall, D.J., Wilson, J.M., Peng, K.W., Kok, T.W.K., Kuah, S.S.L., Chew, S.F., Lam, T.J.,
Ip, Y.K., 1999. The mudskipper, Periophthalmodonschlosseri, actively transports NH4+
against a concentration gradient. Am. J. Physiol. 46, 1562–1567.
Randall, D.J., Wood, C.M., Perry, S.F., Bergman, H., Maloiy, G.M., Mommsen, T.P., Wright,
P.A., 1989. Urea excretion as a strategy for survival in a fish living in a very alkaline
environment. Nature 337, 165–166.
Russo, R.C. 1985. Ammonia, nitrite, and nitrate. In: Fundamentals of aquatic toxicology and
chemistry. Rand, G.M. and S.R. Petrocelli (Eds.). Hemisphere Publishing Corp.,
Washington, D.C. pp. 455-471.
Saha, N., Ratha, B.K., 1987. Active ureogenesis in a freshwater air‐breathing teleost,
Heteropneustesfossilis. J. Exp Zool. 241, 137-141.
Shan, H., Obbard, J., 2001. Ammonia removal from prawn aquaculture water using
immobilized nitrifying bacteria. Appl. Microbial. Biot, 57, 791-798.
Tomasso J.R., Goudie, C.A., Simco, B.A., Davis, K.B., 1980. Effects of environmental pH
and calcium on ammonia toxicity in channel catfish. Trans. Am. Fish Soc. 109: 229-
234.
Trussell, R.P., 1972. The percent un-ionized ammonia in aqueous ammonia solutions at
different pH levels and temperatures. J. Fish. Res. Board Can. 29, 1505-1507.
13
Tsui, T.K.N., Randall, D.J., Jin, Y., Chew, S.F., Wilson, J.M., Ip, Y.K., 2002. Accumulation
of ammonia in the body and NH3 volatilization from alkaline regions of the body
surface during ammonia loading and exposure to air in the weather loach
Misgurnusanguillicaudatus. J. Exp. Biol. 205: 651–659.
Tucker, C.S., Hargreaves, J.A., 2009. Environmental best management practices for
aquaculture. Oxford, UK: Wiley-Blackwell.
Tucker, C.S., Lloyd, S.W., Busch, R.L., 1984. Relationships between phytoplankton
periodicity and the concentrations of total and unionized ammonia in channel catfish
ponds. Hydrobiologia 111, 75–79.
USEPA (United States Environmental Protection Agency). 2009. 2009 Update aquatic life
ambient water quality criteria for ammonia – freshwater. EPA-822-R-09-001. United
States Environmental Protection Agency, Washington, D.C.
USEPA (United States Environmental Protection Agency). 2013. 20013 Update aquatic life
ambient water quality criteria for ammonia – freshwater. EPA 822-R-13-001. United
States Environmental Protection Agency, Washington, D.C.
Wilson, J.M., Iwata, K., Iwama, G.K., Randall, D.J., 1998. Inhibition of ammonia excretion
and production in rainbow trout during severe alkaline exposure. Comp BiochemPhys
B 121, 99-109.
Ziemann, D.A., Walsh, W.A., Saphore, E.G., Fulton-Bennett, K., 1992. A survey of water
quality characteristics of effluent from Hawaiian aquaculture facilities. J. World
Aquacult. Soc. 23, 180–191.

14
III. AN ASSESSMENT OF NESSLER, PHENATE, SALICYLATE, AND ION
SELECTIVEELECTRODE PROCEDURES FOR DETERMINATION OF
TOTALAMMONIANITROGE IN AQUACULTURE
ABSTRACT
An assessment was conducted to compare the precision and accuracy of Nessler,
phenate, salicylate, and ammonia electrode procedures for total ammonia nitrogen (TAN)
concentration determination in waters of aquaculture. Salicylate method was selected as a
standard method for its high precision and accuracy. In replicate analyses of water samples
for precision estimate, Nessler method gave higher mean concentration of TAN than other
methods and it is not recommended for use for its high coefficient of variance. Results from
Nessler’s with Rochelle salt method were more accurate than Nessler without Rochelle salt
method. Electrodes for sensing NH3 and NH4+usually gave higher mean concentration of
TAN than salicylate method. NH4+ electrode, although with high accuracy, was strongly
affected by sodium and potassium and not recommended to use especially in waters of high
salinity. The finding also suggested that the salicylate kit by using YSI photometer also was a
preferable alternative to salicylate method while Nessler kit not. TAN concentrations
measured in 27 water samples by all methods were highly correlated (R2= 0.919 to 0.996)
with salicylate method. All of the slopes except phenate I and II method were different from
1.0 (P<0.05); all of the intercepts except phenate I and salicylate kit were different from 0.0
(P< 0.05).

15
INTRODUCTION
Feed-based aquaculture is becoming increasingly intensive, because efficiency is
improved by concentrating culture animals in a small volume of water to facilitate feeding,
mechanical aeration, use of water quality amendments, and harvest. It is not unusual for
intensive ponds to have standing crops of 8,000 to 10,000 kg ha-1
and daily feeding rates up
over 100 kg ha-1
as encountered in ictalurid catfish farming in the United States (Boyd and
Tucker, 2014). Mechanical aeration is effective in avoiding excessively low dissolved oxygen
concentration in intensive ponds, but high concentration of total ammonia nitrogen (TAN)
commonly occurs. For example, intensive ictalurid catfish ponds in Alabama (United States)
typically had TAN concentrations above 2 mg L-1
, and concentrations above 10 mg L-1
were
measured in some ponds (Zhou and Boyd, 2015).
Analytical methods for ammonia nitrogen in water measure TAN that consists of un-
ionized ammonia (NH3) and ammonium (NH4+)in a pH-and temperature- dependent
equilibrium, un-ionized ammonia contributes primarily to ammonia toxicity, but high NH4+
concentration has some degree of toxicity because it interferes with the outward movement of
ammonia through the gills (Liew et al., 2013). The proportion of NH3increases with rising pH
and temperature (Trussell, 1972), and the NH3concentrationmust be estimated from the TAN
concentration. Tables of factors for calculating NH3from TAN, pH, and water temperature
are available (Trussell, 1972; Emerson et al., 1975; Boyd and Tucker, 2014) and on-line
ammonia calculators such as the one found at
http://www.hbuehrer.ch/Rechner/Ammonia.html may be used. Total ammonia nitrogen
concentrations in culture systems are sometimes great enough to stress culture animals but
seldom high enough to cause direct mortality (Boyd and Tucker, 2014; Zhou and Boyd,
2015).

16
The threat of ammonia stress increases in intensive aquaculture andthere isneed to
monitor TAN concentration in culture systems. Severalmethods of measuring TAN
concentration are used in aquaculture to include standard laboratory colorimeter procedures
(Nessler, phenate, and salicylate methods), either NH3 or NH4+
sensing electrodes (Eaton et
al., 2005),and test kits that rely on either the Nesslertechnique or the salicylate methods.
Elevated calcium and magnesium (hardness) concentration and salinity can interfere with the
determination of TAN concentration (Eaton et al., 2005). Aquaculture is conducted in
freshwater, estuarine water, and seawater, and there is increasing production of marine
shrimp in low salinity (1 to 10 g L-1
) inland waters (Roy et al., 2010). The salicylate method
for TAN is commonly used for seawater, but a recent study (Le and Boyd, 2012) revealed
that this method also gave highly satisfactory results for water ranging from salinities of 0.1
to 24 g L-1
. Thus, the purpose of the present study was to compare the salicylate method to
other methods of determining TAN concentration in freshwater of different hardness and in
low-salinity inland water.
BACKGROUND ON ANALYTICAL METHODS
Nessler’s reagent – named after Julius Nessler, the German chemist who first made
this reagent in 1856 – is a solution consisting of mercury (II) iodide and potassium iodide in
highly alkaline solution. It will react to form a yellow color in proportion to TAN
concentration that may be assessed colorimetrically (Krug et al. 1979; Leonard 1963; Remy
1956). The basic reaction is
2 K2HgI4 + NH3 +3 KOH
Hg
O NH2I
Hg
+ 7 KI +2 H2O (1)

17
Nessler’s reagent raises the sample pH causing precipitation of calcium and
magnesium (hardness cations) as hydroxides creating turbidity that interferes with
colorimetric measurement of the yellow color – especially in harder waters. Distillation of a
water sample at high pH results in a distillate containing the ammoniacal nitrogen of the
sample free of hardness cations. But, this method is time consuming and tedious. The more
common means of removing interference by hardness cations is to treat samples with alkaline
zinc sulfate solution followed by filtration. Rochelle salt [potassium sodium tartrate
(KNaC4H4O6∙4H2O)] solution is then added to remove residual hardness cations that might
react with Nessler’s reagent.
The phenate (or phenol) method is based on the Bethelot reaction in which ammonia
reacts with phenol and hypochlorite under alkaline condition. Ammonia is converted to
monochloramime at pH 9.7 – 11.5, which reacts with phenol in the presence of hydrochlorine
to form blue-colored indophenol in proportion to the ammonical nitrogen concentration in the
sample (Searle, 1984), the reactions are:
O-
2 + NH3 + 3 ClO-N O + 2 H2O + OH- + 3 Cl- (2)
phenol indophenol (blue)
-O
Sodium nitroprusside is generally used to catalyze indophenol reaction and intensity
the blue color (Lubochinsky and Zaltal, 1954; Mann, 1963). A citrate buffer often is added to
stabilize pH and prevent precipitation of hydroxides (Solarzano, 1969; Hampson, 1977;
Verdouw et al., 1978). Rochelle salt solution with manganese sulfate catalyst sometimes
added to samples before applying the other reagents to lessen the inference of calcium
hydroxide precipitation in hard waters(Boyd and Tucker, 1992).
The salicylate method actually is a modification of the phenate method in which
sodium salicylate is substituted for phenol. This modification eliminates production of ortho-

18
chlorophenol that is toxic and highly volatile (Lammering and Burbank, 1960; Roberts et al.,
1977; Verdouwet al., 1978). In the salicylate method, monochloramime formed by the
reaction of ammonia and hydrochlorine reacts with salicylate to form blue-green colored 5-
aminosalicylate in proportion to the amount of ammoniacal nitrogen presented as follows:
OH
COO-
+ NH3 + ClO- + H2O + Cl- (3)OH
COO-
NH2
Sodium nitroferricyanide acts as a catalyst to intensify the color of 5-aminosalicylate.
An ion-selective electrode (ISE) – often called a specific ion electrode – responds to
the concentration of a particular ion or gas in solution. The result is a potential difference that
can be measured by a voltmeter (the voltmeter usually is the function of a pH meter). The
voltage, in accordance with the Nernst equation, depends upon the common logarithm of the
activity of the ammonium ion or gaseous ammonia (NH3) in solution.
There are two types of electrodes for sensing TAN concentration. One senses NH3
using a hydrophilic gas-permeable membrane to separate the sample from a solution of
ammonium chloride within the electrode (internal solution). A strong base such as lithium
hydroxide added to the sample converts essentially all NH4+to NH3. Ammonia diffuses
through the membrane until the partial pressure of ammonia is equal on both sides. The pH
change in the internal solution is sensed by the electrode and is proportional to the partial
pressure (or concentration) of NH3in the sample.
The NH4+
sensing electrode has a polyvinylchloride (PVC) membrane containing an
ammonium-carrier. The water sample is acidified to lower the pH and convert essentially all
NH3 to NH4+. The electrode potential of the sample relative to the reference electrode of the
NH4+
sensing probes is proportional to the NH4+
activity (or concentration) in the sample.
Field kits for measuring TAN concentration in freshwater rely on the Nessler method.
Kits for brackishwater and seawater typically rely on the salicylate method.

19
MATERIALS AND METHODS
The TAN procedures evaluated in this study, the concentration ranges for the methods
without sample dilution, and references for analytical protocol are given in Table 1. The
water analysis kits, NH3 and NH4+
sensing electrodes, the prepackaged dry reagents and
solutions for these procedures were purchased new. Most reagents for other procedures were
prepared from ASC-grade laboratory reagents and high-quality, ammonia-free distilled water.
The TAN standards were prepared from ammonium chloride. The absorbances of samples –
except in analyses made by test kits – were measured (1-cm path length) with an Aquamate
Spectrophotometer (Thermo Fisher Scientific, Atlanta, GA USA). A VWRsymphony model
B20PI Benchtop meter (VWR Scientific Products, West Chester, PA, USA) was used to
measure the electrical potentials of the NH3 and NH4+
sensing electrodes.
The water samples were obtained from three locations. Freshwater samples of low
total dissolved solids concentration (specific conductance of 60 to 120 μmho cm-1
, calcium of
5 to 15 mg L-1
, and magnesium of 2 to 4 mg L-1
) were collected from ponds at the Auburn
University E.W. Shell Fisheries Center (SFC) 5 km N of Auburn, Alabama. Freshwater
samples of medium to high total dissolved solids concentration (specific conductance of 200
to 5000 μmho cm-1
, calcium of 40 to 80 mg L-1
, and magnesium of 8 to 12 mg L-1
) were
taken from commercial ictalurid catfish ponds in Dallas, Greene, and Hale counties of the
Blackland Prairie region of west-central Alabama. Samples of saline water (2 to 6 g L-1
of
salinity) were collected from ponds for inland culture of marine shrimp located the vicinity of
Forkland and Boligee in Greene County, Alabama.
The study was conducted in two stages. In the first stage, the standard Nessler,
phenate, and salicylate methods and the Nessler kit were evaluated. The second stage

20
involved evaluating the method that had the best precision and accuracy in the first stage, the
NH3 and NH4+
sensing electrodes, and the salicylate kit.
Accuracy and precision estimates were made from measurement of low, medium, and
high TAN concentrations. Samples for this task were screened for TAN concentration by the
salicylate method that previously had been proven highly reliable (Le and Boyd, 2012). The
TAN concentrations in the sample had the following ranges: low (0.03 – 0.25 mg L-1
);
medium (0.3 – 0.7 mg L-1
); high (0.8 – 2.0 mg L-1
). These ranges were chosen so as not to
exceed the upper limit of sensitivity of some of the methods.
Accuracy of each method was assessed by spike-recovery (Boyd and Tucker, 1992).
Ten replicates of a water sample of each concentration category were analyzed for TAN
concentration by a particular TAN method. The aliquots were then spiked with 0.30 mg L-1
TAN, mixed thoroughly, and analyzed for TAN concentration. The percentage recovery of
the spike – an estimate of accuracy – was calculated as follows:
Spike recovery (%) = F
I + S× 100
where I = initial TAN concentration; S = TAN concentration increased by spike; F = final
TAN concentration.
The variation in percentage recovery by a given method for a particular sample was
assessed by the relative standard deviation (coefficient of variability) of the replicates. The
results also were compared with the salicylate methods for difference in percentage recovery
by Tukey’sStudentized Range (HSD) test and for precision by the F-test for homogeneity of
variance.
Precision estimates were based on the coefficients of variation for 10 replicate
analyses at each of the three concentration categories by each method. The salicylate method
was used as a standard for F-test comparisons of heterogeneity of variances with other

21
methods. The means of the replicate analyzes were compared for differences by the
Tukey’sStudentized Range (HSD) test.
Twenty-seven freshwater samples including both low and high concentration of
hardness and ranging from 0.04 to 1.5 mg L-1
in TAN concentration (as determined by the
salicylate method) were analyzed by all methods. Results for each method (Y variable) were
regressed versus the results of the salicylate method. Slopes and intercepts of the regression
lines were tested to determine if they differed from 1.0 and 0.0, respectively.
Statistical significant was accepted at P ≤ 0.05. All statistical analyses were
conducted with SAS 9.3 (SAS Institute, Cary, NC, USA).
RESULTS
Spike recoveries by the different methods were compared among the different types
of water and TAN concentrations (Tables 2 and 3). The salicylate method had excellent
accuracy based on spike recovery tests – average recoveries for ten replicates ranged from
97.6 to 103.3% – grand mean of 100.4%. The CVs of spike recoveries among replicates of
spiked sample by the salicylate method were less than 5% in all instances.The phenate I
method performed about as well as the salicylate method in recovery of TAN spikes in
freshwater (97.1 – 107.9%), and it tended to have spike recoveries closer to 100% than did
the phenate II method across all freshwater comparisons. In saline water, both thephenate I
nor II methods had a wide range in spike recoveries – values varied from 81.5 – 114.4% and
75.9 – 78.0%, respectively.
The Nessler II procedure had spike recoveries of 101.0 – 107.4% in freshwaters of
both low and high hardness. This method had spike recoveries over 125% at low and medium
TAN concentration in saline water, but it gave a spike recovery of 102.5% at the high TAN

22
concentration in saline water. The Nessler I method usually had spike recoveries between 126
and 189% – only at the high TAN concentration in hard freshwater and saline water was
spike recovery by this method near 100%.
The NH3 and NH4+
sensing electrodes had spike recoveries of 75.4 – 109.7% and 93.5
– 123.27%, respectively, in freshwater. The electrodes had spike recoveries of 122.0 – 147.5%
and 92.9 – 101.0%, respectively, in saline water.
The Nessler kit had spike recoveries of 102.3 – 171.7% in freshwater and 106.3 –
139.1% in saline water. The best spike recoveries were for high TAN concentration. The
salicylate kit, however, performed well with respect to spike recovery across all TAN
concentrations and types of waters – values ranged from 99.1 to 117.4% with only one
instance of a recovery greater than 110%.
The repeatability of spike recovery estimate among the replicates for each type of
water and TAN concentration tended to be reasonably good. Of the CVs for the 90
combinations of methods, waters, and TAN concentrations, 56 were less than 5%, only 10
were above 10%, and the greatest was 23.0%.
When the means across the spike recoveries for the three TAN concentrations were
averaged, there were significant differences in average spike recovery betweenNessler I
method and salicylate method, phenate I or II methods in soft freshwater; and Nessler I
technique and phenate II technique in hard freshwater and saline water. There were no
significant differences in average spike recovery amongsalicylate method, NH3 and NH4+
sensing electrodes and salicylate kit in freshwater except that the NH3 sensing electrode
method provided results different from the standard salicylate method, salicylate kit and
NH4+
sensing electrode method in saline water.
Although there were differences in spike recovery among several of the TAN analysis
techniques relative to the salicylate method, TAN concentrations measured in 27 water

23
samples by all methods were highly correlated (R2
= 0.919 to 0.996) with the salicylate
method. However, the slopes and intercepts for the regression lines were equal to 1.0 and 0.0,
respectively, only for the regression between the salicylate method and the phenate I method
(Table 4). For the phenate II method, the slope of the regression line with the salicylate
method did not differ from 1.0, but the intercept differed from 0.0, while the opposite was
true for the regression line for the salicylate method and the salicylate kit. Slopes and
intercepts for the regression line between the salicylate method and other procedures differed
from 1.0 and 0.0, respectively.
The replicate analyses for precision estimates allowed a statistical comparison of
mean TAN concentration measured on the same samples by the salicylate method and the
other methods (Tables 5 and 6). The phenate I method gave a different mean than the
salicylate method for only one of the nine combination of water type and TAN concentration.
The number of differences for the other methods were: phenate II, five; Nessler I, nine;
Nessler II, six; NH3 sensing electrode, eight; NH4+
sensing electrode, eight;Nessler kit, eight;
salicylate kit, one. Thus, only the phenate I and salicylate kit could be considered as
providing TAN concentration roughly comparable to the standard salicylate method.
The precision estimates for the salicylate method ranged from 0.85 to 5.68% –
average of 2.02%; the other methods tended to have lower but reasonably good precision.
The numbers of CVs greater than 5.0% for the other methods were as follows: phenateI, two;
phenate II, three; Nessler I, eight; Nessler II, eight; NH3 sensing electrode, nine; NH4+
sensing
electrode, two;Nessler kit, seven; salicylate kit, five. In general, the precision increased (CVs
decreased) at greater TAN concentration.

24
DISCUSSION
Results of accuracy and precision tests (Table 2, 3, 5 and 6) showed that the phenate I
method performed much better than thephenate II method. The regression equation between
the phenate I method and the salicylate method in freshwater was Ysalicylate = 0.987Xphenate I -
0.011 with slope and intercept not different from zero, and R2 was 0.996. In spite of the good
performance of the phenate I method of Soloranzo (1969), the experience in water quality
laboratory in the School of Fisheries, Aquaculture and Aquatic Sciences, Auburn University
(Alabama, USA) has been that in the phenate I technique, the blue color of indophenol
sometimes is replaced by yellow or green color, resulting in unreliable results. This problem
was sometimes encountered in the present study, and when it was, the aliquot was discarded
and another aliquot was taken from the sample for analysis. Because of the occasional
problem with inconsistency of color, we feel that the standard salicylate method is better
suited for use in aquaculture.
The addition of Rochelle salt solution to samples for which the Nessler II method was
used resulted in better accuracy and precise measurements by the Nessler method.The
NesslerII method performed best in samples of the high TAN concentration category.
Nevertheless, neither Nessler method was equal or superior to the standard salicylate method
with respect to overall accuracy and precision.
Ammonia electrodes do not present concernsrelated to sample color or turbidity. The
electrode methods also are less expensive; the basic ISE setup including a meter capable of
reading millivolts, are 2 to 4 times less costly than a spectrophotometer. Average CVs in the
three TAN concentration categories demonstrated that the NH4+electrode was more precise
than the NH3 probe (Table 6). However, neither electrode procedure was as accurate or
precise asthe standard salicylate method. In saline water, the NH4+ electrode gave much

25
higher TAN results — 2.7 to 8 times as high than results reported by the standard salicylate
technique. This was the result of theNH4+ electrode being strongly affected by sodium and
potassium in shrimp pond water. The effect of sodium and potassium interference on the
TAN measurement by theNH4+ electrode decreased as TAN concentration in water increased.
Aquaculture producers in Alabama and elsewhere often monitor TAN concentrations
using ammonia test kits,because these devices are cheap, portable, rapid, and easy to use in
field and require little knowledge of quantitative chemistry. The Nessler kit tested in this
study was neither highly precise nor accurate except at high TAN concentration. The
salicylate kit, however,gave excellent precision and accuracy in most instances.
The least expensive method for TAN analysis was the Nessler kit, and analyses by the
gas and ion sensing probes also were of relatively low cost (Table 7). All laboratory methods
were more expensive because of the need to use filter paper, but the standard salicylate
method was the least expensive of the other five techniques. The salicylate kit method incurs
about 25% less expensive for chemicals than the standard salicylate method incurs for
chemicals and filter paper.
Another issue in TAN analysis relates to disposal of hazardous waste. In order to
improve waste management, the United States Congressin 1976 passed the Resource
Conservation and Recovery Act (Horinko, 2002). In 1980, chemicals hazardous because of
ignitability, corrositivity, reactivity (explosion risk), and toxicity were included in this act
(US Environmental Protection Agency, 1980a,b). Nessler reagent contains mercury, which is
a hazardous waste because of its toxicity and danger to the environment. Phenol and the by-
product o-chlorophenol from the phenateI and II methodsalso are human health hazards.
Hazardous waste disposal must follow specific protocols that increase the complexity and
cost of laboratory operation. The salicylate method does not result in a hazardous waste that
needs to be disposed by a special procedure, making its use in the laboratory less problematic.

26
CONCLUSION
The results of this study confirm that the standard salicylate method for TAN
measurement is appropriate for wide application in aquaculture water. Results for thephenate
I and salicylate method were not different (slope=1.0, intercept=0.0, R2=0.996) in freshwater,
but the phenate I method occasionally presents improper color development and samples
must be re-run.Nessler’s method gives better results in water of high TAN concentration (0.8
mg L-1
),but Rochelle salt should be added to negate the interference from calcium,
magnesium and other ions. Electrodes for sensing NH3 and NH4+ were less precise or
accurate in most comparison than the other methods.Nevertheless, in spite of the variation in
precision and accuracy among the methods, there was an excellent correlation (R2 ranged
from 0.919 to 0.996) when the various methods being evaluated were used to predict the
concentration obtained in the same samples by the standard salicylate.
The YSI salicylate kit is an alternative to the standard salicylate method for use at
aquaculture facilities.
LITERATURE CITED

27
Boyd, C.E., Tucker, C.S., 1992. Water quality and pond soil analyses for aquaculture.
Alabama Agriculture Experiment Station, Auburn University, Auburn, Alabama.
Boyd, C.E., Tucker, C.S., 2014. Handbook for aquaculture water quality. Craftmaster Printers,
Auburn, Alabama.
Eaton, A.D., Clesceri,L.S., Greenberg, A.E., 2005. Standard methods for the examination of
water and wastewater, 21stedition. American Public Health Association. Washington.
Emerson, K., Russo, R.C.,Lund, R.E., Thurston, R.V., 1975. Aqueous ammonia
equilibriumcalculations: effect of pH and temperature. J. Fish. Res. Board Can. 32:
2379–2383.
Hampson, B.L., 1977. The analysis of ammonia in polluted sea water. Water Res. 11:305–
308.
Horinko, M.L, 2002. 25 years of RCRA: Building our past to protect our future. Office of
Solid Waste and Emergency Response, EPA-K-02-027, US Environmental Protection
Agency, Washington.
Krug, F.J., Růžička, J., Hansen, E.H., 1979. Determination of ammonia in low concentrations
with Nessler's reagent by flow injection analysis. Analyst 104, 47–54.
Lammering, M.W., 1960. The toxicity of phenol, o-chlorophenol and o-nitrophenol to
bluegill sunfish. Doctoral dissertation, Washington University. Sever Institute of
Technology. Department of Civil Engineering.
Le, P.T.T., Boyd, C.E., 2012. Comparison of phenate and salicylate methods for
determination of total ammonia nitrogen in freshwater and saline water. J. World
Aquacult. Soc. 43:885–889.
Leonard, R.H., 1963. Quantitative range of Nessler's reaction with ammonia. Clin. Chem. 9:
417–422.
Liew, H.J., Sinha, A.K.,Nawata, C.M.,Blust, R., Wood, C.M.,Boeck, G., 2013. Differential
responses in ammonia excretion, sodium fluxes and gill permeability explain different
sensitivities to acute high environmental ammonia in three freshwaterteleosts. Aquat.
Toxicol. 126:63–76.
Lubochinsky, B., Zalta, J.P.,1954. Colorimetric micro-determination of total nitrogen. Bull.
Soe. Chim. Biol. 36:1363–1366.
Mann, L.T., 1963. Spectrophotometric determination of nitrogen in total micro-Kjeldahl
digest. Analyt. Chem. 35:2179–2182.
Searle, P.L., 1984. The Berthelot or indophenol reaction and its use in the analytical
chemistry of nitrogen. A Review. Analyst. 109: 549–568.
Solorzano, L., 1969. Determination of ammonia in natural waters by the phenolhypochlorite
method. Limnol. Oceanogr. 14: 799–801.

28
Trussell, R.P., 1972. The percent un-ionized ammonia in aqueous ammonia solutions at
different pH levels and temperatures. J. Fish. Board Can. 29:1505–1507.
Remy, H., 1956. Treatise on inorganic chemistry, Vol-2. Elsevier, Amsterdam.
Roberts, M.S., Anderson, R.A., Swarbrick, J., 1977. Permeability of human epidermis to
phenolic compounds. J. Phar. Pharmacol. 29:677–683.
Roy, L.A., Davis, D.A., Saoud, I.P., Boyd, C.A., Pine, H.J., Boyd, C.E., 2010. Shrimp culture
in inland low salinity waters. Rev.Aquacult. 4:191–208.
US Environmental Protection Agency, 1980a. Title 40, Protection of Environment. Part 262 –
Standards Applicable to Generators of Hazardous Wastes. Revised as of 1 July 2003.
US Government Printing Office, Washington.
US Environmental Protection Agency, 1980b. Title 40, Protection of Environment. Part 261–
Identification and Listing of Hazardous Wastes. Revised as of 1 July 2004.
USGovernment Printing Office, Washington.
Verdouw, H., Van Echteld, C.J.A., Dekkers, E.M.J., 1978. Ammonia determination based on
indophenol formation with sodium salicylate. Water Res. 12:399–402.
Zhou, L., Boyd, C.E., 2015. An assessment of total ammonia nitrogen concentration in
Alabama (USA) ictalurid catfish ponds and the possible risk of ammonia toxicity.
Aquacult. 437:263–269.

29
Table 1. Detect range without dilution,references for analytical protocol for each of total ammonia nitrogen (TAN) determination method in this study
Method Detect range without dilution (mg L-1
) Reference
Salicylate 0 - 1.0 Bower and Holm-Hansen, 1980
Phenate I§ 0.02 - 1.25 Eaton et al., 2005
Phenate II§§
0 - 2.0 Boyd and Tucker, 1992
Nessler I§ 0.02 - 5.0 Eaton et al., 2005
Nessler II§§
0.02 - 5.0 Eaton et al., 2005
NH3 electrode (VWR Symphony TM) 0.05 – 14000 VWR User Manual
NH4+ electrode (Radiometer Analytical, ISE25NH4) 0.04 – 14000 Radio-meter Analytical User Manual
Nessler kit (Hach Company, Model NI-8) 0 - 3.0 Hach User Manual
Salicylate kit (Yellow Spring Institute Company) 0 - 1.0 YSI User Manual
§ Without Rochelle salt solution
§§ With Rochelle salt solution
30
Table 2. Means, SD and coefficient of variations (CV) for recovery of 0.3 mg L-1
ammonia nitrogen spikes to samples of waters from different TAN concentration ranges and
locations by salicylate, phenate and Nessler methods. Means are tested for difference by Tukey’sStudentized Range (HSD) test; homogeneity of variances was tested by F-
tests with salicylate method as the standard method. Means indicated by the same letter in a column do not differ (P = 0.05) according to HSD test.
Method
Low Concentration Medium Concentration High Concentration
Spike recovery (%)
CV (%) (F test)
Spike recovery (%)
CV (%) (F test)
Spike recovery (%)
CV (%) (F test)
Average SR (%)
Low Hardness
Salicylate 98.8±0.57 a 0.6 100.5±0.84 ac 0.8 97.6±0.560 a 0.6 99.0 a
Phenate I 107.8±2.42 a 2.3(*) 97.1±1.43 ac 1.5 101.5±1.53 b 1.5(*) 102.1 a
Phenate II 94.2±8.19 a 8.7(*) 96.7±03.17 a 3.3(*) 94.2±1.607 a 1.7(*) 95.0 a
Nessler Kit 171.7±17.23 b 10.1(*) 136.1±5.66 b 4.2(*) 104.8±3.28 b 3.1(*) 137.6 ab
Nessler I 167.3±14.67 b 8.8(*) 145.7±9.57 d 6.6(*) 127.7±5.03 c 3.9(*) 146.9 b
Nessler II 102.4±5.31 a 5.2(*) 103.9±5.60 c 5.4(*) 103.7±2.15 b 2.1(*) 103.3 ab
Medium to high hardness
Salicylate 99.9±0.97 a 1.0 98.7±1.41 a 1.4 98.7±0.79 a 0.8 99.1 ac
Phenate I 100.2±2.82 a 2.8(*) 103.4±4.03 a 3.7(*) 107.9±3.51 b 3.3(*) 103.8 ac
Phenate II 94.7±3.97 a 4.2(*) 84.4±4.28 b 5.1(*) 89.1±3.03 c 3.4(*) 89.4 ab
Nessler Kit 132.3±14.12 a 10.7(*) 133.6±7.95 c 6.0(*) 102.3±3.02 d 3.0(*) 122.7 ac
Nessler I 187.4±13.15 b 7.0(*) 138.2±6.98 c 5.0(*) 103.1±1.87 d 1.8(*) 142.9 c
Nessler II 107.4±5.63 a 5.3(*) 104.5±2.76 a 2.6(*) 101.0±2.84 ad 2.8(*) 104.3 ac
Saline
Salicylate 102.0±0.56 a 0.6 99.0±1.73 a 1.8 103.3±0.63 a 0.6 101.5 ac
Phenate I 81.5±8.35 b 10.3(*) 83.5±1.95 b 2.4 114.4±7.77 ac 6.8(*) 93.1 ac
Phenate II 75.9±3.20 b 4.2(*) 76.8±1.78 b 2.3 78.0±2.64 b 3.4(*) 76.9 ab
Nessler Kit 126.6±7.41 c 5.9(*) 139.1±9.91 c 7.1(*) 106.3±4.24 a 4.0(*) 124.0 ac
Nessler I 189.6±22.43 d 11.8(*) 137.5±9.03 c 6.6(*) 109.9±2.90 c 2.6(*) 145.7 c
Nessler II 126.1±9.50 c 7.5(*) 126.8±11.37 d 9.0(*) 102.5±5.66 a 5.5(*) 118.5 ac

31
*Significant at 𝛼=0.05. Table 3. Means, SD and coefficient of variations (CV) for recovery of 0.3 mg L
-1 ammonia nitrogen spikes to samples of waters from different TAN concentration ranges and
locations by salicylate, salicylate kit and ammonia probes. Means are tested for difference by Tukey’sStudentized Range (HSD) test; homogeneity of variances was tested by
F-tests with salicylate method as the standard method. Means indicated by the same letter in a column do not differ (P = 0.05) according to HSD test.
Method
Low Concentration Medium Concentration High Concentration Average
SR (%) Spike recovery
(%)
CV (%)
(F test)
Spike recovery
(%)
CV (%)
(F test)
Spike recovery
(%)
CV (%)
(F test)
Low hardness
Salicylate 102.6±0.92 a 0.9 100.6±1.22 a 1.2 102.1±0.89 ab 0.9 101.8 a
Salicylate kit 104.9±2.37 a 2.3(*) 98.9±5.18 a 5.2(*) 105.1±2.58 a 2.5(*) 103.0 a
NH4+ probe 123.3±13.17 b 10.7(*) 96.6±1.70 a 1.8 99.1±2.63 bc 2.7(*) 106.3 a
NH3 probe 106.8±15.70 a 14.7(*) 85.3±7.60 b 8.9(*) 94.6±8.57 c 9.1(*) 95.6 a
Medium to high hardness
Salicylate 99.9±2.16 ab 2.2 102.5±1.47 a 1.4 100.5±2.13 a 2.1 101.0 a
Salicylate kit 109.0±2.91 a 2.7 105.2±5.93 a 5.6(*) 117.4±6.48 b 5.5(*) 110.5 a
NH4+ probe 93.5±5.03 a 5.4(*) 108.1±3.17 a 2.9(*) 97.6±2.48 a 2.5 99.7 a
NH3 probe 109.7±17.68 b 16.1(*) 75.4±8.83 b 11.7(*) 106.5±13.56 a 12.7(*) 97.2 a
Saline
Salicylate 99.0±1.71 a 1.7 103.5±0.93 a 0.9 100.5±0.83 a 0.8 101.0 a
Salicylate kit 99.1±4.18 a 4.2(*) 104.3±4.13 a 4.0(*) 103.1±4.43 a 4.3(*) 102.1 a
NH4+ probe 92.9±4.05 a 4.4(*) 101.0±3.46 a 3.4(*) 98.9±3.51 a 3.6(*) 97.6 a
NH3 probe 147.5±22.91b 23(*) 133.8±22.88 b 17.1(*) 122.0±8.38 b 6.9(*) 134.4 b
*Significant at 𝛼=0.05.

32
Table 4. Results of regression analyses of TAN concentrations measured by the salicylate method (X) and the other method (Y) in freshwater. Slopes of X and Y intercepts of
regression lines were tested to determine if they differed from 1.0 and 0.0, respectively
Method Regression equation R2 Slope=1.0 Intercept=0.0
PhenateI Y = 0.987X-0.011 (P<.0001) 0.996 Yes Yes
PhenateII Y = 1.023X+0.083 (P<.0001) 0.985 Yes No
Nesslerkit Y = 2.045X-0.201 (P<.0001) 0.967 No No
NesslerI Y = 1.355X-0.268 (P<.0001) 0.919 No No
NesslerII Y = 2.707X-0.275 (P<.0001) 0.959 No No
Salicylate kit Y = 1.071X + 0.013 (P<.0001) 0.993 No Yes
NH4+ probe Y = 1.112X + 0.167 (P<.0001) 0.971 No No
NH3 probe Y = 1.105X + 0.056 (P<.0001) 0.978 No No

33
Table 5. Means, SD and coefficient of variations (CV) for TAN determinations of ten replicates of each sample from different TAN concentration ranges and locations by
salicylate, phenate and Nessler methods. Means are tested for difference by Tukey’sStudentized Range (HSD) test; homogeneity of variances was tested by F-tests with
salicylate method as the standard method. Means indicated by the same letter in a column do not differ (P = 0.05) according to HSD test.
Method
Low Concentration Medium Concentration High Concentration Average
CV (%) Mean ± SD in
mg/L
CV (%)
(F test)
Mean ± SD in
mg/L
CV (%)
(F test)
Mean ± SD in
mg/L
CV (%)
(F test)
Low hardness
Salicylate 0.206±0.0077 a 3.75 0.532±0.0057 a 1.08 1.517±0.0279 a 1.85 2.23 a
Phenate I 0.194±0.0011 a 0.56(*) 0.521±0.0059 a 1.14 1.456±0.0424 a 2.91 1.54 a
Phenate II 0.207±0.0112 a 5.42 0.514±0.0133 a 2.6(*) 1.234±0.0419 b 3.39 3.80 a
Nessler Kit 0.372±0.0214 b 5.76(*) 1.153±0.1346 b 11.68(*) 2.683±0.1465 c 5.46(*) 7.63 a
Nessler I 0.836±0.2252 c 26.93(*) 1.420±0.1353 d 9.53(*) 3.033±0.2057 d 6.78(*) 14.41 a
Nessler II 0.365±0.1008 b 27.61(*) 0.675±0.0651 c 9.64(*) 1.543±0.1049 a 6.80(*) 14.68 a
Medium to high hardness
Salicylate 0.162±0.0009 a 5.68 0.472±0.0051 a 1.08 1.744±0.0342 a 1.96 2.91 a
Phenate I 0.147±0.0187 a 12.68(*) 0.462±0.0201 a 4.35(*) 1.635±0.0698 a 4.27(*) 7.10 a
Phenate II 0.227±0.0143 b 6.32 0.505±0.0184 ab 3.66(*) 1.316±0.0387 b 2.95 4.31 a
Nessler Kit 0.186±0.0513 ab 27.59(*) 0.590±0.0575 b 9.75(*) 2.675±0.0945 c 3.53(*) 13.62 a
Nessler I 0.581±0.0894 c 15.40(*) 1.393±0.1937 c 13.9(*) 3.369±0.2324 d 6.90(*) 12.07 a
Nessler II 0.245±0.0213 b 8.69(*) 0.547±0.0285 ab 5.22(*) 1.750±0.0449 a 2.57 5.49 a
Saline
Salicylate 0.234±0.0061 a 2.60 0.620±0.0053 a 0.85 1.607±0.0168 a 1.05 1.22 a
Phenate I 0.170±0.0193 a 11.34(*) 0.456±0.0091 b 2.01 1.475±0.0461 a 3.13(*) 4.83 a
Phenate II 0.206±0.0112 a 5.43(*) 0.450±0.0129 b 2.86(*) 1.102±0.0225 b 2.21 2.56 a
Nessler Kit 0.328±0.0581 b 17.73(*) 0.625±0.0855 a 13.67(*) 2.324±0.1077 c 4.63(*) 7.50 a
Nessler I 0.552±0.0636 c 11.52(*) 1.082±0.0500 d 4.62(*) 2.977±0.3884 d 13.0(*) 8.21 a
Nessler II 0.323±0.0808 b 25.05(*) 0.704±0.0546 c 7.75(*) 2.193±0.1526 c 6.96(*) 10.70 a
*Significant at 𝛼=0.05

34
Table 6. Means, SD and coefficient of variations (CV) for TAN determinations of ten replicates of each sample from different TAN concentration ranges and locations by
salicylate, salicylate kit and ammonia probes. Means are tested for difference by Tukey’sStudentized Range (HSD) test; homogeneity of variances was tested by F-tests with
salicylate method as the standard method. Means indicated by the same letter in a column do not differ (P = 0.05) according to HSD test.
Method
Low Concentration Medium Concentration High Concentration Average
CV (%) Mean ± SD in
mg/L
CV (%)
(F test)
Mean ± SD in
mg/L
CV (%)
(F test)
Mean ± SD in
mg/L
CV (%)
(F test)
Low hardness
Salicylate 0.169±0.0082 a 4.84 0.582±0.0052 a 0.89 1.359±0.0085 a 0.63 2.12 a
Salicylate kit 0.213±0.0298 b 14.01(*) 0.669±0.0557 a 8.32(*) 1.426±0.0604 a 4.24(*) 8.86 ab
NH4+ probe 0.275±0.0144 c 5.23 0.800±0.0336 b 4.20(*) 1.358±0.0390 a 2.93(*) 4.12 a
NH3 probe 0.168±0.0328 a 19.59(*) 1.040±0.1907 c 18.33(*) 1.043±0.1328 b 12.74(*) 16.89 b
Medium to high hardness
Salicylate 0.209±0.0046 a 2.20 0.502±0.0006 a 1.23 1.540±0.0297 a 1.93 1.79 a
Salicylate kit 0.211±0.0129 a 6.10(*) 0.544±0.0230 a 4.22(*) 1.656±0.1005 a 6.07(*) 5.46 a
NH4+ probe 0.909±0.0520 b 5.72(*) 1.227±0.0462 b 3.77(*) 2.199±0.0798 b 3.63(*) 4.37 a
NH3 probe 0.568±0.1124 c 19.81(*) 1.052±0.1717 c 16.33(*) 2.538±0.2928 c 11.53(*) 15.89 b
Saline
Salicylate 0.194±0.0033 a 1.72 0.568±0.0077 a 1.35 1.440±0.0225 a 1.56 1.54 a
Salicylate kit 0.189±0.0145 a 7.67(*) 0.588±0.0217 a 3.69(*) 1.518±0.0577 ac 3.80(*) 5.05 ab
NH4+ probe 1.547±0.0538 b 3.48(*) 3.160±0.0784 b 2.48(*) 3.951±0.0813 b 2.06(*) 2.67 a
NH3 probe 0.338±0.0629 c 18.6(*) 0.783±0.0611 c 7.81(*) 1.550±0.1373 c 8.85(*) 11.75 b
*Significant at 𝛼=0.05.
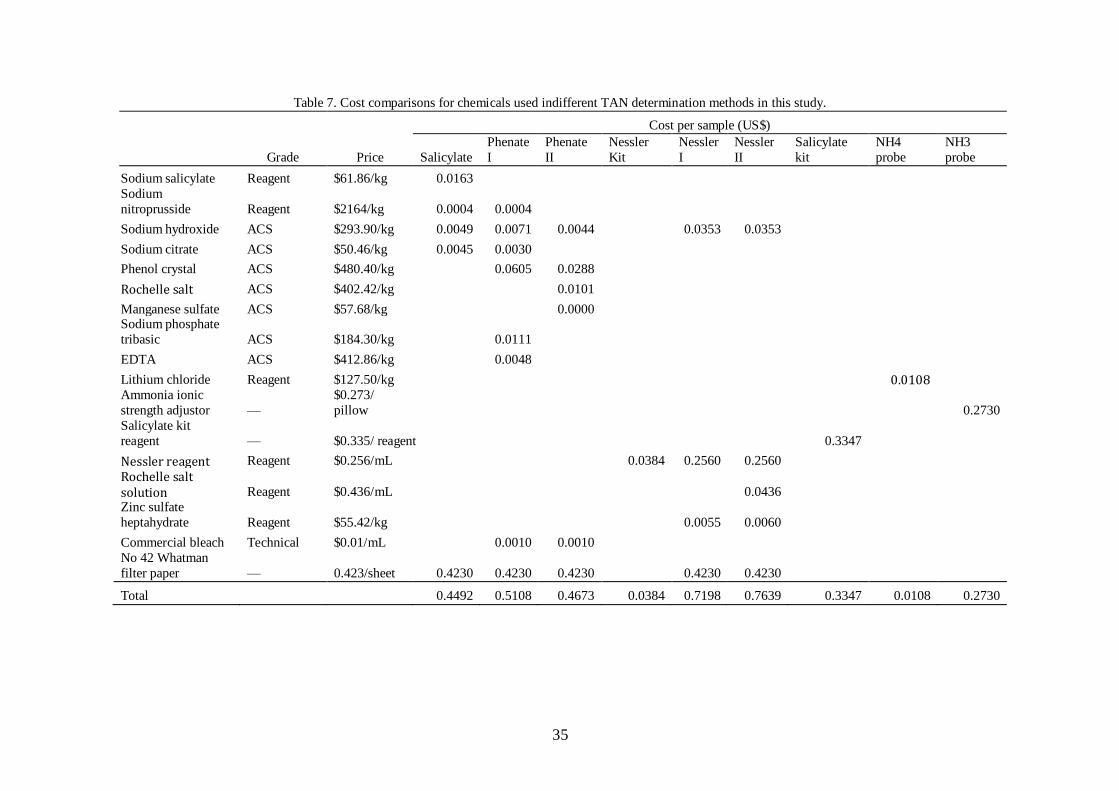
35
Table 7. Cost comparisons for chemicals used indifferent TAN determination methods in this study.
Grade Price
Cost per sample (US$)
Salicylate
Phenate
I
Phenate
II
Nessler
Kit
Nessler
I
Nessler
II
Salicylate
kit
NH4
probe
NH3
probe
Sodium salicylate Reagent $61.86/kg 0.0163
Sodium
nitroprusside Reagent $2164/kg 0.0004 0.0004
Sodium hydroxide ACS $293.90/kg 0.0049 0.0071 0.0044
0.0353 0.0353
Sodium citrate ACS $50.46/kg 0.0045 0.0030 Phenol crystal ACS $480.40/kg
0.0605 0.0288
Rochelle salt ACS $402.42/kg
0.0101
Manganese sulfate ACS $57.68/kg
0.0000 Sodium phosphate
tribasic ACS $184.30/kg
0.0111
EDTA ACS $412.86/kg
0.0048
Lithium chloride Reagent $127.50/kg
0.0108
Ammonia ionic
strength adjustor —
$0.273/
pillow
0.2730
Salicylate kit
reagent — $0.335/ reagent
0.3347 Nessler reagent Reagent $0.256/mL
0.0384 0.2560 0.2560
Rochelle salt solution Reagent $0.436/mL
0.0436
Zinc sulfate
heptahydrate Reagent $55.42/kg
0.0055 0.0060
Commercial bleach Technical $0.01/mL
0.0010 0.0010
No 42 Whatman
filter paper — 0.423/sheet 0.4230 0.4230 0.4230
0.4230 0.4230
Total 0.4492 0.5108 0.4673 0.0384 0.7198 0.7639 0.3347 0.0108 0.2730

36
IV. AN ASSESSMENT OF TOTAL AMMONIA NITROGEN CONCENTRATION
INALABAMA NITROGEN CONCENTRATION IN ALABAMA (USA)
ICTALURIDCATFISH PONDS AND THE POSSIBLE RISK OF AMMONIA TOXICITY
ABSTRACT
An assessment of total ammonia nitrogen (TAN) concentration was conducted for 31,
ictalurid catfishponds on six farms, in the Blackland Prairie region of Alabama (USA). Five
farms that provided production data had average annual feed inputs and harvest weights of
15,579 – 21,739 kg ha-1
and 8,104 – 12,344 kg ha-1
, respectively. Concentrations of TAN
were measured 26 times (weekly June through September and less frequently other months)
between May 2013 and May 2014. The farm average, annual TAN concentrations were 1.05-
1.78 mg L-1
at five farms and 4.17 mg L-1
at the other. Correlations were not found (P > 0.05)
when pond average TAN concentration was regressed individually against feed input, weight
fish harvested, and aeration rate. Nearly half of the TAN concentrations were < 1 mg L-1
, the
majority was<5 mg L-1
, but some ranged from 5 to 15 mg L-1
.
Analysis of the literature on ammonia toxicity to channel catfish suggested that the
no-observed-effect level (NOEL) is around 1.0 mg L-1
NH3-N in ponds with pH of 7.5 and
above where NH3-N concentration fluctuates greatly because of daily change in temperature
and especially pH. Based on the daily pH fluctuation of 7.5 to 9.5 observed in ponds, and
typical monthly average water temperatures, the NOEL for NH3-N was oftenexceeded. At pH
8.5 – 8.9, depending upon the month, up to 14.5% of ponds exceeded the NOEL for NH3-N.
The NOEL was exceeded by up to 31.5% of pond at pH ≥ 9.0. The findings reveal that TAN
concentrations often are at chronically toxic levels for ictalurid catfish in Alabama ponds.
37
There usually is no practical emergency treatment for reducing NH3-N (or TAN)
concentration in ponds exceeding the NOEL. Thus, good management practices for avoiding
excessively high TAN concentrations in ponds, e.g., efficient feed management, adequate
aeration to promote nitrification, and treatments maintaining buffering capacity in pond water
should be applied.
INTRODUCTION
In feed-based aquaculture, 20 to 40% of nitrogen contained in protein of feed applied
to ponds is recovered in harvested biomass. The rest of the nitrogen enters the pond in
uneaten feed and feces or is excreted as ammonia nitrogen by the culture species. Nitrogen in
uneaten feed and feces is released into the water as ammonia nitrogen by bacteria and other
decomposer organisms (Boyd and Tucker, 2014).
Ammonia nitrogen occurs in water as un-ionized ammonia (NH3) and ammonium ion
(NH4+):
NH3 + H2O = NH4+ +OH
–Kb=10
-4.74 (1)
Biological membranes are more permeable to NH3 than to NH4+, and ammonia toxicity is
attributed primarily to NH3. Nevertheless, high NH4+ concentration in the water interferes
with the outward movement of ammonia through the gills (Liew et al., 2013). Thus, NH4+ has
some degree of toxicity, but much less than that of NH3.
The ratio NH3:NH4+ increases with greater pH as obvious from Eq. 1. Moreover,
examination of Kb of Eq. 1 for different temperatures (Bates and Pinching, 1949) shows that
the NH3:NH4+ ratio also increases with rising temperature.

38
The usual analytical procedures do not distinguish between ammonia and ammonium,
and results are reported as total ammonia nitrogen (TAN) consisting of NH3-N and NH4+-N.
The concentrations of each of the two forms can be calculated with Eq.1 using the measured
pH and the appropriate Kb for the observed water temperature. However, convenient tables
for estimating the percentage of TAN present as NH3-N at different pHs and water
temperatures are available (Trussell, 1972; Emerson et al., 1975), and even more convenient
NH3-N calculators are available on-line – an excellent one can be found at
http://www.hbuehrer.ch/Rechner/Ammonia.html.
Concern over possible toxic effects of ammonia in aquaculture system has increased
in recent years, because of the intensification of production by greater use of feeds. For
example, in ictalurid catfish farming in the southern United States, average production in
ponds has increased from less 2,000 kg ha-1
in the 1960s to over 5,000kg ha-1
in recent
years(Hanson and Sites, 2012).Annual production at some farms in Alabama has exceeded
10,000 kg ha-1
in recent years. Such high production results in greater nitrogen input that
favors higher TAN concentration. Nitrogen and phosphorus that enters water as a result of
feeding stimulate phytoplankton productivity, and greater photosynthesis often increases pH
during the day, increasing the proportion of NH3-N (Boyd and Tucker, 2014).
There seems to be reason for concern over possible negative effects of ammonia in
ictalurid catfish ponds and other types of intensive pond aquaculture. Nevertheless, a careful
analysis of the situation has not been made despite there being considerable information on
the toxicity of ammonia to aquaculture species including channel catfish Ictaluruspunctatus.
The 96-hr LC50 to channel catfish ranged from 1.50 to 3.30 mg L-1
with an average of 2.28
mg L-1
(Hargreaves and Kucuk, 2001).
Water temperature and pH fluctuate daily in ponds with highest values typically
occurring in early to mid-afternoon (Boyd and Tucker, 2014). In order to investigate the

39
effect of daily fluctuations in NH3-N, Hargreaves and Kucuk (2001) exposed channel catfish
in laboratory systems for 22 to 43 days to pH regimes that mimicked those in ponds.
Exposure of fish to a daily maximum NH3-N concentration of 0.91 mg L-1
NH3-N did not
influence growth compared to the control, while a 42% reduction in growth occurred at a
maximum daily NH3-N concentration of 1.81 mg L-1
NH3-N. They concluded that in ponds, a
high daily maximum NH3-N concentration would persist for no more than 5 to 10 days, while
the high daily concentration persisted throughout their trial. They suggested that in ponds, an
effect on growth might not be elicited at as low a NH3-N concentration as observed in their
study.
The intensity of ictalurid catfish culture in ponds in the United States has increased,
and farmers sometimes measure TAN concentrations of 10 mg L-1
with ammonia analysis
kits. A few such high TAN concentrations have been verified by laboratory analyses at the
Alabama Fish Farming Center in Greensboro.The major concern about the high TAN
concentration is that disease outbreaks have been noted during or after these episodes
(William Hemstreet, Alabama Fish Farming Center, personal communication). The present
study was conducted to determine the range in TAN concentration in Alabama catfish ponds,
and to ascertain if the concern over high TAN concentration is justifiable.
MATERIALS AND METHODS
Six commercial catfish farms in the Blackland Prairie region of west-central Alabama
that have high production were selected, and a total of 31 ponds – five each on five farms and
six at the other – were chosen because they had the highest stocking densities on the farms.

40
The ponds had total alkalinity and total hardness concentrations ranging from 85-128 mg L-1
and 91-142 mg L-1
, respectively.
The ponds were watershed-type ponds maintained by runoff. Pond water surfaces
varied (Table 1), and catfish ponds in Alabama are typically about 1.5 m in average depth
(Boyd et al., 2000). The ponds were stocked with channel catfish (Ictaluruspunctatus), hybrid
catfish (I. punctatus♀I. furcatus ♂), or a combination of both. Management was similar
among farms. Fish were produced by the multiple-batch system (Boyd et al., 2000) in which
marketable-size fish are harvested by a tractor-drawn grading seine at intervals determined by
the manager, and advanced fingerlings are stocked as replacements. Ponds usually are
drained about twice over a 15-yr period.
Fish were provided a 32% crude protein, floating, pelleted ration daily by truck-
mounted feeders that propelled the feed over the water surface around the sides of the pond.
Feed usually was applied to apparent satiation, often resulting in more feed being offered
than consumed. Floating, electric, paddlewheel aerations in each pond (Table 1) were
operated – mainly at night – between May and October.
Water samples were collected from the ponds by dipping surface water with a dipper
attached at the end of a 3-m plastic rod. Samples were placed in 1-L plastic bottles and held
on ice in insulated chests during transport to the laboratory at Auburn University. Samples
were collected weekly from May to September 2013 (late spring and summer), twice weekly
in October, and once per month until May 2014. Water samples were filtered by gravity
through No. 42 paper, and TAN concentrations in filtrates were measured by the salicylate
method (Bower and Holm-Hansen, 1980; Le and Boyd, 2012).
Fluctuations in water temperature and pH were measured over a 24-hr period in two
ponds each with light [Secchidisk (SD) visibility > 40 cm], medium [SD visibility 15 – 30
cm], and dense [SD visibility <15 cm)] phytoplankton abundance at Farm K. This farm was

41
chosen because there were six ponds that met the desired phytoplankton abundance
categories. Some of these ponds, however, were not included in monitoring of TAN
concentration. Surface and bottom water samples were collected every 3 hr and measurement
of temperature and pH were attained with a handheld WaterproofpHTestr® 30 (Oaklon
Instruments, Vernon Hills, IL, USA).
Data on water surface areas, total feed input, and total weights of harvested fish were
attained from farm owner on managers.
The nitrogen input to ponds was calculated by the equation:
Ni=(Fi)(Nf/100) (2)
where Ni = nitrogen input in feed (kg ha-1
), Fi = feed input (kg ha-1
), and Nf = nitrogen
concentration in feed (%),
The nitrogen waste load to ponds (feed nitrogen- fish nitrogen) was estimated for each
pond as follows:
Nw= Ni – (B)(Nb/100) (3)
where Nw = nitrogen waste load (kg ha-1
), B=harvested biomass (kg ha-1
); and Nb = nitrogen
concentration in harvested biomass (kg ha-1
). Live channel catfish contain 2.38% nitrogen
(Boyd et al., 2007).
The nitrogen waste load as equivalent TAN concentration was estimated with the
equation:
TANeq=Nw × 10−3
D × 104 (4)
where TANeq = TAN equivalent (g m-3
= mg L-1
), D = average pond depth (1.5 m was used),
10-3
= kg g-1
, 104 = m
2ha
-1.
Statistical analysis including estimating of means and standard deviation, analysis of
variance (ANOVA) followed by Tukey multiple range test, box plots, and correlation

42
analyses were conducted using Prism software, Version 6 (GraphPad Software, Inc., La Jolla,
CA, USA).
RESULTS
Production data were provided by only five of the farms (Table 1), but TAN
concentration was measured at all six farms. Ponds were large, ranging in average
watersurface area from 2.53 ha at Farm W to 4.17 ha at Farm K. Total feed input for the 12-
month period averaged from 15,580 kg ha-1
at Farm A to 21,740 kg ha-1
at Farm D; the grand
mean and standard deviation were 10,960± 2,230. Feed was applied almost entirely between
late March and late October – a period of roughly 210 days. Thus, daily feed input averaged
around 81 – 103 kg ha-1
day-1
(grand mean = 92 kg ha-1
day-1
).
Harvest biomass ranged from 8,010 kg ha-1
at Farm A to 13,650 kg ha-1
at Farm K
(grand mean = 10,960± 1,990 kg ha-1
). The variation in harvest biomass among ponds was
great with coefficients of variation from 31.0 to 48.4% at Farm R and W, respectively.
Because of the great variability in production variables, there were no differences (P >
0.05) among farms for average feed input and harvest biomass. Moreover, the linear
relationship between feed input and harvest biomass for all ponds, although significant, was
not strong (R2=0.178, P < 0.05).
Average TAN concentrations did not differ (P > 0.05) among Farms A, D, K, U, and
W, but Farm R had a higher average concentration than other farms (Fig. 1). Variation in
TAN concentration among ponds and dates was considerable at all farms. The lower end of
the range was similar at all farms and concentrations above 5 mg L-1
TAN were measured at
all farms. However, at Farm A and D, TAN concentration above 10 mg L-1
were noted, and at
Farm R, a concentration above 15 mg L-1 occurred. Roughly 50% of samples had less than 1

43
mg L-1
TAN, and the frequency declined as concentration increased – 10.79% samples were >
5 mg L-1
TAN, 2.23% > 10 mg L-1
, and 0.12% were > 15 mg L-1
(Fig. 2).
Concentrations of TAN were plotted across sampling dates (Fig. 3)for each of three
ponds selected to represent the low, medium, and high TAN concentration categories. The
TAN concentration tended to fluctuate greatly over time in the low and medium categories,
but a concentration of 5 mg L-1
was reached in only one of the six ponds of these categories.
In ponds of the high TAN concentration category, the concentration steadily increased from
May until late August and September. Afterwards, there was considerable variation among
dates. On many dates, TAN concentration in all three ponds exceeded 5 mg L-1
, and on 11
September all concentrations exceeded 10 mg L-1
.
Concentration analysis also revealed that total feed input (R2= 0.119; P>0.05) and
weight of harvested fish (R2= 0.004; P>0.05) were not related to TAN concentration when all
data were pooled. Moreover, concentrations of TAN were not correlated with aeration rate
when data from all ponds were considered (R2= 0.002; P>0.05).
In ponds with light, medium, and dense phytoplankton blooms at Farm K, the pH
range was from 7.31 at 0830 hr to 9.50 at 1730 hr (Fig. 4), while the water temperature range
was from 26.2 C at 0530 hr to 31.8 C at 1730 hr (Fig. 5). Daily trends of change and
averages in pH and water temperature were similar among the ponds with different
phytoplankton abundance levels.
DISCUSSION
In the multiple-batch production system, fish are partially harvested at intervals
followed by restocking of replacement fingerlings. The intervals between partial harvest vary
because of delays caused by presence of off-flavor in fish (Boyd and Tucker, 2014), fish

44
price, and a need for cash or other reasons specific to the producers. The weight of fish
harvested and amounts of feed applied varies in individual ponds, farms, and years. It is not
possible to make an accurate estimate of actual fish production, feed conversion ratio (FCR),
or survival on an annual basis. These estimates require several years of data to which we did
not have access. An indication of production performance in multiple batch culture was
provided by a yield trial conducted over a 3-yr period in two channel catfish and three hybrid
catfish ponds in Alabama (Southern Regional Aquaculture Center, 2007). Net production
averaged 6,849 kg ha-1
yr-1
; mean survival was 67.4%; net FCR averaged 2.10.
Despite the inability to obtain highly reliable production statistics, it was possible to
obtain accurate estimates of nitrogen input to ponds during the study period from feed input
and feed nitrogen concentration (Eq. 2). These data allowed estimates of nitrogen waste load
to ponds (Eq. 3), but nitrogen waste loads (Table 1) must be considered approximate, because
actual fish production cannot be estimated over a 12-month period in multiple-batch culture
systems.
The daily feed input to multiple-batch culture systems changes during the season
because of periodic, partial harvests. There is not a steady increase in feed input from
beginning to end of the growing season as in single-batch culture. Nevertheless, there is
nearly always a relatively high feed and nitrogen input to ponds in multiple-batch channel
catfish culture. This results in a rather continuous and large input of ammonia nitrogen to the
water from metabolic excretion by fish utilizing the feed and the microbial community
decomposing uneaten feed, feces, and dead plankton (Boyd and Tucker, 2014).
The average waste nitrogen load for the ponds (Table 1) was equal to a combined
TAN concentration of 48.44 mg L-1
or an average daily TAN concentration input of 0.23 mg
L-1
per day. The measured TAN concentrations usually did not consistently increase during
the grow-out period, and they were far below the average maximum concentration possible

45
from feed input. This attests to the effectiveness of the pond ecosystem in lessening ammonia
nitrogen through nitrification, ammonia diffusion to the air, uptake of ammonium by
phytoplankton, and sequestration of ammonia nitrogen in protein of dead organic matter
(Gross et al., 2000; Boyd and Tucker, 2014).
Despite the finding that TAN concentration in ponds of this study was not correlated
with aeration rate, adequate aeration is important in ammonia management. Low dissolved
oxygen concentration inhibits ammonia oxidation by nitrification (Avnimelech et al., 1992)
and increases the toxicity of NH3 to fish (Lloyd, 1961; Thurston et al., 1981).
There obviously was spatial variation in TAN concentration within a pond. However,
time constraints allowed us to take only onewater sample per pond because ponds were large,
distances between farms were 5 to 20 km, and a large number of ponds were sampled on each
date. A study of variation in water quality measurements conducted in 14, un-aerated fish
culture ponds ranging from 0.04 to 10.32 ha in water surface area (Boyd et al., 1994)
revealed that variation in water quality measurements was in the order: analytical technique <
within a pond on a single date < among dates for a single pond < among replicate ponds on a
single date. Although that study did not include TAN concentration, it included soluble
reactive phosphorus (SRP) concentration and pH that like TAN are influenced greatly by
biological activity. Variability decreased from low to high concentration of the measured
variables. Results of the study showed that in a pond with an average pH of 8.5 and an SRP
concentration of 0.10 mg L-1
, one sample per pond usually would provide a concentration
within 5% of the standard error of the mean. This suggests that the single samples gave a
reasonable estimate of pond average TAN concentration. Of course, fish could seek out areas
of lower TAN concentration avoiding exposure to concentrations as great or greater than the
average (Boyd and Tucker, 1998)

46
The abrupt increase in TAN concentration noted in some ponds and illustrated in Fig.
3 apparently was the effect of temporary disruption of one or more of the processes that
removed ammonia nitrogen from the water. The most likely explanation for greater TAN
concentration in ponds at Farm R was that a cattle pasture surrounded the ponds. Boyd (1976)
reported that runoff from cattle pastures increased TAN concentration in ponds. At this farm,
rainfall probably caused sudden inputs of ammonia nitrogen from the watershed. The
findings clearly show that catfish ponds have elevated TAN concentrations, but
concentrations usually are below 5 mg L-1
, and greater concentrations are much less frequent.
Schwartz and Boyd (1994) measured TAN concentrations in surface and bottom
waters of 25 channel catfish ponds in the Alabama Blackland Prairie region during the four
seasons for 2 yr (October 1980 – November 1992). The TAN concentration did not vary
greatly between surface and bottom water, and the 2-yr means (and range) for the 400
samples follow: winter 0.49 (0.03-2.48) mg L-1
; spring 0.99 (0.01-4.08) mg L-1
; summer 1.37
(0.05-4.71) mg L-1
; fall 1.89 (0.09-7.71) mg L-1
. Concentrations tended to increase from
spring to summer, peak in the fall, and diminish in winter. The distribution of TAN
concentration measured in 1990-92 was compared to the distribution of concentration
measured in the present study in Fig. 6. The histogram shows that there was a greater
percentage of samples with < 1 mg L-1
TAN in 1990-92 than in 2013, while the percentage of
samples with > 4 mg L-1
TAN was greater in 2013 than 1990-92. Moreover, the average TAN
concentration was somewhat greater in 2013 than 1990-92 – 1.98 mg L-1
versus 1.18 mg L-1
,
respectively. Annual production of channel catfish in ponds of the survey by Schwartz and
Boyd (1994) did not exceed 6,000 kg ha-1
and feed input did not exceed 12,000 kg ha-1
–
values considerably less than reported for the 2013 study (Table 1). Thus, it is not surprising
that TAN concentration tended to be greater in 2013 than in 1990-92.

47
The pH of waters in the 1990-92 study differed little between surface and bottom
water as also found in the present study (Fig. 4). The pH of 94% of samples of the 1990-92
study of Schwartz and Boyd (1994) was between 7 and 9 when measured between 10:00 and
14:00 hr – only 1% of the 400 samples had pH above 9. The pH range did not differ much
among seasons, and a few pHs> 9 were observed in winter. A study by Silapajarn et al. (2004)
reported pH values for 223 channel catfish ponds in the Alabama Blackland Prairie averaging
8.1 ± 0.6 with 209 of the ponds having pH of 7 – 9.5. However, 9 ponds had pH above 9.5
with the highest being 10.4.
The average daily temperature in Alabama catfish ponds will vary from a low of 6 to
8 ℃ in winter to a high of 30 to 32 ℃ in summer. The daily variation in water temperature –
especially during warm months – may be as much as 3 to 4 ℃. The pH in the ponds will vary
on a daily bases from a low of 7.0 to 7.5 to a high of 8.5 to 9.5. Thus, there is much variation
in the proportion of TAN concentration in NH3-N form at different times of the day and
seasons of the year. For example, on a summer day when TAN concentration is 1 mg L-1
, a
pH change from 8.0 to 9.0 with water temperature at a constant 28 ℃ will raise NH3-N
concentration from 0.066 to 0.412 mg L-1
. If pH remains constant at 8.0, a 1 ℃ increase in
water temperature will increase NH3-N concentration from 0.066 to 0.070 mg L-1
. However,
both temperature and pH usually increase on a summer afternoon. In a pond where
temperature and pH increase from 27 ℃ and 7.5 in the morning to 31 ℃ and 9.0 in the
afternoon, NH3-N concentration will raise from 0.020 to 0.463 mg L-1
.
Nearly all data on the effects of NH3-N concentration on fish are for exposure to a
fixed TAN concentration at more or less constant pH and temperature. The US
Environmental Protection Agency (1999, 2009) developed criteria maximum concentration
(CMC) for ―safe‖ TAN concentration for continuous long-term exposure of coldwater and
warmwater fish (all species combined) based on pH and temperature. The CMC

48
concentrations for warmwater species suggest a somewhat lower NOEL for NH3-N
concentration than reported in studies conducted specifically with channel catfish. This
difference probably is related to channel catfish being less sensitive to elevated NH3-N
concentration than many other warmwater species (Colt and Tchobanoglous, 1978). This
conclusion was confirmed by Hargreaves and Kucuk (2001) who showed that channel catfish
excluded ammonia from their blood more effectively than did hybrid striped bass hybrid
striped bass Moronechrysops♀×M. saxatilis♂,and blue tilapia Oreochromisaureus.
The ―safe‖ or no-observed-effect level (NOEL) of common toxins such as ammonia
to aquatic animals often is considered to be 5% of the 96-hr LC50 (Boyd and Tucker, 1998).
Based on the average 96-hr LC50 of 2.28 mg L-1
, the NOEL of NH3-N for channel catfish is
0.114 mg L-1
. Colt and Tchobanoglous (1978) exposed channel catfish to a range of constant
NH3-N concentrations for 31 days in laboratory systems. Growth averaged 131.9 g in the
control (0.048 mg L-1
NH3-N), 109.1 g at 0.217 mg L-1
NH3-N, and progressively declined to
15.3 g at 0.989 mg L-1
NH3-N. Fish mortality occurred at NH3-N concentrations above 0.989
mg L-1
. The NOEL estimated from the 96-hr LC50 of NH3-N of 0.114 mg L-1
fell between
the control concentrations of 0.048 mg L-1
and next lowest concentration of 0.217 mg L-1
included in the study by Colt and Tchobanoglous (1978).
Hargreaves and Kucuk (2001) demonstrated that long-term afternoon exposure to
0.91 mg L-1
NH3-N did not affect channel catfish survival and growth, while 1.81 mg L-1
NH3-
N lessened growth by 42%. Based on results of the aforementioned laboratory studies, we
selected 1.0 mg L-1
NH3-N as a reasonable NOEL for continuous exposure of ictalurid catfish
under conditions of fluctuating pH and temperature.
The NOEL for TAN concentration was calculated for typical average monthly water
temperature in west-central Alabama and pHs of 8.0, 8.5, 9.0 and 9.5. The NOEL estimates
were plotted by month for each pH (Fig. 7). The NOEL estimates were rather constant during
49
spring and summer, but increased during fall to a maximum in January. The average TAN
concentration was below the estimated NOEL concentration at pH≥ 8.5, about equal to it in
summer at pH 9.0, and equal to or above it at pH 9.5 year around. In the ―average‖ pond,
TAN concentration will be below the NOEL throughout the year if pH does not rise to pH 9.0
in summer.
The percentage of ponds that had TAN concentration above the NOEL for each
month was calculated and presented as a histogram (Fig. 8). No ponds had TAN
concentration greater than the NOEL when pH was < 8.5, but from June to October , 3.2% to
14.5% of ponds exceeded the NOEL each month when pH was 8.5. At a pH of 9.0, TAN
concentrations exceeded the NOEL each month of the year with the percentage of ponds
ranging between 19.4% and 31.5% from June to December. At a pH of 9.5, the NOEL was
exceeded monthly throughout the year – 19.4% of ponds in February to 45.2% of ponds in
March.
Estimates of the NOEL of NH3-N to channel catfish by Hargreaves and Kucuk
(2001)relied on a daily fluctuating NH3-N concentration in which the daily maximum was
always the same. Thus, the researchers cautioned that their estimated NOEL was probably
too lower, because in ponds, conditions for a NH3-N concentration equal to the NOEL –
specifically high temperature, pH, and TAN concentration – would rarely persist for more
than 5 to 10 days.Data in Fig. 3, however, do not support the supposition that high peak NH3-
N concentrations would always be brief. In ponds of the high TAN category, TAN
concentration often were high for several weeks – even longer in duration than the fluctuating
NH3-N exposures of 22 – 43 days conducted by Hargreaves and Kucuk (2001). Moreover,
sustained periods of exceptionally high TAN concentration occurred in the summer when
water temperature and afternoon pH were high. Of course, in some ponds, periods conductive
to sustained high NH3-N concentration were brief. But, the NOEL selected for use in this

50
study of 1.0 mg L-1
NH3-N seems to be a conservative safe level for catfish ponds – it would
be better to overestimate NOEL than to underestimate it for obvious reasons.
The ammonia effect data from Colt and Tchobanoglous (1978) and Hargreaves and
Kucuk (2001) that were the basis for the NOEL of 1.0 mg L-1
NH3-N were obtained in waters
of pH 7.7 and above – similar to pHs in Alabama catfish ponds. However, Sheehan and
Lewis (1986) and Miron et al. (2008) found the toxicity of NH3 to fish increased as pH
declined. At pH 6.0, NH3 was two to fourfold more toxic than at pHs above 8.0. The NOELs
for TAN in Fig. 7 should not be considered reliable for pH < 8.0.
The observation that TAN concentrations in the study ponds were not correlated with
the harvest weight of fish during the 12-month study does not imply that fish growth was not
affected when TAN concentrations exceeded the NOEL. The quantity of fish harvested from
a pond during the study resulted from the number of partial harvests and the amount of
biomass removed by each – both factors are greatly influenced by managerial decision. Much
of the biomass harvested during the study had been produced earlier, and considerable
biomass produced during the study remained for later harvest. Negative impacts of elevated
TAN concentration on fish health, survival, and growth could have gone undetected during
the study.
Once the TAN concentration exceeds the NOEL in a pond, measures such as adding
an acid to lower pH, applying an algicide to lessen phytoplankton photosynthesis and reduce
pH, or exchange water in ponds to flush out ammonia nitrogen could be used in emergency
treatments. However, such treatments are expensive and have possible negative effects in
ponds (acidification and algicide treatment), and may have negative environmental impacts,
or be impossible to implement at particular sites (water exchange). The practice of applying
living bacterial amendments to ponds to lessen TAN concentration is popular in Asia and is

51
now being used by some ictalurid catfish producers in the United States. However, there is no
evidence that this practice is effective (Boyd and Tucker, 2014).
The high TAN concentrations are the result of intensification of production leading to
high feed inputs and more nitrogenous waste. As producers are unlikely to lessen stocking
and feeding rates, the best approach for avoiding high TAN concentration is to apply
practices that lessen TAN concentration and episodes of high pH. These practices include
better feed management to improve FCR and reduce nitrogen input in waste, adequate
aeration to avoid low dissolved oxygen concentration that inhibits nitrification, and to prevent
low total alkalinity and hardness that favor high afternoon pH (Hargreaves and Tucker, 2004;
Boyd and Tucker, 2014).
CONCLUSION
The survey of ponds on six ictalurid catfish farms in Alabama revealed that TAN
concentrations usually are < 5 mg L-1
; but, concentration between 5 and 15 mg L-1
were
observed. The NOEL for NH3-N of 1.0 mg L-1
for channel catfish suggested in this study
would be reached at the typical summer condition of 30 ℃ and pH 8.5 at a TAN
concentration of 4.93 mg L-1
– the critical concentration. Of 806 samples taken during this
study in a total of 31 ponds, there were 89 samples in which the critical (NOEL) TAN
concentration was exceeded.
This study confirms that TAN concentrations high enough to be chronically toxic to
ictalurid catfish occur rather commonly in ictalurid catfish ponds in Alabama. There are no
practical emergency treatments for quickly reducing NH3-N concentrations in these ponds
when the critical TAN concentration has been exceeded. Therefore, the use of good
management practices to avoid excessively high TAN concentrations seems appropriate.

52
Additional research on effects of elevated TAN concentration in ponds for intensive culture
of ictalurid catfish and other species is needed. The studies should focus on the relationship
of TAN concentrations to disease outbreaks, physiological well-being of fish, feed intake,
survival rate, and growth. In the case of ictalurid catfish, toxicity tests should be conducted to
ascertain if channel catfish and hybrid catfish have similar response to elevated NH3-N
concentration.

53
LITERATURE CITED
Avnimelech, Y., Diab, S., KIochva, M., Mokady, S., 1992. Control and utilization of
inorganic nitrogen in intensive fish culture ponds. Aquacult. Res. 23, 421-430.
Bates, R.G., Pinching, G.D. 1949. Acidic dissociation constant of ammonium ion at 0° to
50 °C, and the base strength of ammonia. J. Res. Nat. Bur. Stand. 42, 419-430.
Bower, C.E., Holm-Hansen, T., 1980. A salicylate-hypochlorite method for determining
ammonia in seawater. Can. J. Fish. Aquat. Sci. 37, 794-798.
Boyd, C.E., 1976. Water chemistry and plankton in unfertilized ponds in pastures and in
woods. Trans. Amer. Fish. Soc.105, 634-636.
Boyd, C.E., Tucker, C.S., 1998. Pond Aquaculture Water Quality Management. Kluwer
Academic Publishers, Boston.
Boyd, C.E., Tucker, C.S., 2014. Handbook for Aquaculture Water Quality. Craftmaster
Printers, Auburn, Alabama.
Boyd, C.E., Hernandez, E., Williams, J.C., Romaire, R.P., 1994. Effects of sampling
technique on precision estimates for water quality variables in fish culture ponds. J.
Appl. Aquacult. 4, 1-18.
Boyd, C.E., Tucker, C., McNevin, A., Bostick, K., Clay, J., 2007. Indicators of resource use
efficiency and environmental performance in fish and crustacean aquaculture. Rev.
Fish. Sci. 15, 327-360.
Boyd, C.E., Queiroz, J., Lee, J., Rowan, M., Whitis, G.N., Gross, A. 2000. Environmental
assessment of channel catfish Ictaluruspunctatus farming in Alabama. J. World
Aquacult. Soc. 31, 511-544.
Colt, J., Tchobanoglous, G., 1978. Chronic exposure of channel catfish, Ictaluruspunctatus,
to ammonia: Effects on growth and survival. Aquacult. 15, 353-372.
Emerson, K., Russo, R.C., Lund, R.E., Thurston, R.V., 1975. Aqueous ammonia equilibrium
calculations: effect of pH and temperature. J. Fish. Res. Board Can. 32, 2379-2383.
Gross, A., Boyd, C.E., Wood, C.W., 2000. Nitrogen transformations and balance in channel
catfish ponds. Aquacult. Eng. 24, 1-14.
Hanson, T., Sites, M.D., 2012. 2011 U.S. Catfish Database. Department of Agricultural
Economics, Information Report 2012-01, Mississippi State, Mississippi.
Hargreaves, J.A., Kucuk, S., 2001. Effects of diel un-ionized ammonia fluctuation on
juvenile hybrid striped bass, channel catfish, and blue tilapia. Aquacult. 195, 163-181.

54
Hargreaves, J.A., Tucker, C.S., 2004. Managing ammonia in fish ponds. SRAC Publication
4603, Southern Regional Aquaculture Center, Mississippi State University, Stoneville,
Mississippi.
Le, P.T.T., Boyd, C.E., 2012. Comparison of phenate and salicylate methods for
determination of total ammonia nitrogen in freshwater and saline water. J. World
Aquacult. Soc. 43, 885-889.
Liew, H.J., Sinha, A.K., Nawata, C.M., Blust, R., Wood, C.M., Boeck, G., 2013. Defferential
responses in ammonia excretion, sodium fluxes and gill permeability explain
ddifferent sensitivities to acute high environmental ammonia in three freshwater
teleosts. Aqua. Tox. 126, 63-76.
Lloyd, R., 1961. Effect of dissolved oxygen concentration on the toxicity of several poisons
to rainbow trout (Salmo gairdneri Richardson). J. Exp. Biol. 38, 447-455.
Miron, D.S., Moraes, B., Becker, A.G., Crestani, M., Spanevello, R., Loro, V. L.,
Baldisserotto, B., 2008. Ammonia and pH effects on some metabolic parameters and
gill histology of silver catfish, Rhamdia Quelen (Heptapteridae). Aquacult. 277, 192-
196.
Schwartz, M.F., Boyd, C.E., 1994. Channel catfish pond effluents. Prog. Fish. Cult. 56, 273-
281.
Sheehan, R.J., Lewis, W.M., 1986. Influence of pH and ammonia salts on ammonia toxicity
and water balance in young channel catfish. Trans. Amer. Fish. Soc. 115, 891-899.
Silapajarn, K., Boyd, C.E., Silapajarn, O., 2004. Physical and chemical characteristics of
pond water and bottom soil in channel catfish ponds in west-central Alabama.
Alabama Agricultural Experiment Station, Bulletin, 655, Auburn University, Auburn,
Alabama.
Southern Regional Aquaculture Center, 2007. Verification of recommended management
practices for major aquaculture species. SRAC Final Project Report 6002, Stoneville,
Mississippi.
Thurston, R.V., Russo, R.C., Vinogradov, G.A., 1981. Ammonia toxicity to fishes. Effect of
pH on the toxicity of the un-ionized ammonia species. Environ. Sci. Tech. 15, 837-
840.
Trussell, R.P., 1972. The percent un-ionized ammonia in aqueous ammonia solutions at
different pH levels and temperatures. J. Fish. Res. Board Can. 29, 1505-1507.
USEPA (United States Environmental Protection Agency). 1999. 1999 Update of ambient
water quality criteria for ammonia. EPA-822-R-99-014. United States Environmental
Protection Agency, Washington, D.C.
USEPA (United States Environmental Protection Agency). 2009. 2009 Update aquatic life
ambient water quality criteria for ammonia – freshwater. EPA-822-R-09-001. United
States Environmental Protection Agency, Washington, D.C.

55
Table 1. Average pond size, feed input, production, aerator use, and nitrogen waste load over a
1-yr period for catfish farms of this study.(Means were tested by Tukey’sStudentized Range
(HSD) test; entries indicated by the same letter in a column do not differ at P = 0.05)
Farm Average pond
area (ha)
Average
production (kg/ha)
Average feed input
(kg/ha)
Average aerator
use (kw/ha)
N waste load
(mg/L)
W 2.53 9560 ± 4630 a 19680 ± 1890 a 7 52 ±10.8 a
A 2.83 8010 ±2641.0 a 15580 ±4540 a 6 40 ± 12.2 a
D 3.89 12340 ± 5124. a 2174 ±1980 a 17 55 ±12.7 a
R 2.53 11250± 3490 a 21390 ± 3960 a 10 55 ±11.6 a
K 4.17 13650 ± 5900.6 a 18070 ± 5690 a 5 40 ±15.7 a
U

56
Figure 1. Boxplots of total ammonia nitrogen (TAN) concentrations in ponds for six catfish
farms in west Alabama (Entries indicated by the same letter shows the means do not differ at
P = 0.05).

57
Figure 2. Summary of frequency distributions and cumulative percentiles of total ammonia
nitrogen (TAN) concentrations for the period May 2013 to May 2014 in 31 catfish ponds
located in west Alabama.

58
Figure 3. Fluctuations in total ammonia nitrogen (TAN) concentrations betweenMay 2013
and May 2014 in three ponds each with high, medium, and low TAN concentrations.

59
Figure 4. Fluctuation in pH over a 24-hr period in surface water (T) and bottom water (B) of
ponds with dense, medium and light plankton blooms.

60
Figure 5. Temperature fluctuation patterns over a 24-hr period in surface water (T) and
bottom water (B) of ponds with dense, medium and light plankton blooms.
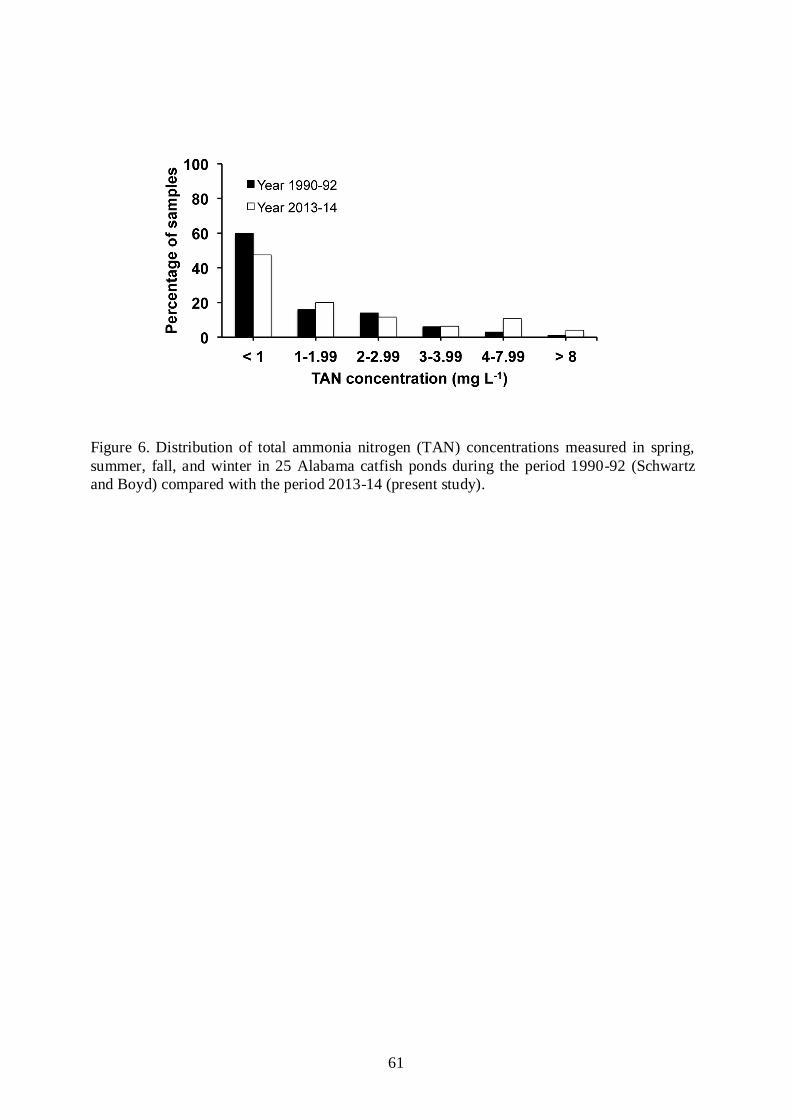
61
Figure 6. Distribution of total ammonia nitrogen (TAN) concentrations measured in spring,
summer, fall, and winter in 25 Alabama catfish ponds during the period 1990-92 (Schwartz
and Boyd) compared with the period 2013-14 (present study).

62
Figure 7. The estimated no observed effect level (NOEL) for total ammonia nitrogen (TAN)
concentration to ictalurid catfish. The NOELs were estimated for average monthly water
temperatures at different pHs.

63
Figure 8. Cumulative percentage of ponds having total ammonia nitrogen (TAN)
concentration above the no observed effect level (NOEL) for each month at three pH levels.

64
V. TOTAL AMMONIA NITROGEN REMOVAL FROM AQUEOUS SOLUTIONS BY
THENATURAL ZEOLITE, MORDENITE: A LABORATORY TEST AND EXPERIMENT
STUDY
ABSTRACT
The effectiveness of two processed samples of New Zealand mordenite for possible
use in removing total ammonia nitrogen (TAN) in aquaculture application was studied. The
percentage reduction in TAN concentration in 100-mL solutions held on a rotating shaker
increased linearly with greater mordenite application rate, while the amount of TAN removed
per gram of mordenite (adsorptive efficiency) declined. At a TAN concentration of 200 mg
L-1
, both mordenite samples had an adsorption efficiency of about 8.7 mg TAN g-1
. Ammonia
removal and adsorptive efficiency decreased with increasing salinity up to 30 g L-1
. In
aquarium tests with less vigorous mixing, mordenite at concentrations equivalent to 10 to 500
kg ha-1
in ponds removed only 1 to 8% of TAN from water. Mordenite and other zeolites are
not useful for removing TAN from ponds. The New Zealand mordenite was of good quality
and like other zeolites could be used for other applications in aquaculture such as small,
intensively-stocked transport and holding units for aquatic animals, water recirculating
culture systems, and possibly as a feed additive.

65
INTRODUCTION
Zeolites are naturally occurring, synthetic minerals with a three-dimensional
framework formed by silica-oxygen tetrahedrals in which some of the Si4+
has been replaced
by Al3+
in the porous latticework resulting in a negative charge that imparts cation exchange
properties to zeolite (Mumpton and Fishman, 1977).Zeolite filters are used for softening
water for household use; sodium on zeolite is exchanged for calcium and magnesium in water.
Zeolites are used in industry for cation exchange, molecular sieving, catalysis, and sorption
processes (Jorgensen et al., 1976; Yusof et al. 2010). Zeolite also has been used to remove
ammonia nitrogen from wastewater (Reeves, 1972; Yusof et al., 2010).
Mordenite, the zeolite studied here, is a common alteration product of pyroclastic
sediment, sedimentary rock, and lava flows of worldwide distribution. It is an orthorhombic
zeolite of high silica content (Deer et al., 2004). The ideal composition of mordenite is
[(Na2K2Ca)4Al8Si40O96]28H2O. Mordenite contains 0.45% potassium, 2.29% calcium, and
2.89% sodium, while clinoptilolite, the zeolite commonly used in research on zeolite
applications, is 3.21% potassium, 1.25% calcium, and 1.79% sodium (Passaglia, 1975;
Simoncic and Armbruster, 2004).
Mordenite often is modified during processing to tailor its pore size and shape to meet
the criteria for specific applications (Corma et al., 1994; Lin et al., 2013). It has been widely
used as a catalyst in industrial processes such as hydrocracking, hydroisomerization,
alkylation and reforming (Bajpai, 1986; Shaikh et al., 1993), and for adsorptive separation for
gas or liquid mixtures (Shao, 2002). Mordenite also is used as a host matrix in
semiconductors, chemical sensors and selective membrane (Gilbert and Mosset, 1998).
The main interest in zeolites in aquaculture relates to control of total ammonia
nitrogen (TAN) concentration. Ammonia is toxic to fish, shrimp, and other aquatic animals,

66
and zeolite is used to lessen TAN concentrations in aquaria, fish holding tanks, water
recirculating aquaculture systems, and containers of water for transporting aquatic animals
(Bower and Turner, 1982; Boyd and Tucker, 1998; Johnson and Sieburth, 1974). Ammonia
removal by zeolite is possible, because ammoniacal nitrogen exists as ammonium (NH4+) and
ammonia (NH3) in a pH and temperature equilibrium as follows:
NH3 + H2O = NH4+ + OH
- (1)
The proportion of ammonium decreases with increasing pH, but even at pH 9.0, ammonium
comprises about 70% of the ammoniacal nitrogen in water (Trussell, 1972). Removal of
ammonium by zeolite will lower the TAN concentration and thereby lessen the concentration
of ammonia at equilibrium.
Shrimp farmers in Thailand and other Asian countries often apply zeolite to ponds at
180 to 350 kg ha-1
in attempts to lower the concentration of ammonia to which culture
animals are exposed, but there are no research findings to support this practice (Tonguthai,
2000). Moreover, zeolite products sold in Thailand (and presumably in other Southeast
Asian countries) usually have a cation exchange capacity (CEC) less than 50 meq 100 g-1
and
do not absorb appreciable ammonium (Silapajarn et al., 2006). Chiayvareesajja and Boyd
(1993) suggested that zeolite was not effective in removing TAN from pond waters –
especially those filled with brackishwater and ocean water – because of competition for
cation exchange sites on zeolite by other cations in water.
According to Yusof et al. (2010), there have been many studies of natural zeolites –
particularly clinoptilolite – for removing ammonium from wastewater. The results of these
studies do not provide much useful information related to use of zeolites in aquaculture,
because TAN concentrations in wastewater are much greater than in waters of aquaculture

67
systems. A laboratory study was undertaken to ascertain if New Zealand mordenite has
potential to lower TAN concentrations in waters of aquaculture systems.
MATERIALS AND METHODS
Two samples of mordenite were supplied by Blue Pacific Minerals, Tokora, New
Zealand. Bulk density of the samples was determined by weighing 100-cm3 of each. Cation
exchange capacity was obtained by the magnesium chloride technique (Rhoades, 1982) and
by the neutral ammonium acetate method (Jackson, 1958; Kitsopoulos, 1999). Particle size
was determined by passing known quantities of the two products through nested sieves of the
following aperture sizes: 850, 425, 250, 150, 106, 75, 53, and 43 m and weighing the
amount of particles retained on each sieve. The pH was determined by glass electrode in 1:2
mixtures of mordenite:distilled water (Thunjai et al., 2001). Color was assessed with a
Munsell color chart (Kollnorgen Instruments Corporation, New Windsor, New York).
Ammonium adsorption by the two mordenite samples was assessed under different
conditions by adding weighted quantities to triplicate, 100-mL solutions containing known
TAN concentrations. The following trials were conducted: (1) 1.00-g mordenite and TAN
concentrations ranging from 0 to 200 mg L-1
and prepared in distilled water; (2) mordenite
amounts ranging from 0 to 100.0 g L-1
in TAN concentration of 1 mg L-1
prepared in distilled
water; (3) 1.00-g mordenite and TAN concentration of 1.00 mg L-1
in selected salinities
between 0 and 30 g L-1
; (4) 1.00-g mordenite in TAN concentration of 5.00 mg L-1
in
solutions also containing either sodium, potassium, calcium, or magnesium at selected
concentrations between 0 and 50 meq L-1
.
In the trials, TAN concentrations were obtained from ammonium chloride (NH4Cl).
The different salinities were prepared by adding appropriate amounts of Instant Ocean
to

68
distilled water. The different concentrations of major cations were made in distilled water
using sodium chloride (NaCl), potassium chloride (KCl), magnesium sulfate (MgSO45H2O),
and calcium nitrate [Ca(NO3)2]. The trials were conducted in a room where temperature
varied from 22 to 26 oC. The flasks were agitated for 24 h on a mechanical shaker at 150
oscillations min-1
.The pH of solutions was measured with a glass electrode before shaking.
After shaking, solutions were filtered (Whatman Number 42 paper) to remove mordenite
particles and TAN concentrations in filtrates were measured by the salicylate technique
(Bower and Holm-Hansen, 1980; Le and Boyd, 2012).
The capacity of mordenite to lower TAN concentration also was tested in 20-L
aquaria filled with freshwater (0.1 g L-1
salinity) and containing 3.0 mg L-1
TAN from
ammonium chloride. Mordenite was applied to each of four aquaria at 0, 1, 5, 20, and 50 mg
L-1
; equivalent to approximately 10, 50, 200, and 500 kg ha-1
in a 1-ha pond of 1 m average
depth. Aeration was applied continuously via an air stone (5 cm long 1.5 cm diameter) to
gently mix the water in two aquaria at each mordenite concentration, but the other two
aquaria were not aerated. Water samples were removed from each aquarium after 24 h for
measurement of pH and TAN concentration.
RESULTS
The two mordenite samples were yellowish in color, acidic, and of low bulk density
(Table 1). Sample 1 was of much finer particle size than sample 2 (Fig. 1). Nearly 60% of
particles in sample 1 passed a sieve with 250 m apertures while only about 0.5% of particles
in sample 2 were that small. The CEC values ranged from 93.3 to 119.8 meq 100 g-1
. The
CEC was around 6% greater for sample 1 than for sample 2 by both CEC methods. However,
the CEC measured by the ammonium acetate method was approximately 20 meq 100 g-1

69
greater than the CEC determined by the magnesium chloride procedure for both samples.
The ammonium acetate technique has been reported to give high results for acidic soil
samples (Ross and Ketterings, 1995). Nevertheless, Kitsopoulos (1999) recommended using
the ammonium acetate method for determining the CEC of mordenite. The manufacturer’s
website states that the New Zealand zeolites have a CEC typically greater than 100 meq 100
g-1
– this agrees fairly well with the CECs measured here.
Some studies have reported higher CECs for mordenite samples. For example, 80
mordenite samples from Santorini and Polyegos Islands of Greece (Kitsopoulos, 1999) had
an average CEC of 130 meq 100 g-1
(range = 1.70 to 200.4 meq 100 g-1
). Wang (2009)
reported that mordenite had a CEC of 187 meq 100 g-1
, and a value of 164 meq 100 g-1
was
given by Sprynskyy et al. (2005). However, samples mentioned above had been pulverized
to pass a sieve with 125 m apertures. Particles of sample 1 that passed a screen with 250
m apertures and particles that passed a screen with 53 m apertures were analyzed for CEC;
the results were 136 meq 100 g-1
and 208 meq 100 g-1
. Thus, the lower CEC in the
commercial products from New Zealand than in mordenite samples studied in previous
research probably was related to particle size rather than to a natural property of the New
Zealand mordenite.
The main reason for this investigation relates to zeolite use in aquaculture; therefore,
the properties of the two mordenite samples were compared with properties of 25 different
zeolite products purchased in shrimp farming supply stores in Thailand (Silapajarn et al.,
2006). Only four of those samples were yellowish in color – the others were various shades
of white and gray. The density of the samples from Thailand averaged 1.01 g cm-3
(range –
0.57 to 1.40 g cm-3
), and the average pH was 6.98 (range = 4.11 to 12.03). Most of the
zeolite samples from Thailand were finely pulverized – more than 50% of all but two samples
passed a screen with 250 m apertures. The CEC of the samples from Thailand tended to be

70
quite low; the average was 34.4 meq 100 g-1
(range = 2.7 to 147.8 meq 100 g-1
). Only four of
25 samples had CECs above 80 meq 100 g-1
. The two mordenite samples of the present
investigation had a greater CEC than all but two of the Thailand samples.
The percentage reduction in TAN concentration from solution and the quantity of
TAN removed per gram of mordenite are presented in Fig. 2. In the 100-mL solutions with
1.00 g of mordenite, as the concentration of TAN in the water increased from 1 mg L-1
to 200
mg L-1
, the removal percentage bymordenite decreased quickly, while the amount of TAN
removed per gram increased drastically.
When TAN concentration was 200 mg L-1
, the adsorptive efficiency for these two
mordenite samples was roughly 8.70 mg TAN g-1
zeolite, while TAN removal percentage
was about 43% for both mordenite samples. This result agrees well with those obtained by
Marking and Bills (1982) and Chiayvareesajja and Boyd (1993) for clinoptilolite – maximum
uptake in both studies was about 9 mg TAN g-1
clinoptilolite.
At TAN concentrations less than 10mg L-1
, the two mordenite samples removedabout
90% of TAN,but adsorptive efficiency was quite low (less than 1 mg TAN g-
1mordenite).Pairwise t-test showed that there was no difference between the two samples in
ammonium adsorptive capacity at different TAN concentrations (t = 0.974; P > 0.05).
Experimental data werefitted to the Freundlich model and Langmuir model to
describe the equilibrium uptake behavior of ammonium ion on to mordenite(Barrow, 1966).
Efficiency of TAN uptakeby mordenite(absorbent)increased with greater TAN (absorbate)
concentration in the liquid phase (Fig. 3). The Langmuir model provided a better fit for the
experimental data from sample 1 than did the Freundich model. While for sample 2, the
Freundlich model agreed more closely with the experimental data than did the Langmuir
model at lower solution concentration (<40mg/L), while at higher concentration, neither
model provided a good fit.

71
Ammonium removal capacity was a function of the amount of mordenite placed in
solutions (Fig. 4).As mordenite concentration in water of 1 mg L-1
TANincreased, the removal
percentage of TANincreased linearly, while the efficiency of mordenite decreased. When the
mordeniteconcentration was 100.0mg L-1,
percentage removal of TAN reached 57% for both
samples, but the adsorptive efficiency for these two samples was roughly 2.8 mg TAN g-1
of
mordenite. The highest adsorption efficiency was attained at a mordenite concentration of
2mg L-1
; however, theTAN removal percentage was only 15%. Greater absorptive efficiency
could be obtained by either applying a small amount of mordenite or by increasing TAN
concentration in solution. Bower and Turner (1982) reported that clinoptilolite had an
equilibrium exchange capacity for ammonium of 1.2 to 2.25 meq g-1
. For Modenite used in
this study, the ammonium equilibrium capacity ranged from 0.3 to 3.7 meq g-1
. Thus, under
the best conditions for ammonium exchange, mordenite appears to be superior to
clinoptilolite.
The removal percentage of TAN decreased exponentially (sample 1, R2=
0.952;sample 2, R2=0.957; P < 0.05) as salinity of the solution increased(Fig. 5).Considering
both samples, when salinity was less than 0.6 g L-1
, 90% of TAN could be removed by
mordenite; at salinity of 8.4 g L-1
, roughly 50% of the TAN in water was removed, but at 30
g L-1
salinity the removal rate was about 23%. The decrease in TAN removal as salinity
increasedresulted fromgreater concentrations of cations at higher salinities that competed for
the adsorption sites on the mordenite. The rate of decrease in the percentage TAN removal
declined slightly with increasing salinity. Pairwise t-test showed that there was no difference
(t = 0.134; P > 0.05) between ammonia adsorptive capacity of the two samples at different
salinities. Johnson and Sieburth (1974) also reported that clinoptilolite was much more
effective for removing TAN in fresh water than in salt water, and the efficiency rate
decreased slowly as water salinity increased.

72
The influence of competing cations (potassium, sodium, calcium, and magnesium) on
the capacity of mordenite to remove TAN is presented in Fig. 6.At low cationic concentration
(0.5 meq L-1
to 2 meqL-1
), the presence of potassium, sodium, calcium and magnesium ions
caused little inhibition of TAN adsorption. Moreover, as the ionic concentration
increased,magnesium and calcium had little effect on TAN adsorption with roughly 90%
of TAN being removed at 50 meq L-1. The influence of sodium and potassium –
especially potassium – on TAN uptake by mordenite was greater, and the presence of 50
meq L-1 potassium with 1 mg L-1 TAN caused a significant decrease in TAN adsorption
(less than 10% ammonia removal). The order of cation preference by mordenite was K+>
Na+> Ca2+> Mg2+; this is the same order of preference noted for clinoptilolite(Ames,
1960).
The average concentrations of major cations in seawater are as follows: potassium,
380 mg L-1
(9.71 meq L-1
); calcium, 400 mg L-1
(19.96 meq L-1
); magnesium, 1,350 mg L-1
(111.02 meq L-1
); sodium, 10,500 mg L-1
(456.52 meq L-1
). Neither calcium nor magnesium
at concentrations up to 50 meq L-1
caused a great decrease in TAN removal by mordenite.
Moreover, at a potassium concentration equal to that of normal seawater, there was only a 50%
reduction in TAN adsorption. The large reduction in TAN adsorption with increasing salinity
(Fig. 5) apparently was caused mainly by sodium that is present in seawater at much higher
concentration than the other three cations. Even at 5 ppt salinity, seawater should contain
about 65.2 meq L-1
of sodium.
In the 20-L aquaria, applications of 1 mg L-1
to 50 mg L-1
mordenite wereequivalent to
application rates of 10 kg ha-1
to 500 kg ha-1
in a 1-ha pond of 1 m in depth. The TAN
concentrations initially of 3 mg L-1
decreased by only 1 to 8% (Fig. 7) regardless of whether
or not aeration was used to mix the water (t = 0.600; P > 0.05). Reduction would have been
even less in saline water. Although zeolite is capable of reducing TAN concentration in

73
water of laboratory tests, it probably would not be effective for this purpose in aquaculture
ponds.
DISCUSSION
Previous research on zeolite applications in aquaculture revealed that a zeolite filter
can be an effective backup system to biological filters for TAN removal during culture of
marine or brackishwater species in water recirculating systems. In addition to use in event of
failure of the biological filter, the zeolite filter could be used when diseased fish are treated
with antibiotics to avoid harm to the biological filter (Johnson and Sieburth, 1974). It has
been suggested that zeolite filters could function as the primary method of TAN removal in
freshwater recirculating aquaculture systems (Johnson and Sieburth, 1974; Dryden and
Weatherley, 1987), but their use in recirculating aquaculture systems is limited mainly to
backups or supplements to biological filters for TAN removal (Yanong, 2012). However,
Gendel and Lahav (2013) developed a technique for removing TAN from water of
recirculating aquaculture systems using a zeolite filter that is regenerated by chemical
desorption and indirect electrochemical ammonia oxidation. This method of TAN removal
possibly could be used instead of a biological filter.
Zeolite can remove TAN from water and thereby prevent fish toxicity. But, the
treatment rates necessary to do so were reported as 10 kg m-3
(Emadi et al., 2001), 12 kg m-3
(Farhangi and Rostami-Charate, 2012), and 15 kg m-3
(Asgharimoghadam et al., 2012).
Zeolite treatment also caused large reductions in TAN concentrations in sediment pore water,
but treatment rates of 10% of sediment volume were necessary (Besser et al., 1998). Zeolite
application to polluted water at a treatment rate of 4 kg m-3
prevented cadmium toxicity to
tilapia presumably by removing cadmium by cation exchange (James and Sampath, 1999).

74
Zeolite filters have been promoted for removal of TAN from aquaculture wastewater
production units (Bergero et al., 1994). This application was considered feasible where TAN
concentration exceeded 0.35 mg L-1
, and water discharge rate was less than 0.60 m3 m
-1 per
tonne of fish production (Bergero et al., 2001). There is considerable interest in zeolite for
removal of TAN from wastewater, e.g., Huang et al. (2010) and Guo et al. (2013), and such
reports often mention aquaculture as a possible application.
Zeolite has been added to fish feeds in amounts of 5 to 10%, but there was no
reduction in effluent TAN concentration from the culture units in which this feed was used
(Edsall and Smith, 1989). There is evidence, however, that inclusion of zeolite in
aquaculture feeds can improve nutrient utilization and growth in fish (Khodanazary et al,
2013; Obradović et al., 2006).
At present, the major use of zeolite in aquaculture is for the purpose of reducing TAN
concentrations in shrimp ponds in Asia (Arthur et al., 2000). Zeolite is broadcast over pond
surfaces at rates of 180 to 350 kg ha-1
(Tonguthai, 2000). These rates equal about 18 to 35
mg L-1
in 1.0-m average depth ponds – much less than application rates found necessary to
lessen TAN concentrations in sediment pore water (Besser et al., 1998) and to avoid
ammonia toxicity to fish (Emadi et al., 2001; Farhangi and Rostami-Charate, 2012);
Asgharimoghadam et al., 2012). Moreover, Chiayvareesajja and Boyd (1993) and Briggs and
Funge-Smith (1996) reported that zeolite applications to aquaculture ponds did not result in
lower TAN concentrations. Based on previous findings and aquarium tests of the present
study, it may be concluded that zeolite is not effective in lessening TAN concentrations in
pond aquaculture at application rates typically used. Application rates necessary to be
effective possibly would be as great as 100,000 kg ha-1
based on data for TAN removal in
laboratory trials by Emadi et al. (2001).

75
Previous research confirms that zeolite filters can effectively remove ammonia
nitrogen from water – especially when the TAN concentration is elevated and the flow rate is
moderate. More research is needed on the use of zeolite for removing TAN from water in
recirculating aquaculture systems and in reducing TAN concentrations in aquaculture
effluents. There also should be further investigation of the benefits of zeolite on growth and
nutrient utilization when it is included in aquaculture feed.
Most of the earlier work on zeolite in aquaculture focused on clinoptilolite, but
mordenite is equal to clinoptilolite in CEC and ability to remove TAN from water. The
mordenite of the present study was of high quality – much better in quality than all but two of
25 zeolite samples from Thailand that were analyzed by Silapajarn et al. (2006). Although
we do not recommend mordenite, or any other zeolite, for application to shrimp or other
aquaculture ponds for TAN control, mordenite is a good product for TAN removal from
water in aquaria, intensively-stocked holding and transport containers, water recirculating
aquaculture systems, TAN removal from small volumes of aquaculture effluent, and in
research on use of zeolite as a feed additive.

76
LITERATURE CITED
Ames, L.L. Jr.,1960. The cation sieve properties of clinoptilolite. Am. Min. 45, 689-700.
Arthur, J.R., Lavilla-Pitago, C.R., Subasinghe, R.P., 2000. Use of chemicals in Asian
aquaculture. Asian Fisheries Development Center, Tigbauan, Ilorilo, Philippines.
Asgharimoghadam, A., Gharedaashi, E., Montajami, S., Nekoubin, H., Salamroudi, M.,
Jafariyan, H., 2012. Effect of clinoptilolite zeolite to prevent mortality of beluga
(Huso huso) by total ammonia concentration. Glob. Vet. 9, 80-84.
Bajpai, P.K., 1986. Synthesis of mordenite type zeolite. Zeolites 6, 2-8.
Barrow, G.M., 1966. Physical Chemistry, second ed. McGraw-Hill, New York.
Bergero, D., Boccignone, M., Natale, F. D., Forneris, G., Palmegiano, G.B., Roagna, L.,
Sicuro, B., 1994. Ammonia removal capacity of European natural zeolite tuffs:
application to aquaculture wastewater. Aquacult. Res. 25, 813-821.
Bergero, D., Forneris, G., Palmegiano, G.B., Zoccarato, I., Gasco, L., Sicuro, 2001. A
description of ammonium content of output water from trout farms in relation to stock
density and flow rates. Ecol. Eng. 17, 451-455.
Besser, J.M, Ingersoll, C.G., Leonard, E.N., Mount, D.R., 1998. Effect of zeolite on toxicity
of ammonia in freshwater sediments: implications for toxicity identification
evaluation procedures. Env. Tox. Chem. 17, 2310-2317.
Bower, C.E., Holm-Hansen, T., 1980. A salicylate-hypochlorite method for determining
ammonia in seawater. Can. J. Fish. Aquatic Sci. 37, 794-798.
Bower, C.E., Turner, D.T., 1982. Ammonia removal by clinoptilolite in the transport of
ornamental freshwater fishes. Prog. Fish-Cult. 44, 19-23.
Boyd, C.E., Tucker, C.S., 1998. Pond Aquaculture Water Quality Management.Kluwer
Academic Publishers, Boston.
Briggs, M.R.P., Funge-Smith, S.J., 1996. The effects of zeolite and other alumino-silicate
clays on water quality at various salinities. Aquacult. Res. 27, 301-311.
Chiayvareesajja, S., Boyd, C.E., 1993. Effects of zeolite, formalin, bacterial augmentation,
and aeration on total ammonia nitrogen concentrations. Aquacult. 116, 33-45.
Corma, A., Miguel, P.J., Orchilles, A.V., Koermer, G., 1994. Zeolite effects on the cracking
of long chain alkyl aromatics. J. Catalysis 145, 181-186.
Deer, A., Howie, R., Wise, W.S., Zussman, J., 2004. Rock Forming Minerals, Vol. 4B,
Framework Silicates: Silica Minerals, Feldspathoids and the Zeolites. The Geological
Society, London.
77
Dryden, H.T., Weatherly, L.R., 1987. Aquaculture water treatment by ion-exchange: I.
Capacity of Hector clinoptilolite at 0.01-0.05 N. Aquacult. Eng. 6, 39-50.
Edsall, D.A. Smith, C.E., 1989. Effects of dietary clinoptilolite on levels of effleunt ammonia
from hatchery Coho salmon. Prog. Fish-Cult. 51, 98-100.
Emadi, H., Nezhad, J.E., Pourbagher, H., 2001. In vitro comparison of zeolite (clinoptilolite)
and activated carbon as ammonia absorbants in fish culture. ICLARM Quarterly 24(1
& 2), 18-20.
Farhangi, J., Rostami-Charate, F., 2012. Increasing of survival rate to Acipensar persicus by
added clinoptilolite in acute toxicity test of ammonia. Aquacult., Aquar. Cons., Leg. 5,
18-22.
Gendel, Y., Lahav, D., 2013. A novel approach for ammonia removal from fresh-water
recirculated aquaculture systems, comprising ion exchange and electrochemical
regeneration. Aquacult. Eng. 52, 27-38.
Gilbert, J.E., Mosset, A., 1998. Large crystals of mordenite and MFI xeolites. Mat. Res. Bull.
33, 997-1003.
Guo, X., Zang, L. Jin, X., 2013. Advanced regeneration and fixed-bed study of ammonium
and potassium removal from anaerobic digested wastewater by natural zeolite. J. Env.
Sci. 25, 954-961.
Huang, H., Xiao, X., Yan, B., Yang, L., 2010. Ammonium removal from aqueous solutions
by using natural Chinese (chande) zeolite as absorbent. J. Haz. Mat. 175, 247-252.
Jackson, M.L., 1958. Soil Chemical Analysis. Prentice-Hall, Englewood Cliffs.
James, R., Sampath, K., 1999. Effect of zeolite on the reduction of cadmium toxicity in water
and a freshwater fish, Oreochromismossambicus. Bull. Env. Con. Tox. 62, 222-229.
Johnson, P.W., Sieburth, J.M., 1974. Ammonia removal by selective ion exchange, a backup
system for microbiological filters in closed-system aquaculture. Aquacult. 4, 61-68.
Jorgensen, S.E., Libor, O., Lea Graber, K., Barkacs, K., 1976. Ammonia removal by use of
clinoptilolite. Water Res. 10, 213-224.
Khodanazary, A., Boldaji, F., Tatar, A., Dastar, B., 2013. Effects of dietary zeolite and perlite
supplementation on growth and nutrient utilization performance, and some serum
variables in common carp, (Cyprinus carpio). Turkish J. Fish. Aq. Sci. 13, 495-501.
Kitsopoulos, K.P., 1999. Cation-exchange capacity (CEC) of zeolitic volcaniclastic materials:
applicability of the ammonium acetate saturation (AMAS) method. Clays and Clay
Min. 47, 688-696.
Le, P.T.T., Boyd, C.E., 2012. Comparison of phenate and salicylate methods for
determination of total ammonia nitrogen in freshwater and saline water. J. World
Aquacult. Soc. 43, 885-889.

78
Lin, J.S., Wang, J.J., Wang, J., Wang, I., Balasamy, R.J., Aitani, A., Al-Khattaf, S., Tsai,
T.C., 2013. Catalysis of alkaline-modified mordenite for benzene alkylation of
diolefin-containing dodecene for linear alkylbenzene synthesis. J. Catalysis 300, 81-
90.
Marking, L.L., Bills, T.D., 1982. Factors affecting the efficiency of clinoptilolite for
removing ammonia form water. Prog. Fish-Cult. 44, 187-189.
Mumpton, F.A., Fishman, P.H., 1977. The application of natural zeolites in animal science. J.
Anim. Sci. 45, 1188-1203.
Obradović, S., Adamović, M., Vukašinović, M., Jovanović, R., Levic, J., 2006. The
application effects of natural zeolite in feed and water on production results of
Oncorhynchus mykiss (Walbaum). Rom. Biotec. Let. 11, 300-3013.
Passaglia, E., 1975. The crystal chemistry of mordenites. Contr. Min. Pet. 50, 65-77.
Reeves, T.G., 1972. Nitrogen removal: a literature review. J. Water Poll. Con. Fed., 1895-
1908.
Rhoades, J., 1982. Cation exchange capacity, in: Page, A. L. (Ed.), Methods of Soil Analysis.
Part 2. Chemical and Microbiological Properties. American Society of Agronomy,
Madison, pp. 149-157.
Ross, D.S., Ketterings, Q., 1995. Recommended methods for determining soil cation
exchange capacity. College of Agriculture, University of Delaware, Newark, DE.
Shaikh, A.A., Joshi, P.N., Jacob, N.E., Shiralkar, V.P., 1993. Direct hydrothermal
crystallization of high-silica large-port mordenite. Zeolites 13, 511-517.
Shao, C., Kim, H.Y., Li, X., Park, S.J., Lee, D.R., 2002. Synthesis of high-silica-content
mordenite with different SiO2/Al2O3 ratios by using benzene-1,2-diol as additives.
Mat. Let. 56, 24-29.
Silapajarn, O., Silapajarn, K., Boyd, C.E., 2006. Evaluation of zeolite products used for
aquaculture in Thailand.J. World Aquacult. Soc. 37, 136-138.
Simoncic, P., Armbruster, T., 2004. Peculiarity and defect structure of the natural and
synthetic zeolite mordenite: a single-crystal X-ray study. Amer. Min. 89, 421-431.
Sprynskyy, M., Lebedynets, M., Zbytniewski, R., Namiesnik, J., Buszewski, B., 2005.
Ammonium removal from aqueous solution by natural zeolite, Transcarpathian
mordenite, kinetics, equilibrium and column tests. Sep. Pur. Tech. 46, 155-160.
Thunjai, T., Boyd, C.E., Dube, K., 2001. Pond soil pH measurement. J. World Aquacult. Soc.
32, 141-152.

79
Tonguthai, K., 2000. The use of chemicals in aquaculture in Thailand, in: Arthur, J.R.,
Lavilla-Pitogo, C.R., Subasinghe, R.P. (Eds.), Use of Chemicals in Asian Aquaculture.
Southeast Asian Fisheries Development Center, Tigbauan, Iloilo, Philippines.
Trussell, R.P., 1972. The Percent un-ionized ammonia in aqueous ammonia solutions at
different pH levels and temperatures. J. Fish. Bd.Can. 29, 1505-1507.
Wang, X.S., 2009. Equilibrium and kinetic analysis for Cu2+
and Ni2+
adsorption onto Na-
mordenite. The Open Envir. Poll.Tox.. J. 1, 107-111.
Yanong, R.P.E., 2012. Biosecurity in aquaculture, part 2: recirculating aquaculture systems.
SRAC Pub. 4708, Southern Regional Aquaculture Center, Mississippi State
University, Starkville, MS.
Yusof, A.M., Keat, L.K., Ibrahim, Z., Majid, Z.A., Nizam, N.A., 2010. Kinetic and
equilibrium studies of the removal of ammonium ions from aqueous solution by rice
husk ash-synthesized zeolite Y and powdered and granulated forms of mordenite. J.
Haz. Mat. 174, 380-385.
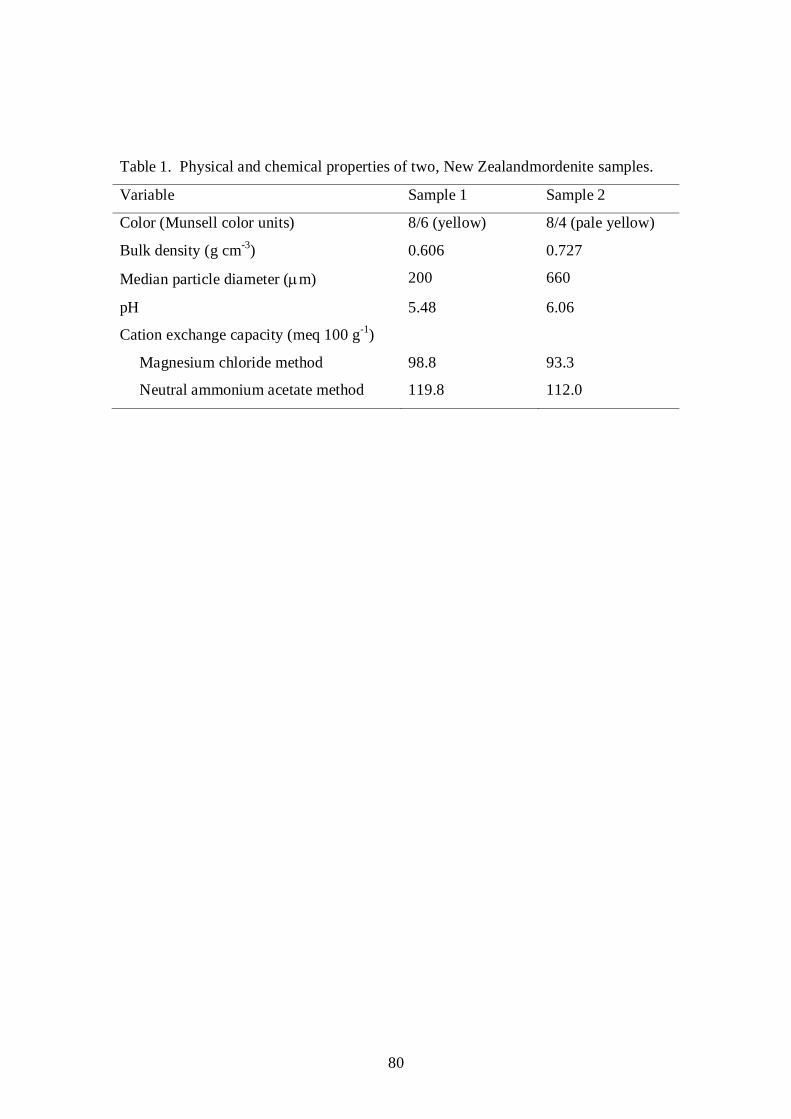
80
Table 1. Physical and chemical properties of two, New Zealandmordenite samples.
Variable Sample 1 Sample 2
Color (Munsell color units) 8/6 (yellow) 8/4 (pale yellow)
Bulk density (g cm-3
) 0.606 0.727
Median particle diameter (m) 200 660
pH 5.48 6.06
Cation exchange capacity (meq 100 g-1
)
Magnesium chloride method 98.8 93.3
Neutral ammonium acetate method 119.8 112.0
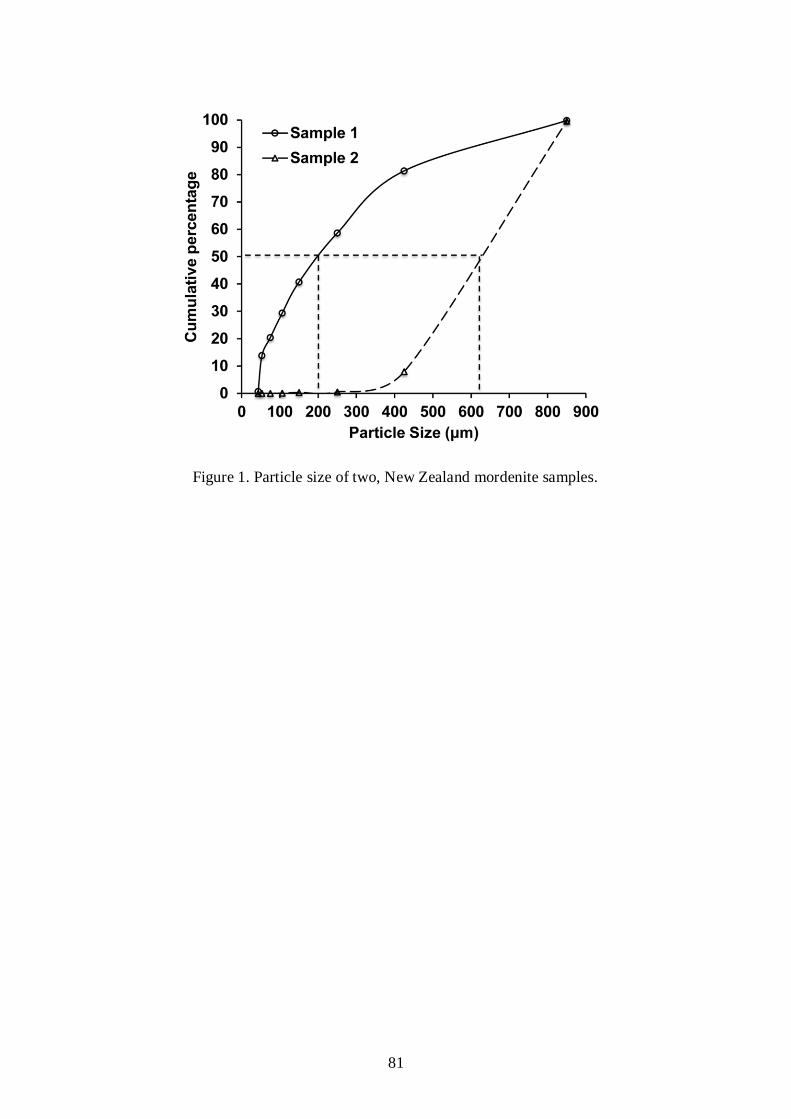
81
Figure 1. Particle size of two, New Zealand mordenite samples.

82
Figure 2. Effect of total ammonia nitrogen(TAN) concentration on adsorptive and percentage
removal of TAN of two mordenite samples applied at 1 g 100 mL-1
.

83
Fig. 3. Equilibrium isotherm data for ammonium uptake ontomordenite fitted to the
Langmuir and the Freundlich uptake models with two mordenite samples applied at 1 g 100
mL-1
.

84
Figure 4. Effect of application rate of two mordenite samples on adsorptive efficiency and
percentage removal of total ammonia nitrogen (TAN) from solution containing 1 mg L-1
TAN.
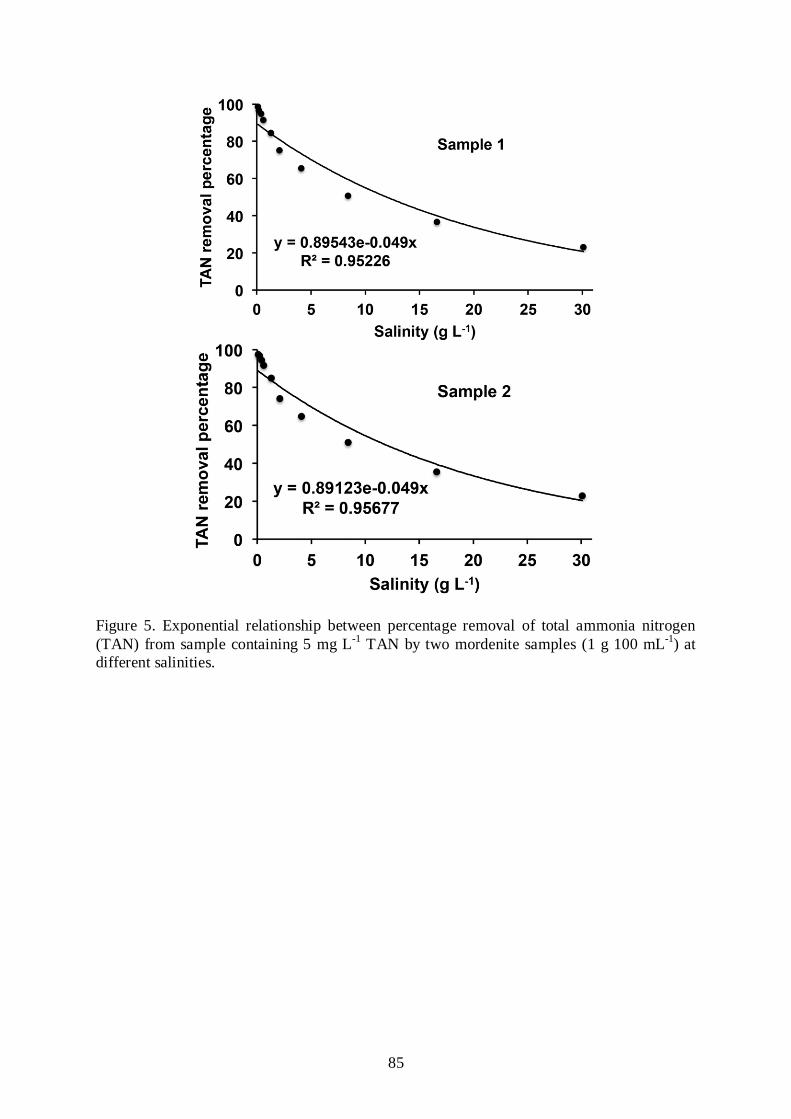
85
Figure 5. Exponential relationship between percentage removal of total ammonia nitrogen
(TAN) from sample containing 5 mg L-1
TAN by two mordenite samples (1 g 100 mL-1
) at
different salinities.

86
Figure 6. Cation preference oftwo mordenite samples applied at 1 g 100 mL-1
in water of
different cation concentration.

87
Figure 7. Removal of total ammonia nitrogen (TAN) from water containing 3 mg L-1
TAN by
different application rate of mordenite sample 1 in aerated and non-aerated aquaria.
88
VI. BLUEGILL YIELD IN RESPONSE TO NITROGEN AND PHOSPHORUS VERSUS
PHOSPHRUS-ONLY FERTILIZATION IN PONDS AT DIFFERENT TIMES SINCE
SEDIMENT REMOVAL
ABSTRACT
Nitrogen often is omitted in fertilization of sportfish ponds in the southeastern United
States that have been fertilized for several years with both nitrogen and phosphorus. This
practice was tested in 40-yr-old research ponds at the Auburn University E. W. Shell
Fisheries Center from which sediment had been removed 2 to 9yr earlier to restore bottoms
nearly to their original soil composition. In ponds from which sediment had been removed 8
yr before, there was no difference (P> 0.05) in harvest weight of bluegill
(Lepomismacrochirus) between ponds receiving nitrogen plus phosphorus fertilization (6 kg
N and 3 kg P2O5 ha-1
application-1
) and those fertilized only with phosphorus (3 kg P2O5 ha-1
application-1
). Grass carp controlled aquatic macrophytes effectively in most ponds and did
not interfere with bluegill yield. No correlation (R2 = 0.040, P> 0.05) was found between
time since sediment removal and bluegill yield in 13 ponds treated only with phosphate
fertilizer at 3 kg P2O5 ha-1
application-1
.Concentrations of soluble reactive phosphorus and
total ammonia nitrogen in the water column were correlated (R2 = 0.312 and R
2 = 0.514,
respectively, P < 0.05) with time since sediment removal. An earlier study showed that
nitrogen fertilization was necessary in sportfishponds the year following sediment removal.
In the present study, there was much variation in production among ponds treated with
89
nitrogen plus phosphorus as well as those treated only with phosphorus as typically
encountered in pond fertilization trials. Nevertheless, results suggest that nitrogen
fertilizationof sportfish ponds possibly can be ceased after only 2 yr of fertilization with
nitrogen and phosphorus.
INTRODUCTION
Many sportfish ponds in the southeastern United States are treated with inorganic
fertilizers to increase primary productivity and enhance the base of the food web culminating
in sunfish (Lepomis spp.) and largemouth black bass (Micropterussalmoides) that are popular
with anglers in the region. The application of fertilizer is adjusted to provide an acceptable
phytoplankton bloom. The usual recommendation is to use enough fertilizer to maintain
adequate phytoplankton for a Secchi disk visibility of 30 to 45 cm (Boyd and Tucker, 2014).
Many pond fertilization studies have been conducted in small (0.04-0.1 ha), earthen
ponds at the Auburn University Fisheries Research Unit [now known as the E. W. Shell
Fisheries Center (SFC)]. The typical procedure has been to stock only sunfish – usually
bluegill (L.macrochirus) – and use the intensity of the phytoplankton bloom (usually
estimated by particulate organic matter or chlorophyll a analysis), nitrogen and phosphorus
concentrations, and the harvest weight of sunfish during a single growing season as indicators
of the suitability of fertilization regimes (Swingle, 1947; Boyd, 1990).
The initial research on sunfish pond fertilization relied on broadcast applications of
granular fertilizers, and resulted in a recommendation of 9 kg N, 9 kg P2O5, and 2.25 kg K2O
ha-1
application-1
for 10 to 14 periodic applications at 2- to 4-wk intervals (depending upon
the phytoplankton density) during the growing season (Swingle, 1947). Later, research with
carp (Cyprinuscarpio), gold fish (Carassiusauratus) and channel catfish (Ictaluruspunctatus)
90
revealed that nitrogen and potassium fertilization was unnecessary to promote the production
of these species in ponds with a 15-yr history of complete (N, P2O5, and K2O) fertilization
(Swingle et al., 1963). This finding led to the recommendation that nitrogen and potassium
could be eliminated and phosphorus-only fertilization used in sportfish ponds with a history
of complete fertilization (Byrd and Swingle, 1964). The source of nitrogen in older ponds
was attributed to nitrogen fixation by blue-green algae common in waters with high
phosphorus concentration and microbial mineralization of nitrogen from organic matter that
accumulated in sediment (Swingle et al., 1963). However, at least to our knowledge, no
bluegill pond fertilization studies to confirm the validity of this recommendation were made.
In an effort to verify whether nitrogen fertilization in older ponds was needed, studies
were conducted in ponds on the SFC with 10- to 20-yr histories of fertilization or feed
application. Bluegill production was not increased (P > 0.05) by nitrogen plus phosphorus
fertilization as compared to phosphorus-only fertilization (Lichtkoppler and Boyd, 1977;
Boyd and Sowles, 1978; Murad and Boyd, 1987). A study by Tepe and Boyd (2002) also
revealed no benefit of nitrogen plus phosphorus fertilization over phosphorus-only treatment
on golden shiner (Notemigonuscrysoleucas) production in ponds that had been fertilized with
a complete fertilizer for 10 yr previously. Nevertheless, in these studies, fish production was
numerically (but not statistically at P = 0.05) greater for ponds receiving both nitrogen and
phosphorus than in the phosphorus-only treatments, and in one study (Tepe and Boyd, 2003),
nitrogen plus phosphorous fertilization caused a slight increase (P< 0.05) in bluegill
production over phosphorus-only fertilization. Thus, it does not seem prudent to rule out the
possibility that nitrogen fertilizer addition may be beneficial in sportfish ponds with a history
of complete fertilization.
Beginning in 2002, a project was initiated at the SFC to remove sediment and repair
pond embankments over a period of several years. The physical and chemical condition of

91
the renovated pond bottoms was similar to that of the original pond bottoms (Yuvanatemiya
and Boyd, 2006). Fertilization studies were conducted in newly renovated ponds that had not
received nutrient inputs since renovation. The optimum fertilization rate using liquid instead
of granular fertilizer (Metzger and Boyd, 1980) was 6 kg N and 3 kg P2O5 ha-1
application-1
,
and potassium fertilization was unnecessary (Wudtisin and Boyd, 2005; Boyd et al., 2008;
Viriyatum and Boyd, 2011). Because ponds were renovated over a period of several years, it
was possible in the present study to select ponds that had been fertilized for different numbers
of years since renovation and evaluate the response to nitrogen plus phosphorus fertilization
and phosphorus-only fertilization.
MATERIALS AND METHODS
Seventeen, 0.04-ha earthen, research ponds of about 1 m average depth and located on
Piedmont soils (TypicKandiudults, clayey, kaolinitic, and thermic) at the SFC near Auburn,
Alabama were used in this study. Sediment had been removed from these ponds 2 to 9yr
earlier (Table 1). Sediment samples were collected on 9 March 2012 before ponds were filled
by taking 5-cm diameter by 5-cm deep samples from 10 random places in each pond bottom
with a plastic tube and combining the cores to provide a composite sample from each pond.
Samples were dried at 60 C in a mechanical convection oven and pulverized by mortar and
pestle to pass a 40-mesh sieve. Soil nitrogen was determined by the Auburn University Soil
Testing Laboratory with a LECO CHN Analyzer (LECO Corporation, St. Joseph, Michigan,
USA). Organic carbon (sulfuric acid-potassium dichromate oxidation method), pH (1:1
mixture of dry, pulverized soil and distilled water), and acid-extractable phosphorus (double
acid extraction method) were measured by the Auburn University Soil Testing Laboratory
using protocols described by Hue and Evans (1986).

92
Water to supply the ponds came from a reservoir filled with runoff from a wooded
watershed. The ponds were filled with water on 9 and 10 March 2012, and water levels were
maintained about 5 cm below the overflow structures by occasional additions from the supply
line. Five ponds, from which sediment had been removed 8 yr earlier, were treated only with
phosphorus fertilizer (3 kg P2O5 ha-1
application-1
from triple superphosphate), and four other
ponds, from which sediment also had been removed 8 yr earlier, were fertilized with nitrogen
and phosphorus (3 kg P2O5 and 6 kg N ha-1
application-1
from triple superphosphate and
ammonium nitrate, respectively). Treatments were randomly assigned to the ponds. The
remaining eight ponds, from which sediment had been removed 2 to 9 yr earlier, received 3
kg P2O5 ha-1
application-1
. Fertilizers were applied to ponds on 17 and 30 March, 6 and 26
April, 11 and 26 May, 17 June, 8 July, 12 August, and 17 September, 2012.
In early February 2012, 90 kg of agricultural limestone were applied to ponds with
total alkalinity and total hardness concentrations below 25 mg L-1
, and 45 kg of agricultural
limestone were applied to ponds with alkalinity and hardness below 30 mg L-1
(Boyd, 1990).
On 16 March 2012, 220 juvenile bluegill, with an average weight of 1.38 g, were stocked into
each pond. Five grass carp (Ctenopharyngodonidellus), with an average weight of 39.08 g,
were stocked into each pond on 19 March 2012 for aquatic macrophyte control.
Water samples were collected weekly between 20 March 2012 and 15 October 2012,
with a 90-cm water column sampler (Boyd and Tucker, 1992). Samples were transported to
the laboratory and analyzed immediately for pH and concentrations of chlorophyll a, nitrate
nitrogen (NO3-N), total ammonia nitrogen (TAN), turbidity, and soluble reactive phosphorus
(SRP). In addition, total hardness, total alkalinity, total suspended solids (TSS), particulate
organic matter (POM), total nitrogen (TN), and total phosphorus (TP) were determined for
the samples every other week. The TAN concentration was measured by the salicylate
method (Le and Boyd, 2012); NO3-N nitrogen was determined by the NAS reagent method

93
(van Rijn, 1993); total nitrogen and total phosphorus analyses were made according to Gross
and Boyd (1998). Other analysis followed protocols recommended by Boyd and Tucker
(1992).
Percentages of pond areas covered by aquatic macrophytes were determined monthly.
Ponds were visually divided into 12 sections and the amount of aquatic macrophyte coverage
in each section was sketched on a scaled map showing the 12 sections of ponds. Areas
covered by aquatic macrophyte in each pond were estimated from maps using a polar
planimeter.
Ponds were drained and fish were harvested between 22 and 25 October 2012. The
weights of bluegill and crass carp in each pond were recorded.
Means and standard deviations, comparison of means of two treatments by t-test, and
linear and nonlinear regression analyses were conducted using SAS 9.3 (SAS Institute, Cary
NC, USA).
RESULTS AND DISCUSSION
Concentrations of organic carbon (1.15-2.71%), total nitrogen (0.08-0.37%), and acid-
extractable phosphorus (48-132 mg kg-1
) in bottom soil samples had means and standard
deviations of 1.78 0.50%, 0.14 0.07%, and 83 28 mg kg-1
, respectively. Mean
concentrations of these variables immediately after renovation had been 1.02% organic
carbon, 0.10% total nitrogen, and 37 mg kg-1
acid-extractable phosphorus (Yuvanatemiya and
Boyd, 2006). At the beginning of the study on 9 March 2012, the concentrations of organic
carbon, total nitrogen, and acid-extractable phosphorus in the bottom soils tended to be
greater than immediately after renovation, but there was no correlation (P> 0.05) between

94
time since pond renovation and concentrations of soil variables; R2 = 0.101 for organic
carbon, R2 = 0.001 for total nitrogen, and R
2 = 0.034 for acid-extractable phosphorus.
The concentrations of TAN, NO3-N, TN, SRP, TP, and chlorophyll a in water
samples fluctuated greatly among ponds treated alike and across sampling dates as is typical
in aquaculture pond water quality investigations (Boyd and Tucker, 2014). To simplify the
data presentation, mean concentrations of water chemistry variables in each pond (with
phosphorus-only fertilizer, n = 13) were regressed versus time since pond renovation (Fig. 1).
There was no change (P> 0.05) with respect to TN concentration (R2 = 0.089), NO3-N
concentration (R2 = 0.156), chlorophyll a (R
2 = 0.001), or total phosphorus (R
2 = 0.021).
Total ammonia nitrogen concentration (R2 = 0.514) decreased slightly with time since pond
renovation (P< 0.05). The concentration of SRP increased in older ponds (R2 = 0.312, P<
0.05).
Concentrations of total hardness (31.0 to 58.6 mg L-1
) and total alkalinity (33.1 to
66.0 mg L-1
) averaged 43.4 mg L-1
and 47.6 mg L-1
for all ponds, respectively. The minimum
concentration of these variables, considered acceptable for fertilized sportfish ponds, is 20
mg L-1
, but a higher concentration of 40 mg L-1
is recommended as a desirable goal for
sportfish ponds (Boyd and Tucker, 2014). The ponds had adequate concentrations of total
alkalinity and total hardness.
In the nine ponds from which sediment had been removed 8 yr previously and
fertilized with either nitrogen plus phosphorus or phosphorus only (Table 2), there were no
difference in mean concentrations of water chemistry variables between treatments (P> 0.05).
The addition of nitrogen fertilizer did not result in greater concentrations of TN, TAN, or
NO3-N.This corroborates previous work suggesting that nitrogen fixation and microbial
recycling of nitrogen from sediment organic matter supplies adequate nitrogen in sportfish
ponds with a history of nitrogen and phosphorus fertilization. The findings that sediment

95
organic carbon, total nitrogen, and acid-extractable phosphorus were not correlated with time
since sediment removal, but ponds – all of which had been fertilized for at least 2 yr – tended
to have greater concentrations of these variables than found in the pond sediments
immediately after renovation, suggest that the sediment quickly increases in concentrations of
these variables. The concentrations of these variables in the sediment of the renovated ponds
remained fairly constant over time. But, Munsiri et al. (1995) showed that the concentration
of organic carbon and other variables in sediment of ponds on the SFC tended to reach an
equilibrium concentration within 2 yr, but sediment continued to accumulate at a rate of
about 1 cm yr-1
. Thus, the total amount of organic matter, nitrogen, and phosphorous in pond
sediment increased over time. The depth to which sediment releases nutrients into the water
column is only around 5 cm (Munsiri et al., 1995), and organic matter and nutrients in
sediment below this depth do not normally enter the water column.
Grass carp were generally effective in controlling aquatic macrophytes. In April 2012,
12 ponds had macrophyte coverage of 5-100%, but by July, only three ponds contained
macrophytes (64-96% cover). It was found that the grass carp had not survived in two of the
three ponds containing aquatic macrophytes at harvest. The harvest weights of bluegill in
those three ponds ranged from 213 to 375 kg ha-1
.
Considering all 13 ponds with phosphorus-only fertilization (Fig. 2), harvest weights
of bluegill and grass carp were not correlated with time since sediment removal (R2 = 0.001,
P> 0.05 and R2 = 0.090, P> 0.05, respectively). Bluegill yield was not negatively impacted
by the grass carp in ponds; there was no correlation (R2 = 0.053, P> 0.05) between the
harvest weights of the two species. Variation in bluegill yield among the 13 ponds treated
only with phosphorus was high (213-535 kg ha-1
), with a mean and standard deviation of 345
98.7 kg ha-1
. The grass carp yield ranged from 68 to 296 kg ha-1
with a mean and standard
deviation of 163 86.6kg ha-1
, and total fish harvest (weight of bluegill plus grass carp) that

96
averaged 508 150.6kg ha-1
, with a range from 311 to 826 kg ha-1
. The range of bluegill
yield is within the range reported in other bluegill pond fertilization studies at the SFC (Boyd,
2014). Doyle and Boyd (1984) reported a mean coefficient of variation of 27% in three to
four replications of the same fertilization treatment repeated annually for 9 yr in ponds at the
SFC.
In the ponds from which sediment removal occurred 8 yr previously, nitrogen plus
phosphorus fertilization did not increase (P> 0.05) mean bluegill yield (362 kg ha-1
) above
that of ponds fertilized with phosphorus only (353 kg ha-1
) (Table 2). Moreover, the mean
yield for the five ponds with phosphorus-only fertilization (353 kg ha-1
) was not different (P>
0.05) than that of 347 kg ha-1
in 7 ponds from which sediment had been removed for 2 to 7 yr
(Table 1) and also received phosphorus-only fertilization. The pond from which sediment had
been removed for 9 yr had low sunfish yield (213 kg ha-1
), but this was thought to be the
result of natural variation because four other ponds from which sediment had been removed
for 3-8 yr had similarly low yield (227-241 kg ha-1
).
A previous study conducted in ponds at the SFC the year following sediment removal
revealed a definite benefit of nitrogen fertilization on bluegill production (Boyd et al., 2008).
In the present study, differences in bluegill production could not be attributed to nitrogen
fertilization in ponds which had been fertilized with both nitrogen and phosphorus for 2-9 yr
since sediment removal. Nevertheless, there is much variation in bluegill production in
fertilized ponds constructed in the same type of soil according to an identical design, and
sharing the same, regulated water source (Boyd and Tucker, 2014). If a particular fertilization
schedule will not assure uniform results in ponds at a single location; it seems futile to
attempt to develop a fertilization schedule for use across a wide range of pond design, soil
type, water source, and hydrologic condition.

97
The results of the present study do suggest that after 2 yr of nitrogen plus phosphorus
fertilization, pond manager might cease nitrogen fertilization and assess the response of the
phytoplankton bloom. If the phytoplankton bloom wanes, then nitrogen fertilization could be
resumed. However, the findings of this study likely are not applicable to food fish ponds
where the standing crop of fish and the amount of nitrogen in fish biomass are much greater.
Boyd (1976) and Lin et al. (1997) demonstrated that nitrogen fertilization increased tilapia
production in older ponds with a history of nitrogen and phosphorus fertilization.

98
LITERATURE CITED
Boyd, C.A., Penseng, P., Boyd, C.E., 2008. New nitrogen fertilization recommendations for
bluegill ponds in the southeastern United States. North Am. J. of Aquacult. 70, 308-
313.
Boyd, C.E., 1976. Nitrogen fertilizer effects on production of tilapia in ponds fertilized with
phosphorus and potassium. Aquacult 7, 385-390.
Boyd, C.E., 1990. Water Quality in Ponds for Aquaculture. Alabama Agricultural
Experiment Station, Auburn University, Auburn, Alabama.
Boyd, C.E., 2014. A review of sportfish pond fertilization studies at Auburn University.
World Aquacult. 45, 41-45.
Boyd, C.E., Sowles, J.W., 1978. Nitrogen fertilization of ponds. Trans. Am. Fish. Soc. 107,
737-741.
Boyd, C.E., Tucker, C.S., 1992. Water Quality and Pond Soil Analyses for Aquaculture.
Alabama Agriculture Experiment Station, Auburn University, Auburn, Alabama.
Boyd, C.E., Tucker, C.S., 2014. Handbook for Aquaculture Water Quality. Craftmaster
Printers, Auburn, Alabama.
Byrd, I.B., Swingle, H.S., 1964. Pond fertilization cost can be reduced by 66 percent.
Alabama Conserv. 34, 4-6.
Doyle, K.M., Boyd, C.E., 1984. The timing of inorganic fertilization of sunfish ponds.
Aquaculture 37, 169-177.
Gross, A., Boyd, C.E., 1998. A digestion procedure for the simultaneous determination of
total nitrogen and total phosphorus in pond water. J. World Aquacult. Soc. 29, 300-
303.
Hue, N.V., Evans, C.E., 1986. Procedures used for soil and plant analysis by the Auburn
University Soil Testing Laboratory. Department of Agronomy and Soils Series No.
106, Alabama Agriculture Experiment Station, Auburn University, Auburn, Alabama.
Le, P.T.T., Boyd, C.E., 2012. Comparison of phenate and salicylate methods for
determination of total ammonia nitrogen in freshwater and saline water. J.World
Aquacult. Soc. 43, 885-889.
Lichtkoppler, F., Boyd, C.E., 1977. Phosphorus fertilization of sunfish ponds. Trans. Am.
Fish. Soc. 106, 634-636.
Lin, C.K., Teichert-Coddington, D.R., Green, B.W., Veverica K.L., 1997. Fertilization
regimes. In: Egna, H., Boyd, C.E. (Eds.), Dynamics of pond aquaculture. CRC Press,
Boca Raton, Florida, pp. 73-107.
99
Metzger, R.J., Boyd, C.E., 1980. Liquid ammonium polyphosphate as a fish pond fertilizer.
Trans. Am. Fish. Soc. 109, 563-570.
Munsiri, P., Boyd, C.E., Hajek, B.F., 1995. Physical and chemical characteristics of bottom
soil profiles in ponds at Auburn, Alabama, USA and a proposed system for describing
pond soil horizons. J. World Aquacult. Soc. 26, 346-377.
Murad, A., Boyd, C.E., 1987. Experiments on fertilization of sport fish ponds. Prog. Fish-
Cult. 49, 100-107.
Swingle, H.S., 1947. Experiments on pond fertilization. Bulletin 264, Agricultural
Experiment Station of the Alabama Polytechnic Institute, Auburn, Alabama.
Swingle, H.S., Gooch, B.C., Rabanal, H.R., 1963. Phosphate fertilization of ponds. Proc. Ann.
Conf. S.E. Assoc. Game and Fish Comm. 17,213-218.
Tepe, Y., Boyd, C.E., 2002. Nitrogen fertilization of golden shiner ponds. North Amer. J.
Aquacult. 64, 284-289.
Tepe, Y., Boyd, C.E., 2003. A reassessment of nitrogen fertilization for sunfish ponds.J.
World Aquacult. Soc. 34, 505-511.
Van Rijn, J., 1993. Methods to evaluate water quality in aquaculture. Hebrew University of
Jerusalem, Rehovot, Israel.
Viriyatum, R., Boyd, C.E., 2011. Re-evaluation of potassium fertilization of bluegill,
Lepomismacrochirus, ponds. J. World Aquacult. Soc. 42, 332-338.
Wudtisin, W., Boyd, C.E., 2005. Determination of the phosphorus fertilization rate for
bluegill ponds using regression analysis. Aquacult. Res. 36, 593-599.
Yuvanatemiya, V., Boyd, C.E., 2006. Physical and chemical changes in aquaculture pond
bottom soil resulting from sediment removal. Aquacult. Eng. 35, 199-205.

100
Table 1. Pond renovation history and fertilization treatments in 2012.
Year Years since No. Fertilizer treatment (no. of ponds)
renovated renovation ponds P2O5a N
b + P2O5
a
2003 9 1 1 0
2004 8 9 5 4
2005 7 1 1 0
2007 5 1 1 0
2008 4 2 2 0
2009 3 2 2 0
2010 2 1 1 0
a3 kg P2O5 ha
-1 per application with triple superphosphate.
b6 kg N ha
-1 per application with ammonium nitrate.
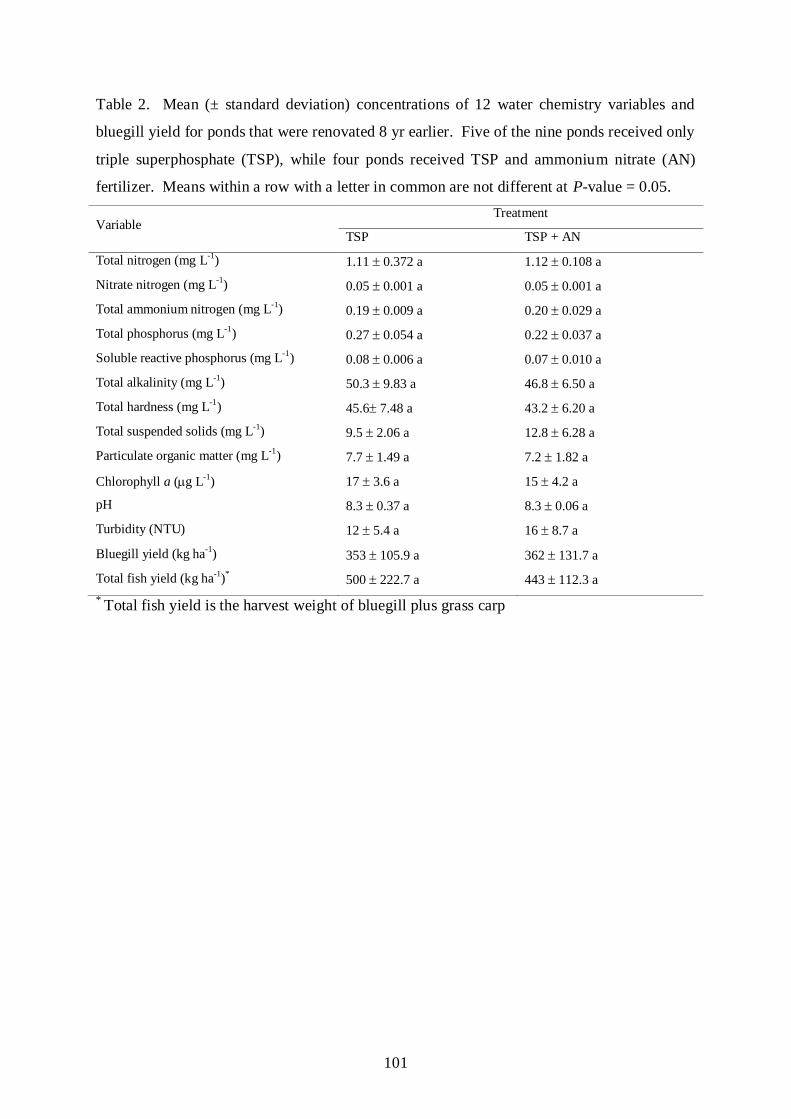
101
Table 2. Mean (± standard deviation) concentrations of 12 water chemistry variables and
bluegill yield for ponds that were renovated 8 yr earlier. Five of the nine ponds received only
triple superphosphate (TSP), while four ponds received TSP and ammonium nitrate (AN)
fertilizer. Means within a row with a letter in common are not different at P-value = 0.05.
Variable Treatment
TSP TSP + AN
Total nitrogen (mg L-1
) 1.11 0.372 a 1.12 0.108 a
Nitrate nitrogen (mg L-1
) 0.05 0.001 a 0.05 0.001 a
Total ammonium nitrogen (mg L-1
) 0.19 0.009 a 0.20 0.029 a
Total phosphorus (mg L-1
) 0.27 0.054 a 0.22 0.037 a
Soluble reactive phosphorus (mg L-1
) 0.08 0.006 a 0.07 0.010 a
Total alkalinity (mg L-1
) 50.3 9.83 a 46.8 6.50 a
Total hardness (mg L-1
) 45.6 7.48 a 43.2 6.20 a
Total suspended solids (mg L-1
) 9.5 2.06 a 12.8 6.28 a
Particulate organic matter (mg L-1
) 7.7 1.49 a 7.2 1.82 a
Chlorophyll a (g L-1
) 17 3.6 a 15 4.2 a
pH 8.3 0.37 a 8.3 0.06 a
Turbidity (NTU) 12 5.4 a 16 8.7 a
Bluegill yield (kg ha-1
) 353 105.9 a 362 131.7 a
Total fish yield (kg ha-1
)* 500 222.7 a 443 112.3 a
* Total fish yield is the harvest weight of bluegill plus grass carp

102
Figure 1.Relationships between the mean concentrations of water chemistry variables and
time (in years) since sediment removal in 13 bluegill ponds that received phosphorus-only
fertilization

103
Figure2. Upper: The harvest weights of bluegill and grass carp versus time (in years) since
sediment removal from 13 bluegill ponds that received phosphorus-only fertilization. Lower:
Harvest weight of bluegill in 15 ponds versus harvest weight of grass carp

104
VII.AMMONIA MANAGEMENT
There are several ways to reduce ammonia nitrogen concentration. Although some
are not long-term solutions or practical to use at production facilities, they are still worth
mentioning. Measures such as adding an acid to lower pH, applying an algicide to lessen
phytoplankton photosynthesis and reduce pH, or exchange water in ponds to flush out
ammonia nitrogen can be used as emergency treatmentswhere the TAN concentration is too
high. However, such treatments are expense, they also have possible negative effects on
water quality in ponds (acid and algicide treatment), and in water receiving aquaculture
effluents (release nutrient-enriched or pathogen-contaminated water) or be impossible to
implement at particular sites (water exchange).
Fertilizing ponds with phosphorus promotes algae growth, thereby decreasing
ammonia nitrogen through algae uptake. However, adding additive phosphorus to ponds
already receiving phosphorus input from feed may causeunacceptably dense phytoplankton
blooms(Hargreaves and Tucker, 2004).
Adding a source of organic matter such as manure, chopped hay can reduce
ammonia nitrogen. This result because of organic matter with an elevated C/N ratio promotes
immobilization of the ammonia from the water by microorganisms of decay. This practice,
however, requires large amount of organic carbon and increases the oxygen
demand(Hargreaves and Tucker, 2004).
Moreover, shrimp farmers in some Asian countries often apply zeolite to ponds in
attempts to lower the ammonia concentration to which culture animals are exposed. This

105
method is practical to use in transport containers for ornamental freshwater fishes, and waters
in aquaria, water recirculating aquaculture system, but not practical for large-volume fish
ponds (Hargreaves and Tucker, 2004).
The practice of applying living bacterial amendments to ponds to lessen TAN
concentration is popular in Asia and is now being used by some ictalurid catfish producers in
the United States. However, there is no evidence that this practice is effective (Boyd and
Tucker, 2014).
The best approach for avoiding high TAN concentration is to apply practices that
minimize ammonia nitrogen input, increase nitrification, and lessen pH increase (Boyd and
Tucker, 2014) as follows:
1. Use a good quality feed with optimal crude protein concentration.
2. Use moderate stocking and feeding rates.
3. Feed slightly less than fish will eat to avoid overfeeding and uneaten feed.
4. Use adequate mechanical aeration to avoid dissolved oxygen concentration from
falling below 4 mg L-1
at night – around 1 hp for each 10 kg ha-1
day-1
usually is
adequate.Aeration favors bacterial nitrification and enhances the diffusion of NH3
from water to the air.
5. Avoid sources of ammonia nitrogen from watersheds. Livestock production on
watershed will substantially increase TAN concentration in ponds.
6. Ponds with low alkalinity (< 40 mg L-1
) should be treated with agriculture limestone
to increase alkalinity and buffer water against pH fluctuations.
7. Ponds with low total hardness but normal alkalinity should be treated with
agricultural gypsum (CaSO4 ∙2H2O) to increase hardness and prevent high pH in
response to high photosynthesis rates.

106
Adoption of moderate stocking and feeding rates will not appeal to many producers. But,
even in ponds with high fish production, the other practices listed above can be beneficial in
limiting the concentration of TAN.

107
LITERATURE CITED
Boyd, C.E., Tucker, C.S., 2014. Handbook for Aquaculture Water Quality. Craftmaster
Printers, Auburn, Alabama.
Hargreaves, J.A., Tucker, C.S., 2004. Managing ammonia in fish ponds. SRAC Publication
No. 4603, pp1-7.