Embed Size (px)
Citation preview

10th AIAA Aviation Technology, Integration, and Operations Conference. September 13-15, 2010
1
Investigation of the Impacts of Effective Fuel Cost Increase on the US Air Transportation Network and Fleet
James K.D. Morrison*, Philippe A. Bonnefoy†, and R. John Hansman‡ Department of Aeronautics & Astronautics, Massachusetts Institute of Technology, 77 Massachusetts Avenue,
Cambridge, MA 02139, USA
and
Sgouris Sgouridis§ Masdar Institute of Science and Technology, P.O. Box 54115, Abu Dhabi, United Arab Emirates
The cost of aviation fuel increased 244% between July 2004 and July 2008, becoming the largest operating cost item for airlines. Given the potential for future increases in crude oil prices, as well as environmental costs (i.e. from cap and trade schemes or taxes), the effective cost of aviation fuel may continue to increase, further impacting airlines’ financial performance and the provision of air service nationwide. We evaluate how fuel price increase and volatility affected continental US air transportation networks and fleets in the short- and medium-term using the increase in the 2007-08 and 2004-08 periods as a natural experiment. It was found that non-hub airports serving small communities lost 12% of connections, compared to an average loss of 2.8%, July 2004-08. It is believed that reduced access to the national air transportation system had social and economic impacts for small communities. Complementary analyses of aircraft fuel efficiency, airline economics, and airfares provided a basis for understanding some airline decisions. Increased effective fuel costs will provide incentives for airlines to improve fleet fuel efficiency, reducing the environmental effects of aviation, but may cause an uneven distribution of social and economic impacts as airline networks adapt. Government action may be required to determine acceptable levels of access to service as the air transportation system transitions to higher fuel costs.
* Research Assistant, Department of Aeronautics & Astronautics, Mass. Inst. of Tech., 77 Massachusetts Avenue, Office 33-115, Cambridge, MA 02139, USA, email: [email protected] † Postdoctoral Associate, Department of Aeronautics & Astronautics, Mass. Inst. of Tech., 77 Massachusetts Avenue, Office 33-322A, Cambridge, MA 02139, USA, email: [email protected] ‡ Professor of Aeronautics & Astronautics and Engineering Systems, Mass. Inst. of Tech. Director of MIT International Center for Air Transportation, 77 Massachusetts Avenue, Office 33-308, Cambridge, MA 02139, USA, email: [email protected] § Assistant Professor, Masdar Institute of Science and Technology, P.O. Box 54115, Abu Dhabi, United Arab Emirates, email: [email protected]

10th AIAA Aviation Technology, Integration, and Operations Conference. September 13-15, 2010
2
I. Introduction HE cost of aviation fuel increased 244% between July 2004 and July
2008, becoming the largest operating cost item for airlines (ATA, 2010)1. Figure 1 depicts a conceptual model showing the linkages between the air transportation system and economy.2 Changes in the effective cost of fuel affect the air transportation system on: (1) the supply-side, through pricing and scheduling, networks and fleet; and (2) the demand-side, through the economy. A key contributor to the effective cost of fuel is the price of crude oil. As shown in Figure 2, jet fuel prices surged from an average of $0.72/gallon in January 2000 to a peak of $3.82/gallon in July 2008, trending closely with crude oil prices. During the period of the highest rate of increase, July 2007-08, jet fuel prices climbed 82%1. It is expected that increases in the effective cost of fuel impact the balance of supply and demand in the system, resulting in changes in airline supply (i.e. network and fleet). There is a need to understand how fuel price increases affected air transportation network and fleet assignment decisions, and the effectiveness of government policies in meeting socioeconomic and environmental objectives. As shown in Figure 1, the effective cost of fuel is influenced by crude oil prices as well as domestic and international market-based carbon policies, such as cap and trade and carbon taxes. Peak oil theory predicts continued volatility and increasing costs of oil-based fuels while new environmentally driven charges are expected to add to fuel costs, impacting airlines’ financial performance, technology and operational change uptake, and decisions with regard to the provision of air services nationwide. These future scenarios motivate the need to understand how air transportation networks and fleet will evolve with increasing effective fuel costs. This research analyzed the continental US system during the 2004-08 fuel price surge to improve understanding of how air transportation networks and fleet may evolve under volatile and upward trending effective fuel costs. We use two time periods – July 2004-08 and July 2007-08 - as natural experiments to understand short- and medium-term effects of fuel cost increase and volatility in the behavior of airlines in a competitive system. As a second step, we extrapolate the effects of sustained effective fuel cost increases on how airline-passenger interactions may evolve. Section II outlines our research approach, followed by an analysis of the impacts of the fuel price surge in Section III. Potential explanations of the effects of the fuel price surge are described in Section IV. Future effective fuel cost increase scenarios, possible long-term consequences of the evolution of the system observed in the time periods of the study, potential fuel efficiency measures, and the role of government in mitigating negative impacts are discussed in Section V. Section VI summarizes and presents the main conclusions from this work.
T
Figure 1. Air Transportation System and Effective Fuel Cost Macroeconomic Interaction Model. Adapted from (Tam and Hansman, 2003)2.
Figure 2. Time Periods of Study Selected due to Trends in Crude Oil and Jet Fuel Prices. Source: (ATA, 2010)1
10th AIAA Aviation Technology, Integration, and Operations Conference. September 13-15, 2010
3
II. Research Approach The 2004-08 period provided a natural experiment that is used as a case study to evaluate how fuel price increases affected air transportation networks and fleet decisions. Comparative analyses were performed over two time periods: (1) July 2004-08, and (2) July 2007-08. The July 2004-08 time period was selected to demonstrate medium-term trends in airline decisions when facing increasing fuel costs, while the July 2007-08 time period was selected to examine short-term trends. Primary focus was placed on the July 2007-08 period, as the rate of fuel cost increase was greatest and airline decisions were likely to have been made under forecasts of continued high, or increasing, fuel costs. Comparing changes between the same month in subsequent years avoided introducing seasonal effects in the analysis. By July 2004, US domestic supply (as measured by available seat miles, ASM) had recovered to pre-9/11 levels and one year had past since the SARS pandemic of May-July 2003. Also, US gross domestic product (GDP) was increasing during this time period, peaking in nominal terms in Q3 2008. Therefore, the effects of the demand shift due to the 2008-2010 economic crisis do not impact the analysis. The air transportation system is influenced by multiple factors, as shown in Figure 1. Between Q3 2007 and 2008, real GDP remained relatively constant. There were no major US air safety or security incidents during this period, and US passenger carrier operations did not result in any fatalities. Airline competition, as measured by the Herfindahl-Hirschman Index (HHI)*, increased marginally from 0.082 to 0.083. Airline labor costs, as reported by the Air Transport Association (2010)3, decreased 3.9% between Q3 2007 and 2008. As the rate of change of these factors was dwarfed by the escalation of fuel costs, it was assumed that the effect of the increase in the cost of fuel on the air transportation system was greater than other factors during the July 2007-08 time period. During the July 2004-08 time period, several major US carriers entered Chapter 11 bankruptcy, three accidents occurred involving passenger fatalities**4, and real GDP increased 8.6%.5 This time period is used to put changes observed July 2007-08 into historical perspective and to identify medium-term trends in airline behavior. This study does not account for the effect of changes in economic activity, or other exogenous variables, on the air transportation system. Many airlines dampen fuel cost volatility by adopting financial fuel price hedging strategies. Over the time frame of this study, successful hedging strategies likely provided significant cost advantages to individual airlines. The magnitude of the fuel price increase implies that, in the future, hedging prices will increase and will account for such extremes in volatility. Therefore, fuel price hedging cannot be considered a sufficient measure of protection against systemic fuel price increases. Actions other than hedging are the subject of this paper, including changes to airline network and fleet assignments. The data used for these analyses was obtained from the Bureau of Transportation Statistics (BTS) Form 41 databases.6 For data consistency and availability reasons, the analysis was generally limited in scope to the continental US domestic air transportation system. Data was filtered to exclude cargo service, military flights, repositioning flights (i.e. departures performed with zero passengers reported), and sightseeing (i.e. departures performed whose origin and destination were the same airport). Based on these datasets, a comparative analysis of the continental US air transportation network and fleet at the airport and route levels was conducted. In addition, the effect of changes in air service provision on population access was evaluated.
To provide potential causal explanations for the observed effects on network and fleet from the case study, complementary analyses were conducted, including: the evaluation * Herfindahl-Hirschman Index (HHI) was calculated as the sum of the squares of the domestic revenue passenger mile (RPM) market share of all US passenger carriers reported in BTS Form 41 Schedule T2. ** US carrier accidents involving passenger fatalities, July 2004-08: (1) 0/19/04 Kirksville, MO, Corporate Airlines, British Aerospace Jetstream 32, (2) 12/19/05 Miami, FL, Chalks Ocean Airways, Grumman G-73T, (3) 08/27/06 Lexington, KY, Comair, Bombardier CRJ-100 (NTSB, 2010)4.
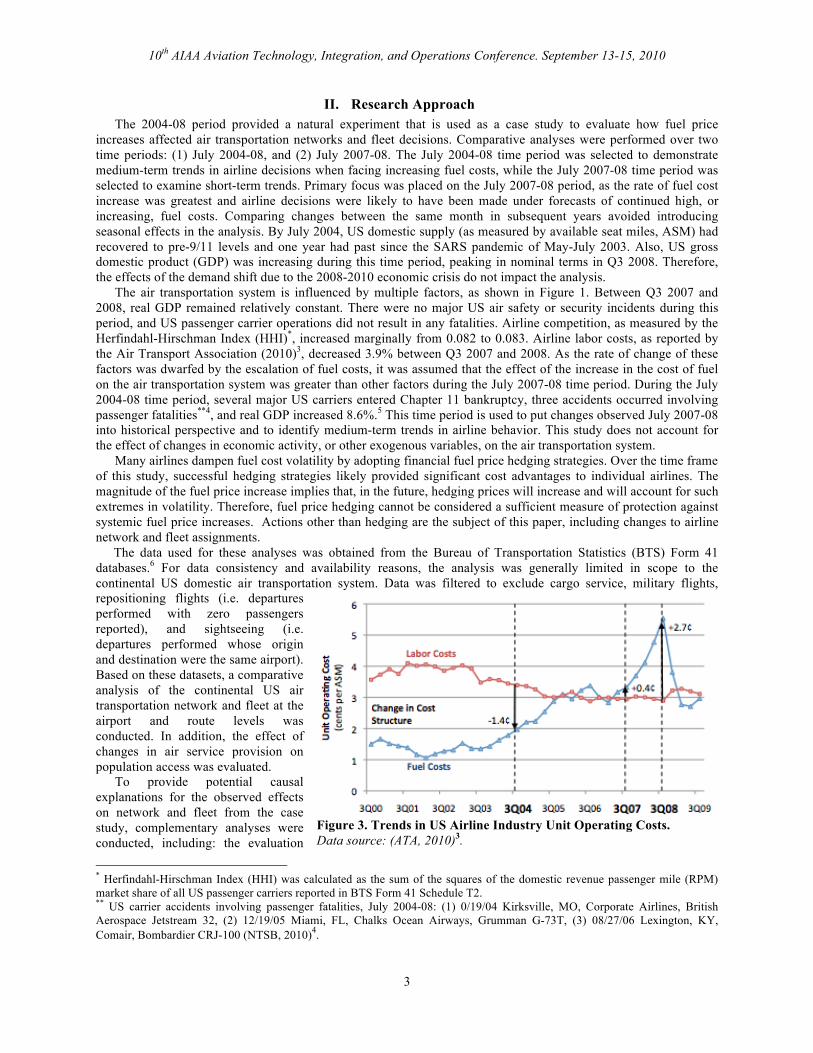
Figure 3. Trends in US Airline Industry Unit Operating Costs. Data source: (ATA, 2010)3.

10th AIAA Aviation Technology, Integration, and Operations Conference. September 13-15, 2010
4
of aircraft fuel intensity, airline economics, and airfare time series analyses. Finally, effects observed in the case study were extrapolated to various scenarios in which effective increases in fuel costs are expected to discuss their potential consequences.
III. Investigation of the Impacts of the 2004-2008 Fuel Price Surge Fuel became the greatest expense for the aviation industry in 2006 when it surpassed labor, the second largest
airline cost component, as shown in Figure 3. A combination of increasing fuel costs and decreasing labor costs due to industry restructuring led to this change in share of direct operating costs. As fuel costs have become a larger share of industry revenue, changes in the effective cost of fuel have had a greater impact on airline decisions and profit margins. The impacts on network structure, changes to passenger access to the air transportation system, and the impacts on airlines will be discussed in this section.
Airport HubClass ΔDepartures 1 Kenmore, WA NonHub 271 ∞ 2 Santa Rosa, CA NonHub 182 ∞ 3 New York, NY NonHub 137 ∞ 4 Plattsburgh, NY EAS 116 ∞ 5 Phoenix, AZ NonHub 90 ∞ 6 Del Rio, TX NonHub 84 ∞ 7 Alamogordo, NM NonHub 59 ∞ 8 New York, NY NonHub 57 ∞ 9 Palmdale, CA NonHub 57 ∞ 10 Vernal, UT EAS 56 ∞
…..
466 Columbia, MO EAS -109 -100% 467 Enid, OK NonHub -124 -100% 468 El Dorado, AR EAS -130 -100% 469 Watertown, NY EAS -152 -100% 470 Hot Springs, AR EAS -155 -100% 471 Prescott, AZ EAS -156 -100% 472 Trenton, NJ NonHub -161 -100% 473 Lake Havasu City, AZ NonHub -166 -100% 474 Peach Springs, AZ NonHub -227 -100% 475 Killeen, TX NonHub -409 -100%
Airport HubClass ΔDepartures 1 Charlotte, NC Large 4307 27.8% 2 New York, NY Large 3933 50.5% 3 Houston, TX Large 3336 19.0% 4 Denver, CO Large 2812 12.3% 5 Philadelphia, PA Large 2467 16.5% 6 San Francisco Large 2069 18.5% 7 Las Vegas, NV Large 1150 7.7% 8 San Diego, CA Large 1128 14.7% 9 Indianapolis, IN Medium 849 17.0% 10 Dallas/Ft. Wrth (DAL) Medium 805 21.8%
…..
466 Boston, MA Large -901 -5.8% 467 Albany, NY Small -1245 -38.3% 468 Detroit, MI Large -1803 -9.1% 469 Chicago, IL (MDW) Large -2261 -21.8% 470 Chicago, IL (ORD) Large -2566 -7.0% 471 Minneapolis, MN Large -3411 -16.9% 472 Washington,DC (IAD) Large -4287 -27.6% 473 Dallas/Ft.Wrth (DFW) Large -4872 -16.0% 474 Pittsburgh, PA Medium -6551 -53.5% 475 Covington, KY Large -7205 -38.1%
Figure 5. July 2004-2008 Absolute Changes in US Airports’ Continental US Passenger Departures and Top 10 Absolute Gains and Losses. Data Source: (BTS, 2010)6.
Figure 4. July 2004-2008 Relative Changes in US Airports’ Continental US Passenger Departures and Top 10 Relative Gains and Losses. Data Source: (BTS, 2010)6.
10th AIAA Aviation Technology, Integration, and Operations Conference. September 13-15, 2010
5
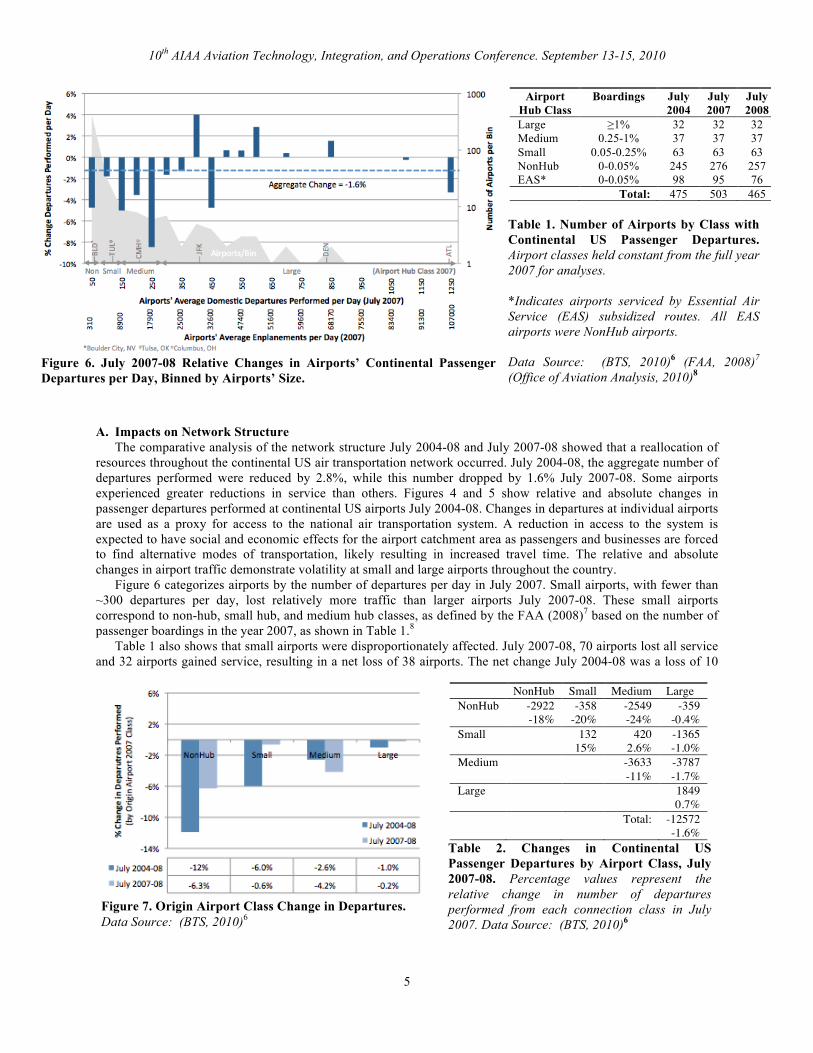
A. Impacts on Network Structure The comparative analysis of the network structure July 2004-08 and July 2007-08 showed that a reallocation of resources throughout the continental US air transportation network occurred. July 2004-08, the aggregate number of departures performed were reduced by 2.8%, while this number dropped by 1.6% July 2007-08. Some airports experienced greater reductions in service than others. Figures 4 and 5 show relative and absolute changes in passenger departures performed at continental US airports July 2004-08. Changes in departures at individual airports are used as a proxy for access to the national air transportation system. A reduction in access to the system is expected to have social and economic effects for the airport catchment area as passengers and businesses are forced to find alternative modes of transportation, likely resulting in increased travel time. The relative and absolute changes in airport traffic demonstrate volatility at small and large airports throughout the country. Figure 6 categorizes airports by the number of departures per day in July 2007. Small airports, with fewer than ~300 departures per day, lost relatively more traffic than larger airports July 2007-08. These small airports correspond to non-hub, small hub, and medium hub classes, as defined by the FAA (2008)7 based on the number of passenger boardings in the year 2007, as shown in Table 1.8 Table 1 also shows that small airports were disproportionately affected. July 2007-08, 70 airports lost all service and 32 airports gained service, resulting in a net loss of 38 airports. The net change July 2004-08 was a loss of 10
Figure 6. July 2007-08 Relative Changes in Airports’ Continental Passenger Departures per Day, Binned by Airports’ Size.
NonHub Small Medium Large NonHub -2922 -358 -2549 -359 -18% -20% -24% -0.4% Small 132 420 -1365 15% 2.6% -1.0% Medium -3633 -3787 -11% -1.7% Large 1849 0.7% Total: -12572 -1.6%
Table 2. Changes in Continental US Passenger Departures by Airport Class, July 2007-08. Percentage values represent the relative change in number of departures performed from each connection class in July 2007. Data Source: (BTS, 2010)6
Figure 7. Origin Airport Class Change in Departures. Data Source: (BTS, 2010)6
Airport
Hub Class Boardings July
2004 July 2007
July 2008
Large ≥1% 32 32 32 Medium 0.25-1% 37 37 37 Small 0.05-0.25% 63 63 63 NonHub 0-0.05% 245 276 257 EAS* 0-0.05% 98 95 76
Total: 475 503 465 Table 1. Number of Airports by Class with Continental US Passenger Departures. Airport classes held constant from the full year 2007 for analyses. *Indicates airports serviced by Essential Air Service (EAS) subsidized routes. All EAS airports were NonHub airports. Data Source: (BTS, 2010)6 (FAA, 2008)7 (Office of Aviation Analysis, 2010)8

10th AIAA Aviation Technology, Integration, and Operations Conference. September 13-15, 2010
6
airports with service. Airports that lost all service were generally small airports with fewer than seven domestic departures performed per day in July 2007. GAO (2009)9 reported that 38 airports with routes receiving Essential Air Service (EAS) subsidies lost all service July 2007-08 (this is discussed further in Section V). It is expected that the social and economic effects of reductions in access to the national air transportation system would be greatest at airports that lost all service or experienced a prolonged period without service. The July 2007-08 comparative network analysis was also performed at the origin-destination flight segment level. During this period, continental US departures were reduced by over 12,500. Table 2 shows the changes in departures between airport classes. Figure 7 shows that non-hub airports lost relatively more departures over both of the study periods while large-to-large hub connections increased. Small communities, serviced by non-hub airports, lost relatively more access to the national air transportation system than large communities. Cento (2009)10 proposed using the Freeman network centrality index to measure the strength of hub-and-spoke vs. point-to-point networks. In a pure hub-and-spoke network, all airports would be connected through one hub. In a pure point-to-point network, all airports would be connected directly to every other airport in the network. The Freeman network centrality index uses the weighted average of paths through each airport connecting every other airport in the network, normalized by the maximimum value achieved by a pure hub-and-spoke network. Therefore, for a pure hub-and-spoke network, the Freeman index is 1, while for a fully connected point-to-point network, the Freeman index is 0. The reduction in the number of non-hub airports, as well as the reductions in connections originating in non-hub and medium hub airports, led to a strengthening of hub-and-spoke networks July 2007-08. System-wide, the Freeman index increased from 0.17 to 0.26, its largest change in the decade. It was also found that during this time period, a relative shift towards longer haul flights occurred. The average stage length of continental US passenger departures increased from 609 miles in July 2004 to 626 miles (July 2007) and 632 miles (July 2008) due to the addition of long haul connections and reductions in the number of short-haul connections.
B. Impacts on Access to the Air Transportation System During the period of steepest increase in fuel prices, July 2007-08, service was reduced for small and remote communities. For each of the airports that lost all service, the distance to the next nearest airport with traffic was calculated using Google Maps (2009)11, as shown in Figure 8. The average driving distance to the next nearest airport with service was 57 miles, corresponding to an average driving time of 75 minutes. The maximum driving distance was 208 miles, from Miles City, MN to Sheridan, WY. The percentage of the continental US population living within 40 miles of an airport with regular service dropped 1.4% to 88.9% July 2007-08, as shown in Figure 9. This was determined by calculating the great circle distance from year 2000 US census SF3 tract internal coordinates to the nearest airport with atleast one reported passenger departure per week, and cumulating the percent of the population.12 The number of airports with regular service increased July 2004-07, largely due to increases in Essential Air Service (EAS) funding, as discussed in Section V. The drop in the number of airports with regular service July 2007-08 resulted from a number of airlines serving small communities
Figure 8. Next Nearest Airport with Passenger Departures to Airports that Lost All Service, July 2007-08. Data Source: (Google, 2009)11
Figure 9. Continental US Access to Airports with Regular Service. Data Source: (BTS, 2010)6 (GeoLytics, 2000)12

10th AIAA Aviation Technology, Integration, and Operations Conference. September 13-15, 2010
7
suffering financially. The selection of new air service providers for EAS subsidized routes restored service to most airports by July 2009. Figure 9 shows that access to the national air transportation system for a significant portion of the population is sensitive to the financial viability of regional and commuter airlines, as well as government subsidies.
C. Impacts on Airlines Airlines suffered financially during the fuel
price surge, although regional and commuter airlines suffered relatively more July 2007-08. Eleven of 107 (10.3%) US passenger carriers ceased operations July 2007-08, of which ten were regional or commuter airlines. Virgin America and Lynx Aviation commenced operations during this time period. Although representing a large percentage of total airlines, airlines ceasing passenger operations accounted for only 1.5% of domestic ASM in July 2007. Thirteen passenger carriers declared bankruptcy in 2004-2005, including legacy carriers US Airways, Delta Air Lines and Northwest Airlines, although many of these carriers continued operations. The fuel surge of July 2007-08 demonstrated that smaller, regionally focused airlines tend to have less ability to handle the financial stress caused by fuel price increase and volatility. Grouping US carriers as Network Legacy Carriers (NLC), Low Cost Carriers (LCC), Regional, and Commuter (as defined in Appendix A), Table 3 shows that NLCs reduced domestic capacity most aggressively while LCCs added domestic available seat miles (ASM) market share, which increased from 18% in July 2004 to 26% in July 2008. Regional airlines were slower to cut capacity July 2007-08, with a 3.1% drop in ASM, but suffered a larger relative drop in demand with a 6.8% drop in revenue passenger miles (RPM). Much of the volatility in the number of airports with service was due to the cessation of operations of Air Midwest and Big Sky Airlines. These airlines were the sole carriers serving 20 communities of the 70 that lost all service. This demonstrates the sensitivity of small community access to individual airlines, especially regional airlines that may not have the same access to financing as large airlines. While US carriers reduced domestic capacity, NLCs increased international capacity 6.6% July 2007-08, as shown in Table 4, continuing recent trends. Although LCCs showed large relative gains in international traffic July 2004-08, LCCs provided less than 3% of US carrier international ASM in July 2008 while NLCs provided 94%. This increase in international capacity is part of a longer-term trend: NLC international ASMs increased 28% July 2004-08. These figures indicate a change in the primary provider of air transport in continental US as LCCs increase their market share, NLCs transfer capacity to international routes, and regional carriers focus on domestic routes.
IV. Potential Factors Influencing Airline and Passenger Decisions during the Fuel Price Surge This section proposes possible explanations of the observed effects on the air transportation system during the
fuel price surge. It should be noted that the US domestic aviation industry is highly competitive and that numerous exogenous factors influence stakeholder decisions. These exogenous factors include: economic activity, financial markets, competing modes of transportation, competition among airlines, airport construction, regulations, foreign affairs, terrorist events, and security concerns. This study aims to focus on the impacts of increases in the effective cost of fuel. Therefore, other exogenous events will not be discussed.
As shown in Figure 1, increases in the effective cost of fuel impact the air transportation system through the supply-side and the demand-side of the market for air transport. Supply-side effects include increases in direct operating costs of airlines, resulting in changes to networks and fleet assignments. Demand-side effects are due to reductions in economic activity, as well as passenger and freight sensitivity to fare increases.
Bruekner and Zhang (2010)13 explored the effect of airline emission charges on airfares, airline service quality, aircraft design features, and network structure by developing a theoretical model of competing duopoly airlines. Emission charges were included as an increase in the effective cost of fuel, although the volume of passengers was kept fixed to avoid complexity. Their research showed an increase in fuel price will lead to higher fares, lower flight
July 2004-08 July 2007-08 RPM ASM RPM ASM
NLC -2.1% -2.9% -4.5% -2.8% LCC 12.4% 12.1% 2.3% 5.9%
Regional 1.1% 0.8% -6.8% -3.1% 4
Table 3. Annualized Changes in US Carrier Domestic Supply and Demand, by Airline Class. Data Source: (BTS, 2010)6
July 2004-08 July 2007-08 RPM ASM RPM ASM
NLC 7.1% 7.1% 4.5% 6.6% LCC 18.4% 16.9% -2.3% -7.0%
Regional -5.4% -6.0% -25% -24%
Table 4. Annualized Changes in US Carrier International Supply and Demand, by Airline Class.6

10th AIAA Aviation Technology, Integration, and Operations Conference. September 13-15, 2010
8
frequency, a higher load factor, more fuel-efficient aircraft, and an unchanged aircraft size. Further, using a simplified network model, they showed that hub and spoke networks are strengthened by increases in effective fuel cost, except under certain conditions. This theoretical model helps to explain some of the effects observed during the fuel price surge.
A. Supply-Side Changes in the share of direct operating costs require airlines to alter their resource allocation. As fuel costs per ASM exceeded 5¢ (as shown in Figure 3), airlines altered their fleet assignments and network structures. While decreases in short-haul connections to thin demand markets has already been discussed, two other trends in airline decisions during the fuel price surge were observed: (1) a reduction in the utilization of fuel intensive aircraft, and (2) increased costs passed through to passengers. 1. Operating Fleet Aircraft fuel intensity, measured in gallons of fuel per available seat mile (ASM), varies by aircraft type and engine due to differences in design, weight, operations, and level of technology. Figure 10 shows variations in fuel intensity within and between aircraft classes.††14 Regional jets are generally more fuel intensive than turboprops of the same seat size, when adjusted for operating range. With increasing effective fuel costs, airlines have an economic incentive to reduce utilization of fuel intensive aircraft. The number of regional jets in US carrier fleets has increased dramatically since introduced in the 1990s. Increased fuel cost and changes to pilot scope clauses arrested this trend in 2006. The number of operating regional jets by US carriers increased 27% between Q3 2004-2006 to 1605, but declined 3.6% to 1548 in Q3 2008. When fuel prices spiked in 2008, airlines increased the number of operating turboprops in their fleets by ~41% from Q3 2007 to 274 (BTS Form 41 T2, 2010).6 Airlines increased utilization of turboprops and reintegrated parked turboprops into their fleet when fuel costs increased sharply. Figure 11 shows that airlines increased the miles flown of fuel-efficient aircraft while decreasing the miles flown of fuel inefficient aircraft July 2004-08. With a permanent increase in fuel cost, airlines are likely to replace fuel intensive aircraft with newer, fuel efficient models. These decisions could lead to a renewed interest in turboprop technology, reduced regional jet purchases, and will likely lead to substantial interest in next generation, fuel efficient aircraft, such as Boeing’s 787, Airbus’s A350, and Bombardier’s CSeries.
††Aircraft fuel intensity derived from Piano-X aircraft database. Fuel burn was calculated using the aircraft’s maximum payload at each R1 range quintile. Fuel intensity was calculated as the weighted average of fuel burn per available seat mile (ASM) at each R1 range quintile, based on 2006 operating range frequencies.
Figure 10. Aircraft Type Fuel Intensity. Data Source: Piano-X Aircraft Database14.
Figure 11. Change in Revenue Miles Flown by Aircraft Type Fuel Intensity (Aggregated for all US Airlines, July 2004-08)14

10th AIAA Aviation Technology, Integration, and Operations Conference. September 13-15, 2010
9
2. Fuel Cost Passed on to the Consumer in the Form of Airfare Increases Competition in the airline industry has resulted in a reduction in real fares since deregulation. Increased fuel costs have resulted in increased costs passed through to passengers in the form of fuel surcharges, increased fares, and de-bundling of services, such as checked bags and onboard meals. BTS (2009)15 reported average domestic air fares in the third quarter of 2008 to be $362, up 10.4% from the third quarter of 2007, and up 22% from the post-9/11 third quarter low of $297 in 2004. Increased airfares were not distributed evenly across the system. Passengers originating in non-hub airports experienced a 3.9% increase in the average airfares to $479 in Q3 2008 (BTS, 2010).16 Although passengers originating in non-hub airports generally face higher fares, they experienced a relatively smaller increase in airfares, likely due to these passengers’ shorter average segment stage lengths. Non-hub airports are generally connected to medium and large hub airports by short-haul connections flown in turboprops and regional jets. As stage length decreases, fuel cost as a percent of operating cost decreases, overtaken by maintenance and labor costs. Thus short-haul fares are less sensitive to fuel cost increase (Babikian, 2002)17. Figure 12 shows changes in US airline’s cost per available seat mile (ASM) and revenue per ASM between the third quarters of 2007 and 2008. Cost per ASM increased 3.00¢, of which 2.20¢ was due to the increase in fuel costs. This increase in cost was only offset by a 0.73¢ increase in revenue per ASM, eliminating the 2007 positive profit in the US airline industry (ATA, 2010)3. Between Q3 2004-08, fuel cost per ASM increased 3.57¢ while revenue per ASM increased only 2.48¢. As shown in Figure 1, increased costs impact supply through airfare pricing. Increased prices impact demand through the price elasticity of demand for air transportation. In the short- and medium-term time periods of this analysis, all of the increases in fuel costs were not passed through to passengers. In the longer term, with increased effective fuel costs, airfares will need to increase and/or non-fuel related costs will need to be trimmed to compensate for the change in direct operating costs, or the industry will not be financially sustainable.
B. Demand-Side The amount of fuel cost increase passed on to the consumer has an effect on demand for air transport through the price elasticity of demand. In general, when other influences on demand remain unchanged, a higher price for a product results in a lower quantity demanded. The price elasticity measures the sensitivity of demand to changes in the price. If the change in quantity demanded is greater than the change in price, the demand is said to be elastic, whereas if the change in quantity demanded is less than the change in price, the demand is said to be inelastic.
Figure 12. Cost and Revenue per ASM (Excluding Taxes) - Q3 2007 and 2008 Comparison. Data Source: (ATA, 2010)3
Figure 13. Price Elasticities of Demand for Air Transportation. Source: (Gillen, Morrison, & Stewart, 2008)18

10th AIAA Aviation Technology, Integration, and Operations Conference. September 13-15, 2010
10
Gillen, Morrison, and Stewart (2008)18 compiled multiple studies on the price elasticity of demand for air transportation, as shown in Figure 13. The price elasticity of demand was found to differ between short-haul and long haul travel, domestic and international, as well as between leisure (optional) and business (non-optional) travel. Short-haul, leisure travel was found to be the most price elastic while long-haul international business travel was found to be the least. Alternative modes of travel, such as rail, bus, and automobiles, are close substitutes to short-haul air transportation, whereas there are no close substitutes to long-haul air travel. It is expected that demand for air transport is less elastic for longer flights, and, as international travel is generally spread over more time than domestic travel - making airfare a smaller proportion of the overall trip cost - international travelers are generally less sensitive to changes in ticket prices. During the period of study it was found that connections to short-haul markets were reduced, average stage length increased, and international traffic grew. Airlines made strategic decisions on how to maintain revenues while facing higher operating costs. This led to reductions in service to short-haul markets in which passengers are more sensitive to airfare increases, and increases in international traffic for passengers less sensitive to airfare increases. Further, Airbus (2010)19 forecasts North American domestic passenger traffic to grow at 1.6%/year for the period 2009-2018, while passenger traffic to international destinations is forecasted to grow at a rate of 4.5%/year over the same time period. As the continental US market approaches saturation, airlines are seeking higher growth markets on which they are able to maintain higher yields (i.e. unit revenue).
V. Discussion The potential for future increases in the effective cost of fuel could have significant long-term social and
economic consequences, and could increase the rate at which commercial aviation adopts fuel efficient technologies and mitigating measures to reduce carbon emissions. In this section, behavior observed in the case study time periods is extrapolated to discuss potential future trends in the US air transportation system and their consequences.
A. Factors Influencing Future Effective Fuel Cost Two possible scenarios would result in higher effective fuel costs for commercial aviation: (1) government policy, and (2) crude oil markets. 1. Government Policy International accords or national governments may act to curtail carbon emissions by instituting emission taxes or cap and trade policies. This would increase direct operating costs associated with fuel burn through the need to purchase offsets on carbon exchanges or pay increased fuel taxes. It is expected that such measures would be phased in over a number of years, providing an adjustment period, and would not lead to a similar spike in fuel costs as experienced during the fuel price surge. The American Clean Energy and Security Act, H.R. 2454 (commonly referred to as the Waxman-Markey Climate and Energy Bill) passed the House of Representatives in July 2009, but did not become law. Under Waxman-Markey, the EPA (2009)20 estimated a permit to emit one ton of carbon dioxide would be worth $11-$15 in 2012 (2005 dollars), increasing to $22-$28 in 2025 (2005 dollars). Assuming a system fuel intensity of 0.016 gallons/ASM, emissions permits would result in increased unit costs in the range 0.2-0.5¢/ASM for airlines, representing ~8-21% of the unit cost increase that occurred Q3 2007-08. This cost increase is significant and would be in addition to the cost of any increase in market prices for crude oil, likely reducing the economy’s demand for oil, resulting in secondary effects on forecasted business-as-usual oil prices. 2. Crude Oil Markets International markets may continue to provide high volatility in the price of crude oil and jet fuel. Further, under peak oil scenarios, the worldwide supply of oil would decrease, resulting in increasing fuel costs if demand for oil does not slacken. Without economical, technologically mature, and safety certified energy substitutes, commercial aviation would continue to rely on oil derived jet fuel at increased prices. EIA’s Annual Energy Outlook (2010)21
reference case forecasts jet fuel prices to reach $2.93/gallon by 2020 and $3.58/gallon by 2035 (2008 dollars), as shown in Figure 14. The low/high oil price case provides forecasts depending on more optimistic/pessimistic assumptions for economic access to non-OPEC resources and for OPEC behavior. In the high oil price case, jet fuel is forecasted to climb to $4.72/gallon by 2020 and $5.33/gallon (2008 dollars) by 2035. It is likely that jet fuel prices will remain volatile and may repeat events similar to the fuel price surge examined in this paper.

10th AIAA Aviation Technology, Integration, and Operations Conference. September 13-15, 2010
11
Increased oil-based fuel costs would create an incentive to transition to long-term purchase agreements of alternative fuels and to reduce fuel burn through the implementation of efficiency measures in aircraft design, operations, and air transportation networks.
B. Fuel Efficiency Measures In order to reduce the effects of
increasing effective fuel costs, airlines can adopt fuel efficiency improvements using a portfolio of measures that include technology improvements, operation optimizations, and alternative fuels (Sgouridis, Bonnefoy, and Hansman 2009)22. Engine and aerodynamic efficiency have historically improved at a rate of 1.5% and 0.4% per year, respectively (Lee et. al., 2001)23. This trend continued in the past decade, as shown in Figure 15. US domestic passenger carrier fuel intensity decreased an average of 1.6%/year 2000-2009, as calculated by fuel issued and ASM reported on BTS Form 41 Schedule T2.
Aircraft require long research and development times and the turnover time for the global aviation fleet is approximately 20-25 years, so it is unlikely that these efficiency improvement rates will increase dramatically fleet wide in the near future. In the short term, new operational procedures may reduce fuel burn, although infrastructure changes have significant lead times (Lee et. al. 2009)24. Fuel efficiency measures are unlikely to buffer airlines from volatility in crude oil prices and increases in the effective cost of fuel, motivating the need to understand how air transportation systems will adapt and what the potential social and economic consequences are from increases in the effective cost of fuel.
C. Social and Economic Impacts of Reductions in Air Service Goetz and Sutton (1997)25 used a core-periphery structure to explain the geographic effects of deregulation on the airline industry from 1978-1993. Their findings showed that core centers (the large hubs and international gateways, such as Chicago, Atlanta and New York) benefited more than the periphery spoke cities from increased air transportation employment, frequency of service, passenger flow, and lower fares, except where one or two airlines dominated a hub. If the observed impacts of the fuel price surge were to become permanent, lasting social and economic effects could occur, continuing the geographic trends of deregulation. Airports provide numerous benefits to their region of service, including: reduced travel time and cost, enable businesses and healthcare procedures requiring time sensitive shipments, civil defense, stimulation of regional business, access to the national airport system, and recreation. Economic impacts have been described as direct, indirect, induced, and catalytic. The direct and indirect regional economic impacts of airports can be estimated using FAA guidelines. These impacts scale with the number of commercial passengers and airport-based aircraft. In 1992, Butler and Kiernan26 estimated an airport with 50 based aircraft induced an annual benefit of $615,500 and provided annual payroll of $304,500, while an airport with 50 based aircraft and 50,000 annual commercial customers induced $1,672,500 of annual benefit and $1,827,000 of annual payroll (1992 dollars). Reductions in service and the acompanying passenger traffic to small airports could limit the financial viability of many airports, depriving inhabitants in the airport’s catchment area of these benefits.
Figure 14: EIA Jet Fuel Price Forecast. Data Source: (EIA, 2010)21
Figure 15. US Passenger Carrier Domestic Fuel Intensity, 2000-2009. Data Source: (BTS Form 41 T2,2010)6

10th AIAA Aviation Technology, Integration, and Operations Conference. September 13-15, 2010
12
Malina, Schwab and Wollersheim (2007)27 used a contingent valuation approach for a secondary airport in Germany and its catchment area to quantify the catalytic effect for regional economies that are induced by airports. Their study provided insights as to which industries benefit the most from the airport and the value companies place on airports. Ishutkina and Hansman (2008)28 described the interaction between air transportation and economic activity in different regions of the world. By examining links between economic development and air tranportation, they showed how different regions have developed air transportation systems to generate comparative advantages. For example, the diversification of the United Arab Emirates economy to include logistics operations, tourist attractions, and the fresh flower industry. Jamaica is dependent on air transportation to bring tourists to the island whose spending promotes economic growth. If a large number of communities in the United States were to lose access to the air transportation system, economic opportunties that paralell those experienced at the international level could be lost at the local level. This potentialility could warrant government action.
D. Public Policies to Reduce Social and Economic Impacts To ensure small communities maintained a link to the national air transportation system, Congress established the Essential Air Service (EAS) program when it passed the Airline Deregulation Act in 1978. EAS provides subsidies to airlines for otherwise unprofitable routes between communities that had air service prior to deregulation and hub airports. A reduction in the financial viability of service to small communities may result in increased government subsidies to commercial aviation in attempts to maintain regional benefits. Figure 16 shows that continental US EAS subsidies have doubled from $79.5 million in 2003 to $163 million in 2010.8 The largest annual increase occurred between 2007 and 2008 when subsidies increased $34.5 million to $131 million. The recent trend has been for more communities to require subsidized service as the number of continental US communities receiving subsidized service increased 19%, from 90 in 2003 to 107 in 2010. In July 2007, the population in the catchment areas‡‡ of the communities with regular service provided by EAS subsidized routes averaged ~170,000, for a total of ~6% of the continental US population, based on year 2000 census data.12 EAS subsidies improve access to the national air transportation system for a significant portion of the population. Historically, governments have intervened to provide subsidies to commercial aviation proceeding calamitous events, such as 9/11. Industry adjustment to permanent increases in the effective cost of fuel could result in further government subsidies. In 2008, three EAS carriers serving 37 communities ceased operations. 30 communities were temporarily without EAS air service for up to 10 months and 6 for a longer period of time (GAO, 2009)9. Although the EAS mechanism was able to return service to these communities, this prolonged interruption likely resulted in social and economic effects of lost air service. The number of carriers providing EAS service has declined from 34 in February 1987 to 10 in May 2010. In the event of future shocks to the airline industry it is likely that small communities will face interruptions in air service. Changes to the EAS mechanism may be required to mitigate negative impacts. GAO (2003)29 recommended more flexibility to be built into the EAS program, including eliminating subsidized service to certain communities that are relatively close to other larger airports, providing eligible communities with grants to allow them to tailor air service to unique local needs, and allowing carriers to operate smaller aircraft that are more suited to local levels of demand. If small communities continue to require more subsidies to maintain air service, Congress will need to decide what level of access to air service is acceptable and what level of subsidies it is willing to provide. Although non-hub airports account for ~72% of continental US airports with commercial service, they account for only ~9% of departures, which are generally performed in smaller aircraft over shorter stage
‡‡ Catchment area defined as the area of shortest great circle distance to the airport, as calculated using Thiessen polygons in ESRI’s ArcGISTM.
Figure 16. EAS Subsidies and Continental US Communities Served by EAS. Source: (Office of Aviation Analysis, 2010)8

10th AIAA Aviation Technology, Integration, and Operations Conference. September 13-15, 2010
13
lengths, resulting in smaller environmental impacts than large jets from large airports. When considering climate change and energy legislature, Congress will need to weigh the social and economic benefits of air service in small communities against the limited potential for reductions in environmental impacts.
VI. Conclusions Using the 2004-08 fuel price surge as a natural experiment, it has been shown that connections to non-hub
airports serving small communities were most sensitive to effective fuel cost increases. It was found that non-hub airports lost 12% of connections, compared to an average loss of 2.8%, July 2004-08. The complete loss of service July 2007-08 at 70 non-hub airports, representing 14% of continental US airports with commercial service, resulted in an average driving time of 75 minutes to the next nearest airport with service. It is believed that reduced access to the national air transportation system had social and economic effects for small communities. The cessation of operations of Air Midwest and Big Sky Airlines, the sole carriers serving 20 communities in July 2007, resulted in much of the volatility in airports with service 2007-08. Regional and commuter airlines were less able to handle fuel cost volatility during this period as ten declared bankruptcy. To maintain historic levels of access to the air transportation system, funding for Essential Air Service (EAS) subsidized routes has doubled since 2003 while the number of continental US communities serviced by subsidized routes has increased 19% to 107 in 2010. Even though subsidies have increased, 36 airports were without service for 10 months or longer following the 2008 fuel price surge. If small communities continue to require more subsidies to maintain air service, Congress will need to decide what level of access to air service is acceptable, what level of subsidies it is willing to provide, and how flexibility can be designed into programs to reduce interruptions in air service to small communities in the future.
Increases in the effective cost of aviation fuel could result from escalating crude oil prices and environmental driven costs (i.e. from cap and trade schemes or taxes). Complementary analyses of aircraft fuel efficiency, airline economics, and airfares provided a basis for understanding some airline decisions during the fuel price surge that can be extrapolated to examine future trends. Increased effective fuel costs will provide incentives for airlines to improve fleet fuel efficiency, reducing the environmental effects of aviation, but may cause an uneven distribution of social and economic impacts as airline networks adapt. As fuel costs increased 2004-08, utilization of older and fuel inefficient aircraft was reduced while the number of operating turboprops increased. Permanent effective fuel cost increase will likely lead to increased adoption rates of CO2 mitigating measures which reduce fuel burn, such as aircraft technology innovations, optimized operational procedures, and network changes. Benefits due to reductions in the environmental impacts of aviation may be balanced by social and economic costs. Government action may be required to determine acceptable levels of access to service as the air transportation system transitions to higher fuel costs.
Acknowledgments The authors would like to thank the MIT Partnership on AiR Transportation Noise & Emissions Reduction
(PARTNER) for access to the Piano-X software package and Brian Yutko for his assistance in its use. This work was supported by the MIT/Masdar Institute of Science and Technology under grant number Mubadala Development Co. Agreement 12/1/06.
Appendix A: Airline Classification Although it is expected that carriers within the same classification vary significantly in their businesses, markets,
and operations, airlines were classified to simplify the presentation of data. The following categories were used to group airlines with similar business models, based on common practices found in the literature and the authors’ discretion. The top two US airlines in each category, by July 2007 available seat miles (ASM), are listed:
• Network Legacy Carrier (NLC) – airlines that flew interstate routes prior to deregulation in 1978, have
international operations, and are certified under Part 121 of Title 14 of the Code of Federal Regulations, including American Airlines and United Air Lines.
• Low Cost Carrier (LCC) – airlines that have a stated low fare business model, and are certified under Part 121 of Title 14 of the Code of Federal Regulations, including Southwest Airlines and JetBlue Airways.
• Regional – feeder, charter, and commuter airlines that fly aircraft less than 100 seats, and are certified under Part 121 of Title 14 of the Code of Federal Regulations, including Skywest Airlines and Expressjet Airlines.
• Commuter – commuter and on demand airlines that are certified under Part 135 of Title 14 of the Code of Federal Regulations, including Hageland Aviation Service and Boston-Maine Airways.
10th AIAA Aviation Technology, Integration, and Operations Conference. September 13-15, 2010
14
References
1Air Transportation Association. (2010, May). ATA Monthly Jet Fuel Cost and Consumption Report. Retrieved June 18, 2010, http://www.airlines.org/Energy/FuelCost/Pages/MonthlyJetFuelCostandConsumptionReport.aspx
2Tam, Ryan & R. John Hansman. (2003). An Analysis of the Dynamics of the US Commercial Air Transportation System (Master thesis). Retrieved from http://web.mit.edu/aeroastro/labs/icat/research.shtml
3Air Transportation Association. (2010, May). Quarterly Cost Index: U.S. Passenger Airlines. Retrieved June 18, 2010, from http://www.airlines.org/Economics/DataAnalysis/Pages/QuarterlyCostIndex.aspx
4National Transportation Safety Board. (2009, May). Accidents Involving Passenger Fatalities U. S. Airlines (Part 121) 1982 - Present. Retrieved June 12, 2010, from http://www.ntsb.gov/aviation/Paxfatal.htm
5Bureau of Economic Analysis (BEA). (2010, July 30). National Economic Accounts. Retrieved August 2, 2010, from http://www.bea.gov/national/index.htm#gdp
6Bureau of Transportation Statistics (BTS). (2010). Form 41 T100 and T2. Retrieved January 27, 2010, from http://www.transtats.bts.gov/
7Federal Aviation Administration (FAA). (2008). Report to Congress: National Plan of Integrated Aiport Systems 2009-2013.
8Office of Aviation Analysis. (2010). Essential Air Service Program. Retrieved June 16, 2010, from http://ostpxweb.dot.gov/aviation/x-50%20role_files/essentialairservice.htm
9Government Accountability Office. (2009). Airline Industry Contraction Due to Volatile Fuel Prices and Falling Demand Affects Airports, Passengers, and Federal Government Revenues.
10Cento, A. (2009). The Airline Industry: Challenges in the 21st Century. Segrate, Italy: Physica-Verlag Heidelberg.
11Google. (2009). Google Maps. Retrieved December 16, 2009, from http://maps.google.com/ 12GeoLytics. (2000). Census 2000 Demographic Data Products. East Brunswick, NJ, USA. 13Brueckner, J. K., & Zhang, A. (2010). Airline emission charges: Effects on airfares, service quality, and
aircraft design. Transportation Research Part B. doi:10.1016/j.trb.2010.02.006 14Lissys. (2009). Piano-X. Retrieved January 27, 2010, from http://www.lissys.demon.co.uk/index2.html 15Bureau of Transportation Statistics (BTS). (2009, January 28). Average Third-Quarter Domestic Air Fares
Reach Highest Quarterly Level; Top 100 Airports: Highest Fare in Cincinnati, Lowest Fare at Dallas Love. Retrieved February 3, 2010, from http://www.bts.gov/press_releases/2009/bts005_09/html/bts005_09.html
16Bureau of Transportation Statistics (BTS). (2010). Average Domestic Airline Itinerary Fares By Origin City. Retrieved June 12, 2010, from http://www.transtats.bts.gov/AverageFare/
17Babikian, R., Lukachko, S. P., & Waitz, I. A. (2002). The historical fuel efficiency characteristics of regional aircraft from technological, operational, and cost perspectives. Journal of Air Transport Management , 8, 389-400.
18Gillen, D. W., Morrison, W. G., & Stewart, C. (2008). Air Travel Demand Elasticities: Concepts, Issues and Measurement. Government of Canada, Department of Finance Canada.
19Airbus. (2009). Global Market Fortecast 2009-2028. 20Environmental Protection Agency. (2009, June). American Clean Energy and Security Act of 2009 - H.R. 2454.
Retrieved July 22, 2010 from http://www.epa.gov/climatechange/economics/economicanalyses.html#hr2454 21Energy Information Administration. (2010, May 11). Annual Energy Outlook 2010. Retrieved June 28, 2010,
from http://www.eia.doe.gov/oiaf/aeo/ 22Sgouridis, S., Bonnefoy, P. A., & Hansman, R. J. (2009). Air Transportation in a Carbon Constrained World:
Long-term Dynamics of Policies and Strategies for Mitigating the Carbon Footprint of Commercial Aviation. Transportation Research Part A .
23Lee, J., Lukachko, S., Waitz, I., & Schafer, A. (2001). Historical and Future Trends In Aircraft Performance, Cost, and Emissions. Annual Review Energy Environ , 26, 167-200.
24Lee, D.S., Pitari, G., Grewe, V., Gierens, K., Prenner, J., Petzold, A., et al. (2009). Transport impacts on atmosphere and climate: Aviation. Atmospheric Environment .
25Goetz, A. R., & Sutton, C. J. (1997). The Geography of Deregulation in the U.S. Airline Industry. Annals of the Association of American Geographers , 87 (2), 238-263.
26Butler, S. E., & Kiernan, L. J. (1992). Estimating the Regional Economic Significance of Airports. FAA, National Planning Division.
27Malina, R., Schwab, M., & Wollersheim, C. (2008). Using a Contingent Valuation Approach for Evaluating the Benefits of Airports for Regional Economies.
28Ishutkina, M. A., & Hansman, R. J. (2008). Analysis of Interaction between Air Transportation and Economic Activity. AIAA 8th Aviation Technology, Integration, and Operations Conference.Anchorage, Alaska.

10th AIAA Aviation Technology, Integration, and Operations Conference. September 13-15, 2010
15
29Government Accountability Office. (2003). Factors Affecting Efforts to Improve Air Service at Small
Community Airports.