Embed Size (px)
Citation preview

Investigation of the Electronic Structure and Reactivity of
Non-Heme Iron Nitrosyl and Nitroxyl Complexes
By
Amy L. Speelman
A dissertation submitted in partial fulfillment
of the requirements for the degree of
Doctor of Philosophy
(Chemistry)
in the University of Michigan
2016
Doctoral Committee:
Associate Professor Nicolai Lehnert, Chair
Professor Vincent L. Pecoraro
Professor Stephen W. Ragsdale
Assistant Professor Nathaniel K. Szymczak

ii
Acknowledgements
First, I have to thank Nicolai for his mentorship over the last 6 years. I have grown
immensely as a scientist in my time here, and it would not have been possible without him. I would
also like to thank my committee members past and present (Professors Vince Pecoraro, Stephen
Ragsdale, Nate Szymczak, and Mi Hee Lim) for their invaluable feedback during my committee
meetings. Finally, I would not have gotten where I am today without a series of great teachers and
research mentors as an undergraduate. I’d like to particularly thank Professors Brent Krueger and
Jason Gillmore at Hope College.
The Lehnert group has been an amazing place to work for the last 6 years thanks to all of
the great people I have been surrounded by. I want to specifically thank Tim Berto and Lauren
Goodrich for mentoring me as I first started out in lab. I would also like to thank Shawn Eady and
Ashley McQuarters, who were always ready to discuss the highs and lows of research and
commiserate with me. I will always fondly remember our conference boat trips.
I have worked in collaboration with several research groups during my time here. I would
like to specifically thank our collaborators Dr. Bo Zhang and Prof. Carsten Krebs, who obtained
the Mössbauer data described in this thesis and provided very insightful feedback on the project
as a whole. I would also like to acknowledge all of the technical staff who helped make the results
presented here possible, specifically Dr. Jeff Kampf, Jim Windak, and Roy Wentz at the University
of Michigan and Dr. Michael Hu and Dr. Jiyong Zhao at the Advanced Photon Source.

iii
During my time here, I was fortunate enough to receive both an NSF-GRFP fellowship
and a Rackham Predoctoral Fellowship, and I’d like to thank the NSF and Rackham Graduate
School for their financial support.
Finally, I have to thank my friends and family. I would not have made it through the last
6 years without your support and encouragement.
iv
Table of Contents
Acknowledgements ....................................................................................................................... ii
List of Tables ................................................................................................................................ vi
List of Figures .............................................................................................................................. vii
List of Schemes ........................................................................................................................... xiv
Abstract .........................................................................................................................................xv
Chapter 1. Introduction ................................................................................................................1
1.1 Nitric Oxide and Nitroxyl in Biology ....................................................................................1
1.2 Nitric Oxide Reductases .........................................................................................................3
1.3 Electronic Structure of High-Spin Iron Nitrosyl Complexes ...............................................11
1.4 Scope of Thesis ....................................................................................................................13
1.5 References and Notes ...........................................................................................................15
Chapter 2: Characterization of a High-Spin {FeNO}6-8 Series ................................................21
2.1 Synthesis and Spectroscopic Characterization of {FeNO}7 Complexes ..............................22
2.2 Generation and Spectroscopic Characterization of the {FeNO}6-8 Series ...........................26
2.3 Electronic Structure of {FeNO}6-8 Series.............................................................................45
2.4 Reactivity of {FeNO}8 Complex: Generation of a High-Spin {FeNHO}8 Complex ..........51
2.5 Experimental Section ...........................................................................................................64
2.6 References and Notes ...........................................................................................................72
Chapter 3: Reduction of Mono- and Di-nuclear Non-Heme {FeNO}7 Complexes ................78
3.1 Synthesis and Characterization of Non-Heme {FeNO}7 Complexes ..................................79
3.2 Reduction of High-Spin Non-Heme Iron Nitrosyls .............................................................87
3.3 Synthesis and Reactivity of BPMP [{FeNO}7]2 Dimers ......................................................91
3.4 Experimental Section ...........................................................................................................94
3.5 References and Notes .........................................................................................................108
Chapter 4: Synthesis and Electronic Structure of Dinitrosyl Iron Complexes ....................110
4.1 Generation and Spectroscopic Characterization of the dmp {Fe(NO)2}9 DNIC ...............113

v
4.2 Mechanism of DNIC Formation ........................................................................................116
4.3 Mössbauer Spectroscopy ....................................................................................................124
4.4 Nuclear Resonance Vibrational Spectroscopy (NRVS) .....................................................126
4.5 DFT Calculations of Structural and Spectroscopic Parameters .........................................128
4.6 Assignment of DNIC NRVS Features and Determination of Force Constants for the Fe(NO)2
Unit Using QCC-NCA .............................................................................................................131
4.7 Electronic Structure ............................................................................................................136
4.8 Experimental Section .........................................................................................................140
4.9 References and Notes .........................................................................................................144
Chapter 5: Conclusions .............................................................................................................149
5.1 Summary of Thesis .............................................................................................................149
5.2 Future Directions ................................................................................................................154
5.3 References ..........................................................................................................................156
vi
List of Tables
Table 2.1 Structural parameters and N-O stretching frequencies for 1,
[Fe(TMG2dien)(NO)(OTf)](OTf), and K[Fe(LR)(NO)] .........................................................25
Table 2.2 Bond lengths and angles for 1, 3, and selected compounds from the literature ............29
Table 2.3 Parameters for correlated fit of the UV-Vis and MCD spectra of complex 1. ..............33
Table 2.4 Parameters for correlated fit of the UV-Vis and MCD spectra of complex 2 ..............35
Table 2.5 Mössbauer parameters of 1-3 and selected compounds from the literature. .................44
Table 2.6 Comparison of experimental and DFT-calculated geometric and spectroscopic
parameters for 1-3 ...................................................................................................................45
Table 2.7 Comparison of the spectroscopic parameters of 1-3 to selected low-spin compounds
from the literature ...................................................................................................................49
Table 2.8 Parameters for correlated fit of the UV-Vis and absorption spectra of complex 4 ......55
Table 3.1 Key geometric parameters and N-O stretching frequencies for complexes 1-7 and
selected compounds from the literature ..................................................................................81
Table 3.2 Comparison of selected bond distances (in Å) and angles (in °) for 1 and 9. ...............93
Table 4.1 Spectroscopic and structural parameters for selected cationic {Fe(NO)2}9 and neutral
{Fe(NO)2}10 DNICs .............................................................................................................115
Table 4.2 Mössbauer parameters for sets of {Fe(NO)2}9 and {Fe(NO)2}
10 DNICs ...................126
Table 4.3 Comparison of experimental bond lengths and spectroscopic parameters to DFT-
calculated values for {Fe(NO)2}9 DNIC 1............................................................................129
Table 4.4 Comparison of experimental bond lengths and spectroscopic parameters to DFT-
calculated values for {Fe(NO)2}10 DNIC 2 ..........................................................................130
Table 4.5 Key force constants (in mdyn/Å or mdyn•Å) for the Fe(NO)2 unit in 1 and 2 ...........134
Table 4.6 Assignment of NRVS features and comparison of {57Fe(NO)2}9 experimental, DFT-
calculated, and QCC-NCA fitted energies ............................................................................135
Table 4.7 Assignment of NRVS features and comparison of {57Fe(NO)2}10 experimental, DFT-
calculated, and QCC-NCA fitted energies. ...........................................................................135
vii
List of Figures
Figure 1.1 Left: Crystal structure of the ferric NO bound form of Fusarium oxysporum P450nor
(PDB ID 1CL6). Right: Proposed mechanism for N2O formation in P450nor. .......................4
Figure 1.2 Crystal structure of diferric oxo-bridged resting state of the Pseudomonas aeruginosa
NorBC active site (PDB ID 3O0R). .........................................................................................5
Figure 1.3 Crystal structure of the diferrous active site of the Moorella thermoacetica FNOR
(PDB ID 1YCG) shown with the proximal flavin cofactor ......................................................8
Figure 1.4 Crystal structure of the model complex [Fe(BPMP)(OPr)(NO)2](BPh4)2. Hydrogen
atoms and tetraphenylborate counterions have been omitted for clarity ................................11
Figure 2.1 X-band EPR spectrum of 1 in frozen 1:1 propionitrile:butyronitrile solution recorded
at 4.2 K ....................................................................................................................................23
Figure 2.2 (a) Crystal structure of complex 1. Hydrogen atoms, outer-sphere triflate counterions
and solvent molecules (CH2Cl2) have been omitted for clarity. Key bond distances and
angles are given in Table 2.1. (b) Top-down view of a spacefilling model highlighting the
steric protection of the Fe-N-O unit. .......................................................................................24
Figure 2.3 (a) Crystal structure of [Fe(TMG2dien)(NO)(OTf)](OTf). Hydrogen atoms and the
outer-sphere counterion have been omitted for clarity. Key bond distances and angles are
given in Table 2.1. (b) Top down view of a spacefilling model. ............................................25
Figure 2.4 Cyclic voltammogram of complex 1 in acetonitrile at variable scan rates .................26
Figure 2.5 (a) Cyclic voltammogram of [Fe(TMG2dien)(NO)(OTf)](OTf) in CH3CN. (b)
Solution IR of [Fe(TMG2dien)(NO)](OTf)2 before (black) and after (red) treatment with
cobaltocene in CD3CN. ...........................................................................................................27
Figure 2.6 (a) EPR spectra of 1 (black), 3 (red), and the product of the decomposition of 3 (blue)
after 25 minutes at room temperature in CH3CN. (b) Solution IR spectra showing the
product of the decomposition of 3 at room temperature. Spectra showing the decomposition
of [Fe(TMG3tren)](OTf)2 upon oxidation with thianthrene radical cation are shown for
comparison in the bottom panel. ............................................................................................28

viii
Figure 2.7 Crystal structure of complex 3. Protons, outer-sphere tetrafluoroborate counterions,
and solvent molecules (CH3CN) have been omitted for clarity. ............................................29
Figure 2.8 UV-Visible spectroscopy showing the bulk electrolysis of 1 to 2 at high and low
concentration in CH3CN .........................................................................................................30
Figure 2.9 UV-Visible spectroelectrochemistry showing the oxidation of 1 to 3 in CH3CN ......31
Figure 2.10 UV-Visible (top, recorded at room temperature) and MCD (bottom, recorded at 2 K)
spectra of complex 1. The colored lines represent a correlated Gaussian deconvolution of the
data (see Table 2.3) .................................................................................................................33
Figure 2.11 Magnetic saturation curves for the MCD features at (a) 356 nm (band 7), (b) 386 nm
(band 6), and (c) 550 nm (band 2). The experimental data are shown as points. Preliminary
fits are shown as solid lines with the polarizations indicated in the figure ............................34
Figure 2.12 UV-Visible (top, recorded at room temperature) and MCD (bottom, recorded at 2 K)
spectra of complex 2. The colored lines represent a correlated Gaussian deconvolution of the
data (see Table 2.4). ................................................................................................................35
Figure 2.13 VTVH saturation curves for the MCD features at (a) 382 nm (band 9) and (b) 542
nm (band 5) in complex 2. The saturation curves for the other MCD features are very
similar. ....................................................................................................................................36
Figure 2.14 IR spectroelecrochemistry showing the reduction of 1 to 2 in CD3CN. The spectrum
with natural abundance NO is shown on the top, and the spectrum with isotopically labeled
15NO is shown on the bottom..................................................................................................37
Figure 2.15 IR spectroelectrochemistry showing the oxidation of 1 to 3 in CD3CN. The spectrum
with natural abundance NO is shown on the top, and the spectrum with isotopically labeled
15N18O is shown on the bottom. ..............................................................................................38
Figure 2.16 NRVS spectra of complexes 1 (middle), 2 (top), and 3 (bottom). The spectra with
natural abundance NO are shown as thick lines, and the corresponding isotopically labeled
15N18O are shown as thin lines ...............................................................................................39
Figure 2.17 1H NMR spectra (CD3CN) of {FeNO}7 complex 1 (b), {FeNO}8 complex 2 (a), and
{FeNO}6 complex 3 (c) ..........................................................................................................40
Figure 2.18 4.2-K/variable-field (// = parallel, = perpendicular magnetic field) Mössbauer
spectra of a 5 mM solution of the {57FeNO}7 complex 1 in 1:1 propionitrile:butyronitrile .42
ix
Figure 2.19 (a) 4.2-K/53-mT (applied parallel to the γ–beam) Mössbauer spectrum of a sample
containing 5 mM solution of the {57FeNO}8 complex 2 in 1:1 propionitrile:butyronitrile. The
solid blue line is the experimental spectrum of {57FeNO}7 complex 1 recorded under
identical conditions and scaled to 16% of the total intensity. (b) Spectrum of the {57FeNO}8
complex 2 generated by removal of the contribution from 1. The solid red line is the
simulation of the {57FeNO}8 complex with δ = 0.84 mm/s and |ΔEQ| = 2.78 mm/s .............43
Figure 2.20 4.2-K/53-mT parallel field (//) Mössbauer spectrum of a 5 mM solution of the
{57FeNO}6 complex 3 in 1:1 propionitrile:butyronitrile (black vertical bars) overlaid with a
quadrupole doublet simulation using the parameters δ = 0.06 mm/s and |ΔEQ| = 0.48 mm/s
................................................................................................................................................44
Figure 2.21 Schematic MO diagram for complex 1......................................................................46
Figure 2.22 Schematic MO diagrams for complexes 1-3 .............................................................47
Figure 2.23 Titration of {FeNO}8 complex 2 with [HNEt3][PF6] in 1:1 propionitrile:butyronitrile
at 70°C showing conversion to the {FeNHO}8 complex 4 upon addition of 1 equivalent of
acid .........................................................................................................................................52
Figure 2.24 (a) UV-Visible spectrum showing the protonation of 2 to give 4 at 70°C in 1:1
propionitrile:butyronitrile, and deprotonation of 4 after 10 minutes to give 2. (b) UV-Visible
spectrum showing the slow decomposition of 4 at 70°C in acetone ...................................52
Figure 2.25 UV-Visible spectra showing the slow addition of 2 equivalents of [OMe3][BF4] to 2
(green) at 70°C in 1:1 propionitrile:butyronitrile resulting in partial conversion to the
{FeN(Me)O}8 complex 5 ........................................................................................................54
Figure 2.26 UV-Visible (top, recorded at 70°C) and MCD (bottom, recorded at 4 K) spectra of
4 in 1:1 propionitrile:butyronitrile. The colored lines represent a correlated Gaussian
deconvolution of the data ........................................................................................................55
Figure 2.27 VTVH MCD saturation curves for the bands at (a) 380 nm and (b) 533 nm in 4 .....56
Figure 2.28 MCD spectrum of complex 5 ....................................................................................56
Figure 2.29 4.2 K low-field (53 mT //) Mössbauer spectrum of a 5 mM solution of 4 in frozen
1:1 propionitrile: butyronitrile ...............................................................................................57
Figure 2.30 4.2 K low-field (53 mT //) Mössbauer spectrum of a 5 mM solution of 5 in frozen
1:1 propionitrile: butyronitrile ...............................................................................................57

x
Figure 2.31 Correlation of experimental and DFT-calculated Mössbauer isomer shifts for
TMG3tren complexes .............................................................................................................59
Figure 2.32 Orbital showing the highly covalent interaction between the Fe dxz/yz and HNO *
orbitals ...................................................................................................................................60
Figure 2.33 NRVS spectra of frozen propionitrile solutions of complex 4 (a, 10 mM; b, 7.5 mM)
measured on two separate occasions .....................................................................................61
Figure 2.34 Solution IR spectra of 2 after treatment with 1 equivalent of [HNEt3][PF6] at room
temperature in propionitrile. The spectrum with natural abundance NO is shown in black,
and the corresponding spectrum with 15NO is shown in red. .................................................62
Figure 2.35 FT-IR spectrum (KBr pellet) of 1 (red) and 1-15NO (blue) shown with the precursor
complex [Fe(TMG3tren)(CH3CN)](OTf)2 in black. ...............................................................66
Figure 2.30 (a) FT-IR spectrum (KBr pellet) of [Fe(TMG2dien)(NO)(OTf)](OTf) and the
corresponding ferrous precursor. (b) UV-Visible spectra of
[Fe(TMG2dien)(NO)(OTf)](OTf) at low (left) and high (right) concentration in
dichloromethane. (c) X-band EPR spectrum of [Fe(TMG2dien)(NO)(OTf)](OTf) recorded at
4.2 K in frozen 1:1 propionitrile:butyronitrile ........................................................................67
Figure 3.1 Crystal structures of complexes 2 (a), 3 (b), 4 (c), and 6 (d). ......................................81
Figure 3.2 EPR spectra of complexes 2 and 4 (5 mM in CH2Cl2) recorded at 4.2 K ...................82
Figure 3.3 (a) EPR spectra of 6 in frozen CH2Cl2 solution (top) and in frozen CH3CN solution
(bottom) recorded at 4.2 K. (b) Solution IR spectra of 6 in CH2Cl2 solution (top) and in
CD3CN solution (bottom). ......................................................................................................84
Figure 3.4 Solution IR spectra in CH2Cl2 comparing (a) dimeric phenoxo-bridged complexes 2
and 3 (b) monomeric complexes 4 and 5 and (c) monomeric TPA derivatives 6 and 7. .......85
Figure 3.5 (a) Cyclic voltammogram of complex 2 in CH2Cl2 containing 0.1 M NBu4ClO4 as
supporting electrolyte. Scan rate: 200 mv•s-1. (b) IR spectrum of a 7.5 mM solution of 2 in
CH2Cl2 solution following treatment with cobaltocene at 5 minutes (red) and 45 minutes
(blue). ......................................................................................................................................87
Figure 3.6 (a) Cyclic voltammogram of complex 4 in CH2Cl2 containing 0.1 M NBu4ClO4 as
supporting electrolyte. Scan rate: 200 mV•s-1. (b) Solution IR spectra of 4 (black) and of 4
treated with cobaltocene (red). ...............................................................................................88

xi
Figure 3.7 (a) Cyclic voltammogram of complex 6 in CH2Cl2 containing 0.1 M NBu4PF6 as
supporting electrolyte. Scan rate: 250 mV•s-1. (b) IR spectroelectrochemistry showing the
reduction of 6 in CH2Cl2. ........................................................................................................90
Figure 3.8 Solution IR spectrum (in CH2Cl2) showing the product of the reaction of 8 with one
equivalent of cobaltocene (per dimer). ...................................................................................92
Figure 3.9 (a) Crystal structure of 1. (b) Preliminary crystal structure of 9 .................................93
Figure 3.10 UV-Visible spectrum of [Fe(BMPA-tBu2PhO)(OTf)] before (black) and after (red)
exposure to air ........................................................................................................................95
Figure 3.11 (a) FT-IR spectra (KBr pellet) and (b) UV-Visible spectra (CH2Cl2, ~175 M) of 2
(red) and the corresponding precursor (black) ........................................................................97
Figure 3.12 (a) FT-IR spectra (KBr pellet) and (b) UV-Visible spectra (CH2Cl2, ~200 M) of 3
(red) and the corresponding precursor (black). .......................................................................98
Figure 3.13 (a) FT-IR spectra (KBr pellet) and (b) UV-Visible spectra (CH2Cl2, ~350 M) of 5
(red) and the corresponding precursor (black) ........................................................................99
Figure 3.14 (a) FT-IR spectra (KBr pellet) and (b) UV-Visible spectra (CH2Cl2, ~150 M) of 5
(red) and the corresponding precursor (black) ......................................................................100
Figure 3.15 (a) FT-IR spectra (KBr pellet) of natural abundance (black) and labeled 15N18O (red)
6. (b) UV-Visible spectra (~250 M CH2Cl2) of 6 (red) and the corresponding precursor
(black) ...................................................................................................................................101
Figure 3.16 (a) FT-IR spectra (KBr pellet) and (b) UV-Visible spectra (CH2Cl2, ~250 M) of 7
(red) and the corresponding precursor (black) ......................................................................102
Figure 3.17 IR spectrum (KBr disc) of a batch of 8 which exhibited quantitative N2O yield upon
addition of cobaltocene. ........................................................................................................104
Figure 3.18 FT-IR spectrum (KBr pellet) showing the product of nitrosylation of
[Fe2(BPMP)(OPr)2](OTf) in red. Complex 8 is shown in black for comparison ................106
Figure 3.19 IR spectrum (KBr disc) of complex 9 .....................................................................107
Figure 4.1 (a) UV-Visible spectrum of a 10 mM solution of [Fe(dmp)2](OTf)2 (3) before and
after exposure to NOg in methanol. (Inset: 2 mM solution at t = 2 hr.) (b) EPR spectrum of 1
recorded at 77 K in frozen methanol solution. .....................................................................113
Figure 4.2 Solution IR spectrum of {Fe(NO)2}9 DNIC 1 before (black) and after (red) addition
of cobaltocene in CH2Cl2, leading to formation of {Fe(NO)2}10 DNIC 2. ...........................114

xii
Figure 4.3 Crystal structure of 1. ................................................................................................115
Figure 4.4 Preliminary crystal structure of complex 3. ...............................................................119
Figure 4.5 (a) EPR spectra (recorded at 4.2 K) of freeze-quenched aliquots of a solution of 10
mM [Fe(dmp)2(OTf)2] in methanol after exposure to excess NO gas at room temperature.
(b) EPR spectra (recorded at 4.2 K) of freeze-quenched aliquots of a solution of 5 mM
[Fe(dmp)2(OTf)2] in methanol after exposure to excess NO gas at 80°C for 10 minutes
(black) and after warming of the same solution to room temperature (red) over 20 minutes.
A reaction run for 30 minutes at room temperature is shown for comparison (blue). .........120
Figure 4.6 Fit of integrated IR intensity over time following exposure of a 10 mM solution of
[Fe(dmp)2(OTf)2] to excess NO gas. The data are fit to a single exponential function with k
= 1.7*10-4 s-1. The raw IR data are shown in the inset. ........................................................121
Figure 4.7 (a) EPR spectra (recorded at 4.2 K; showing only the g = 2 region) of freeze-
quenched aliquots of a solution of 10 mM 3 in methanol after exposure to excess NO gas.
(b) Integrated EPR intensity over time. The data are fit to a single exponential function with
k = 8.0*10-5 s-1 ......................................................................................................................121
Figure 4.8 (a) Solution IR showing the presence of DNIC in a methanol solution of Fe(OTf)3
containing 2 equivalents of dmp per iron center (red) after stirring for 27 hours under NO
atmosphere. The solution IR for the reaction proceeding from 3 at the same time point
(black) is shown for comparison. (b) Gas IR showing the consumption of NO and the
presence of methyl nitrite (CH3ONO) in the headspace of the reaction mixtures after stirring
for 27 hours. A gas IR spectrum of methyl nitrite generated by stirring nitrosonium
tetrafluoroborate in methanol (blue) is shown for comparison. ...........................................122
Figure 4.9 4.2-K/53-mT Mössbauer spectra of a sample containing the {Fe(NO)2}9 complex 1
..............................................................................................................................................125
Figure 4.10 4.2-K/53-mT Mössbauer spectrum of a sample of the {Fe(NO)2}10 complex 2 .....125
Figure 4.11 (a) NRVS spectrum of {57Fe(NO)2}9 DNIC 1 (black) and the corresponding 15N18O
isotopolog (red). (b) NRVS spectrum of {57Fe(NO)2}10 DNIC 2 (black) and the
corresponding 15N18O isotopolog (red). ................................................................................127
Figure 4.12 (a) NRVS spectrum of {57Fe(NO)2}9 DNIC 5 (black) and the corresponding 15N18O
isotopolog (red). (b) NRVS spectrum of {57Fe(NO)2}10 DNIC 4 (black) and the
corresponding 15N18O isotopolog (red). ................................................................................128
xiii
Figure 4.13 Comparison of experimental and DFT-predicted NRVS spectra for {Fe(NO)2}9
complex 1 (a) and {Fe(NO)2}10 complex 2 (b). Natural abundance spectra are shown in
black and the isotopically labeled (15N18O) spectra are shown in red ..................................132
Figure 4.14 Experimental NRVS spectra (black) and QCC-NCA fit (red) for {Fe(NO)2}9 DNIC
1 (a) and {Fe(NO)2}10 DNIC 2 (b). The natural abundance NO spectra are shown on the top
and the isotopically labeled (15N18O) data are shown on the bottom. .................................134
Figure 4.15 Schematic MO diagram showing unrestricted corresponding orbitals (UCOs) for
{Fe(NO)2}9 DNIC 1. Sαβ indicates the amount of spatial overlap between the α-spin and β-
spin orbitals. ..........................................................................................................................137
Figure 4.16 Schematic MO diagram showing unrestricted corresponding orbitals (UCOs) for
{Fe(NO)2}10 DNIC 2. Sαβ indicates the amount of spatial overlap between the α-spin and β-
spin orbitals. ..........................................................................................................................138

xiv
List of Schemes
Scheme 1.1 Proposed mechanisms for NO reduction in NorBC.....................................................6
Scheme 1.2 Proposed mechanisms for NO reduction in FNORs. ...................................................9
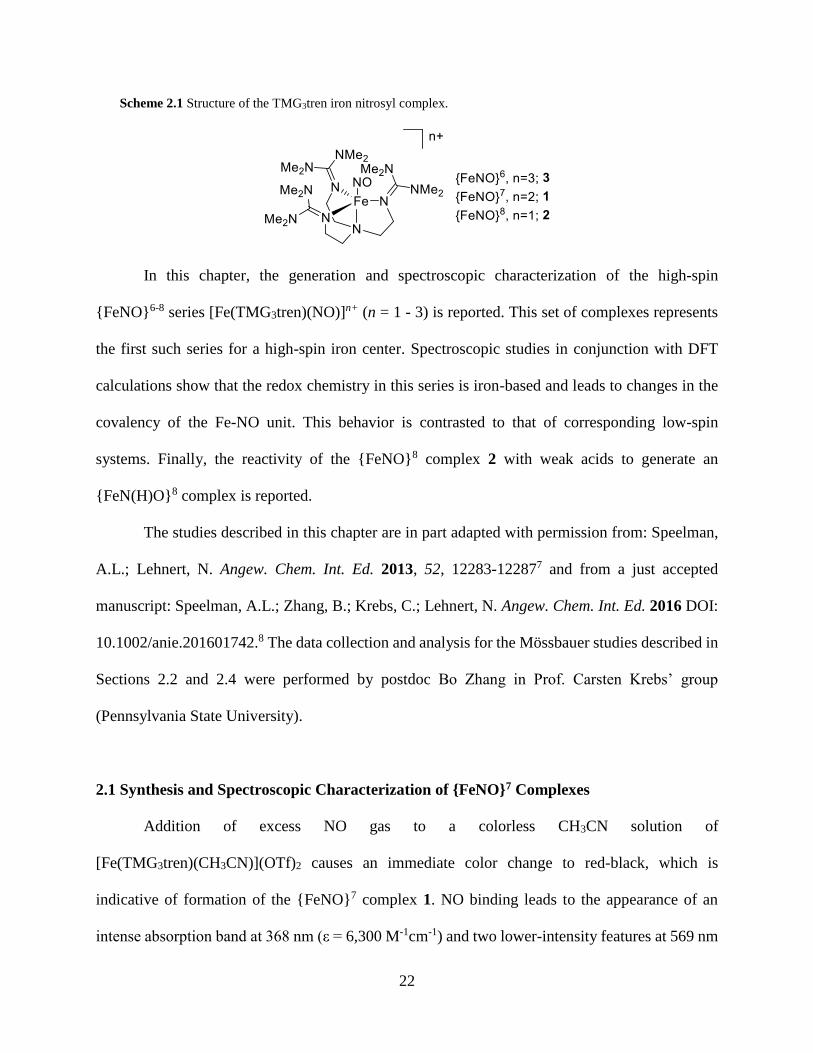
Scheme 2.1 Structure of the TMG3tren iron nitrosyl complex. .....................................................22
Scheme 2.2 Proposed decomposition pathway for complex 4 ......................................................63
Scheme 3.1 Ligand frameworks employed in this chapter and in selected compounds from the
literature. .................................................................................................................................79
Scheme 4.1 Typical synthetic pathway for neutral {Fe(NO)2}9 and {Fe(NO)2}
10 DNICs from
iron dicarbonyl dinitrosyl.. ...................................................................................................117
Scheme 4.2 Mechanism of {Fe(NO)2}9 DNIC formation from ferrous tetrathiolate complexes
..............................................................................................................................................117
Scheme 4.3 Proposed mechanism of formation of DNIC 1 from the ferrous precursor complex 3
..............................................................................................................................................123

xv
Abstract
High-spin non-heme ferrous nitroxyl (NO) complexes ({FeNO}8 in the Enemark-Feltham
notation) have been proposed as important intermediates in bacterial nitric oxide reductases.
Despite their significance, model compounds for these species have remained elusive and prior to
the studies described here, little was known about their spectroscopic properties and reactivity.
The work presented in this dissertation provides, for the first time, detailed insight into the
properties of high-spin {FeNO}8 complexes.
The first high-spin non-heme {FeNO}8 complex has been synthesized via chemical or
electrochemical reduction of a ferrous nitrosyl ({FeNO}7) precursor. The use of a sterically
encumbering ligand prevents the disproportionation typically observed for {FeNO}8 complexes.
A rare high-spin ferric nitrosyl ({FeNO}6) species has also been generated using the same ligand.
This system constitutes the first complete high-spin {FeNO}6-8 series. Detailed spectroscopic
investigations coupled to DFT calculations show that the {FeNO}6, {FeNO}7, and {FeNO}8
complexes have Fe(IV)-NO, Fe(III)-NO, and Fe(II)-NO electronic structures, respectively.
Importantly, the covalency of the Fe-NO bond decreases along this series. This has implications
for the reactivity of these species. For example, only the {FeNO}8 complex, in which the Fe-NO
bond is weakest, is basic. Protonation of the {FeNO}8 yields a highly unstable species which,
based on spectroscopic investigations, is suggested to be the first high-spin Fe(II)-HNO complex.
The decomposition of other {FeNO}8 compounds has also been investigated. Our group
previously showed that rapid and efficient N2O production can be achieved by reduction of
[{FeNO}7]2 dimers with adjacent NO moieties. Here, it is demonstrated that N2O production is

xvi
slow and substoichiometric when the NO units are not in close proximity to each other.
Additionally, it is shown that for monomeric compounds, one prominent decomposition pathway
involves disproportionation, leading to formation of a dinitrosyl iron complex (DNIC).
Finally, in a separate study, the electronic structure of DNICs at the {Fe(NO)2}9 and
{Fe(NO)2}10 redox levels has been investigated using Mössbauer and vibrational spectroscopy. By
coupling the findings from these techniques to DFT calculations, the bonding in these species is
shown to be extremely covalent which explains their high stability.

1
Chapter 1
Introduction1
1.1 Nitric Oxide and Nitroxyl in Biology
Nitric oxide (NO) is known to have a variety of effects in mammalian systems at
different concentrations, ranging from nanomolar concentration, where it acts as a signaling
molecule and is involved in nerve signal transduction and vasodilation, to micromolar
concentration, where it is acutely toxic and acts as an immune defense agent.3 More recently, the
one-electron reduced and potentially protonated form of NO• (nitroxyl, NO/HNO) has been
shown to elicit a variety of biological responses.4-11 The currently accepted pKa for free nitroxyl
is 11.6 ± 3.4, which implies that it exists primarily in the protonated form under physiological
conditions.12-13 Note that nitroxyl is used in the literature to refer to both NO and HNO.
The endogenous production of HNO was long thought to be unfeasible in biological
systems due to the very negative reduction potential of free NO• (approximately 800 mV vs
NHE).12 The reduction potential for proton-coupled one-electron reduction of NO• to give HNO
is slightly less negative under physiological conditions (approximately 500 mV vs NHE), but is
still outside the range of typical biological reductants.13 More recent literature reports have
established that HNO can in fact be produced under physiologically relevant conditions through
the interaction of NO with H2S14-15 or phenolic substrates16-17. Based on these results it has been
suggested that HNO is a key signaling molecule in biological systems, and may in fact be
responsible for some of the effects previously attributed to NO.14,17
2
Regardless of whether HNO is produced endogenously, its effects as a drug have been
well-established. These effects have been reviewed extensively in the literature and will be
discussed only briefly here.4-11 The most well-characterized effects of HNO stem from its
interaction with thiols, as exemplified by the alcohol deterrent drug cyanamide which is
metabolized to HNO under physiological conditions. The HNO then covalently modifies a
cysteine at the active site of aldehyde dehydrogenase. In the cardiovascular system, HNO acts as
a vasorelaxant, increases cardiac muscle contractility, and protects against ischemia reperfusion
injuries.
In addition to the role of free HNO in biology, ferrous nitroxyl complexes may play an
important role in the generation and/or sensing of HNO. (Note that due to the non-innocent
behavior of the nitrosyl and nitroxyl ligands and the often complicated electronic structures of
transition-metal NO complexes, the oxidation state of a metal nitrosyl unit is typically indicated
using the Enemark-Feltham notation18, in which the metal-nitrosyl is denoted by {M(NO)x}n.
Here, n represents the number of metal d-electrons plus NO * electrons, and x corresponds to
the number of nitrosyl ligands. In this notation, a ferrous nitroxyl complex would therefore be
denoted as an {FeNO}8 or an {FeHNO}8, depending on the pH.) Farmer and co-workers have
demonstrated that HNO binds to a variety of ferrous globin proteins to form stable {FeHNO}8
complexes.7,19-20 Although these complexes have not been crystallized, 1H NMR provides clear
experimental evidence for the presence of an N-protonated HNO at the active site. In particular,
the NMR spectra of HNO complexes show a characteristic resonance at ~ 14 ppm which splits
into a doublet with JNH ≈ 75 Hz in the spectrum of the corresponding H15NO complex.19,21-22
Non-heme iron centers represent an alternative target for HNO, but the interaction of high-spin
non-heme iron with nitroxyl has not been studied in the literature.
3
In principle, iron centers could also act as HNO synthases in vivo. For example, Farmer
and co-workers have demonstrated that an {FeHNO}8 complex can be produced in myoglobin by
reduction of the corresponding {FeNO}7 species. However, production of the nitroxyl complex
required a very negative potential of 630 mV vs NHE.21,23 Note that the negative potentials
required to produce the {FeHNO}8 species can be attributed to the fact that in low-spin {FeNO}7
complexes, all of the low-lying d-orbitals are doubly occupied and consequently reduction is
primarily NO-centered.24-27 In contrast, because the high-spin state offers partially occupied
(acceptor) d-orbitals at low energy, reduction of high-spin (non-heme) {FeNO}7 complexes is
expected to be iron-centered and to occur at more positive, biologically feasible potentials.2
Although reduction potentials for biological non-heme {FeNO}7 sites have not been measured,
model complex studies indicate that this is indeed the case. For example, the model complex
[Fe(BMPA-Pr)]X (X=OTf, ClO4) exhibits an {FeNO}7/8 redox couple at 300 mV vs NHE,
which, while quite negative, is still within the biologically feasible range.28 Thus, non-heme iron
centers could in principle act as HNO synthases in vivo, if the HNO ligand formed upon
reduction would be released.
1.2 Nitric Oxide Reductases
Ferrous nitroxyl complexes have also been proposed as important intermediates in
anaerobic respiration performed by bacteria and fungi. These organisms contain enzymes that
perform the stepwise reduction of nitrate to dinitrogen.29-30 As one step in this overall reaction,
nitric oxide reductases (NORs) catalyze the two-electron reduction of two molecules of NO to
N2O:
2 NO + 2 e + 2 H+ N2O + H2O
4
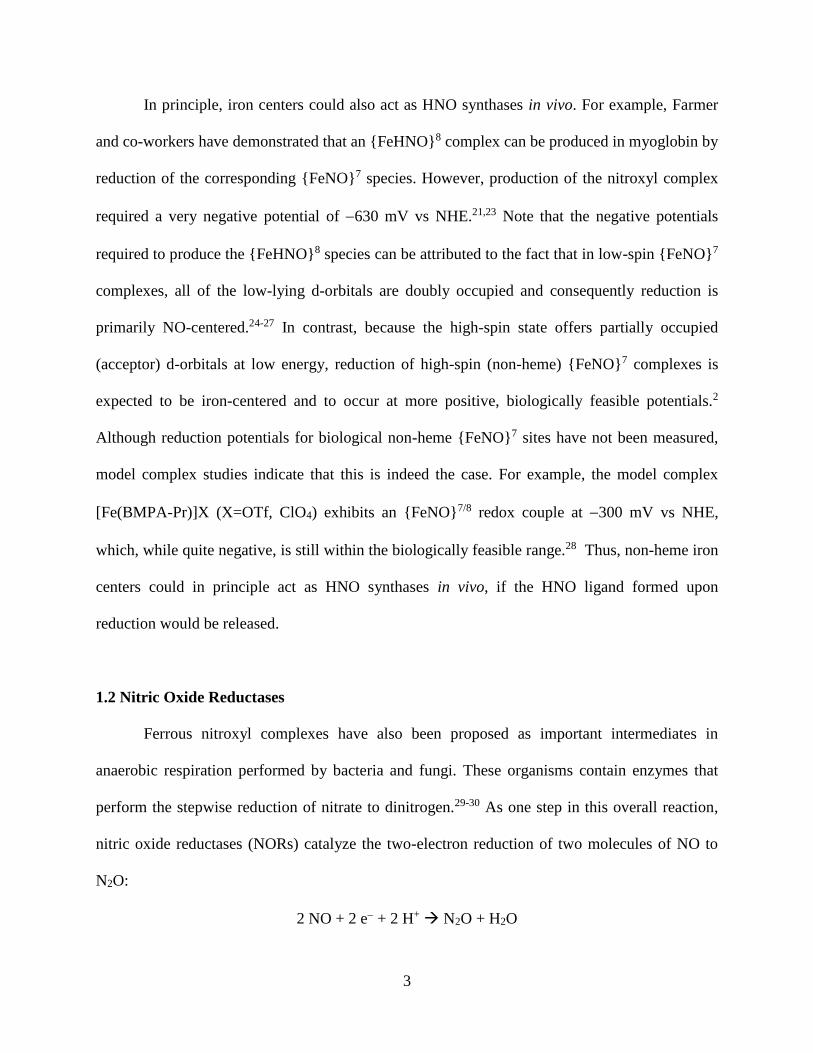
In fungi, this reaction is carried out by a cytochrome P450-type enzyme (P450nor), as
shown in Figure 1.1.31 NO binding to the ferric resting state is followed by direct hydride transfer
from NADH to form an {FeHNO}8 intermediate. Either this compound or a corresponding
doubly protonated species then reacts with a second equivalent of NO to form an N-N bond and
eventually release N2O (see Figure 1.1).27,32-34 Mechanistic studies of the native enzyme and
model complexes have been reviewed recently.35-36 As the focus of this thesis is non-heme iron
nitrosyl complexes, P450nor will not be discussed in further detail here.
Figure 1.1 Left: Crystal structure of the ferric NO bound form of Fusarium oxysporum P450nor (PDB ID
1CL6). Right: Proposed mechanism for N2O formation in P450nor. Reprinted with permission from
reference 2. Copyright 2014 American Chemical Society.
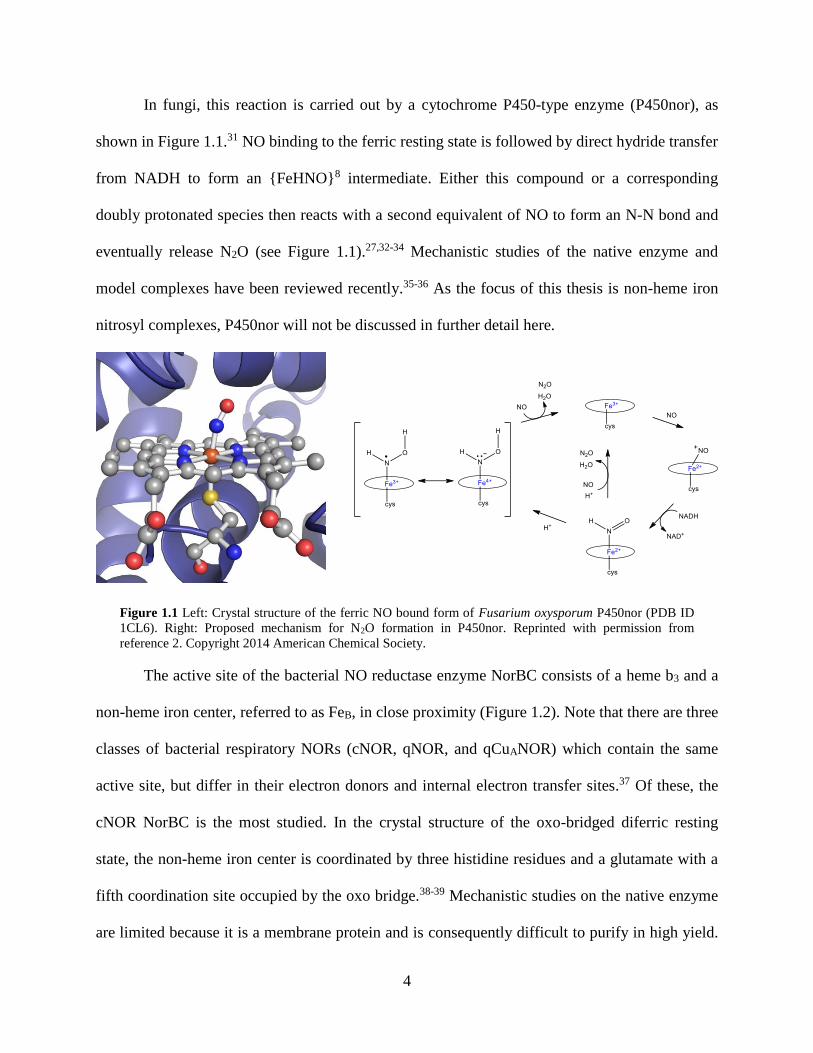
The active site of the bacterial NO reductase enzyme NorBC consists of a heme b3 and a
non-heme iron center, referred to as FeB, in close proximity (Figure 1.2). Note that there are three
classes of bacterial respiratory NORs (cNOR, qNOR, and qCuANOR) which contain the same
active site, but differ in their electron donors and internal electron transfer sites.37 Of these, the
cNOR NorBC is the most studied. In the crystal structure of the oxo-bridged diferric resting
state, the non-heme iron center is coordinated by three histidine residues and a glutamate with a
fifth coordination site occupied by the oxo bridge.38-39 Mechanistic studies on the native enzyme
are limited because it is a membrane protein and is consequently difficult to purify in high yield.

5
Additionally, spectroscopic studies are challenging because in addition to the heme and non-
heme centers at the active site, NorBC also contains two additional electron transfer hemes.
Additional insight has, however, been provided by myoglobin mutants with an engineered FeB
site (FeBMb) reported by Lu and co-workers.40-45 Three main classes of mechanisms have been
proposed involving NO binding at both the heme and non-heme sites (trans mechanism) or NO
binding at a single iron site (cis heme b3 or cis FeB) as illustrated in Scheme 1.1. The
experimental evidence for each of these mechanisms has recently been reviewed in detail.35
Figure 1.2 Crystal structure of diferric oxo-bridged resting state of the Pseudomonas aeruginosa NorBC
active site (PDB ID 3O0R). Reprinted with permission from reference 2. Copyright 2014 American
Chemical Society.
In support of the trans mechanism, both heme and non-heme iron nitrosyls have been
identified in the native enzyme under turnover conditions by EPR.46-47 However, it is unclear
whether the observed species represent catalytically competent intermediates since the spins of
the two iron centers should in principle be magnetically coupled giving an EPR-silent species. In
FeBMb, rapid freeze-quench Raman and stopped-flow UV-Visible studies demonstrate

6
Scheme 1.1 Proposed mechanisms for NO reduction in NorBC. Reprinted with permission from reference
48. Copyright Elsevier 2013.
formation of both heme and non-heme {FeNO}7 complexes during turnover, indicating a trans-
type mechanism.45,49 Furthermore, vibrational studies on a functional synthetic NOR model from
Collman and co-workers suggest a trans mechanism.50 However, it should be noted that both
heme and non-heme {FeNO}7 complexes are generally very stable48,51, and it is unclear how
these typically quite unreactive species could be activated for N-N bond formation in these cases.
A cis heme b3 mechanism has also been proposed for NorBC in analogy to P450nor.52 As
noted above, heme {FeNO}7 complexes are usually stable. However, studies with FeBMb
suggest a possible means of activating a heme {FeNO}7 complex. The N-O stretch of the heme
{FeNO}7 in FeBMb is downshifted from 1601 cm-1 in apo-FeBMb to ~1550 cm-1 when a divalent
cation (either iron or zinc) is present in the FeB site.42 This phenomenon is suggested to originate

7
from a semi-bridging interaction between the heme nitrosyl and the adjacent non-heme site. The
resulting electrostatic interaction between the NO and the non-heme iron causes a buildup of
negative charge on the NO, giving it nitroxyl-like character and priming it for electrophilic attack
by free NO. DFT studies also favor a cis heme b3 mechanism over a trans mechanism.53-55
Finally, a cis FeB mechanism has also been proposed with the idea that this avoids formation of a
stable “dead-end” heme {FeNO}7 complex.56-57 Additionally, as discussed above, although
formation of a heme nitroxyl via reduction of a ferrous heme nitrosyl would be unfavorable
under physiological conditions, formation of a non-heme nitroxyl complex (or nitroxyl-like
complex via a semi-bridging interaction to the heme center as discussed above) could be more
favorable and might be envisioned as one way to activate a non-heme {FeNO}7 center for further
reactivity.
Flavodiiron nitric oxide reductases (FNORs) are a third class of NORs found in
pathogenic bacteria that perform NO reduction not as part of respiration, but rather as a means of
detoxifying NO. Since NO is produced by macrophages in mammals as part of the immune
response to bacterial infection, this allows these bacteria to proliferate.58 FNORs belong to the
larger class of flavodiiron proteins (FDPs) which are found in anaerobic bacteria, archaea, and
protozoa.59-62 These proteins function as NO and/or O2 scavengers in vivo thereby protecting
these organisms from nitrosative and/or oxidative stress. The active site of FDPs consists of a
non-heme diiron core, as shown in Figure 1.3. The iron centers are bridged by an aspartate and a
water-derived ligand, and each of the iron centers is coordinated by two histidines and a terminal
carboxylate ligand63 with the exception of Desulfovibrio gigas ROO, in which one of the
histidines is replaced by a water molecule64; mutagenesis studies, however, indicate that this has
no functional significance.65 The sixth open coordination site is oriented toward a substrate

8
binding pocket as shown in Figure 1.3. The flavin mononucleotide (FMN) moiety sits 3 – 6 Å
away from the active site allowing for rapid electron transfer.
Figure 1.3 Crystal structure of the diferrous active site of the Moorella thermoacetica FNOR (PDB ID
1YCG) shown with the proximal flavin cofactor.
Given the fairly typical coordination environment of FNORs, the high NO reductase
activity of these enzymes is quite surprising. In contrast, while the diferrous dinitrosyl adducts of
soluble methane monooxygenase and ribonucleotide reductase (which have generally very
similar coordination environments to FNORs, although they lack the proximal FMN cofactor)
also produce N2O, the reaction is very slow and low-yielding.66-67 Similarly, non-heme diferrous
dinitrosyl model complexes are typically stable in solution.68-69 These findings are in line with
the general observation that high-spin non-heme {FeNO}7 complexes have very covalent Fe-
N(O) bonds and are generally stable and unreactive.48 This implies that FNORs are in some way
able to activate ferrous NO species, but it is not clear how this might be accomplished. Thus, the
exact mechanism of FNORs is still a matter of debate in the literature. Three proposed
mechanisms for FNORs are shown in Scheme 1.2.
9
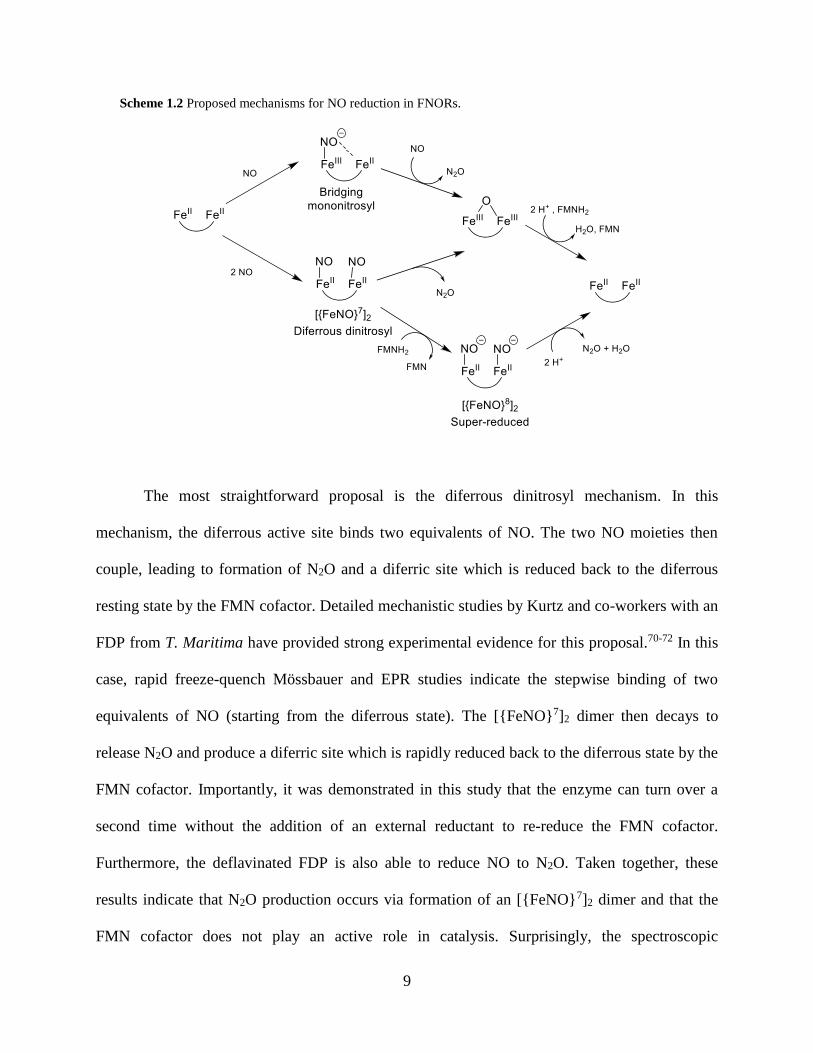
Scheme 1.2 Proposed mechanisms for NO reduction in FNORs.
The most straightforward proposal is the diferrous dinitrosyl mechanism. In this
mechanism, the diferrous active site binds two equivalents of NO. The two NO moieties then
couple, leading to formation of N2O and a diferric site which is reduced back to the diferrous
resting state by the FMN cofactor. Detailed mechanistic studies by Kurtz and co-workers with an
FDP from T. Maritima have provided strong experimental evidence for this proposal.70-72 In this
case, rapid freeze-quench Mössbauer and EPR studies indicate the stepwise binding of two
equivalents of NO (starting from the diferrous state). The [{FeNO}7]2 dimer then decays to
release N2O and produce a diferric site which is rapidly reduced back to the diferrous state by the
FMN cofactor. Importantly, it was demonstrated in this study that the enzyme can turn over a
second time without the addition of an external reductant to re-reduce the FMN cofactor.
Furthermore, the deflavinated FDP is also able to reduce NO to N2O. Taken together, these
results indicate that N2O production occurs via formation of an [{FeNO}7]2 dimer and that the
FMN cofactor does not play an active role in catalysis. Surprisingly, the spectroscopic
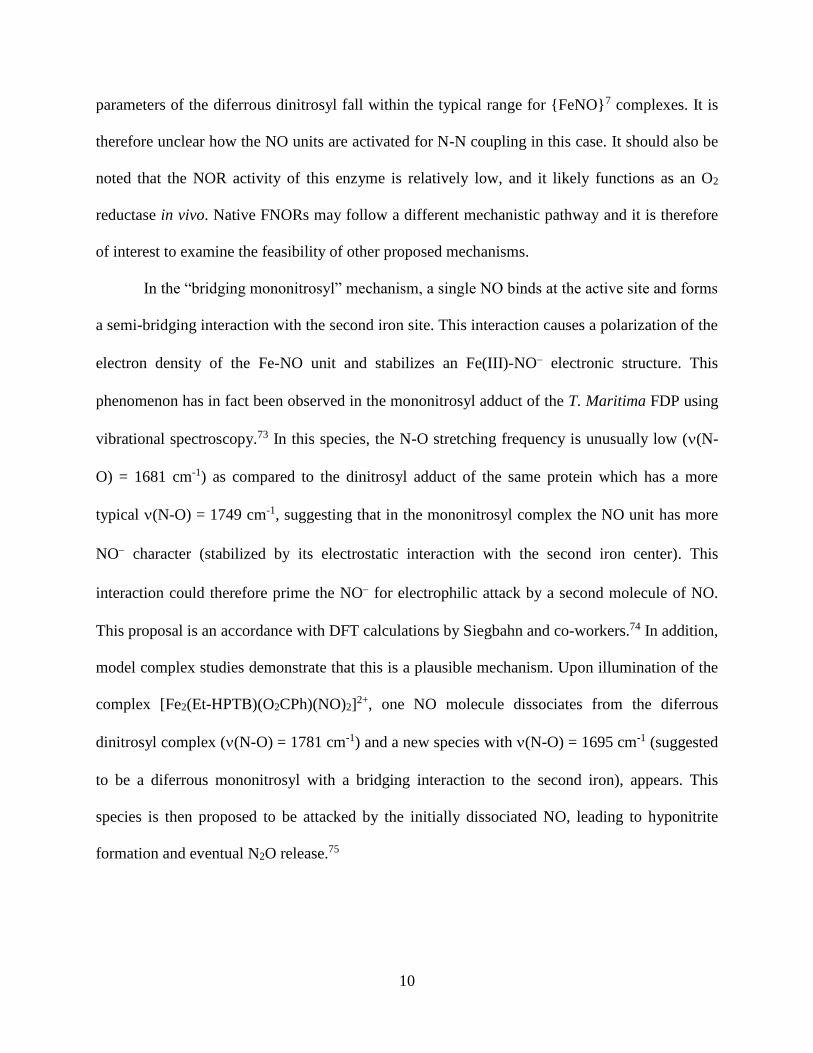
10
parameters of the diferrous dinitrosyl fall within the typical range for {FeNO}7 complexes. It is
therefore unclear how the NO units are activated for N-N coupling in this case. It should also be
noted that the NOR activity of this enzyme is relatively low, and it likely functions as an O2
reductase in vivo. Native FNORs may follow a different mechanistic pathway and it is therefore
of interest to examine the feasibility of other proposed mechanisms.
In the “bridging mononitrosyl” mechanism, a single NO binds at the active site and forms
a semi-bridging interaction with the second iron site. This interaction causes a polarization of the
electron density of the Fe-NO unit and stabilizes an Fe(III)-NO electronic structure. This
phenomenon has in fact been observed in the mononitrosyl adduct of the T. Maritima FDP using
vibrational spectroscopy.73 In this species, the N-O stretching frequency is unusually low ((N-
O) = 1681 cm-1) as compared to the dinitrosyl adduct of the same protein which has a more
typical (N-O) = 1749 cm-1, suggesting that in the mononitrosyl complex the NO unit has more
NO character (stabilized by its electrostatic interaction with the second iron center). This
interaction could therefore prime the NO for electrophilic attack by a second molecule of NO.
This proposal is an accordance with DFT calculations by Siegbahn and co-workers.74 In addition,
model complex studies demonstrate that this is a plausible mechanism. Upon illumination of the
complex [Fe2(Et-HPTB)(O2CPh)(NO)2]2+, one NO molecule dissociates from the diferrous
dinitrosyl complex ((N-O) = 1781 cm-1) and a new species with (N-O) = 1695 cm-1 (suggested
to be a diferrous mononitrosyl with a bridging interaction to the second iron), appears. This
species is then proposed to be attacked by the initially dissociated NO, leading to hyponitrite
formation and eventual N2O release.75

11
Figure 1.4 Crystal structure of the model complex [Fe(BPMP)(OPr)(NO)2](BPh4)2. Hydrogen atoms and
tetraphenylborate counterions have been omitted for clarity. Reprinted with permission from reference 2.
Copyright 2014 American Chemical Society.
Of particular interest to this thesis is the “super-reduced” mechanism.59,63 In this
mechanism, a diferrous dinitrosyl intermediate is directly reduced by the FMN cofactor to the
[{FeN(H)O}8]2 (diferrous dinitroxyl) level. This species then performs N-N coupling to release
N2O and re-generate the diferrous active site. Experimental support for this proposal comes from
the model complex [Fe2(BPMP)(OPr)(NO)2]2+ studied by our group (Figure 1.4). The
[{FeNO}7]2 form of this complex is stable in solution. However, upon addition of 2 equivalents
of reductant, quantitative N2O formation is observed within 1 minute.69 This finding implies that
{FeNO}8 complexes are competent intermediates for N2O formation.
1.3 Electronic Structure of High-Spin Iron Nitrosyl Complexes
The “super-reduced” mechanism proposes reduction as a means of activating an
otherwise stable NO unit toward further reactivity. While multiple low-spin {FeNO}8 model
complexes25-26,76-81, as well as a few corresponding protonated {FeHNO}8 species26,82, have been
reported in the literature, high-spin {FeNO}8 complexes, such as those that would be expected to
form in FNORs, are much more elusive. Low-spin (S = 1/2) {FeNO}7 complexes have an Fe(II)-

12
NO• electronic structure.50,75 Reduction of these species is primarily NO-centered and gives a
diamagnetic {FeNO}8 species with an electronic structure intermediate between Fe(I)-NO• and
Fe(II)-1NO.24-27 High-spin {FeNO}7 complexes have a different electronic structure from their
low-spin counterparts48, as discussed below, and correspondingly a different electronic structure
and reactivity can be anticipated for high-spin as compared to low-spin {FeNO}8 species.
Using a variety of spectroscopic techniques including EPR, SQUID, X-ray absorption,
MCD, and resonance Raman as well as theoretical calculations, Solomon and co-workers
determined that high-spin {FeNO}7 compounds have an S = 3/2 ground state and an electronic
structure which consists of a high-spin iron(III) center (S = 5/2) antiferromagnetically coupled to
a triplet NO ligand (S = 1).83-84 More recent studies also support this assignment.28,85-89
Additional insight into the properties of the Fe-N-O unit can be obtained from vibrational
spectroscopy. In particular, a study from our group demonstrated that Fe-N and N-O stretching
frequencies are directly correlated within a set of related {FeNO}7 complexes.28 Moreover, the
N-O stretching frequencies in these complexes are also correlated to the effective nuclear charge
of the iron center, where complexes with a higher Zeff have higher N-O stretching frequencies.
These observations can be explained by considering the bonding in the Fe-NO unit. In high-spin
{FeNO}7 systems, NO acts as a strong -donor into the iron dxz and dyz orbitals (in a coordinate
system where the z-axis corresponds to the Fe-N(O) bond). In compounds where the iron center
is more electron-poor, the NO donates additional electron density into the iron d-orbitals,
causing a simultaneous strengthening of the Fe-N and N-O bonds. Correspondingly, since the
iron center in a high-spin {FeNO}8 complex is expected to be more electron-rich, a weakening of
the Fe-N(O) bond can be expected in these species. However, since there are no well-

13
characterized high-spin {FeNO}8 complexes reported in the literature, there is no experimental
evidence to support this hypothesis.
The cyclic voltammograms of high-spin {FeNO}7 model complexes generally show
quasi-reversible or irreversible {FeNO}7/8 couples28,90-93, suggesting that high-spin {FeNO}8
species are unstable and cannot be isolated for further characterization. (Note that the oxidation
of these complexes to the {FeNO}6 redox level is also typically irreversible.) The only example
of a high-spin {FeN(H)O}8 complex in the literature was generated in a protein model via
cryoreduction of the corresponding {FeNO}7 species, and was characterized exclusively in
frozen solution by Mössbauer spectroscopy.88 Thus until the work described in this thesis, there
were no examples of well-characterized high-spin {FeN(H)O}8 complexes and as such the
properties and reactivity of these species were not known.
1.4 Scope of Thesis
This thesis is focused on the examination of the electronic structure and reactivity of
high-spin non-heme iron nitrosyl complexes. In Chapter 2, the characterization of the {FeNO}7
complex [Fe(TMG3tren)(NO)](OTf)2 is reported. The reduction of this compound to give the
first stable high-spin {FeNO}8 model complex is reported. Interestingly, the {FeNO}7 complex
can also be oxidized to generate a rare stable high-spin {FeNO}6 species. This has allowed us,
for the first time, to characterize a high-spin iron nitrosyl in three different redox states. In
Section 2.2, this set of compounds is examined using a variety of spectroscopic techniques.
Then, in Section 2.3, the spectroscopic properties of these compounds are correlated to DFT
calculations and used to show that the {FeNO}6, {FeNO}7, and {FeNO}8 complexes have
Fe(IV)-NO, Fe(III)-NO, and Fe(II)-NO electronic structures, respectively. Changes in the
redox level of the iron center have an impact on the covalency of the Fe-NO bond. In particular,
14
the covalency of the Fe-NO bond is reduced in the {FeNO}8 complex as compared to the
{FeNO}7 form. This causes the NO unit to become basic, allowing us to prepare a corresponding
{FeN(H)O}8 species, which is described in Section 2.4. Some of the studies described in
Sections 2.1-2.3 were published in: Speelman, A.L.; Lehnert, N. Angew. Chem. Int. Ed.
“Characterization of a High-Spin Non-Heme {FeNO}8 Complex: Implications for the Reactivity
of Iron Nitroxyl Species in Biology” 2013, 52, 12283-12287 and in a just accepted manuscript:
Speelman, A.L.; Zhang, B.; Krebs, C.; Lehnert, N. “Structural and Spectroscopic
Characterization of a High-Spin {FeNO}6 Complex with an Iron(IV)-NO Electronic Structure”
Angew. Chem. Int. Ed. 2016. A third manuscript is currently in preparation, and will include
additional spectroscopic studies of the {FeNO}6-8 complexes as well as all of the characterization
of the {FeN(H)O}8 complex.
In Chapter 3, the synthesis and characterization of a set of mono- and dinuclear {FeNO}7
model complexes analogous to the BPMP complex described in Section 1.2 are reported. The
decomposition of these complexes upon reduction is then examined. N2O production from these
complexes upon reduction is slow or non-existent, which suggests that a diiron motif with cis
NO moieties is crucial for efficient N2O formation. Finally, in Section 3.3, follow-up studies on
[Fe2BPMP(OPr)(NO)2]2+ are presented. These studies demonstrate that this complex can produce
N2O upon one-electron reduction, rather than the two electron-pathway proposed previously.
Chapter 4 is focused on the spectroscopic characterization of dinitrosyl iron complexes
(DNICs), which are another important class of non-heme iron nitrosyls. These compounds are
also formed during the decomposition of non-heme {FeNO}8 complexes. In this chapter, we
report the synthesis of an {Fe(NO)2}9 DNIC from a ferrous precursor via an unusual pathway
involving disproportionation of a transiently formed {FeNO}7 species. This {Fe(NO)2}9 DNIC,

15
as well as the corresponding one-electron reduced {Fe(NO)2}10 DNIC, are then characterized by
Mössbauer and NRVS. By correlating the experimental spectroscopic parameters with DFT
calculations, we demonstrate that these complexes feature extremely strong -backbonding
between the metal and the two NO units. Consequently, despite the fact that they contain the
requisite number of electrons and NO moieties to produce N2O, DNICs are not known to
perform N-N coupling reactions. Chapter 4 is adapted from a submitted manuscript: Speelman,
A.L.; Zhang, B.; Silakov, A.; Skodje, K.M.; Alp, E.E.; Zhao, J.; Hu, M.Y.; Kim, E.; Krebs, C.;
Lehnert. N. “An Unusual Synthetic Pathway for an {Fe(NO)2}9 Dinitrosyl Iron Complex (DNIC)
and Insight into DNIC Electronic Structure via Nuclear Resonance Vibrational Spectroscopy”.
1.5 References and Notes
(1) Portions of this chapter are adapted with permission from reference 2.
(2) Speelman, A. L.; Lehnert, N. Acc. Chem. Res. 2014, 47, 1106-1116.
(3) Ignarro, L. J.; 2nd ed.; Academic Press: San Diego, 2010.
(4) Miranda, K. M. Coord. Chem. Rev. 2005, 249, 433-455.
(5) Fukuto, J. M.; Dutton, A. S.; Houk, K. N. ChemBioChem 2005, 6, 612-619.
(6) Fukuto, J. M.; Cisneros, C. J.; Kinkade, R. L. J. Inorg. Biochem. 2013, 118, 201-208.
(7) Kumar, M. R.; Pervitsky, D.; Chen, L.; Poulos, T.; Kundu, S.; Hargrove, M. S.; Rivera, E. J.;
Diaz, A.; Colon, J. L.; Farmer, P. J. Biochemistry 2009, 48, 5018-5025.
(8) Doctorovich, F.; Bikiel, D. E.; Pellegrino, J.; Suárez, S. A.; Martí, M. A. Acc. Chem. Res.
2014, 47, 2907-2916.
(9) Doctorovich, F.; Bikiel, D.; Pellegrino, J.; Suárez, S. A.; Larsen, A.; Martí, M. A. Coord.
Chem. Rev. 2011, 255, 2764-2784.
(10) Paolocci, N.; Jackson, M. I.; Lopez, B. E.; Miranda, K.; Tocchetti, C. G.; Wink, D. A.;
Hobbs, A. J.; Fukuto, J. M. Pharmacol. Therapeut. 2007, 113, 442-458.

16
(11) Switzer, C. H.; Flores-Santana, W.; Mancardi, D.; Donzelli, S.; Basudhar, D.; Ridnour, L.
A.; Miranda, K. M.; Fukuto, J. M.; Paolocci, N.; Wink, D. A. BBA - Bioenergetics 2009, 1787,
835-840.
(12) Bartberger, M. D.; Liu, W.; Ford, E.; Miranda, K. M.; Switzer, C.; Fukuto, J. M.; Farmer,
P. J.; Wink, D. A.; Houk, K. N. Proc. Natl. Acad. Sci. USA 2002, 99, 10958-10963.
(13) Shafirovich, V.; Lymar, S. V. Proc. Natl. Acad. Sci. USA 2002, 99, 7340-7345.
(14) Eberhardt, M.; Dux, M.; Namer, B.; Miljkovic, J.; Cordasic, N.; Will, C.; Kichko, T. I.; de
la Roche, J.; Fischer, M.; Suárez, S. A.; Bikiel, D.; Dorsch, K.; Leffler, A.; Babes, A.; Lampert,
A.; Lennerz, J. K.; Jacobi, J.; Martí, M. A.; Doctorovich, F.; Högestätt, E. D.; Zygmunt, P. M.;
Ivanovic-Burmazovic, I.; Messlinger, K.; Reeh, P.; Filipovic, M. R. Nat Commun 2014, 5, 4381.
(15) Cortese-Krott, M. M.; Kuhnle, G. G. C.; Dyson, A.; Fernandez, B. O.; Grman, M.;
DuMond, J. F.; Barrow, M. P.; McLeod, G.; Nakagawa, H.; Ondrias, K.; Nagy, P.; King, S. B.;
Saavedra, J. E.; Keefer, L. K.; Singer, M.; Kelm, M.; Butler, A. R.; Feelisch, M. Proc. Natl.
Acad. Sci. USA 2015, 112, E4651-E4660.
(16) Suarez, S. A.; Neuman, N. I.; Muñoz, M.; Álvarez, L. a.; Bikiel, D. E.; Brondino, C. D.;
Ivanović-Burmazović, I.; Miljkovic, J. L.; Filipovic, M. R.; Martí, M. A.; Doctorovich, F. J. Am.
Chem. Soc. 2015, 137, 4720-4727.
(17) Hamer, M.; Suarez, S. A.; Neuman, N. I.; Alvarez, L.; Muñoz, M.; Marti, M. A.;
Doctorovich, F. Inorg. Chem. 2015, 54, 9342-9350.
(18) Enemark, J. H.; Feltham, R. D. Coord. Chem. Rev. 1974, 13, 339-406.
(19) Farmer, P. J.; Sulc, F. J. Inorg. Biochem. 2005, 99, 166-184.
(20) Sulc, F.; Immoos, C. E.; Pervitsky, D.; Farmer, P. J. J. Am. Chem. Soc. 2004, 126, 1096-
1101.
(21) Lin, R.; Farmer, P. J. J. Am. Chem. Soc. 2000, 122, 2393-2394.
(22) Montenegro, A. C.; Amorebieta, V. T.; Slep, L. D.; Martín, D. F.; Roncaroli, F.; Murgida,
D. H.; Bari, S. E.; Olabe, J. A. Angew. Chem. Int. Ed. 2009, 48, 4213-4216.
(23) Bayachou, M.; Lin, R.; Cho, W.; Farmer, P. J. J. Am. Chem. Soc. 1998, 120, 9888-9893.
(24) Serres, R. G.; Grapperhaus, C. A.; Bothe, E.; Bill, E.; Weyhermüller, T.; Neese, F.;
Wieghardt, K. J. Am. Chem. Soc. 2004, 126, 5138-5153.
(25) Pellegrino, J.; Bari, S. E.; Bikiel, D. E.; Doctorovich, F. J. Am. Chem. Soc. 2009, 132, 989-
995.
(26) Goodrich, L. E.; Roy, S.; Alp, E. E.; Zhao, J.; Hu, M. Y.; Lehnert, N. Inorg. Chem. 2013,
52, 7766-7780.
17
(27) Lehnert, N.; Praneeth, V. K. K.; Paulat, F. J. Comput. Chem. 2006, 27, 1338-1351.
(28) Berto, T. C.; Hoffman, M. B.; Murata, Y.; Landenberger, K. B.; Alp, E. E.; Zhao, J.;
Lehnert, N. J. Am. Chem. Soc. 2011, 133, 16714-16717.
(29) Wasser, I. M.; de Vries, S.; Moënne-Loccoz, P.; Schröder, I.; Karlin, K. D. Chem. Rev.
2002, 102, 1201-1234.
(30) Richardson, D. J.; Watmough, N. J. Curr. Opin. Chem. Biol. 1999, 3, 207-219.
(31) Shimizu, H.; Obayashi, E.; Gomi, Y.; Arakawa, H.; Park, S.-Y.; Nakamura, H.; Adachi, S.-
i.; Shoun, H.; Shiro, Y. J. Biol. Chem. 2000, 275, 4816-4826.
(32) Obayashi, E.; Takahashi, S.; Shiro, Y. J. Am. Chem. Soc. 1998, 120, 12964-12965.
(33) Shiro, Y.; Fujii, M.; Iizuka, T.; Adachi, S.-i.; Tsukamoto, K.; Nakahara, K.; Shoun, H. J.
Biol. Chem. 1995, 270, 1617-1623.
(34) Riplinger, C.; Neese, F. ChemPhysChem 2011, 12, 3192-3203.
(35) Lehnert, N.; Berto, T. C.; Galinato, M. G. I.; Goodrich, L. E. "The Role of Heme-Nitrosyls
in the Biosynthesis, Transport, Sensing, and Detoxification of Nitric Oxide (NO) in Biological
Systems: Enzymes and Model Complexes"; in: 'The Handbook of Porphyrin Science'; Kadish, K.
M.; Smith, K. M.; Guilard, R., Eds., World Scientific,2011, Vol. 14, page 1 - 247 (Chapter 63)
(36) McQuarters, A. B.; Wirgau, N. E.; Lehnert, N. Curr. Opin. Chem. Biol. 2014, 19, 82-89.
(37) Hino, T.; Nagano, S.; Sugimoto, H.; Tosha, T.; Shiro, Y. BBA - Bioenergetics 2012, 1817,
680-687.
(38) Hino, T.; Matsumoto, Y.; Nagano, S.; Sugimoto, H.; Fukumori, Y.; Murata, T.; Iwata, S.;
Shiro, Y. Science 2010, 330, 1666-1670.
(39) Matsumoto, Y.; Tosha, T.; Pisliakov, A. V.; Hino, T.; Sugimoto, H.; Nagano, S.; Sugita,
Y.; Shiro, Y. Nat Struct Mol Biol 2012, 19, 238-245.
(40) Yeung, N.; Lin, Y.-W.; Gao, Y.-G.; Zhao, X.; Russell, B. S.; Lei, L.; Miner, K. D.;
Robinson, H.; Lu, Y. Nature 2009, 462, 1079-1082.
(41) Lin, Y.-W.; Yeung, N.; Gao, Y.-G.; Miner, K. D.; Tian, S.; Robinson, H.; Lu, Y. Proc.
Natl. Acad. Sci. USA 2010, 107, 8581-8586.
(42) Hayashi, T.; Miner, K. D.; Yeung, N.; Lin, Y.-W.; Lu, Y.; Moënne-Loccoz, P.
Biochemistry 2011, 50, 5939-5947.
(43) Chakraborty, S.; Reed, J.; Ross, M.; Nilges, M. J.; Petrik, I. D.; Ghosh, S.; Hammes-
Schiffer, S.; Sage, J. T.; Zhang, Y.; Schulz, C. E.; Lu, Y. Angew. Chem. Int. Ed. 2014, 53, 2417-
2421.

18
(44) Chakraborty, S.; Reed, J.; Sage, J. T.; Branagan, N. C.; Petrik, I. D.; Miner, K. D.; Hu, M.
Y.; Zhao, J.; Alp, E. E.; Lu, Y. Inorg. Chem. 2015, 54, 9317-9329.
(45) Matsumura, H.; Chakraborty, S.; Reed, J.; Lu, Y.; Moënne-Loccoz, P. Biochemistry 2016,
55, 2091-2099.
(46) Kumita, H.; Matsuura, K.; Hino, T.; Takahashi, S.; Hori, H.; Fukumori, Y.; Morishima, I.;
Shiro, Y. J. Biol. Chem. 2004, 279, 55247-55254.
(47) Hendriks, J.; Warne, A.; Gohlke, U.; Haltia, T.; Ludovici, C.; Lübben, M.; Saraste, M.
Biochemistry 1998, 37, 13102-13109.
(48) Berto, T. C.; Speelman, A. L.; Zheng, S.; Lehnert, N. Coord. Chem. Rev. 2013, 257, 244-
259.
(49) Matsumura, H.; Hayashi, T.; Chakraborty, S.; Lu, Y.; Moënne-Loccoz, P. J. Am. Chem.
Soc. 2014, 136, 2420-2431.
(50) Collman, J. P.; Yang, Y.; Dey, A.; Decréau, R. A.; Ghosh, S.; Ohta, T.; Solomon, E. I.
Proc. Natl. Acad. Sci. USA 2008, 105, 15660-15665.
(51) Lehnert, N.; Scheidt, W. R.; Wolf, M. W. Struct. Bond. 2014, 154, 155-223.
(52) Hendriks, J. H. M.; Jasaitis, A.; Saraste, M.; Verkhovsky, M. I. Biochemistry 2002, 41,
2331-2340.
(53) Blomberg, L. M.; Blomberg, M. R. A.; Siegbahn, P. E. M. BBA - Bioenergetics 2006, 1757,
240-252.
(54) Blomberg, M. R. A.; Siegbahn, P. E. M. Biochemistry 2012, 51, 5173-5186.
(55) Attia, A. A. A.; Silaghi-Dumitrescu, R. J. Mol. Model. 2015, 21, 1-12.
(56) Butler, C. S.; Seward, H. E.; Greenwood, C.; Thomson, A. J. Biochemistry 1997, 36,
16259-16266.
(57) Watmough, N. J.; Cheesman, M. R.; Butler, C. S.; Little, R. H.; Greenwood, C.; Thomson,
A. J. J. Bioenerg.Biomembr. 1998, 30, 55-62.
(58) Gardner, A. M.; Helmick, R. A.; Gardner, P. R. J. Biol. Chem. 2002, 277, 8172-8177.
(59) Kurtz, J. D. M. Dalton Trans. 2007, 4115-4121.
(60) Vicente, J. B.; Carrondo, M. A.; Teixeira, M.; Frazão, C. "Flavodiiron Proteins: Nitric
Oxide and/or Oxygen Reductases" In Handbook of Metalloproteins; John Wiley & Sons, Ltd:
2006.
(61) Khatua, S.; Majumdar, A. J. Inorg. Biochem. 2015, 142, 145-153.

19
(62) Romão, C. V.; Vicente, J. B.; Borges, P. T.; Frazão, C.; Teixeira, M. J. Biol. Inorg. Chem.
2016, 21, 39-52.
(63) Silaghi-Dumitrescu, R.; Kurtz, D. M.; Ljungdahl, L. G.; Lanzilotta, W. N. Biochemistry
2005, 44, 6492-6501.
(64) Frazao, C.; Silva, G.; Gomes, C. M.; Matias, P.; Coelho, R.; Sieker, L.; Macedo, S.; Liu, M.
Y.; Oliveira, S.; Teixeira, M.; Xavier, A. V.; Rodrigues-Pousada, C.; Carrondo, M. A.; Le Gall,
J. Nat Struct Mol Biol 2000, 7, 1041-1045.
(65) Fang, H.; Caranto, J. D.; Mendoza, R.; Taylor, A. B.; Hart, P. J.; Kurtz, D. M. J. Biol.
Inorg. Chem. 2012, 17, 1231-1239.
(66) Haskin, C. J.; Ravi, N.; Lynch, J. B.; Munck, E.; Que, L. Biochemistry 1995, 34, 11090-
11098.
(67) Coufal, D. E.; Tavares, P.; Pereira, A. S.; Hyunh, B. H.; Lippard, S. J. Biochemistry 1999,
38, 4504-4513.
(68) Feig, A. L.; Bautista, M. T.; Lippard, S. J. Inorg. Chem. 1996, 35, 6892-6898.
(69) Zheng, S.; Berto, T. C.; Dahl, E. W.; Hoffman, M. B.; Speelman, A. L.; Lehnert, N. J. Am.
Chem. Soc. 2013, 135, 4902-4905.
(70) Caranto, J. D.; Weitz, A.; Giri, N.; Hendrich, M. P.; Kurtz, D. M. Biochemistry 2014, 53,
5631-5637.
(71) Caranto, J. D.; Weitz, A.; Hendrich, M. P.; Kurtz, D. M. J. Am. Chem. Soc. 2014, 136,
7981-7992.
(72) Hayashi, T.; Caranto, J. D.; Wampler, D. A.; Kurtz, D. M.; Moënne-Loccoz, P.
Biochemistry 2010, 49, 7040-7049.
(73) Hayashi, T.; Caranto, J. D.; Matsumura, H.; Kurtz, D. M.; Moënne-Loccoz, P. J. Am.
Chem. Soc. 2012, 134, 6878-6884.
(74) Blomberg, L. M.; Blomberg, M. R. A.; Siegbahn, P. E. M. J. Biol. Inorg. Chem. 2006, 12,
79-89.
(75) Jiang, Y.; Hayashi, T.; Matsumura, H.; Do, L. H.; Majumdar, A.; Lippard, S. J.; Moënne-
Loccoz, P. J. Am. Chem. Soc. 2014, 136, 12524-12527.
(76) Choi, I. K.; Liu, Y.; Feng, D.; Paeng, K. J.; Ryan, M. D. Inorg. Chem. 1991, 30, 1832-
1839.
(77) Wei, Z.; Ryan, M. D. Inorg. Chem. 2010, 49, 6948-6954.
(78) Lancon, D.; Kadish, K. M. J. Am. Chem. Soc. 1983, 105, 5610-5617.
20
(79) Mu, X. H.; Kadish, K. M. Inorg. Chem. 1988, 27, 4720-4725.
(80) Hu, B.; Li, J. Angew. Chem. Int. Ed. 2015, 54, 10579-10582.
(81) Kundakarla, N.; Lindeman, S.; Rahman, M. H.; Ryan, M. D. Inorg. Chem. 2016, 55, 2070-
2075.
(82) Abucayon, E. G.; Khade, R. L.; Powell, D. R.; Zhang, Y.; Richter-Addo, G. B. J. Am.
Chem. Soc. 2016, 138, 104-107.
(83) Zhang, Y.; Pavlosky, M. A.; Brown, C. A.; Westre, T. E.; Hedman, B.; Hodgson, K. O.;
Solomon, E. I. J. Am. Chem. Soc. 1992, 114, 9189-9191.
(84) Brown, C. A.; Pavlosky, M. A.; Westre, T. E.; Zhang, Y.; Hedman, B.; Hodgson, K. O.;
Solomon, E. I. J. Am. Chem. Soc. 1995, 117, 715-732.
(85) Brown, C. D.; Neidig, M. L.; Neibergall, M. B.; Lipscomb, J. D.; Solomon, E. I. J. Am.
Chem. Soc. 2007, 129, 7427-7438.
(86) Jackson, T. A.; Yikilmaz, E.; Miller, A.-F.; Brunold, T. C. J. Am. Chem. Soc. 2003, 125,
8348-8363.
(87) Diebold, A. R.; Brown-Marshall, C. D.; Neidig, M. L.; Brownlee, J. M.; Moran, G. R.;
Solomon, E. I. J. Am. Chem. Soc. 2011, 133, 18148-18160.
(88) Ye, S.; Price, J. C.; Barr, E. W.; Green, M. T.; Bollinger, J. M.; Krebs, C.; Neese, F. J. Am.
Chem. Soc. 2010, 132, 4739-4751.
(89) Park, H.; Bittner, M. M.; Baus, J. S.; Lindeman, S. V.; Fiedler, A. T. Inorg. Chem. 2012,
51, 10279-10289.
(90) Pohl, K.; Wieghardt, K.; Nuber, B.; Weiss, J. J. Chem. Soc., Dalton Trans. 1987 187-192.
(91) Shepherd, R. E.; Sweetland, M. A.; Junker, D. E. J. Inorg. Biochem. 1997, 65, 1-14.
(92) Ray, M.; Golombek, A. P.; Hendrich, M. P.; Yap, G. P. A.; Liable-Sands, L. M.;
Rheingold, A. L.; Borovik, A. S. Inorg. Chem. 1999, 38, 3110-3115.
(93) Tonzetich, Z. J.; Héroguel, F.; Do, L. H.; Lippard, S. J. Inorg. Chem. 2011, 50, 1570-1579.

21
Chapter 2
Characterization of a High-Spin {FeNO}6-8 Series
In contrast to low-spin heme systems where the coordination chemistry of NO is well-
developed, and the characterization of {FeNO}6, {FeNO}7, and {FeNO}8 compounds have all
been reported1-2, in the high-spin non-heme case only {FeNO}7 complexes have been extensively
studied.3 Importantly, as discussed Chapter 1, a high-spin {FeN(H)O}8-type species is a proposed
intermediate in the “super-reduced” mechanism for N2O production in FNORs. In order to
generate a stable high-spin iron nitrosyl which can be isolated in the {FeNO}6, {FeNO}7, and
{FeNO}8 redox states, we have employed the peralkylguanidine ligand TMG3tren (Scheme 2.1),
first reported by Sundermeyer and co-workers.4 This ligand choice is advantageous for several
reasons. First, TMG3tren is sterically bulky, which protects the potentially reactive Fe-NO unit.
This is particularly important for isolation of a stable {FeNO}8 species because, as will be
discussed in Chapter 3, one of the major decomposition pathways for monomeric {FeNO}8
complexes in the absence of steric bulk is disproportionation. Second, TMG3tren can act as an
extremely strong donor due to charge delocalization over the guanidine units and is therefore able
to stabilize metals in high oxidation states. For example, Que and co-workers have successfully
isolated both Fe(IV)=O and Fe(IV)-CN complexes with TMG3tren5-6, which suggests that an
{FeNO}6 complex could also be isolable with this ligand.
22
Scheme 2.1 Structure of the TMG3tren iron nitrosyl complex.
In this chapter, the generation and spectroscopic characterization of the high-spin
{FeNO}6-8 series [Fe(TMG3tren)(NO)]n+ (n = 1 - 3) is reported. This set of complexes represents
the first such series for a high-spin iron center. Spectroscopic studies in conjunction with DFT
calculations show that the redox chemistry in this series is iron-based and leads to changes in the
covalency of the Fe-NO unit. This behavior is contrasted to that of corresponding low-spin
systems. Finally, the reactivity of the {FeNO}8 complex 2 with weak acids to generate an
{FeN(H)O}8 complex is reported.
The studies described in this chapter are in part adapted with permission from: Speelman,
A.L.; Lehnert, N. Angew. Chem. Int. Ed. 2013, 52, 12283-122877 and from a just accepted
manuscript: Speelman, A.L.; Zhang, B.; Krebs, C.; Lehnert, N. Angew. Chem. Int. Ed. 2016 DOI:
10.1002/anie.201601742.8 The data collection and analysis for the Mössbauer studies described in
Sections 2.2 and 2.4 were performed by postdoc Bo Zhang in Prof. Carsten Krebs’ group
(Pennsylvania State University).
2.1 Synthesis and Spectroscopic Characterization of {FeNO}7 Complexes
Addition of excess NO gas to a colorless CH3CN solution of
[Fe(TMG3tren)(CH3CN)](OTf)2 causes an immediate color change to red-black, which is
indicative of formation of the {FeNO}7 complex 1. NO binding leads to the appearance of an
intense absorption band at 368 nm (ε = 6,300 M-1cm-1) and two lower-intensity features at 569 nm

23
(ε = 340 M-1cm-1) and 800 nm (ε = 140 M-1cm-1) in the UV-Vis spectrum. Complex 1 has the
expected high-spin ground state, as indicated by its EPR spectrum, which exhibits a rhombic signal
with effective g-values centered around g = 4 and g = 2 typical for a high-spin {FeNO}7 species
(Figure 2.1). This is due to an S = 3/2 ground state which arises from antiferromagnetic coupling
of high-spin Fe(III) to a triplet NO ligand, as described by Solomon and co-workers.9
Figure 2.1 X-band EPR spectrum of 1 in frozen 1:1 propionitrile:butyronitrile solution recorded at 4.2 K.
The spectrum is shown with a simulation with the following parameters: gx = gy = gz = 2.0; D = 7.0 cm-1;
E/D = 0.063; (E/D) = 0.014.
The identity of 1 was further confirmed via x-ray crystallography (Figure 2.2 and Table
2.1). As expected, 1 has a trigonal bipyramidal geometry (Addison’s parameter10 = 1.03). As
noted for other TMG3tren complexes, the value slightly larger than 1.0 arises from the
displacement of the Fe from the equatorial plane defined by the guanidinium nitrogen atoms.6 The
Fe-N(O) and N-O bond lengths are typical for an {FeNO}7 species.3 The Fe-N-O unit has a
100 200 300 400
g = 1.97
g = 3.61
Derivative E
PR
Inte
nsity
B / mT
1
Simulation
g = 4.38
24
relatively linear angle of 168°, which is presumably a result of the sterically encumbering
TMG3tren ligand, as discussed below.
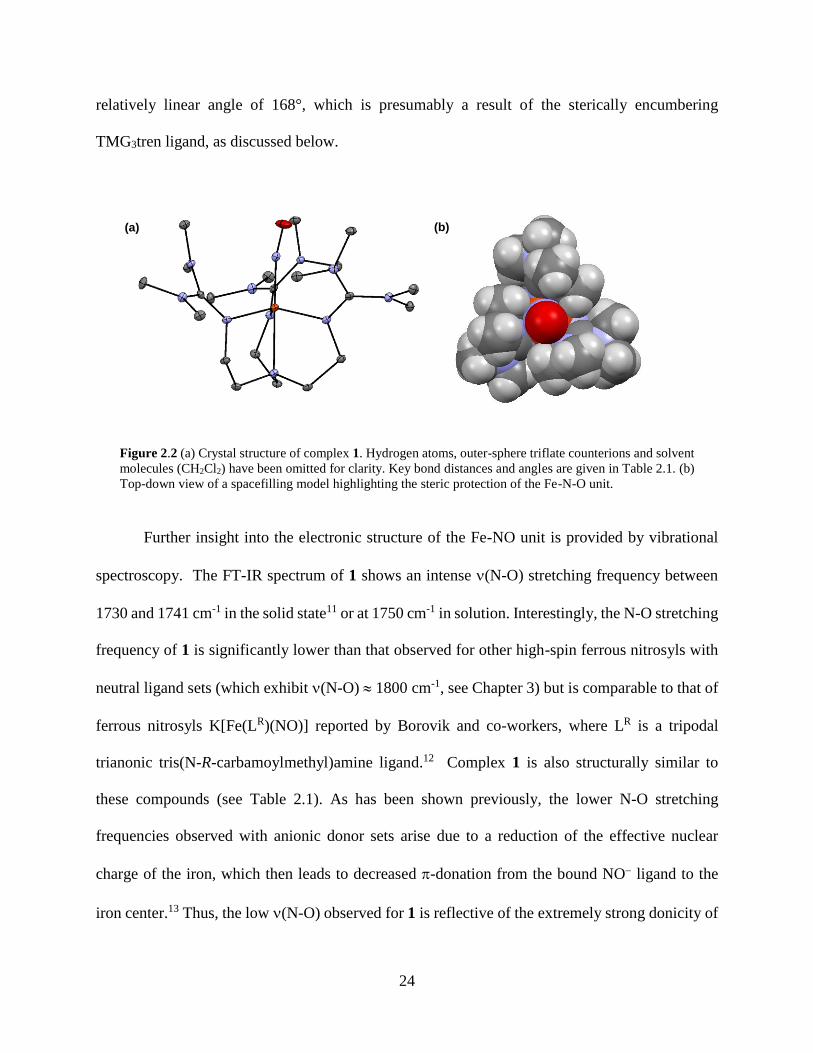
Figure 2.2 (a) Crystal structure of complex 1. Hydrogen atoms, outer-sphere triflate counterions and solvent
molecules (CH2Cl2) have been omitted for clarity. Key bond distances and angles are given in Table 2.1. (b)
Top-down view of a spacefilling model highlighting the steric protection of the Fe-N-O unit.
Further insight into the electronic structure of the Fe-NO unit is provided by vibrational
spectroscopy. The FT-IR spectrum of 1 shows an intense (N-O) stretching frequency between
1730 and 1741 cm-1 in the solid state11 or at 1750 cm-1 in solution. Interestingly, the N-O stretching
frequency of 1 is significantly lower than that observed for other high-spin ferrous nitrosyls with
neutral ligand sets (which exhibit (N-O) 1800 cm-1, see Chapter 3) but is comparable to that of
ferrous nitrosyls K[Fe(LR)(NO)] reported by Borovik and co-workers, where LR is a tripodal
trianonic tris(N-R-carbamoylmethyl)amine ligand.12 Complex 1 is also structurally similar to
these compounds (see Table 2.1). As has been shown previously, the lower N-O stretching
frequencies observed with anionic donor sets arise due to a reduction of the effective nuclear
charge of the iron, which then leads to decreased -donation from the bound NO ligand to the
iron center.13 Thus, the low (N-O) observed for 1 is reflective of the extremely strong donicity of
(a) (b)

25
the TMG3tren ligand. However, in the K[Fe(LiPr)(NO)] series, it was also shown that the NO
stretching frequency increases as steric strain decreases (i.e. as the Fe-N-O unit becomes more
bent). Thus the low (N-O) observed for 1 could potentially also arise from perturbations of the
structure of the Fe-N-O unit due to the steric bulk of the TMG3tren ligand.
Table 2.1 Structural parameters (in Å or °) and N-O stretching frequencies (in cm-1) for 1,
[Fe(TMG2dien)(NO)(OTf)](OTf), and K[Fe(LR)(NO)] reported by Borovik and co-workers.12
Compound Fe-N N-O Fe-N-O Fe-Naxa Fe-Neq
b d[Fe-Neq]c (N-O)
1 1.748 1.154 168.0 2.251 2.037 0.364 1741d
[Fe(TMG2dien)(NO)(OTf)]+ 1.750 1.162 161.8 2.290 1.994 0.284 1770
K[Fe(LiPr)(NO)] 1.735 1.122 178.3 2.189 2.027 0.424 1729
K[Fe(Lcyp)(NO)] 1.737 1.138 172.7 2.184 2.026 0.428 1739
K[Fe(Ldmp)(NO)] 1.748 1.146 160.3 2.198 2.026 0.395 1750 a Fe-N bond length for axial (amine) ligand b Average Fe-N bond length for equatorial nitrogen ligands c
Displacement of iron atom from the equatorial plane d N-O stretching frequency for crystalline material.
Figure 2.3 (a) Crystal structure of [Fe(TMG2dien)(NO)(OTf)](OTf). Hydrogen atoms and the outer-sphere
counterion have been omitted for clarity. Key bond distances and angles are given in Table 2.1. (b) Top down
view of a spacefilling model.
In order to further study the factors that contribute to the low (N-O) of 1, the complex
[Fe(TMG2dien)(NO)(OTf)](OTf) was synthesized. The TMG2dien ligand14 removes a guandine
donor and creates an open coordination site, reducing steric strain (Figure 2.3). The (N-O) for
this complex is observed at 1770 cm-1 in solid state and in solution. The geometry of the Fe-N-O
unit is overall very similar to 1, although the NO unit is slightly more bent (Table 2.1). The
relatively minor geometric changes between these two complexes, however, indicate that the low
(a) (b)
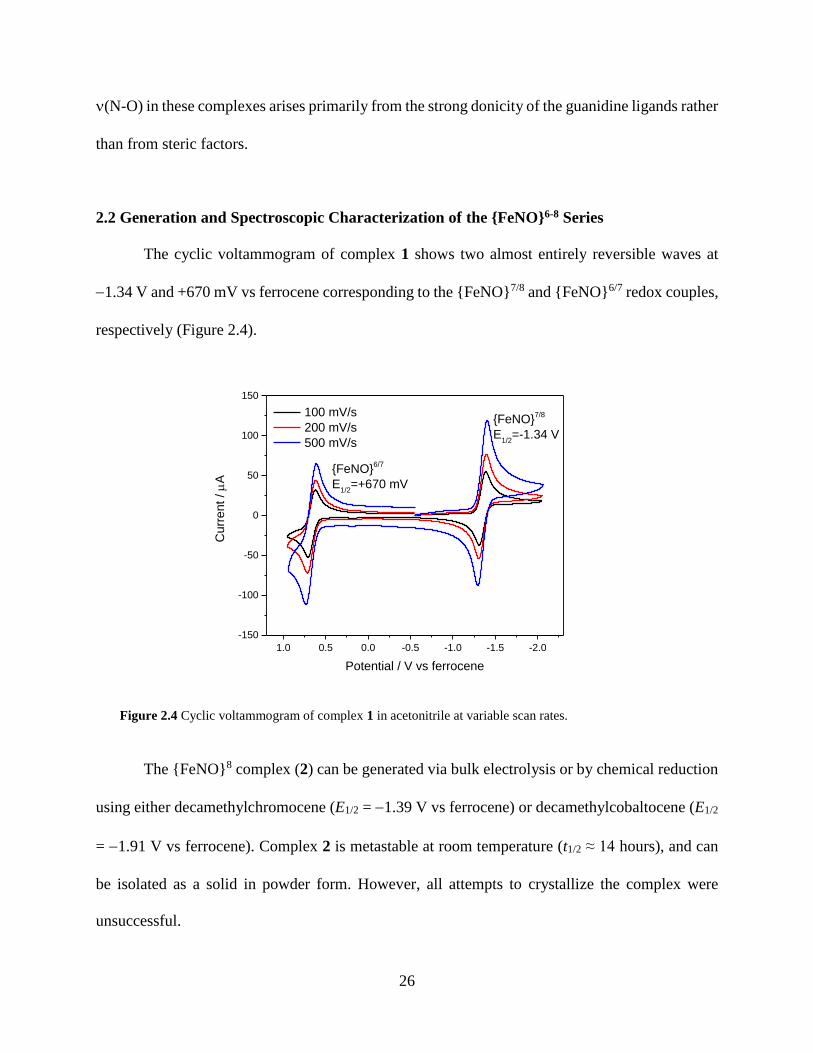
26
(N-O) in these complexes arises primarily from the strong donicity of the guanidine ligands rather
than from steric factors.
2.2 Generation and Spectroscopic Characterization of the {FeNO}6-8 Series
The cyclic voltammogram of complex 1 shows two almost entirely reversible waves at
1.34 V and +670 mV vs ferrocene corresponding to the {FeNO}7/8 and {FeNO}6/7 redox couples,
respectively (Figure 2.4).
Figure 2.4 Cyclic voltammogram of complex 1 in acetonitrile at variable scan rates.
The {FeNO}8 complex (2) can be generated via bulk electrolysis or by chemical reduction
using either decamethylchromocene (E1/2 = 1.39 V vs ferrocene) or decamethylcobaltocene (E1/2
= 1.91 V vs ferrocene). Complex 2 is metastable at room temperature (t1/2 ≈ 14 hours), and can
be isolated as a solid in powder form. However, all attempts to crystallize the complex were
unsuccessful.
1.0 0.5 0.0 -0.5 -1.0 -1.5 -2.0
-150
-100
-50
0
50
100
150
{FeNO}6/7
E1/2
=+670 mV
Curr
ent /
A
Potential / V vs ferrocene
100 mV/s
200 mV/s
500 mV/s
{FeNO}7/8
E1/2
=-1.34 V

27
The importance of the steric bulk of the TMG3tren ligand in protecting the Fe-NO unit of
the 1 is demonstrated by a comparison to the behavior of [Fe(TMG2dien)(NO)(OTf)](OTf). The
reduction of this {FeNO}7 complex is irreversible (Figure 2.5a). Upon treatment of the {FeNO}7
complex with cobaltocene, a new species with N-O stretching frequencies at 1672 cm-1 and 1614
cm-1 is formed (Figure 2.5b). The position and relative intensities of these peaks are suggestive of
formation of an {Fe(NO)2}10 dinitrosyl iron complex (DNIC15), which corresponds to a formal
transfer of NO from one complex to another:
{FeNO}8 ½ {Fe(NO)2}10 + ½ Fe(II)
This type of decomposition is common among {FeNO}8 complexes with non-sterically hindered
ligands16, and will be discussed further in Chapter 3. Importantly, a species with the same NO
stretching frequencies is formed upon decomposition of 2, which implies that the steric protection
provided by the TMG3tren ligand slows the same disproportionation reaction in 2.
Figure 2.5 (a) Cyclic voltammogram of [Fe(TMG2dien)(NO)(OTf)](OTf) in CH3CN. (b) Solution IR of
[Fe(TMG2dien)(NO)](OTf)2 before (black) and after (red) treatment with cobaltocene in CD3CN.
The {FeNO}6 complex (3) is more unstable at room temperature and consequently cannot
be generated via bulk electrolysis.17 However, 3 can be generated quantitatively by treatment of 1
1900 1800 1700 1600 1500 1400 1300
0.0
0.1
0.2
0.3
0.4
0.5
Ab
s
Energy / cm-1
[Fe(TMG2dien)(NO)(OTf)](OTf)
+ CoCp2
17701672
1614
(a) (b)
-0.6 -0.8 -1.0 -1.2 -1.4
-20
0
20
40
60
80
Cu
rre
nt
/
A
Potential / V vs ferrocene
100 mV/s
250 mV/s
500 mV/s
Ep = -1.00 V

28
with a slight excess of thianthrene radical cation (E1/2 = +860 mV vs ferrocene).18 At room
temperature, the decomposition of 3 leads to formation of both 1 and a ferric species in less than
30 minutes, as shown by NMR, EPR and IR spectroscopies (Figure 2.6).
Figure 2.6 (a) EPR spectra of 1 (black), 3 (red), and the product of the decomposition of 3 (blue) after 25
minutes at room temperature in CH3CN. (b) Solution IR spectra showing the product of the decomposition
of 3 at room temperature. Spectra showing the decomposition of [Fe(TMG3tren)](OTf)2 upon oxidation with
thianthrene radical cation are shown for comparison in the bottom panel. Note that previous studies have
demonstrated that in the absence of an axial ligand, ferric TMG3tren complexes are unstable.4-5
The decomposition of 3 is slowed significantly at 35°C, which allowed us to crystallize
this species (Figure 2.7). The Fe-N-O bond of 3 is completely linear, compared to the bent Fe-N-
O bond of 1 and other {FeNO}7 complexes. Linearization of the Fe-NO bond in {FeNO}6
complexes has been observed previously for low-spin systems; the short, linear Fe-N-O bond in
these complexes allows maximal Fe-NO -interactions.19 Oxidation leads to a decrease in the Fe-
N(O) bond length in 3 as compared to 1, whereas the N-O bond length is only marginally decreased
in 3. Although no structural characterization is available for the {FeNO}7 form of [Fe(PS3*)(NO)]
(which is the only other structurally characterized paramagnetic {FeNO}6 complex), the {FeNO}7
form of the closely related complex [Fe(NS3)(NO)] was structurally characterized; the geometric
(a) (b)
100 200 300 400
Derivative E
PR
Inte
nsity
B / mT
{FeNO}7 1
{FeNO}6 3
Decomposed 3
2000 1900 1800 1700 1600 1500 1400
0.0
0.2
0.4
0.6
0.8
2000 1900 1800 1700 1600 1500 1400
0.0
0.2
0.4
0.6
Absorb
ance
{FeNO}7 1
{FeNO}6 3
3, t = 20 min
1578
1628
17501878
Energy / cm-1
Fe(TMG3tren)(OTf)
2
+ oxidant, t = 1 hr
+ oxidant, t = 24 hr
1628
16201583
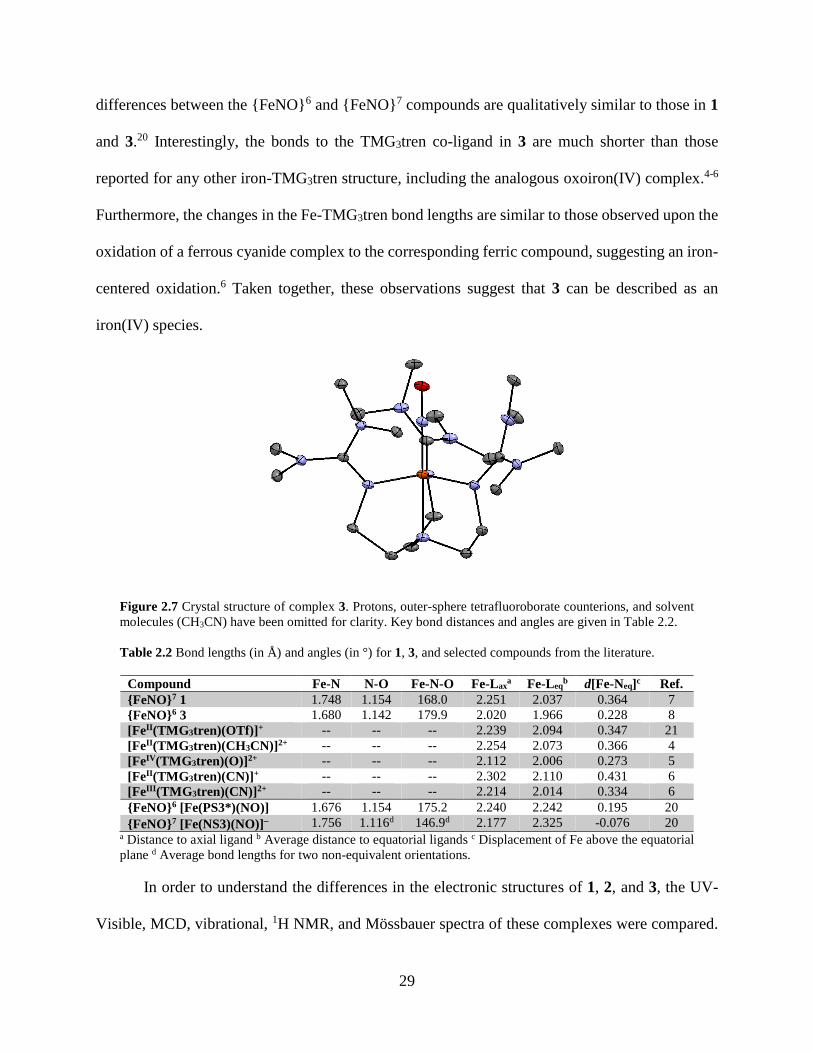
29
differences between the {FeNO}6 and {FeNO}7 compounds are qualitatively similar to those in 1
and 3.20 Interestingly, the bonds to the TMG3tren co-ligand in 3 are much shorter than those
reported for any other iron-TMG3tren structure, including the analogous oxoiron(IV) complex.4-6
Furthermore, the changes in the Fe-TMG3tren bond lengths are similar to those observed upon the
oxidation of a ferrous cyanide complex to the corresponding ferric compound, suggesting an iron-
centered oxidation.6 Taken together, these observations suggest that 3 can be described as an
iron(IV) species.
Figure 2.7 Crystal structure of complex 3. Protons, outer-sphere tetrafluoroborate counterions, and solvent
molecules (CH3CN) have been omitted for clarity. Key bond distances and angles are given in Table 2.2.
Table 2.2 Bond lengths (in Å) and angles (in °) for 1, 3, and selected compounds from the literature.
Compound Fe-N N-O Fe-N-O Fe-Laxa Fe-Leq
b d[Fe-Neq]c Ref.
{FeNO}7 1 1.748 1.154 168.0 2.251 2.037 0.364 7
{FeNO}6 3 1.680 1.142 179.9 2.020 1.966 0.228 8
[FeII(TMG3tren)(OTf)]+ -- -- -- 2.239 2.094 0.347 21
[FeII(TMG3tren)(CH3CN)]2+ -- -- -- 2.254 2.073 0.366 4
[FeIV(TMG3tren)(O)]2+ -- -- -- 2.112 2.006 0.273 5
[FeII(TMG3tren)(CN)]+ -- -- -- 2.302 2.110 0.431 6
[FeIII(TMG3tren)(CN)]2+ -- -- -- 2.214 2.014 0.334 6
{FeNO}6 [Fe(PS3*)(NO)] 1.676 1.154 175.2 2.240 2.242 0.195 20
{FeNO}7 [Fe(NS3)(NO)] 1.756 1.116d 146.9d 2.177 2.325 -0.076 20 a Distance to axial ligand b Average distance to equatorial ligands c Displacement of Fe above the equatorial
plane d Average bond lengths for two non-equivalent orientations.
In order to understand the differences in the electronic structures of 1, 2, and 3, the UV-
Visible, MCD, vibrational, 1H NMR, and Mössbauer spectra of these complexes were compared.
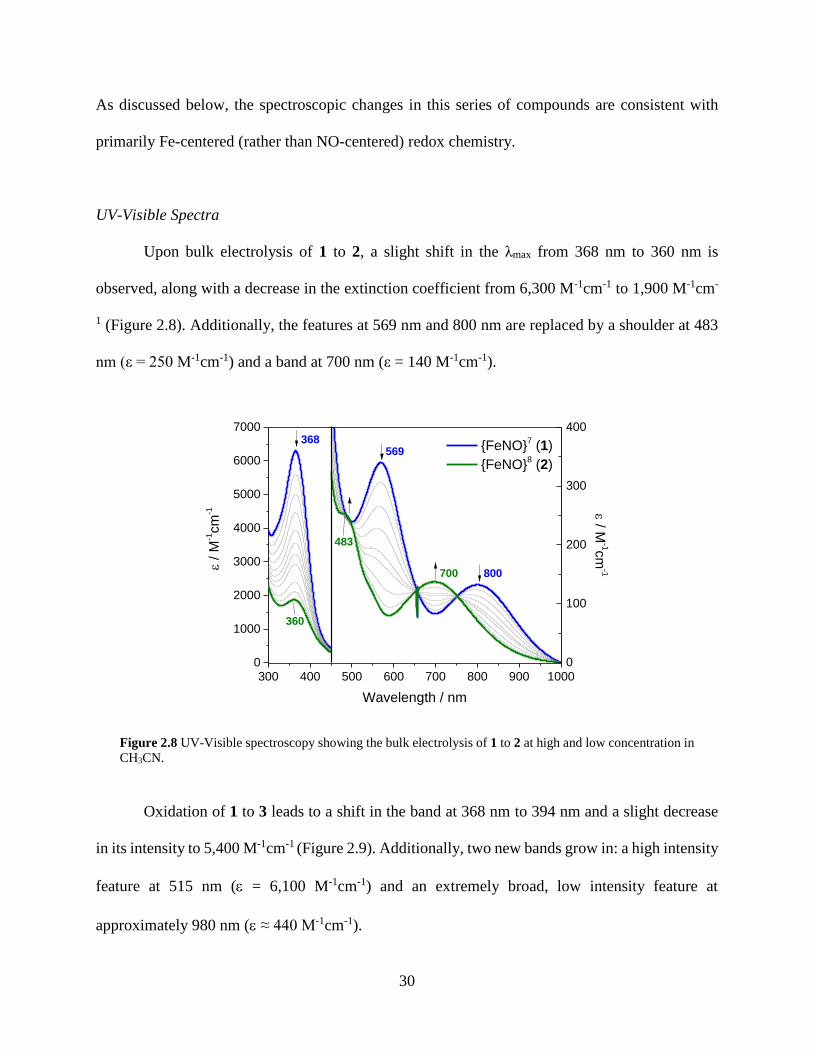
30
As discussed below, the spectroscopic changes in this series of compounds are consistent with
primarily Fe-centered (rather than NO-centered) redox chemistry.
UV-Visible Spectra
Upon bulk electrolysis of 1 to 2, a slight shift in the λmax from 368 nm to 360 nm is
observed, along with a decrease in the extinction coefficient from 6,300 M-1cm-1 to 1,900 M-1cm-
1 (Figure 2.8). Additionally, the features at 569 nm and 800 nm are replaced by a shoulder at 483
nm (ε = 250 M-1cm-1) and a band at 700 nm (ε = 140 M-1cm-1).
Figure 2.8 UV-Visible spectroscopy showing the bulk electrolysis of 1 to 2 at high and low concentration in
CH3CN.
Oxidation of 1 to 3 leads to a shift in the band at 368 nm to 394 nm and a slight decrease
in its intensity to 5,400 M-1cm-1 (Figure 2.9). Additionally, two new bands grow in: a high intensity
feature at 515 nm ( = 6,100 M-1cm-1) and an extremely broad, low intensity feature at
approximately 980 nm ( ≈ 440 M-1cm-1).
300 400 500 600 700 800 900 10000
1000
2000
3000
4000
5000
6000
7000
/
M-1cm
-1
Wavelength / nm
{FeNO}7 (1)
{FeNO}8 (2)
360
0
100
200
300
400368
700 800
/ M-1c
m-1
569
483
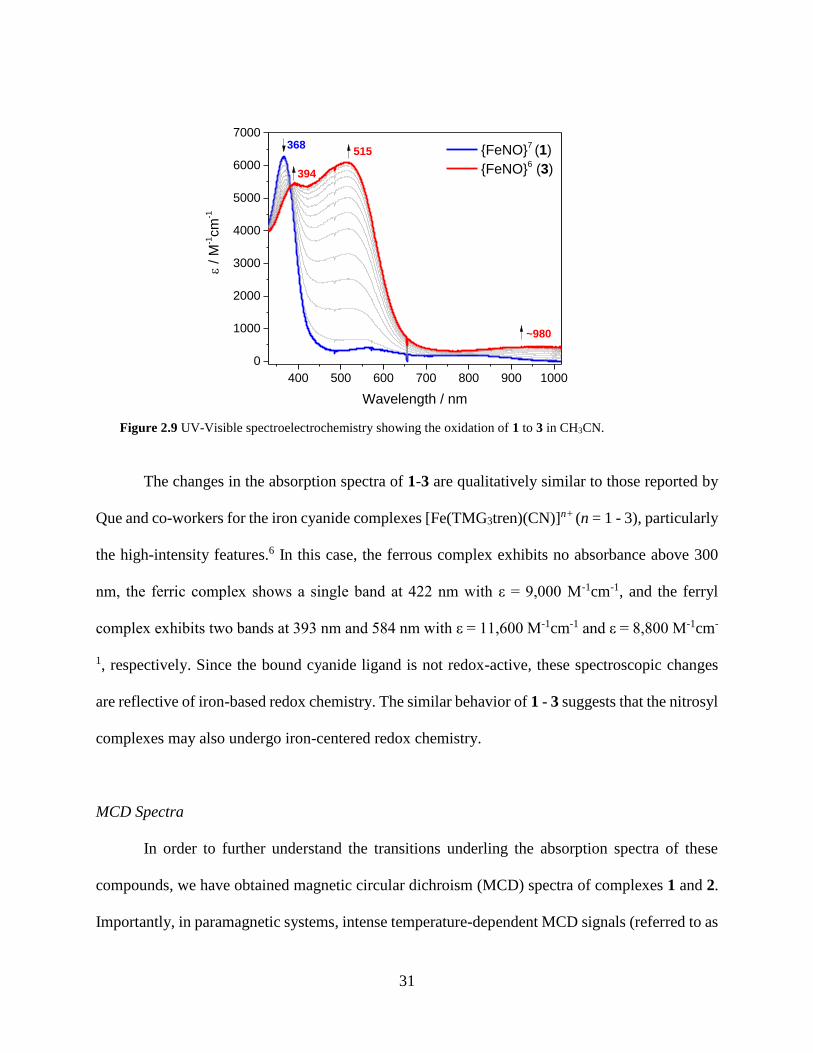
31
Figure 2.9 UV-Visible spectroelectrochemistry showing the oxidation of 1 to 3 in CH3CN.
The changes in the absorption spectra of 1-3 are qualitatively similar to those reported by
Que and co-workers for the iron cyanide complexes [Fe(TMG3tren)(CN)]n+ (n = 1 - 3), particularly
the high-intensity features.6 In this case, the ferrous complex exhibits no absorbance above 300
nm, the ferric complex shows a single band at 422 nm with ε = 9,000 M-1cm-1, and the ferryl
complex exhibits two bands at 393 nm and 584 nm with ε = 11,600 M-1cm-1 and ε = 8,800 M-1cm-
1, respectively. Since the bound cyanide ligand is not redox-active, these spectroscopic changes
are reflective of iron-based redox chemistry. The similar behavior of 1 - 3 suggests that the nitrosyl
complexes may also undergo iron-centered redox chemistry.
MCD Spectra
In order to further understand the transitions underling the absorption spectra of these
compounds, we have obtained magnetic circular dichroism (MCD) spectra of complexes 1 and 2.
Importantly, in paramagnetic systems, intense temperature-dependent MCD signals (referred to as
400 500 600 700 800 900 1000
0
1000
2000
3000
4000
5000
6000
7000
394
/
M-1cm
-1
Wavelength / nm
{FeNO}7 (1)
{FeNO}6 (3)
368515
~980

32
C-term signals) are observed at low temperature. Because these signals derive their intensity from
spin-orbit coupling, metal-centered transitions such as d-d transitions and ligand-to-metal charge
transfer (LMCT) transitions have relatively high intensities in MCD spectra. In addition, by
obtaining variable temperature variable field (VTVH) MCD data, it is possible to determine the
polarization of observed transitions which greatly assists in making spectral assignments.22-24
The MCD spectrum of 1 is shown in Figure 2.10 along with a correlated Gaussian
deconvolution of the MCD and UV-Visible spectra. The high-intensity feature in the UV-Visible
spectrum of 1 consists of a derivative-shaped (pseudo A-term) signal with high intensity in the
MCD spectrum. A similar feature was observed in the MCD spectrum of [FeIV(TMG3tren)(O)]2+
and was assigned based on the ratio of MCD-to-UV-Vis intensity as a set of overlapping LMCT
transitions.25 A number of transitions can also be observed in the lower-energy region of the
spectrum of 1. Previous MCD studies of non-heme {FeNO}7 model complexes and proteins have
established that transitions in this region are generally either d-d transitions or NO * FeIII
transitions.9,26-27
In order to assign all of the observed transitions in the spectrum of 1, we have also obtained
VTVH data. Interestingly, the high- and low-energy transitions exhibit completely different
magnetic saturation behavior (Figure 2.11). Whereas the isotherms for the high-energy bands show
nesting behavior, the isotherms for the low-energy bands show overlaid behavior. This indicates
that these transitions are polarized in different directions. In order to limit the number of variables
during fits of the polarizations of the bands, the zero-field splitting parameters required to fit the
VTVH isotherms were obtained from fits of high-field Mössbauer spectra (performed by Dr. Bo
Zhang at Penn State) and from EPR data (discussed in Section 2.1). Preliminary fits of the MCD
polarizations suggest that the higher-energy transitions are x,y-polarized (which would be
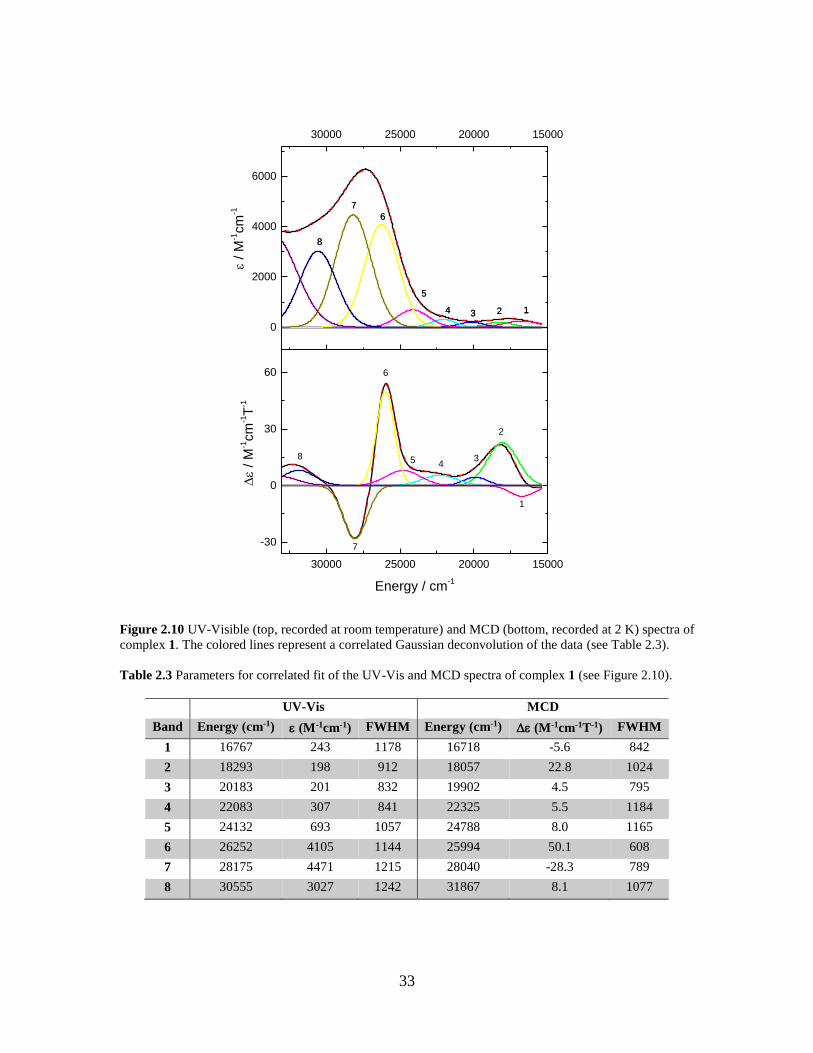
33
Figure 2.10 UV-Visible (top, recorded at room temperature) and MCD (bottom, recorded at 2 K) spectra of
complex 1. The colored lines represent a correlated Gaussian deconvolution of the data (see Table 2.3).
Table 2.3 Parameters for correlated fit of the UV-Vis and MCD spectra of complex 1 (see Figure 2.10).
UV-Vis MCD
Band Energy (cm-1) (M-1cm-1) FWHM Energy (cm-1) (M-1cm-1T-1) FWHM
1 16767 243 1178 16718 -5.6 842
2 18293 198 912 18057 22.8 1024
3 20183 201 832 19902 4.5 795
4 22083 307 841 22325 5.5 1184
5 24132 693 1057 24788 8.0 1165
6 26252 4105 1144 25994 50.1 608
7 28175 4471 1215 28040 -28.3 789
8 30555 3027 1242 31867 8.1 1077
30000 25000 20000 15000
0
2000
4000
6000
30000 25000 20000 15000
-30
0
30
60
8
7
6
5 34
2
1
1
8
7
6
4
5
2 1
/ M
-1cm
-1
3 1234
5
6
7
8
/ M
-1cm
-1T
-1
Energy / cm-1

34
Figure 2.11 Magnetic saturation curves for the MCD features at (a) 356 nm (band 7), (b) 386 nm (band 6),
and (c) 550 nm (band 2). The experimental data are shown as points. Preliminary fits are shown as solid lines
with the polarizations indicated in the figures and the following parameters: S = 1.5, D = 6.0 cm-1, E/D =
0.07, gx = gy = gz = 2.0.
consistent with a previous proposal that transitions in this region are LMCT transitions between
the iron and TMG3tren ligand6), whereas the lower-energy transitions contain significant amounts
of z-polarization. In particular, the band at 550 nm is essentially entirely z-polarized and is
therefore most likely an NO * FeIII transition. However, further refinement of all of the
simulation parameters is still needed. For example, the axial zero-field splitting parameter D
obtained from the high-field Mössbauer fits is unusually small compared to other {FeNO}7
complexes.9,27-31 We plan to obtain SQUID data on a solid sample of the complex and/or perform
0.0 0.2 0.4 0.6 0.8 1.0 1.2
0.0
0.2
0.4
0.6
0.8
1.0
= 550 nm
2 K
4 K
8 K
12 K
20 K
Norm
ed M
CD
Inte
nsity
H/2kT
Fit:
0.1% x-pol
0.1% y-pol
99.7% z-pol
0.0 0.2 0.4 0.6 0.8 1.0 1.2
0.0
0.2
0.4
0.6
0.8
1.0
= 356 nm
2 K
4 K
8 K
12 K
20 K
No
rme
d M
CD
Inte
nsity
H/2kT
Fit:
46.9% x-pol
51.3% y-pol
1.7% z-pol
0.0 0.2 0.4 0.6 0.8 1.0 1.2
0.0
0.2
0.4
0.6
0.8
1.0
= 386 nm
2 K
4 K
8 K
12 K
20 K
No
rme
d M
CD
Inte
nsity
H/2kT
Fit:
29.9% x-pol
68.0% y-pol
2.0% z-pol
(a) (b)
(c)

35
Figure 2.12 UV-Visible (top, recorded at room temperature) and MCD (bottom, recorded at 2 K) spectra of
complex 2. The colored lines represent a correlated Gaussian deconvolution of the data (see Table 2.4).
Table 2.4 Parameters for correlated fit of the UV-Vis and MCD spectra of complex 2 (see Figure 2.12).
UV-Vis MCD
Band Energy (cm-1) (M-1cm-1) FWHM Energy (cm-1) (M-1cm-1T-1) FWHM
1 12913 64 1046 12490 0.5 1025
2 14191 90 850 14380 -0.5 492
3 15609 84 779 15465 -1.1 555
4 17324 61 786 17440 1.4 822
5 18846 82 857 18654 1.6 544
6 20636 225 1094 20740 2.4 618
7 23066 248 1063 22614 1.9 1021
8 24698 441 1185 24182 0.8 568
9 26483 1195 1278 26095 4.2 727
10 28531 1247 1327 29031 6.3 1192
11 30985 1199 1373 30952 3.9 1397
30000 25000 20000 15000
0
500
1000
1500
2000
30000 25000 20000 15000
0
3
6
9
10
911
8
6
7
4
5
3
2
1
1110
9
8
7 65 34 2
/ M
-1cm
-1
Experimental
Fit
1
/ M
-1cm
-1T
-1
Energy / cm-1

36
temperature-dependent EPR measurements on frozen solutions in order to determine the
magnitude of D. In this way, we hope to obtain a set of zero-field splitting parameters that can fit
both the MCD data and the high-field Mössbauer data. Then, by correlating the experimentally
observed band polarizations from the VTVH MCD data to TD-DFT calculations, we will be able
to assign the identities of the observed transitions.
Figure 2.13 VTVH saturation curves for the MCD features at (a) 382 nm (band 9) and (b) 542 nm (band 5)
in complex 2. The saturation curves for the other MCD features are very similar.
The MCD spectrum of 2 is dramatically different from that of 1, particularly in the high-
energy region (Figure 2.12). In contrast to 1 which contains several high-intensity features, 2
contains only a large number of low-intensity MCD features (Δ < 9 M-1cm-1T-1) as expected for
a ferrous species. (In ferrous complexes, LMCT transitions are generally weak due to the low
covalency of the iron-ligand bonds.) The loss of the high-intensity pseudo-A term feature at high-
energy suggests that the extra electron in the {FeNO}8 species may occupy the iron d-orbital that
served as the acceptor for the LMCT transition in the {FeNO}7 case, although it is also possible
that this transition is simply shifted to higher energy. Interestingly, the magnetic saturation
0.0 0.2 0.4 0.6 0.8 1.0 1.2
0.0
0.2
0.4
0.6
0.8
1.0
382 nm
2 K
4 K
8 K
12 K
20 K
No
rmed M
CD
Inte
nsity
H/2kT
0.0 0.2 0.4 0.6 0.8 1.0 1.2
0.0
0.2
0.4
0.6
0.8
1.0
542 nm
2 K
4 K
8 K
12 K
20 K
No
rmed M
CD
Inte
nsity
H/2kT
(a) (b)
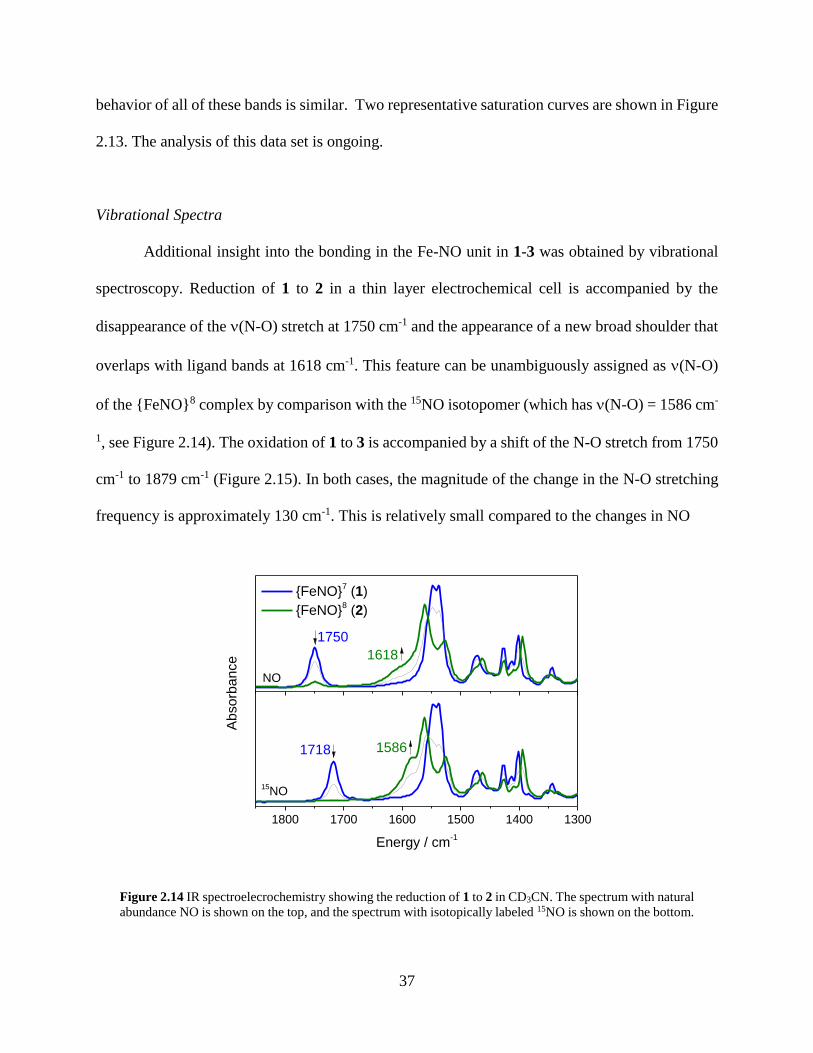
37
behavior of all of these bands is similar. Two representative saturation curves are shown in Figure
2.13. The analysis of this data set is ongoing.
Vibrational Spectra
Additional insight into the bonding in the Fe-NO unit in 1-3 was obtained by vibrational
spectroscopy. Reduction of 1 to 2 in a thin layer electrochemical cell is accompanied by the
disappearance of the (N-O) stretch at 1750 cm-1 and the appearance of a new broad shoulder that
overlaps with ligand bands at 1618 cm-1. This feature can be unambiguously assigned as (N-O)
of the {FeNO}8 complex by comparison with the 15NO isotopomer (which has (N-O) = 1586 cm-
1, see Figure 2.14). The oxidation of 1 to 3 is accompanied by a shift of the N-O stretch from 1750
cm-1 to 1879 cm-1 (Figure 2.15). In both cases, the magnitude of the change in the N-O stretching
frequency is approximately 130 cm-1. This is relatively small compared to the changes in NO
Figure 2.14 IR spectroelecrochemistry showing the reduction of 1 to 2 in CD3CN. The spectrum with natural
abundance NO is shown on the top, and the spectrum with isotopically labeled 15NO is shown on the bottom.
1800 1700 1600 1500 1400 1300
15861718
1618
{FeNO}7 (1)
{FeNO}8 (2)
Ab
sorb
an
ce
1750
15NO
Energy / cm-1
NO
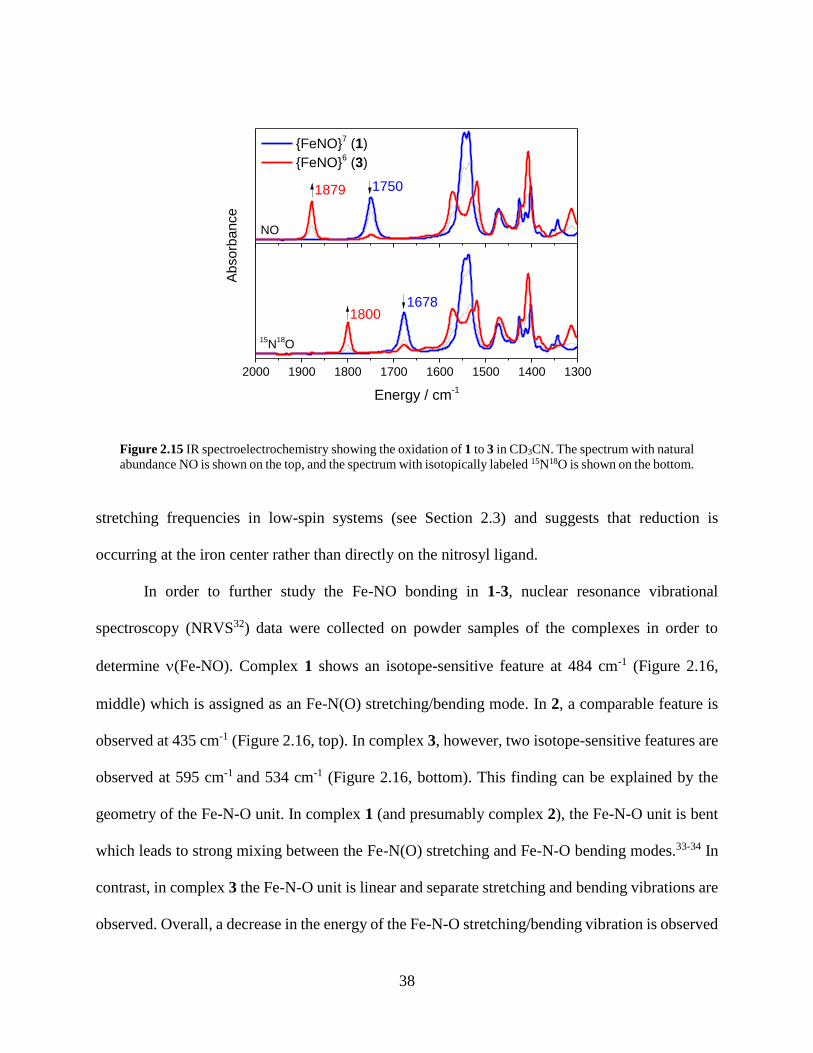
38
Figure 2.15 IR spectroelectrochemistry showing the oxidation of 1 to 3 in CD3CN. The spectrum with natural
abundance NO is shown on the top, and the spectrum with isotopically labeled 15N18O is shown on the bottom.
stretching frequencies in low-spin systems (see Section 2.3) and suggests that reduction is
occurring at the iron center rather than directly on the nitrosyl ligand.
In order to further study the Fe-NO bonding in 1-3, nuclear resonance vibrational
spectroscopy (NRVS32) data were collected on powder samples of the complexes in order to
determine (Fe-NO). Complex 1 shows an isotope-sensitive feature at 484 cm-1 (Figure 2.16,
middle) which is assigned as an Fe-N(O) stretching/bending mode. In 2, a comparable feature is
observed at 435 cm-1 (Figure 2.16, top). In complex 3, however, two isotope-sensitive features are
observed at 595 cm-1 and 534 cm-1 (Figure 2.16, bottom). This finding can be explained by the
geometry of the Fe-N-O unit. In complex 1 (and presumably complex 2), the Fe-N-O unit is bent
which leads to strong mixing between the Fe-N(O) stretching and Fe-N-O bending modes.33-34 In
contrast, in complex 3 the Fe-N-O unit is linear and separate stretching and bending vibrations are
observed. Overall, a decrease in the energy of the Fe-N-O stretching/bending vibration is observed
2000 1900 1800 1700 1600 1500 1400 1300
15N
18O
1800
1879
1678
{FeNO}7 (1)
{FeNO}6 (3)
Ab
so
rba
nce
1750
NO
Energy / cm-1

39
along the {FeNO}6-8 series, which indicates a weakening of the Fe-N(O) bond upon successive
reductions.
Figure 2.16 NRVS spectra of complexes 1 (middle), 2 (top), and 3 (bottom). The spectra with natural
abundance NO are shown as thick lines, and the corresponding isotopically labeled 15N18O are shown as thin
lines.
1H NMR of {FeNO}6 and {FeNO}8: Spin State Determination
As indicated in Section 2.1, EPR spectroscopy demonstrates that 1 has an S = 3/2 ground
state. In order to probe the spin states of the {FeNO}6 and {FeNO}8 complexes, 1H NMR
spectroscopy was employed. The NMR spectra of 1 - 3 all display broad, paramagnetically shifted
residues (Figure 2.17). Using the Evans method, the solution (CD3CN) magnetic moments at room
temperature of 2 and 3 were determined to be 3.1 B and 3.2 B, respectively. These magnetic
0.00
0.01
0.02
0.03
0.00
0.01
0.02
0.03
0 100 200 300 400 500 600
0.000
0.005
0.010
0.015
484
595 () {FeNO}6 (3)
{Fe15
N18
O}6 534 ()
Fe
VD
OS
/ c
m
{FeNO}7 (1)
{Fe15
N18
O}7
Energy / cm-1
{FeNO}8 (2)
{Fe15
N18
O}8
435

40
Figure 2.17 1H NMR spectra (CD3CN) of {FeNO}7 complex 1 (b), {FeNO}8 complex 2 (a), and {FeNO}6
complex 3 (c).
moments are close to the spin-only value (eff = 2.8 B) for an S = 1 system. Complex 1 has a
magnetic moment of 3.9 B consistent with its S = 3/2 spin state under the same conditions.
120 100 80 60 40 20 0 -20ppm
200 150 100 50ppm
160 140 120 100 80 60 40 20ppm
(a)
(b)
(c)
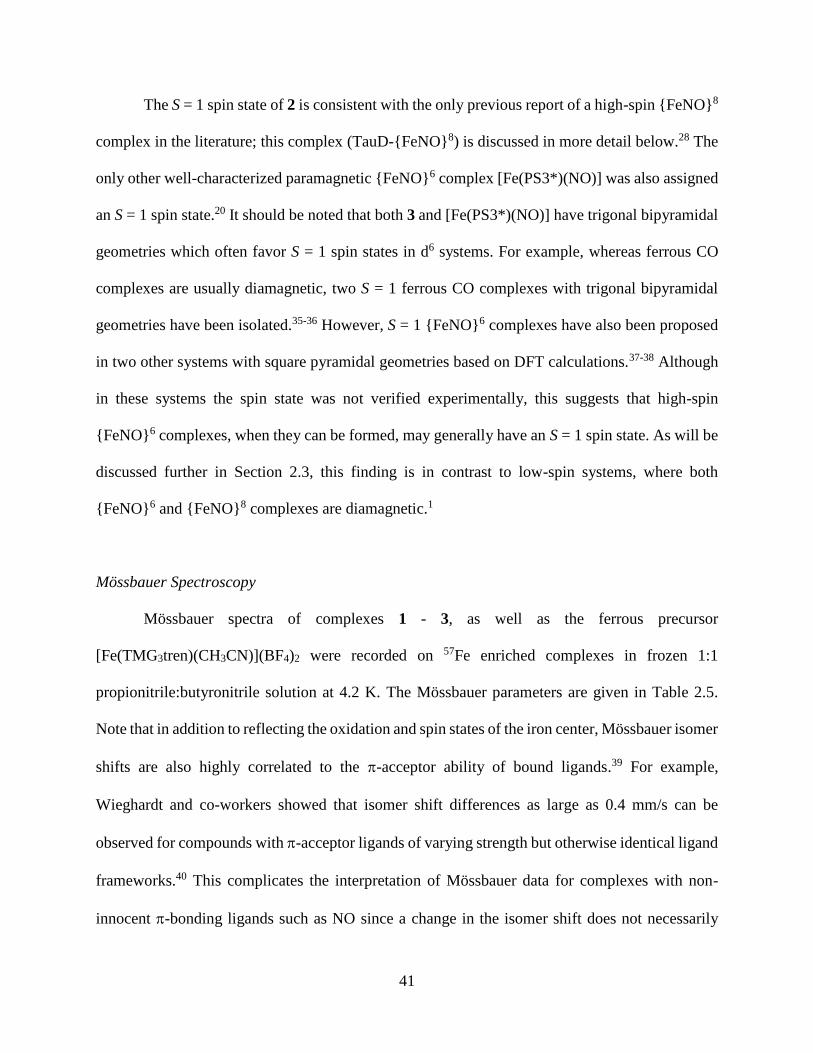
41
The S = 1 spin state of 2 is consistent with the only previous report of a high-spin {FeNO}8
complex in the literature; this complex (TauD-{FeNO}8) is discussed in more detail below.28 The
only other well-characterized paramagnetic {FeNO}6 complex [Fe(PS3*)(NO)] was also assigned
an S = 1 spin state.20 It should be noted that both 3 and [Fe(PS3*)(NO)] have trigonal bipyramidal
geometries which often favor S = 1 spin states in d6 systems. For example, whereas ferrous CO
complexes are usually diamagnetic, two S = 1 ferrous CO complexes with trigonal bipyramidal
geometries have been isolated.35-36 However, S = 1 {FeNO}6 complexes have also been proposed
in two other systems with square pyramidal geometries based on DFT calculations.37-38 Although
in these systems the spin state was not verified experimentally, this suggests that high-spin
{FeNO}6 complexes, when they can be formed, may generally have an S = 1 spin state. As will be
discussed further in Section 2.3, this finding is in contrast to low-spin systems, where both
{FeNO}6 and {FeNO}8 complexes are diamagnetic.1
Mössbauer Spectroscopy
Mössbauer spectra of complexes 1 - 3, as well as the ferrous precursor
[Fe(TMG3tren)(CH3CN)](BF4)2 were recorded on 57Fe enriched complexes in frozen 1:1
propionitrile:butyronitrile solution at 4.2 K. The Mössbauer parameters are given in Table 2.5.
Note that in addition to reflecting the oxidation and spin states of the iron center, Mössbauer isomer
shifts are also highly correlated to the -acceptor ability of bound ligands.39 For example,
Wieghardt and co-workers showed that isomer shift differences as large as 0.4 mm/s can be
observed for compounds with -acceptor ligands of varying strength but otherwise identical ligand
frameworks.40 This complicates the interpretation of Mössbauer data for complexes with non-
innocent -bonding ligands such as NO since a change in the isomer shift does not necessarily
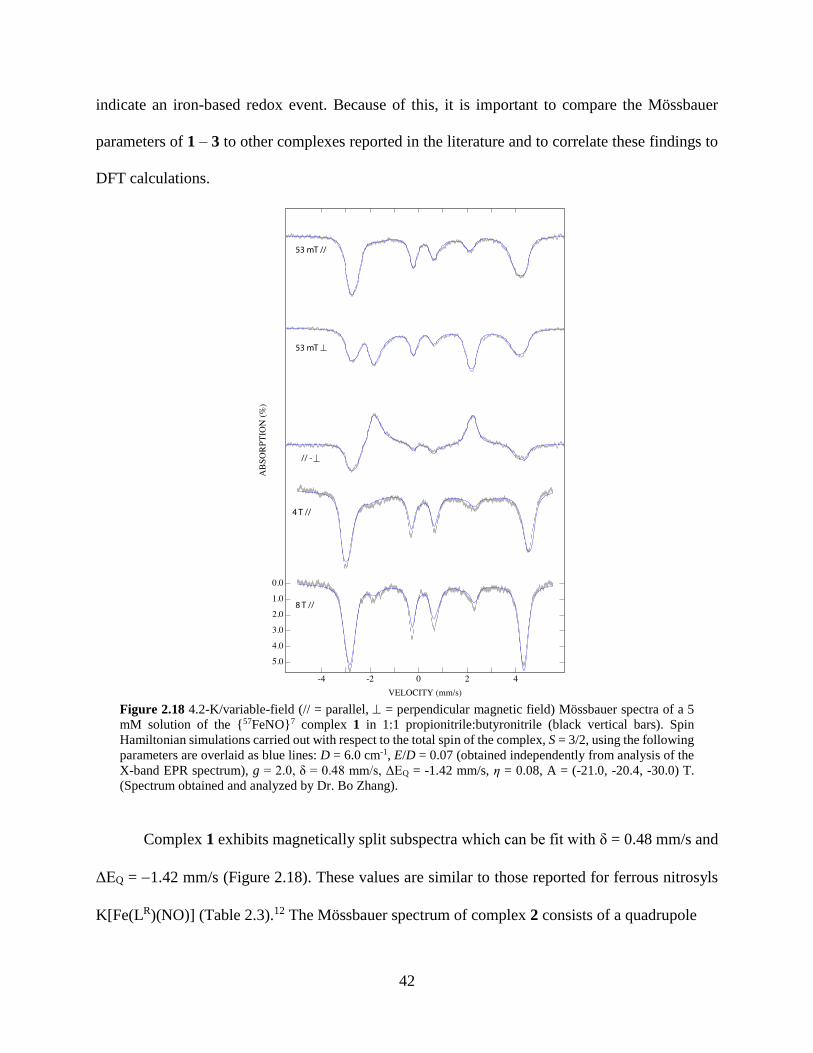
42
indicate an iron-based redox event. Because of this, it is important to compare the Mössbauer
parameters of 1 – 3 to other complexes reported in the literature and to correlate these findings to
DFT calculations.
Figure 2.18 4.2-K/variable-field (// = parallel, = perpendicular magnetic field) Mössbauer spectra of a 5
mM solution of the {57FeNO}7 complex 1 in 1:1 propionitrile:butyronitrile (black vertical bars). Spin
Hamiltonian simulations carried out with respect to the total spin of the complex, S = 3/2, using the following
parameters are overlaid as blue lines: D = 6.0 cm-1, E/D = 0.07 (obtained independently from analysis of the
X-band EPR spectrum), g = 2.0, δ = 0.48 mm/s, ΔEQ = -1.42 mm/s, η = 0.08, A = (-21.0, -20.4, -30.0) T.
(Spectrum obtained and analyzed by Dr. Bo Zhang).
Complex 1 exhibits magnetically split subspectra which can be fit with δ = 0.48 mm/s and
ΔEQ = 1.42 mm/s (Figure 2.18). These values are similar to those reported for ferrous nitrosyls
K[Fe(LR)(NO)] (Table 2.3).12 The Mössbauer spectrum of complex 2 consists of a quadrupole
43
Figure 2.19 (a) 4.2-K/53-mT (applied parallel to the γ–beam) Mössbauer spectrum of a sample containing 5
mM solution of the {57FeNO}8 complex 2 in 1:1 propionitrile:butyronitrile. The solid blue line is the
experimental spectrum of {57FeNO}7 complex 1 recorded under identical conditions and scaled to 16% of the
total intensity.41 (b) Spectrum of the {57FeNO}8 complex 2 generated by removal of the contribution from 1.
The solid red line is the simulation of the {57FeNO}8 complex with δ = 0.84 mm/s and |ΔEQ| = 2.78 mm/s.
The arrow points at the high-energy line of a small quadrupole doublet (~ 5%), which most likely corresponds
to a DNIC formed by decomposition of 2.42 (Spectrum obtained and analyzed by Dr. Bo Zhang).
doublet with δ = 0.84 mm/s and |ΔEQ| = 2.78 mm/s (Figure 2.19). The isomer shift of 2 is similar
to that of the precursor complex [Fe(TMG3tren)(CH3CN)](BF4)2, which suggests that 2 is best
described as a ferrous complex. Importantly, an increase in both isomer shift and quadrupole
splitting were also observed upon cryoreduction of the NO adduct of the ferrous form of the O2
activating enzyme taurine -ketoglutarate dioxygenase (TauD {FeNO}7) to an {FeNO}8 species
which was assigned as an S = 1 Fe(II)-NO complex based on DFT calculations.28 The similar
trend observed for the TMG3tren complexes implies that this system is a good mimic for the
behavior of biological non-heme {FeNO}8 species and suggests that, like in the TauD system, the
reduction of 1 to 2 is iron-centered. Complex 3 exhibits a low isomer shift (δ = 0.06 mm/s) and
small quadrupole splitting (|ΔEQ| = 0.48 mm/s) strongly suggestive of an Fe(IV) center (Figure
2.20). Notably, these parameters differ significantly from those of the S = 0 complex
[FeIV(TMG3tren)(CN)]3+ but are extremely similar to those of the S = 2 complex

44
[FeIV(TMG3tren)(O)]2+, suggesting that 3 also contains a high-spin Fe(IV) center with a strongly
-donating ligand (i.e. NO).5-6 Additionally, the parameters of 3 differ substantially from those of
the isoelectronic S = 1 ferrous CO complex [Fe(LiPr)(CO)] which argues against formulation of 3
as an Fe(II)-NO+ species.35
Figure 2.20 4.2-K/53-mT parallel field (//) Mössbauer spectrum of a 5 mM solution of the {57FeNO}6
complex 3 in 1:1 propionitrile:butyronitrile (black vertical bars) overlaid with a quadrupole doublet
simulation using the parameters δ = 0.06 mm/s and |ΔEQ| = 0.48 mm/s. (Spectrum obtained and analyzed by
Dr. Bo Zhang).
Table 2.5 Mössbauer parameters of 1-3 and selected compounds from the literature. All spectra were
recorded at 4.2 K on frozen solutions except where noted.
Complex δ (mm/s) |ΔEQ| (mm/s)a Spin Ref.
{FeNO}8 2 0.84 2.78 1 8
{FeNO}7 1 0.48 1.42 3/2 8
{FeNO}6 3 0.06 0.48 1 8
[FeIV(TMG3tren)(O)]2+ 0.09 0.29 2 5,21
[FeIV(TMG3tren)(CN)]3+ 0.19 4.45 0 6
[FeII(TMG3tren)(CH3CN)]2+ 0.98 1.64 2 t.w.
[FeII(LiPr)(NO)] 0.43b 1.29b 3/2 12
[FeII(Lcyp)(NO)] 0.41b 1.33b 3/2 12
[FeII(Ldmp)(NO)] 0.43b 1.33b 3/2 12
[FeII(LiPr)] 1.05c 3.31c 2 35
[FeII(CO)(LiPr)] 0.26b 1.07b 1 35
TauD-{FeNO}7 0.69 1.70 3/2 28
TauD-{FeNO}8 1.07 2.39 1 28
TauD-Fe(II)-H2O 1.27 3.06 2 43 a If it is not explicitly specified, the sign of ΔEQ
was not determined. b Measured on a powder sample. c Measured at 77 K on a powder sample.

45
2.3 Electronic Structure of {FeNO}6-8
In order to gain further insight into the nature of the bonding in this system, density
functional theory (DFT) calculations were employed. The calculated geometric and spectroscopic
parameters of 1, 2, and 3 are in good agreement with experimental values (Table 2.6) indicating
DFT is able to properly describe the trends in bonding along this series of complexes.
Table 2.6 Comparison of experimental and DFT-calculated (TPSS/def2-TZVP(-f) except where noted)
geometric and spectroscopic parameters for 1-3
{FeNO}6
Expt.
{FeNO}6
DFT
{FeNO}7
Expt.
{FeNO}7
DFT
{FeNO}8
Expt.
{FeNO}8
DFT
Fe-N(O) (Å) 1.680 1.666 1.748 1.721 -- 1.694
N-O (Å) 1.142 1.151 1.154 1.177 -- 1.202
Fe-N-O (°) 180 180 168 154 -- 159
Fe-Namine
(Å) 2.020 2.042 2.251 2.222 -- 2.112
Avg. Fe-Nguan
(Å) 1.966 2.008 2.037 2.071 -- 2.313
δ (mm/s)c 0.06 0.07 0.48 0.38 0.84 0.72
ΔEQ (mm/s)c 0.48 0.40 1.42 1.69 2.78 2.13
(NO) (cm-1) 1878a,b 1874 1730-1745a
1750b
1714 1618b 1628
a Solid state (KBr pellet) b In CD3CN solution c Calculated with the B3LYP functional and basis sets
CP(PPP) (Fe), TZVP (N/O), and SV(P) (C, H).
As discussed in Chapter 1 and Section 2.1, the electronic structure of 1 and other high-spin
{FeNO}7 complexes is best described as Fe(III)-NO.3,9 A schematic MO diagram for complex 1
is shown in Figure 2.21. In the -spin manifold, the empty NO * orbitals form a weak -
backbond with the occupied iron dxz and dyz orbitals (in a coordinate system where the z-axis
corresponds to the Fe-N(O)bond). In the -spin manifold, the occupied NO * orbitals donate
strongly into the unoccupied iron dxz and dyz orbitals. The remaining orbitals are essentially non-
bonding with respect to the Fe-NO unit. Thus, the donation from NO to iron (β-spin) constitutes
the primary bonding interaction in these compounds. This interaction is very covalent, as indicated
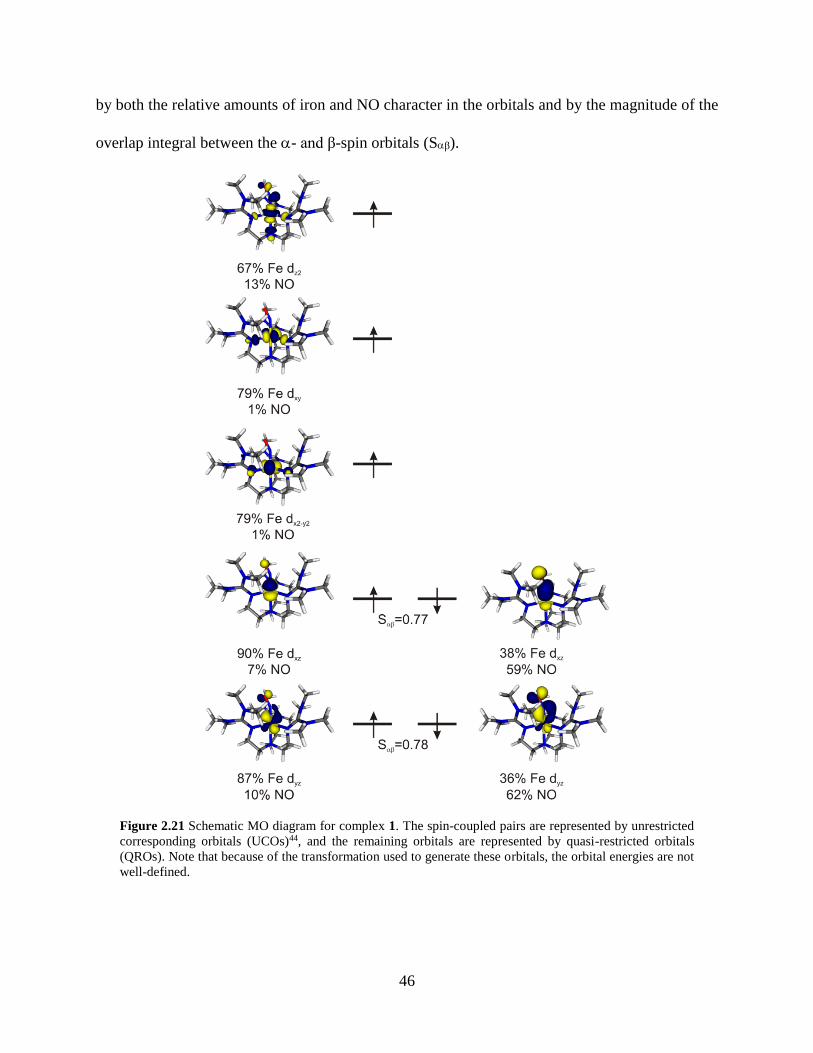
46
by both the relative amounts of iron and NO character in the orbitals and by the magnitude of the
overlap integral between the - and β-spin orbitals (Sβ).
Figure 2.21 Schematic MO diagram for complex 1. The spin-coupled pairs are represented by unrestricted
corresponding orbitals (UCOs)44, and the remaining orbitals are represented by quasi-restricted orbitals
(QROs). Note that because of the transformation used to generate these orbitals, the orbital energies are not
well-defined.

47
In complex 2, the overall bonding picture is similar. The additional electron occupies the
dxy orbital of iron, indicating that the high-spin complex 1 undergoes a metal-centered reduction
and therefore has an Fe(II)-NO electronic structure. The dxy orbital is non-bonding with respect
to the Fe-NO unit; however, the increased electron density of the iron center causes a moderate
decrease in -donation from NO to Fe(II) in the {FeNO}8 complex. This is reflected by the
increased NO * character in the -spin orbitals of 2 relative to 1 and by the decrease in Sβ (see
Figure 2.22 right). These results are indicative of decreased covalency in the Fe-NO unit upon one-
electron reduction leading to a weaker Fe-NO bond.
Figure 2.22 Schematic MO diagrams for complexes 1-3. The orbitals shown on the bottom are the β-spin
unrestricted corresponding orbitals (UCOs), which represent the primary bonding interaction in 1-3. These
are the only orbitals that are significantly different in 2 and 3 as compared to 1 (see Figure 2.17). The dxy
orbital that is doubly occupied in the {FeNO}8 is shown on the right.
In complex 3, an analogous phenomenon is observed. The DFT calculations indicate an
Fe(IV)-NO electronic structure. Due to the higher effective nuclear charge of the iron center in 3
as compared to 1, the NO moiety donates additional electron density into the β-spin iron d-orbitals

48
in 3, making the Fe-NO bond even more covalent. The increase in the covalency of the Fe-NO
bond is reflected by the composition of the magnetic orbitals, where the orbitals of 3 show
increased iron character as compared to 1 (Figure 2.22, left).
Overall, DFT indicates that the redox chemistry in this high-spin iron nitrosyl complex is
iron-centered, and that the {FeNO}6, {FeNO}7, and {FeNO}8 complexes have iron(IV)-NO,
iron(III)-NO, and iron(II)-NO electronic structures, respectively, with decreasing Fe-NO bond
covalency along this series. This finding is fully consistent with our experimental data. In
particular, the Fe-centered redox chemistry is reflected by the relatively large changes in the
Mössbauer isomer shifts along the {FeNO}6-8 series; the decrease in -donation from NO into the
iron d-orbitals is demonstrated by the decreased N-O and Fe-N(O) stretching frequencies upon
successive reductions. This is also demonstrated by the reactivity of these species. For example,
in contrast to other {FeNO}6 complexes, complex 3 does not lose NO under vacuum. Additionally,
whereas the NO moiety in complex 1 is not appreciably basic (in line with previous observations
for high-spin {FeNO}7 complexes), complex 2 reacts rapidly with acid due to the lower covalency
of its Fe-NO bond. (The properties of the resulting {FeN(H)O}8 complex will be discussed in
Section 2.4). This indicates that reduction can indeed serve as a method to activate Fe-NO units
for further reactivity as proposed in the “super-reduced” mechanism for NO reduction in FNORs
discussed in Chapter 1. Unfortunately, likely due to its negative reduction potential, reaction of 2
with excess NO led simply to regeneration of the {FeNO}7 complex 1. This presumably occurs
via outer-sphere electron transfer to NO as observed for heme {FeNO}8 complexes45; it is thus
unclear from our experiments whether a high-spin {FeNO}8 species can react with free NO gas
and perform an N-N coupling reaction.
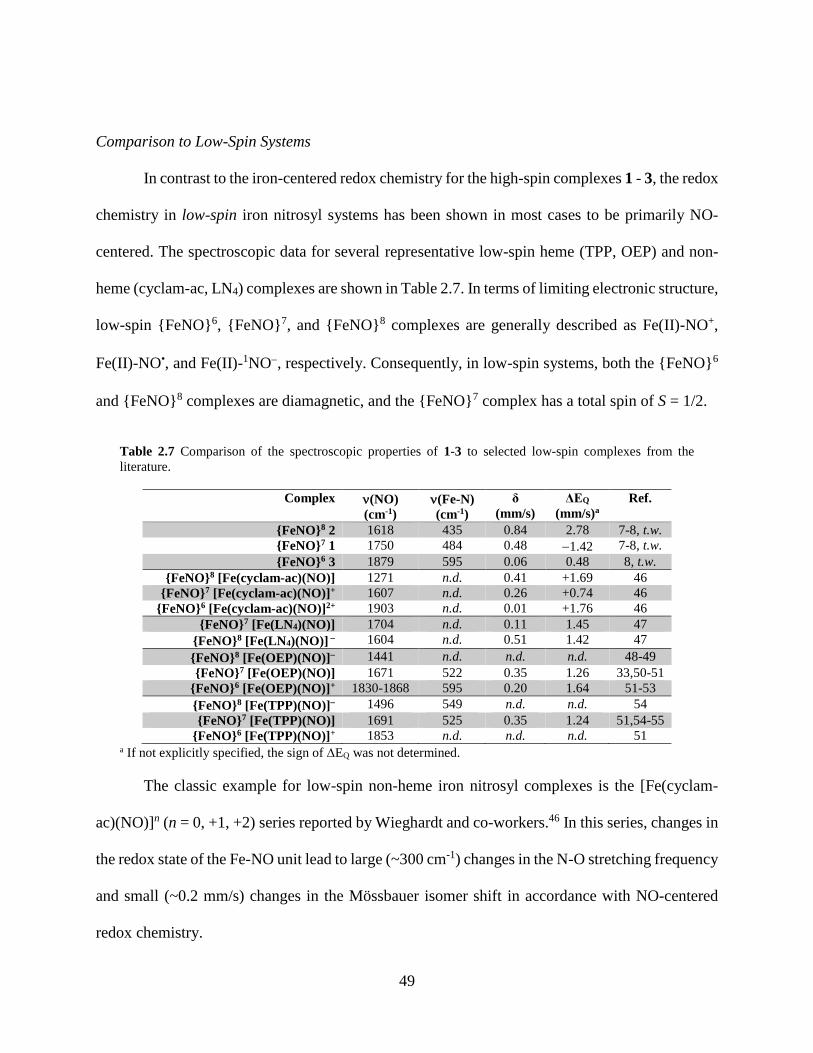
49
Comparison to Low-Spin Systems
In contrast to the iron-centered redox chemistry for the high-spin complexes 1 - 3, the redox
chemistry in low-spin iron nitrosyl systems has been shown in most cases to be primarily NO-
centered. The spectroscopic data for several representative low-spin heme (TPP, OEP) and non-
heme (cyclam-ac, LN4) complexes are shown in Table 2.7. In terms of limiting electronic structure,
low-spin {FeNO}6, {FeNO}7, and {FeNO}8 complexes are generally described as Fe(II)-NO+,
Fe(II)-NO•, and Fe(II)-1NO, respectively. Consequently, in low-spin systems, both the {FeNO}6
and {FeNO}8 complexes are diamagnetic, and the {FeNO}7 complex has a total spin of S = 1/2.
Table 2.7 Comparison of the spectroscopic properties of 1-3 to selected low-spin complexes from the
literature.
Complex (NO)
(cm-1)
(Fe-N)
(cm-1)
δ
(mm/s)
ΔEQ
(mm/s)a
Ref.
{FeNO}8 2 1618 435 0.84 2.78 7-8, t.w.
{FeNO}7 1 1750 484 0.48 1.42 7-8, t.w.
{FeNO}6 3 1879 595 0.06 0.48 8, t.w.
{FeNO}8 [Fe(cyclam-ac)(NO)] 1271 n.d. 0.41 +1.69 46
{FeNO}7 [Fe(cyclam-ac)(NO)]+ 1607 n.d. 0.26 +0.74 46
{FeNO}6 [Fe(cyclam-ac)(NO)]2+ 1903 n.d. 0.01 +1.76 46
{FeNO}7 [Fe(LN4)(NO)] 1704 n.d. 0.11 1.45 47
{FeNO}8 [Fe(LN4)(NO)] 1604 n.d. 0.51 1.42 47
{FeNO}8 [Fe(OEP)(NO)] 1441 n.d. n.d. n.d. 48-49
{FeNO}7 [Fe(OEP)(NO)] 1671 522 0.35 1.26 33,50-51
{FeNO}6 [Fe(OEP)(NO)]+ 1830-1868 595 0.20 1.64 51-53
{FeNO}8 [Fe(TPP)(NO)] 1496 549 n.d. n.d. 54
{FeNO}7 [Fe(TPP)(NO)] 1691 525 0.35 1.24 51,54-55
{FeNO}6 [Fe(TPP)(NO)]+ 1853 n.d. n.d. n.d. 51 a If not explicitly specified, the sign of EQ was not determined.
The classic example for low-spin non-heme iron nitrosyl complexes is the [Fe(cyclam-
ac)(NO)]n (n = 0, +1, +2) series reported by Wieghardt and co-workers.46 In this series, changes in
the redox state of the Fe-NO unit lead to large (~300 cm-1) changes in the N-O stretching frequency
and small (~0.2 mm/s) changes in the Mössbauer isomer shift in accordance with NO-centered
redox chemistry.

50
Harrop and co-workers also reported a pair of {FeNO}7 and {FeNO}8 complexes with a
macrocyclic non-heme diamine/dipyrrolide ligand framework (LN4).47 Surprisingly, in this
complex the NO stretching frequency downshifts by only 100 cm-1 upon reduction, and the
Mössbauer isomer shift increases by 0.4 mm/s which is suggestive of an iron-centered reduction.
DFT calculations indicate that the reduction in these compounds is delocalized over the entire Fe-
NO unit. Other complexes with this type of ligand framework show similar behavior.56
In heme systems, the electronic structures of {FeNO}7 complexes are best described as
low-spin Fe(II)-NO•. Oxidation of {FeNO}7 complexes to the {FeNO}6 redox level is NO-centered
giving an Fe(II)-NO+ electronic structure. This is supported by the NO stretching frequencies of
these complexes which upshift considerably upon oxidation in both the 5-coordinate and 6-
coordinate cases.1 Additionally, the Mössbauer isomer shift of the {FeNO}7 complex
[Fe(OEP)(NO)] shows only a small decrease upon oxidation to the corresponding {FeNO}6
species.50,52 This electronic structure proposal is also verified by the reactivity of the NO ligand,
which behaves as an electrophile due to its NO+ character.2
DFT calculations show that reduction of heme {FeNO}7 complexes to the {FeNO}8 redox
level leads to double occupation of the -bonding (with respect to the Fe-NO unit) SOMO of the
{FeNO}7 complex, and gives an overall electronic structure for the {FeNO}8 complex that is
intermediate between low-spin Fe(II)-NO and Fe(I)-NO•.45,57 Thus, the N-O stretching
frequencies in heme {FeNO}8 complexes are downshifted by ~200 cm-1 compared to
corresponding {FeNO}7 compounds. This is smaller than the downshift of the cyclam-ac system
but is still distinctly larger than the 130 cm-1 downshift observed for reduction of 1 to 2.
Importantly, double occupation of the SOMO also leads to a strengthening of the Fe-N(O) bond,
as demonstrated by the increase in the energy of the Fe-NO stretch of [Fe(TPP)(NO)] upon

51
reduction.54 This is in contrast to 2 where reduction leads to a distinct decrease in the Fe-NO bond
strength. While vibrational and UV-Visible spectroscopic data on heme {FeNO}8 complexes can
be provided by spectroelectrochemistry, these compounds are difficult to generate in bulk and
isolate. Correspondingly, there are no Mössbauer spectra reported for a heme {FeNO}8 species.
Overall, these results demonstrate how the electronic structure and reactivity of iron
nitrosyls is highly dependent on both spin state and the type of ligand framework employed. From
the few other examples of high-spin {FeNO}6 and {FeNO}8 complexes discussed in Section 2.2,
it would appear that the trends in electronic structure along the {FeNO}6-8 series 1 – 3 may be
general for high-spin complexes. However, as shown above, there is a great deal of variability in
the behavior of low-spin complexes. High-spin complexes may show similar variability, and
therefore more examples of high-spin iron nitrosyls in multiple redox states with different ligand
platforms are needed before this generalization can be made.
2.4 Reactivity of {FeNO}8 Complex: Generation of a High-Spin {FeNHO}8 Complex
Despite its Fe(III)-NO electronic structure, the {FeNO}7 complex 1 is unreactive toward
electrophiles due to the highly covalent nature of the Fe-NO bond. In contrast, the {FeNO}8
complex 2 reacts with acids with weakly coordinating conjugate bases (e.g. triethylammonium,
lutidinium) to give a purple species which we have identified as the corresponding protonated
{FeN(H)O}8 complex (4). The conversion of 2 to 4 is easily monitored by UV-Visible
spectroscopy (Figure 2.23). Formation of complex 4 is accompanied by a decrease in the extinction
coefficient of the high-intensity feature at 363 nm to 950 M-1cm-1, and appearance of a
characteristic low-intensity double-humped feature with absorption maxima at 543 nm ( = 330
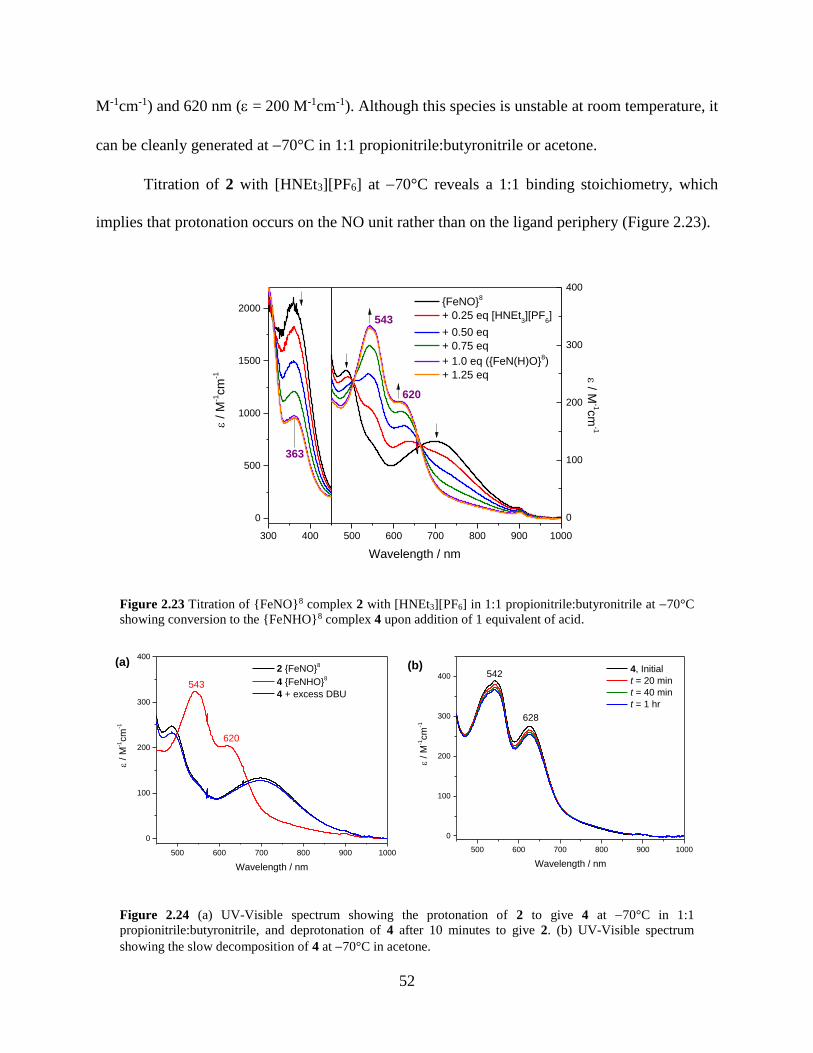
52
M-1cm-1) and 620 nm ( = 200 M-1cm-1). Although this species is unstable at room temperature, it
can be cleanly generated at 70°C in 1:1 propionitrile:butyronitrile or acetone.
Titration of 2 with [HNEt3][PF6] at 70°C reveals a 1:1 binding stoichiometry, which
implies that protonation occurs on the NO unit rather than on the ligand periphery (Figure 2.23).
Figure 2.23 Titration of {FeNO}8 complex 2 with [HNEt3][PF6] in 1:1 propionitrile:butyronitrile at 70°C
showing conversion to the {FeNHO}8 complex 4 upon addition of 1 equivalent of acid.
Figure 2.24 (a) UV-Visible spectrum showing the protonation of 2 to give 4 at 70°C in 1:1
propionitrile:butyronitrile, and deprotonation of 4 after 10 minutes to give 2. (b) UV-Visible spectrum
showing the slow decomposition of 4 at 70°C in acetone.
300 400 500 600 700 800 900 1000
0
500
1000
1500
2000
/ M
-1cm
-1
Wavelength / nm
{FeNO}8
+ 0.25 eq [HNEt3][PF
6]
+ 0.50 eq
+ 0.75 eq
+ 1.0 eq ({FeN(H)O}8)
+ 1.25 eq
363
0
100
200
300
400
/ M-1c
m-1
543
620
500 600 700 800 900 1000
0
100
200
300
400
/ M
-1cm
-1
Wavelength / nm
4, Initial
t = 20 min
t = 40 min
t = 1 hr
542
628
500 600 700 800 900 1000
0
100
200
300
400
543
/ M
-1cm
-1
Wavelength / nm
2 {FeNO}8
4 {FeNHO}8
4 + excess DBU
620
(a) (b)
53
Note that while the UV-Visible spectrum indicates that 4 does not react with additional equivalents
of acid initially, its decomposition is accelerated in the presence of excess acid. All experiments
were therefore performed with low equivalents of acid (1.0-1.5 equivalents). Importantly, addition
of a base (DBU or a phosphazene base) to 4 results in conversion of 4 back to the {FeNO}8
complex 2, which implies that the overall structure of the complex remains intact upon protonation
(Figure 2.24a). Note that at the low millimolar concentrations which were used for the other
spectroscopic experiments described in this section, 4 shows minimal decomposition for at least 1
hour at 70°C, but it decays appreciably over the same amount of time at higher temperatures
(Figure 2.24b). Note that the decomposition of 4 is more rapid at higher concentrations.
Whereas heme HNO model complexes are generally unstable at room temperature45,54,58-
59, ferrous heme nitrosoalkane complexes are typically very stable.60 With the idea of creating a
more stable version of 4 with the same spectroscopic parameters, we therefore attempted to
generate a corresponding nitrosoalkane complex by addition of CH3+ sources to 2. Although
weaker alkylating agents such as methyl iodide resulted in no reaction, upon addition of
trimethyloxonium tetrafluoroborate to 2, conversion to an {FeN(CH3)O}8 species (5) with a very
similar absorption spectrum to 4 was observed (Figure 2.25). Unfortunately, this complex is
difficult to generate in high purity. Conversion of 2 to 5 is typically not complete upon addition of
1 equivalent of [OMe3][BF4], but addition of excess [OMe3][BF4] beyond the amount needed to
convert 2 to 5 leads to rapid decomposition of 5. In addition, samples of 5 contain variable amounts
of the {FeNO}7 complex 1; the mechanism by which 1 forms in this reaction is not clear. Complex
5 is marginally more stable than complex 4 and does not decompose appreciably over the course
of 1 hour at 40°C. 4 and 5 are spectroscopically identical, which means that 5 can be used as a
surrogate for 4.

54
Figure 2.25 UV-Visible spectra showing the slow addition of 2 equivalents of [OMe3][BF4] to 2 (green) at
70°C in 1:1 propionitrile:butyronitrile resulting in partial conversion to the {FeN(Me)O}8 complex 5. The
arrow points to an absorbance at ~800 nm which arises from the presence of 1 in the reaction mixture. The
final spectrum (shown in orange) can be modeled with an approximately 30% contribution from 1 and an
approximately 70% contribution from a species with UV-Visible features identical to 4 (the combined
spectrum is shown in maroon), which we assign as complex 5.
The MCD spectrum of 4 (Figure 2.26) is distinct from those of 1 and 2 (see Figures 2.10
and 2.12). In particular, a sharp feature is observed at 533 nm which coincides with the
characteristic double-humped feature at 543 nm in the UV-Visible spectrum. Importantly, the
MCD signal of 4 is temperature- and field-dependent (i.e. it is a C-term MCD signal). This
indicates that complex 4 is paramagnetic, in contrast to all other reported HNO complexes.61
Interestingly, as shown in Figure 2.27, the band at 533 nm shows similar overlaid saturation
behavior to the feature at 550 nm in the spectrum of 1 (see Figure 2.11). This may indicate that
this feature arises from an Fe(II) HNO * transition; since the intensity of charge transfer
transitions is related to metal-ligand covalency, this suggests that the Fe-N(H)O interaction is
500 600 700 800 900 1000
0
100
200
300
(M
-1cm
-1)
Wavelength / nm
{FeNO}8 2
+ 0.2 eq [OMe3][BF
4]
Final
70% 4 + 30% 1

55
Figure 2.26 UV-Visible (top, recorded at 70°C) and MCD (bottom, recorded at 4 K) spectra of 4 in 1:1
propionitrile:butyronitrile. The colored lines represent a correlated Gaussian deconvolution of the data (see
Table 2.8).
Table 2.8 Parameters for correlated fit of the UV-Vis and absorption spectra of complex 4 (see Figure 2.26).
UV-Vis MCD
Band Energy (cm-1) (M-1cm-1) FWHM Energy (cm-1) (M-1cm-1T-1) FWHM
1 13488 35 852 13625 -1.0 634
2 15610 140 760 15184 -2.1 526
3 17035 141 899 17216 -1.0 273
4 18290 235 735 18661 10.1 391
5 19368 102 660 19342 4.9 551
6 20762 172 1192 20635 1.4 787
7 23881 236 1404 24037 -0.9 649
8 26721 764 1333 26800 1.0 996
28000 24000 20000 16000 12000
0
200
400
600
800
1000
28000 24000 20000 16000 12000-4
0
4
8
12
Experimental
Fit
1
2
3
4
5
68
7
8
76
5
4
32
(M
-1cm
-1)
1
(M-1cm
-1T
-1)
Energy / cm-1

56
extremely covalent. However, additional data is needed to support this hypothesis (particularly an
experimentally-determined spin state and zero-field splitting parameters). The MCD spectrum of
5 is similar (Figure 2.28), but analysis of this data is precluded by the significant amount of
{FeNO}7 in the sample.
Figure 2.27 VTVH MCD saturation curves for the bands at (a) 380 nm (band 8) and (b) 533 nm (band 4) in
complex 4.
Figure 2.28 MCD spectrum of complex 5. The intense, derivative-shaped feature at high energy arises from
the {FeNO}7 contaminant (see Figure 2.10). However, the sharp feature at 533 nm characteristic of the HNO
complex 4 can still be observed in this sample.
30000 25000 20000 15000
-750
-500
-250
0
250
500
750
1000
/
md
eg
Energy / cm-1
T = 2K
+7 T
+5 T
+3 T
+1 T
357 nm
386 nm534 nm
0.0 0.2 0.4 0.6 0.8 1.0 1.2
0.0
0.2
0.4
0.6
0.8
1.0
No
rme
d M
CD
Inte
nsity
H/2kT
= 380 nm
2 K
4 K
8 K
12 K
20 K
0.0 0.2 0.4 0.6 0.8 1.0 1.2
0.0
0.2
0.4
0.6
0.8
1.0
No
rme
d M
CD
Inte
nsity
H/2kT
= 533 nm
2 K
4 K
8 K
12 K
20 K
(a) (b)

57
Mössbauer spectroscopy was used to further examine complexes 4 and 5. The Mössbauer
spectrum of 2 in the presence of [HNEt3][PF6] can be fit with a 93% contribution from a new
species assigned as complex 4 with δ = 0.78 mm/s and |ΔEQ| = 2.14 mm/s (Figure 2.29). These
values are shifted only slightly from those of 2, which suggests that the complex is still a high-spin
ferrous species. The Mössbauer parameters of 5 are identical (Figure 2.30), although the sample
contains only ~55% of this species.
Figure 2.29 4.2 K low-field (53 mT //) Mössbauer spectrum of a 5 mM solution of 4 in frozen 1:1
propionitrile: butyronitrile. The spectrum is fit as a superposition of the following species: 93% {FeNHO}8
(purple line; δ = 0.78 mm/s, |ΔEQ| = 2.14 mm/s), 8% {FeNO}8 (green line), 3% DNIC42 (orange line; δ =
0.19 mm/s, |ΔEQ| = 1.06 mm/s). Spectrum collected and analyzed by Dr. Bo Zhang.
Figure 2.30 4.2 K low-field (53 mT //) Mössbauer spectrum of a 5 mM solution of 5 in frozen 1:1
propionitrile: butyronitrile. The spectrum is fit as a superposition of the following species: 55% {FeNMeO}8
(brown line; δ = 0.78 mm/s, |ΔEQ| = 2.14 mm/s)62, 23% {FeNO}7 (not shown), 17% {FeNO}8, 4% DNIC
(orange line). Spectrum collected and analyzed by Dr. Bo Zhang.

58
The changes in the Mössbauer parameters of 2 upon protonation to give 4 can be compared
to those of TauD. In this case, heat annealing of the TauD {FeNO}8 (δ = 1.07 mm/s, |ΔEQ| = 2.39
mm/s) resulted in partial formation of a new species with Mössbauer parameters δ = 0.80 mm/s
and |ΔEQ| = 1.64 mm/s, which was assigned as a quintet {FeHNO}8 complex based on the
agreement of DFT-calculated and experimental Mössbauer parameters. Although the change in
ΔEQ for conversion of 2 to 4 is nearly identical to that of TauD, the decrease in δ is considerably
larger for TauD. Nevertheless, the Mössbauer parameters of 4 are suggestive of formation of a
species analogous to the TauD {FeHNO}8 complex.
Assuming that the NO unit (rather than the TMG3tren ligand) is protonated in 4 and that
the complex is not in an unusual spin state, four possible proposals can be made for the identity of
4. These are the N-protonated complex or the O-protonated complex with total spin S = 1 or S =
2. As a result of the instability of 4 and 5, experimental studies are challenging. However, DFT
calculations may be able to provide insight into the nature of these species. In particular, DFT is
able to accurately predict the Mössbauer parameters of complexes 1 - 3, as shown in Section 2.3.
Furthermore, since Mössbauer parameters have been reported for multiple TMG3tren complexes,
a correlation between experimental and DFT-predicted values of δ can be constructed for
TMG3tren complexes. This allows us to correct for any systematic under- or over-estimation of
values of δ by DFT for TMG3tren complexes. Using this correlation, we attempted to determine
the identities of 4 and 5 by calculating Mössbauer parameters for all possible forms of the complex
and comparing them to experiment.
Surprisingly, as shown in Figure 2.31, although a strong linear correlation between
experimental and DFT-calculated values of δ is obtained for all other TMG3tren complexes, the
calculated values of δ for all potential tautomers and spin states of 4 and 5 are significantly lower

59
than experiment. (The DFT-calculated values for |ΔEQ| similarly do not agree with experiment;
data not shown). However, the DFT-calculated values for the S = 2 N-protonated/N-alkylated
complex are closest to experiment. This is the simplest proposal for the identity of 4/5 (i.e. a high-
spin ferrous 1HNO or 1CH3NO complex). Additionally, the formation of an N-protonated HNO
would be consistent with observations for low-spin ferrous HNO complexes.
Figure 2.31 Correlation of experimental and DFT-calculated Mössbauer isomer shifts for TMG3tren
complexes. The DFT-predicted values for the different possible identities of 4 (blue squares) and 5 (red
circles) are plotted at the experimentally observed value of δ = 0.78 mm/s.
An examination of the orbitals of the S = 2 {FeHNO}8 complex provides further insight
into the potential reason for the low calculated values of δ. The DFT calculations indicate a highly
covalent interaction between the Fe dxz orbital and the HNO * orbital as shown in Figure 2.32.
Thus the overall predicted electronic structure of 4 is intermediate between high-spin Fe(II)-HNO
and Fe(III)-HNO• . A similar electronic structure is predicted for 5. This electronic structure was
also proposed for the TauD {FeHNO}8 complex, although in that case the predicted and
experimental Mössbauer parameters were in better agreement.28 While HNO does generally
-0.2 0.0 0.2 0.4 0.6 0.8 1.0 1.2
-0.2
0.0
0.2
0.4
0.6
0.8
1.0
S = 2 {FeMeNO}8
Fe(IV)-CN
Fe(IV)=O{FeNO}6
{FeNO}7
{FeNO}8
Calibration points
Linear fit
{FeNHO}8 predictions
{FeNMeO}8 predictions
DF
T-c
alc
ula
ted (
mm
/s)
Experimental (mm/s)
0.78
S = 2 {FeHNO}8
Fe(II)-MeCN
S = 1 {FeMeNO}8
S = 2 {FeNOMe}8
S = 2 {FeNOH}8
S = 1 {FeHNO}8
S = 1 {FeNOMe}8
S = 1 {FeNOH}8
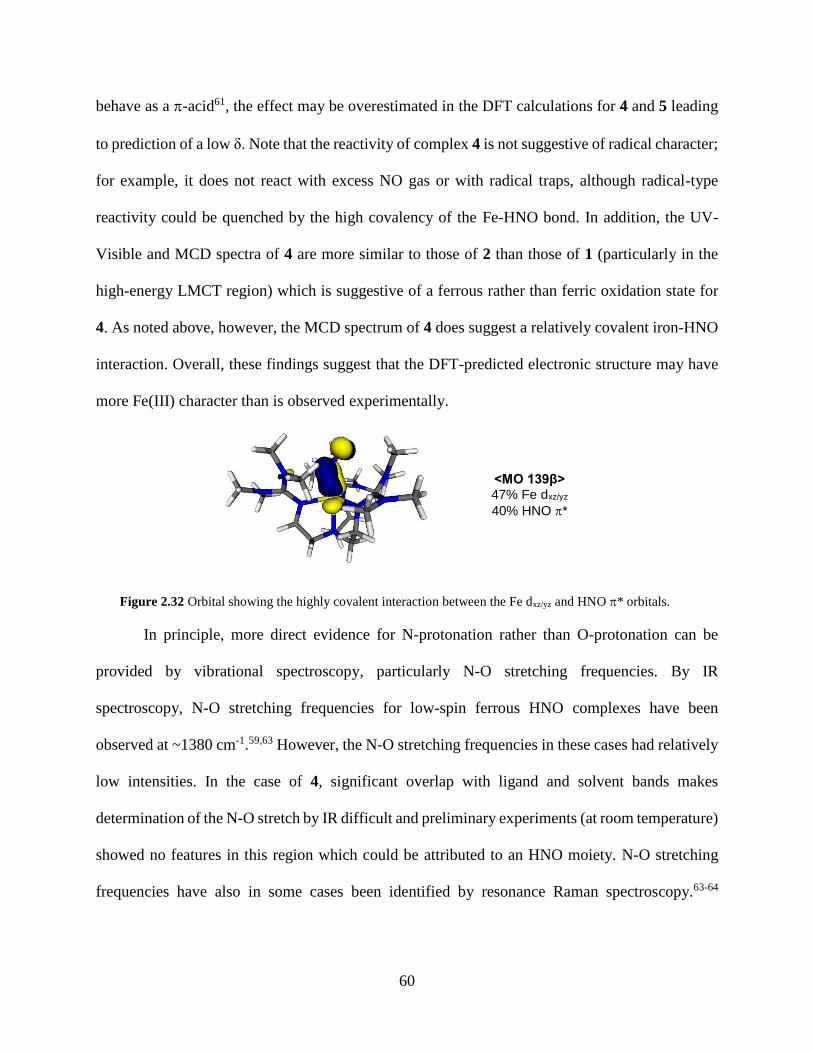
60
behave as a -acid61, the effect may be overestimated in the DFT calculations for 4 and 5 leading
to prediction of a low δ. Note that the reactivity of complex 4 is not suggestive of radical character;
for example, it does not react with excess NO gas or with radical traps, although radical-type
reactivity could be quenched by the high covalency of the Fe-HNO bond. In addition, the UV-
Visible and MCD spectra of 4 are more similar to those of 2 than those of 1 (particularly in the
high-energy LMCT region) which is suggestive of a ferrous rather than ferric oxidation state for
4. As noted above, however, the MCD spectrum of 4 does suggest a relatively covalent iron-HNO
interaction. Overall, these findings suggest that the DFT-predicted electronic structure may have
more Fe(III) character than is observed experimentally.
Figure 2.32 Orbital showing the highly covalent interaction between the Fe dxz/yz and HNO * orbitals.
In principle, more direct evidence for N-protonation rather than O-protonation can be
provided by vibrational spectroscopy, particularly N-O stretching frequencies. By IR
spectroscopy, N-O stretching frequencies for low-spin ferrous HNO complexes have been
observed at ~1380 cm-1.59,63 However, the N-O stretching frequencies in these cases had relatively
low intensities. In the case of 4, significant overlap with ligand and solvent bands makes
determination of the N-O stretch by IR difficult and preliminary experiments (at room temperature)
showed no features in this region which could be attributed to an HNO moiety. N-O stretching
frequencies have also in some cases been identified by resonance Raman spectroscopy.63-64
<MO 139β> 47% Fe dxz/yz
40% HNO *
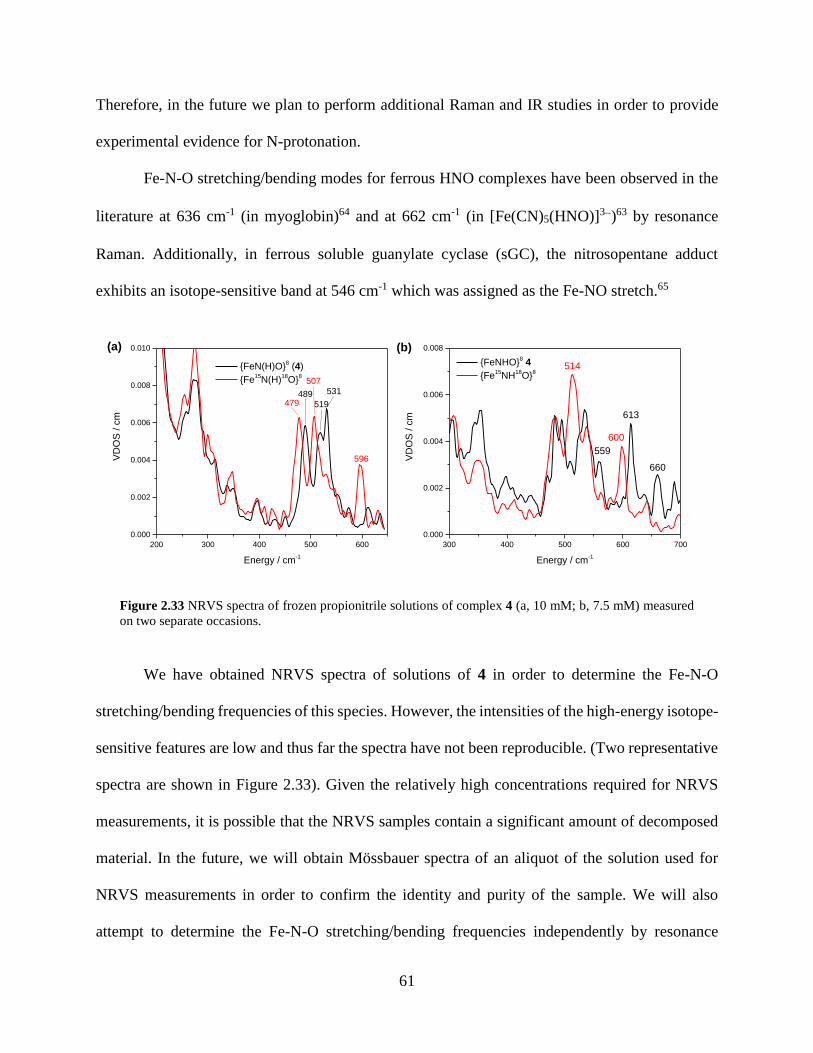
61
Therefore, in the future we plan to perform additional Raman and IR studies in order to provide
experimental evidence for N-protonation.
Fe-N-O stretching/bending modes for ferrous HNO complexes have been observed in the
literature at 636 cm-1 (in myoglobin)64 and at 662 cm-1 (in [Fe(CN)5(HNO)]3)63 by resonance
Raman. Additionally, in ferrous soluble guanylate cyclase (sGC), the nitrosopentane adduct
exhibits an isotope-sensitive band at 546 cm-1 which was assigned as the Fe-NO stretch.65
Figure 2.33 NRVS spectra of frozen propionitrile solutions of complex 4 (a, 10 mM; b, 7.5 mM) measured
on two separate occasions.
We have obtained NRVS spectra of solutions of 4 in order to determine the Fe-N-O
stretching/bending frequencies of this species. However, the intensities of the high-energy isotope-
sensitive features are low and thus far the spectra have not been reproducible. (Two representative
spectra are shown in Figure 2.33). Given the relatively high concentrations required for NRVS
measurements, it is possible that the NRVS samples contain a significant amount of decomposed
material. In the future, we will obtain Mössbauer spectra of an aliquot of the solution used for
NRVS measurements in order to confirm the identity and purity of the sample. We will also
attempt to determine the Fe-N-O stretching/bending frequencies independently by resonance
(a) (b)
300 400 500 600 700
0.000
0.002
0.004
0.006
0.008
VD
OS
/ c
m
Energy / cm-1
{FeNHO}8 4
{Fe15
NH18
O}8
660
613
514
559
600
200 300 400 500 600
0.000
0.002
0.004
0.006
0.008
0.010
VD
OS
/ c
m
Energy / cm-1
{FeN(H)O}8 (4)
{Fe15
N(H)18
O}8
596
489 531
519
507
479

62
Raman spectroscopy; in this case, the purity of the sample can be easily determined by UV-Visible
and EPR spectroscopies.
Figure 2.34 Solution IR spectra of 2 after treatment with 1 equivalent of [HNEt3][PF6] at room temperature
in propionitrile. The spectrum with natural abundance NO is shown in black, and the corresponding spectrum
with 15NO is shown in red.
In order to gain further insight into the identity of 4, the products of its decomposition at
room temperature were examined using solution IR spectroscopy (Figure 2.34). The IR spectrum
reveals multiple isotope-sensitive features between 1750 cm-1 and 1550 cm-1. First, a small amount
of 1 ((N-O) = 1750 cm-1) is formed. The formation of {FeNO}7 (accompanied by release of H2)
is also observed upon decomposition of heme {FeHNO}8 model complexes in the absence of steric
protection.45,54,58-59 However, in principle the steric bulk of the TMG3tren ligand should prevent
dimerization and H2 release; in the case of 4, the {FeNO}7 may therefore be formed through a
different process. In addition, a prominent feature which is not isotope-sensitive is observed at
1620 cm-1; we tentatively assign this feature to a protonated guanidine unit. (The spectrum of
independently prepared free H3TMG3tren3+ in solution exhibits bands at 1620 cm-1 and 1584 cm-
1).4 The finding of ligand protonation is not surprising, given the high proton affinity of guanidine
1800 1750 1700 1650 1600 1550 1500
0.0
0.1
0.2
0.3
0.4
1716
Absorb
ance
Energy / cm-1
Decomposed 4
Decomposed 4-15
NO
1750
1660
1620
15851624
16431681
16761717

63
ligands. Accordingly, it has been demonstrated in the literature that upon exposure to water, metal
TMG3tren complexes decompose via hydrolytic cleavage of the metal-nitrogen bond.4 An
analogous reaction likely occurs with 4, as shown in Scheme 2.2.
Scheme 2.2 Proposed decomposition pathway for complex 4.
Dissociation of the protonated guanidine moiety would give an {FeNO}8 complex with an
open coordination site which, as discussed in Section 2.2, is unstable and decays to produce an
{Fe(NO)2}10 DNIC and a ferrous species. In the spectrum shown in Figure 2.34, it is unclear
whether the expected DNIC species with (NO) = 1672, 1614 cm-1 (c.f. Figure 2.5b) is present in
solution. However, two additional isotope-sensitive features are observed at 1717 cm-1 and 1660
cm-1. Based on their energies, the separation between them, and the ratio of their intensities, we
tentatively assign these features to an {Fe(NO)2}10 DNIC with a different coordination
environment.
Overall, this provides indirect evidence that 4 is in fact an N-protonated HNO complex.
We hypothesize that at low temperature, the dissociation of the guanidine moieties from the iron
center is disfavored (compared to room temperature). Since ligand dissociation must occur prior
to proton transfer from the metal-bound HNO to the guanidine, this could account for the increased
stability of 4 at low temperature. However, the presence of protonated ligand in the decomposed
product does not necessarily indicate the purple species observed at low temperature is an N-
protonated HNO since tautomerization could occur prior to decomposition. Further experimental
studies, particularly vibrational spectra, are therefore needed in order to definitively prove that 4
is an {FeHNO}8 complex.
64
2.5 Experimental
Synthetic Procedures
In general, reactions were performed using inert gas (Schlenk) techniques. Preparation and
handling of air sensitive materials was carried out under nitrogen atmosphere in an MBraun
glovebox equipped with a circulating purifier (O2, H2O 0.1 ppm). Solvents and reagents were
purchased and used as supplied except as follows. All solvents were dried following standard
techniques, distilled, and freeze-pump-thawed to remove dioxygen. Nitric oxide (Cryogenic Gases
Inc., 99.5%) was purified by passage through an ascarite II column (NaOH on silica) and then
through a cold trap at -80°C in order to remove higher nitrogen oxide impurities. Nitric oxide-
15NO (Cambridge Isotope Labs) and -15N18O (Sigma-Aldrich) were used without further
purification. Metallocene reductants (CoCp2, CoCp*2, and CrCp*2) were purified by vacuum
sublimation at approximately 50°C and stored in the dark under inert atmosphere at -33°C prior to
use. The following compounds and reagents were synthesized following literature procedures:
chlorotetramethylformamidinium chloride66, TMG3tren4,66, TMG2dien14,
[Fe(TMG2dien)(OTf)2]14, thianthrene tetrafluoroborate67, [Fe(CH3CN)6](BF4)2
68, [HNEt3][PF6]69.
57Fe complexes for Mössbauer spectroscopy and NRVS were synthesized from
57Fe(CH3CN)6(BF4)2 in a manner analogous to the unlabeled complexes.
[Fe(TMG3tren)(CH3CN)](OTf)2. In a procedure modified from the literature4, 410 mg iron(II)
trifluoromethanesulfonate (1.16 mmol) and 559 mg TMG3tren (1.27 mmol, 1.09 equivalents) were
combined in 4 mL CH3CN in a glovebox. The reaction was stirred for 2 hours, and then filtered
to remove impurities. Approximately 25 mL diethyl ether was added to the filtrate, and the
reaction was allowed to precipitate at 33°C overnight. The resulting white solid was isolated by
65
vacuum filtration and washed with diethyl ether. Yield: 807 mg, 83.4%. The spectra of this
complex are in agreement with previous reports in the literature.4,6,21
FT-IR (KBr pellet): 2899, 2272 [(CN)], 1557 [(C=N)], 1398, 1265, 1164, 1145, 1029, 637 cm-
1. 1H NMR (400 MHz, CD3CN, all peaks appear as broad singlets): = 210.0 (3H), 86.0 (3H),
60.4 (3H), 33.8 (9H), 20.7 (9H), 10.0 (9H), -13.0 (9H) ppm. The corresponding tetrfluoroborate
salt (and complexes 1 - 3) can be synthesized in an analogous manner starting from
Fe(CH3CN)6(BF4)2.
[Fe(TMG3tren)(NO)](OTf)2 (1). In a dry Schlenk flask, 830 mg [Fe(TMG3tren)(CH3CN)](OTf)2
was taken up in 3 mL CH3CN. The solution was exposed to excess NO gas, causing a color change
from clear to black. The reaction was stirred under NO atmosphere for 1 hour, at which point
approximately 40 mL diethyl ether was added. The reaction was allowed to precipitate overnight
at -33°C. The solution was filtered anaerobically, yielding a microcrystalline black solid. Yield:
640 mg, 78.1%. Red plate crystals suitable for x-ray diffraction were grown by vapor diffusion of
diethyl ether into a concentrated CH2Cl2 solution of 1 at 35°C.
UV-Vis (CH3CN): 368 nm (=6,300) M-1cm-1), 569 nm (=340 M-1cm-1), 800 nm (=140 M-1cm-
1). FT-IR (KBr pellet, see Figure 2.35): 2941, 1730 [(N=O), (15N=O)=1700], 1544 [(C=N)],
1402, 1263, 1165, 1144, 1028, 637 cm-1. 1H NMR (400 MHz, CD3CN, all signals appear as broad
singlets): = 191.8, 164.2, 92.4, 39.7, 37.6, 32.8, 9.0 ppm. Anal. Calcd. For C23H48F6FeN11O7S2:
C, 33.50; H, 5.87; N, 18.68. Found: C, 33.50; H, 5.90; N, 18.64.
[Fe(TMG2dien)(NO)(OTf)](OTf). Under inert atmosphere, 200 mg (0.30 mmol) of
[Fe(TMG2dien)(OTf)2] was dissolved in a minimal volume of CH2Cl2 and filtered to remove

66
Figure 2.35 FT-IR spectrum (KBr pellet) of 1 (red) and 1-15NO (blue) shown with the precursor complex
[Fe(TMG3tren)(CH3CN)](OTf)2 in black.
insoluble impurities. The solution was exposed to excess NO gas, causing it to change color from
light brown to dark green. The reaction was stirred for 45 minutes, at which point 36 mL of hexanes
was syringed into the flask, causing the product to precipitate. The reaction was stored at -33°C
overnight and then filtered, affording 139 mg (66.7% yield) of the title compound as green needles.
Single crystals suitable for x-ray diffraction were grown by layering a concentrated CH2Cl2
solution of the compound with hexanes at room temperature.
1H NMR (400 MHz, CD2Cl2, all peaks appear as broad singlets): = 202.2, 187.4, 153.3, 131.4,
124.8, 92.0, 72.1, 39.0, 37.5, 38.0, 35.8, 18.0, 14.0 ppm. UV-Visible, FT-IR, and EPR data are
shown in Figure 2.36.
Electrochemical generation of 2. Under inert atmosphere, 30.7 mg (37.2 mol) of 1 was
dissolved in 9.0 mL of 0.1 M NBu4ClO4 in CH3CN. Using a two-compartment bulk electrolysis
cell (described below), the sample was reduced at -1.0 V vs Ag wire until 1.05 equivalents of
1900 1800 1700 1600 1500 1400 1300
[Fe(TMG3tren)(CH
3CN)]OTf
2
1 1-15
NO
% T
Energy / cm-1
(N-O)=1730 cm-1
(15
N-O)=1700 cm-1
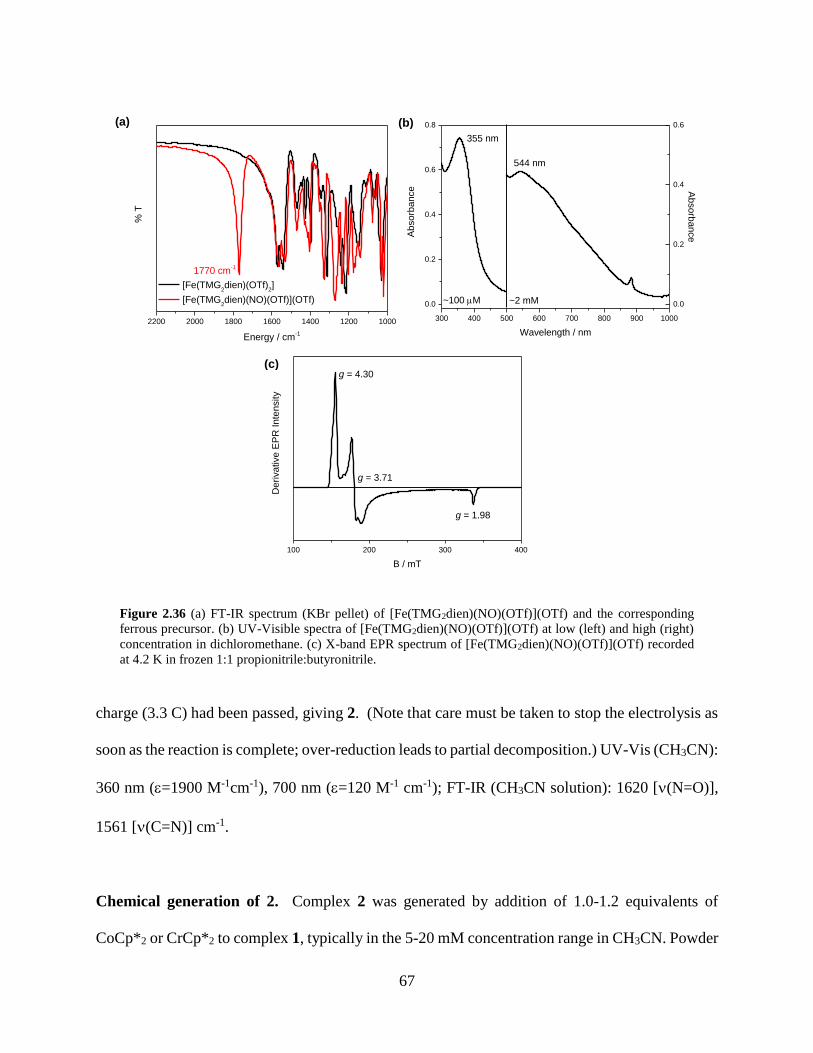
67
Figure 2.36 (a) FT-IR spectrum (KBr pellet) of [Fe(TMG2dien)(NO)(OTf)](OTf) and the corresponding
ferrous precursor. (b) UV-Visible spectra of [Fe(TMG2dien)(NO)(OTf)](OTf) at low (left) and high (right)
concentration in dichloromethane. (c) X-band EPR spectrum of [Fe(TMG2dien)(NO)(OTf)](OTf) recorded
at 4.2 K in frozen 1:1 propionitrile:butyronitrile.
charge (3.3 C) had been passed, giving 2. (Note that care must be taken to stop the electrolysis as
soon as the reaction is complete; over-reduction leads to partial decomposition.) UV-Vis (CH3CN):
360 nm (=1900 M-1cm-1), 700 nm (=120 M-1 cm-1); FT-IR (CH3CN solution): 1620 [(N=O)],
1561 [(C=N)] cm-1.
Chemical generation of 2. Complex 2 was generated by addition of 1.0-1.2 equivalents of
CoCp*2 or CrCp*2 to complex 1, typically in the 5-20 mM concentration range in CH3CN. Powder
2200 2000 1800 1600 1400 1200 1000
% T
Energy / cm-1
[Fe(TMG2dien)(OTf)
2]
[Fe(TMG2dien)(NO)(OTf)](OTf)
1770 cm-1
(a) (b)
100 200 300 400
g = 1.98
g = 4.30
Derivative
EP
R I
nte
nsity
B / mT
g = 3.71
(c)
300 400 500 600 700 800 900 1000
0.0
0.2
0.4
0.6
0.8
Abso
rbance
Wavelength / nm
355 nm
0.0
0.2
0.4
0.6
~2 mM
Absorb
ance
~100 M
544 nm

68
samples of 2 were generated by removing the solvent from the reaction mixture under vacuum.
(Attempts to precipitate 2 led to the presence of a significant {FeNO}7 impurity, likely due to the
higher solubility of 2 as compared to 1). In initial experiments, reduction was performed at room
temperature and in many cases significant decomposition was observed. We subsequently
determined that 2 can be consistently generated in high purity by performing the reaction in cold
solvent (chilled in a freezer at 35°C prior to performing the reaction) and using CrCp*2 as the
reductant.
1H NMR (400 MHz, CD3CN, all signals appear as broad singlets): = 97.0, 50.9, 39.3, 18.5, -7.6
ppm; FT-IR (CD3CN solution): 1620 [(N=O)], 1561 [(C=N)], 1525 [(C=N)] cm-1.
Generation of 3. Complex 3 was prepared by addition of a slight excess (1.2-1.5 equivalents) of
thianthrene tetrafluoroborate to 1, typically in the 5-15 mM concentration range with respect to
iron, in CH3CN. Complex 3 can be precipitated by addition of diethyl ether to these solutions, but
since precipitation generally leads to partial decomposition, all characterization was carried out on
freshly prepared solutions of the complex when possible. Solution IR, NMR, and/or EPR were
used to confirm sample purity.
1H NMR (400 MHz, CD3CN, all signals appear as broad singlets): = 156.4, 47.2, 35.6, 34.2, 16.9
ppm; FT-IR (CD3CN solution): 1879 [(N=O)], 1572 [(C=N)], 1519 [(C=N)] cm-1.
Crystallization of 3. At 40°C, 21.4 mg of [Fe(TMG3tren)(NO)](BF4)2 (30.6 mol) and 12.4 mg
of thianthrene tetrafluoroborate (40.9 mol, 1.3 equivalents) were combined in 3 mL of
acetonitrile, and the resulting solution was stirred for 10 minutes. Vapor diffusion of diethyl ether
into this solution at 35°C gave purple block crystals suitable for x-ray diffraction after 5 days.

69
Physical Measurements
Infrared spectra of solid samples were obtained from KBr disks on Perkin-Elmer BX, GX,
or RX1 spectrometers, and the IR spectra of solution samples were obtained in cells equipped with
CaF2 windows on the same instruments. Proton NMR spectra were recorded on a Varian MR 400
MHz instrument or a Varian VNMRS 500 MHz instrument. Solution magnetic susceptibility
measurements were performed on a Varian MR 400 MHz instrument at 295 K using the Evans
method. Diamagnetic corrections were determined from Pascal’s constants. Electronic absorption
spectra were recorded using an Analytical Jena Specord S600 instrument or a Shimadzu UV-1601
UV-Vis spectrometer. In situ UV-visible measurements were performed using a Hellma all-quartz
immersion probe.
Electron paramagnetic resonance spectra were measured on a Bruker X-Band EMX
spectrometer equipped with an Oxford Instruments liquid helium cryostat. EPR spectra were
typically obtained on 5 mM solutions with microwave power 20.5 mW, modulation frequency 100
kHz, and modulation amplitude 1 G. EPR spectra were simulated using the program SpinCount
by Prof. Michael P. Hendrich (Carnegie Mellon University). Spin quantitation was performed by
double integration of the EPR spectra and comparison to a standard of known concentration.
Cyclic voltammograms were obtained using a CH instruments CHI600E electrochemical
workstation using a three component system consisting of a glassy carbon working electrode, a
platinum counter electrode, and a silver wire pseudo-reference electrode. Potentials were
corrected to Fc/Fc+ using an internal ferrocene standard. UV-Visible and IR
spectroelectrochemistry experiments were performed using custom-built thin layer
electrochemical cells as previously described.45 Bulk electrolysis was performed using a carbon
felt working electrode and a platinum mesh counter electrode with a silver wire pseudo-reference

70
electrode. The counter compartment, containing electrolyte and excess ferrocene as a sacrificial
oxidant, was separated from the working compartment by a fine glass frit. All electrochemical and
spectroelectrochemical measurements were performed in the presence of 0.1 M supporting
electrolyte (NBu4PF6 or NBu4ClO4).
Crystal structure data collection was performed on a Rigaku AFC10K Saturn 944+ CCD-
based X-ray diffractometer equipped with a low temperature device and a Micromax-007HF Cu-
target micro-focus rotating anode (λ= 1.54187 A) operated at 1.2 kW power (40 kV, 30 mA). The
X-ray intensities were measured at 85(1) K with the detector placed at a distance of 42.00 mm
from the crystal. The data were processed with CrysAlisPro or CrystalClear 2.0 and corrected for
absorption. Analysis of the data showed negligible decay during data collection. The structure
was solved and refined with the Bruker SHELXTL software package.70 (Crystal data collection
and analysis was performed by Dr. Jeff Kampf, University of Michigan).
Nuclear resonance vibrational spectroscopy (NRVS) data were obtained as described
previously71-72 at beamline 3ID at the Advanced Photon Source (APS) at Argonne National
Laboratory. Samples were loaded in copper sample holders with lucite lids. During data collection,
samples were maintained at cryogenic temperatures using a liquid helium-cooled cryostat. Spectra
of solid samples were recorded from 50 to +80 meV ({FeNO}7, {FeNO}8) or +90 meV
({FeNO}6) in 0.25 meV steps. Spectra of solution samples were recorded from 20 to +80 meV.
Multiple scans were taken, normalized to the intensity of the incident beam, and added together to
achieve adequate signal to noise; the final spectra represent averages of between 4 and 10 scans
for powder samples, and 25-30 scans for solution samples. The program Phoenix71 was used to
convert the raw NRVS data to the vibrational density of states (VDOS).
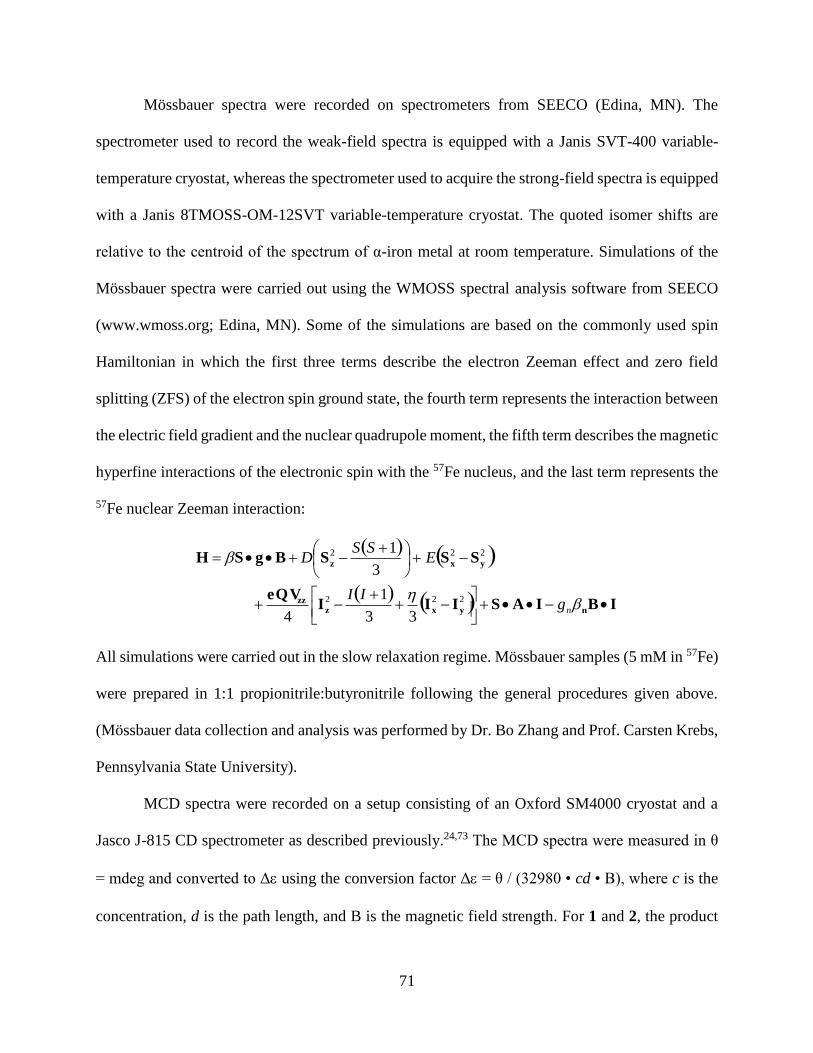
71
Mössbauer spectra were recorded on spectrometers from SEECO (Edina, MN). The
spectrometer used to record the weak-field spectra is equipped with a Janis SVT-400 variable-
temperature cryostat, whereas the spectrometer used to acquire the strong-field spectra is equipped
with a Janis 8TMOSS-OM-12SVT variable-temperature cryostat. The quoted isomer shifts are
relative to the centroid of the spectrum of α-iron metal at room temperature. Simulations of the
Mössbauer spectra were carried out using the WMOSS spectral analysis software from SEECO
(www.wmoss.org; Edina, MN). Some of the simulations are based on the commonly used spin
Hamiltonian in which the first three terms describe the electron Zeeman effect and zero field
splitting (ZFS) of the electron spin ground state, the fourth term represents the interaction between
the electric field gradient and the nuclear quadrupole moment, the fifth term describes the magnetic
hyperfine interactions of the electronic spin with the 57Fe nucleus, and the last term represents the
57Fe nuclear Zeeman interaction:
All simulations were carried out in the slow relaxation regime. Mössbauer samples (5 mM in 57Fe)
were prepared in 1:1 propionitrile:butyronitrile following the general procedures given above.
(Mössbauer data collection and analysis was performed by Dr. Bo Zhang and Prof. Carsten Krebs,
Pennsylvania State University).
MCD spectra were recorded on a setup consisting of an Oxford SM4000 cryostat and a
Jasco J-815 CD spectrometer as described previously.24,73 The MCD spectra were measured in θ
= mdeg and converted to Δ using the conversion factor Δ = θ / (32980 • cd • B), where c is the
concentration, d is the path length, and B is the magnetic field strength. For 1 and 2, the product
IBIASIIIeQV
SSSBgSH
nyxzzz
yxz
ngII
ESS
D
222
222
33
1
4
3
1
72
cd was substituted by AMCD / UV-Vis where AMCD is the absorbance of the sample measured by the
MCD spectrometer and UV-Vis is the extinction coefficient. For 4, AMCD could not be determined
due the low absorbance of the sample; in this case, cd was determined from the concentration of
the sample and the approximate path length of the sample holder (0.2 cm). Gaussian deconvolution
of the spectra was performed using the program PeakFit. VTVH fits were performed as previously
described24 following the method developed by Neese and Solomon.23
DFT Calculations
All geometry optimizations and frequency calculations were performed with the ORCA
program package74 (version 2.9) at the TPSS/def2-TZVP(-f) level employing the RI approximation
with the def2-TZV/J auxiliary basis set. Mössbauer parameters were calculated using the B3LYP
functional and the basis sets CP(PPP) on Fe, TZVP on N and O, and SV(P) on C and H. Isomer
shifts (δ) were calculated using the correlation between ρ(0) (the electron density at the iron
nucleus) and δ reported in the literature.75 In order to examine bonding, single-point calculations
were performed at the B3LYP/def2-TZVP(-f) level employing the RIJCOSX approximation with
the def2-TZV/J auxiliary basis set. To facilitate comparison between the {FeNO}6, {FeNO}7, and
{FeNO}8 complexes, the canonical orbitals for the broken symmetry solutions were transformed
into unrestricted corresponding orbitals (UCOs).44 Note that because of the underlying
transformation, the orbital energies for the UCOs are not well-defined. The orbitals were plotted
using the orca_plot tool and visualized using Molekel version 5.4 (electron density isosurface
value = 0.05).
2.6 References and Notes

73
(1) Lehnert, N.; Scheidt, W. R.; Wolf, M. W. Struct. Bond. 2014, 154, 155-223.
(2) Lim, M. D.; Lorkovic, I. M.; Ford, P. C. J. Inorg. Biochem. 2005, 99, 151-165.
(3) Berto, T. C.; Speelman, A. L.; Zheng, S.; Lehnert, N. Coord. Chem. Rev. 2013, 257, 244-259.
(4) Wittmann, H.; Raab, V.; Schorm, A.; Plackmeyer, J.; Sundermeyer, J. Eur. J. Inorg. Chem.
2001, 2001, 1937-1948.
(5) England, J.; Guo, Y.; Farquhar, E. R.; Young Jr, V. G.; Münck, E.; Que Jr, L. J. Am. Chem.
Soc. 2010, 132, 8635-8644.
(6) England, J.; Farquhar, E. R.; Guo, Y.; Cranswick, M. A.; Ray, K.; Munck, E.; Que, L. Inorg.
Chem. 2011, 50, 2885-2896.
(7) Speelman, A. L.; Lehnert, N. Angew. Chem. Int. Ed. 2013, 52, 12283-12287.
(8) Speelman, A. L.; Zhang, B.; Krebs, C.; Lehnert, N. Angew. Chem. Int. Ed. 2016.
(9) Brown, C. A.; Pavlosky, M. A.; Westre, T. E.; Zhang, Y.; Hedman, B.; Hodgson, K. O.;
Solomon, E. I. J. Am. Chem. Soc. 1995, 117, 715-732.
(10) Addison, A. W.; Rao, T. N.; Reedijk, J.; van Rijn, J.; Verschoor, G. C. J. Chem. Soc., Dalton
Trans. 1984, 1349-1356.
(11) Depending on the conditions of isolation, ν(N-O) varies from 1730 cm-1 to 1744 cm-1. In all
cases, ν(N-O) is observed at 1750 cm-1 in solution, implying that the different values of ν(N-O)
arise from solid state packing effects and not from the formation of different compounds.
(12) Ray, M.; Golombek, A. P.; Hendrich, M. P.; Yap, G. P. A.; Liable-Sands, L. M.; Rheingold,
A. L.; Borovik, A. S. Inorg. Chem. 1999, 38, 3110-3115.
(13) Berto, T. C.; Hoffman, M. B.; Murata, Y.; Landenberger, K. B.; Alp, E. E.; Zhao, J.; Lehnert,
N. J. Am. Chem. Soc. 2011, 133, 16714-16717.
(14) England, J.; Guo, Y.; Van Heuvelen, K. M.; Cranswick, M. A.; Rohde, G. T.; Bominaar, E.
L.; Münck, E.; Que, L. J. Am. Chem. Soc. 2011, 133, 11880-11883.
(15) Tran, C. T.; Skodje, K. M.; Kim, E. Prog. Inorg. Chem. 2014, 59, 339-380.
(16) Tonzetich, Z. J.; Héroguel, F.; Do, L. H.; Lippard, S. J. Inorg. Chem. 2011, 50, 1570-1579.
(17) Borovik and co-workers also reported decomposition upon electrochemical oxidation of
K[Fe(LR)(NO)]. However, in this case chemical oxidation was not attempted.
(18) Note that treatment of 1 with stronger oxidants (for example, tris(2,4-dibromophenyl)amine
radical cation, E1/2 = +1.14 V vs ferrocene) leads to formation of significantly more ferric
impurities in the initial product.

74
(19) Goodrich, L. E.; Paulat, F.; Praneeth, V. K. K.; Lehnert, N. Inorg. Chem. 2010, 49, 6293-
6316.
(20) Conradie, J.; Quarless, D. A.; Hsu, H.-F.; Harrop, T. C.; Lippard, S. J.; Koch, S. A.; Ghosh,
A. J. Am. Chem. Soc. 2007, 129, 10446-10456.
(21) England, J.; Martinho, M.; Farquhar, E. R.; Frisch, J. R.; Bominaar, E. L.; Münck, E.; Que,
L. Angew. Chem. Int. Ed. 2009, 48, 3622-3626.
(22) Lehnert, N.; George, S. D.; Solomon, E. I. Curr. Opin. Chem. Biol. 2001, 5, 176-187.
(23) Neese, F.; Solomon, E. I. Inorg. Chem. 1999, 38, 1847-1865.
(24) Paulat, F.; Lehnert, N. Inorg. Chem. 2008, 47, 4963-4976.
(25) Srnec, M.; Wong, S. D.; England, J.; Que, L.; Solomon, E. I. Proc. Natl. Acad. Sci. USA
2012, 109, 14326-14331.
(26) Jackson, T. A.; Yikilmaz, E.; Miller, A.-F.; Brunold, T. C. J. Am. Chem. Soc. 2003, 125,
8348-8363.
(27) Diebold, A. R.; Brown-Marshall, C. D.; Neidig, M. L.; Brownlee, J. M.; Moran, G. R.;
Solomon, E. I. J. Am. Chem. Soc. 2011, 133, 18148-18160.
(28) Ye, S.; Price, J. C.; Barr, E. W.; Green, M. T.; Bollinger, J. M.; Krebs, C.; Neese, F. J. Am.
Chem. Soc. 2010, 132, 4739-4751.
(29) Brown, C. D.; Neidig, M. L.; Neibergall, M. B.; Lipscomb, J. D.; Solomon, E. I. J. Am. Chem.
Soc. 2007, 129, 7427-7438.
(30) Arciero, D. M.; Lipscomb, J. D.; Huynh, B. H.; Kent, T. A.; Münck, E. J. Biol. Chem. 1983,
258, 14981-14991.
(31) Orville, A. M.; Chen, V. J.; Kriauciunas, A.; Harpel, M. R.; Fox, B. G.; Munck, E.; Lipscomb,
J. D. Biochemistry 1992, 31, 4602-4612.
(32) Scheidt, W. R.; Durbin, S. M.; Sage, J. T. J. Inorg. Biochem. 2005, 99, 60-71.
(33) Lehnert, N.; Galinato, M. G. I.; Paulat, F.; Richter-Addo, G. B.; Sturhahn, W.; Xu, N.; Zhao,
J. Inorg. Chem. 2010, 49, 4133-4148.
(34) Paulat, F.; Berto, T. C.; DeBeer George, S.; Goodrich, L.; Praneeth, V. K. K.; Sulok, C. D.;
Lehnert, N. Inorg. Chem. 2008, 47, 11449-11451.
(35) Ray, M.; Golombek, A. P.; Hendrich, M. P.; Young, V. G.; Borovik, A. S. J. Am. Chem. Soc.
1996, 118, 6084-6085.
(36) Nguyen, D. H.; Hsu, H.-F.; Millar, M.; Koch, S. A.; Achim, C.; Bominaar, E. L.; Münck, E.
J. Am. Chem. Soc. 1996, 118, 8963-8964.

75
(37) Rose, M. J.; Betterley, N. M.; Oliver, A. G.; Mascharak, P. K. Inorg. Chem. 2010, 49, 1854-
1864.
(38) Pluth, M. D.; Lippard, S. J. Chem. Commum. 2012, 48, 11981-11983.
(39) Neese, F. Inorg. Chim. Acta 2002, 337, 181-192.
(40) Li, M.; Bonnet, D.; Bill, E.; Neese, F.; Weyhermüller, T.; Blum, N.; Sellmann, D.; Wieghardt,
K. Inorg. Chem. 2002, 41, 3444-3456.
(41) Independent measurement of the solution IR spectrum of this sample indicated complete
conversion of 1 to 2, which implies that the {FeNO}7 in the sample was formed by adventitious
oxidation of the highly air-sensitive {FeNO}8 complex during the freezing process.
(42) As noted above, decomposition of 2 leads to formation of a ferrous species and a DNIC. In
principle, the Mössbauer spectrum should therefore also contain a contribution from the ferrous
complex. However, this species is difficult to observe in the Mössbauer spectrum at low
concentration because its signal is magnetically split (and is therefore extremely broad) under these
conditions.
(43) Price, J. C.; Barr, E. W.; Tirupati, B.; Bollinger, J. M.; Krebs, C. Biochemistry 2003, 42,
7497-7508.
(44) Neese, F. J. Phys. Chem. Solids 2004, 65, 781-785.
(45) Goodrich, L. E.; Roy, S.; Alp, E. E.; Zhao, J.; Hu, M. Y.; Lehnert, N. Inorg. Chem. 2013, 52,
7766-7780.
(46) Serres, R. G.; Grapperhaus, C. A.; Bothe, E.; Bill, E.; Weyhermüller, T.; Neese, F.;
Wieghardt, K. J. Am. Chem. Soc. 2004, 126, 5138-5153.
(47) Patra, A. K.; Dube, K. S.; Sanders, B. C.; Papaefthymiou, G. C.; Conradie, J.; Ghosh, A.;
Harrop, T. C. Chem. Sci. 2012, 3, 364-369.
(48) Wei, Z.; Ryan, M. D. Inorg. Chem. 2010, 49, 6948-6954.
(49) Kundakarla, N.; Lindeman, S.; Rahman, M. H.; Ryan, M. D. Inorg. Chem. 2016, 55, 2070-
2075.
(50) Bohle, D. S.; Debrunner, P.; P. Fitzgerald, J.; Hansert, B.; Hung, C.-H.; J. Thomson, A.
Chem. Commun. 1997, 91-92.
(51) Mu, X. H.; Kadish, K. M. Inorg. Chem. 1988, 27, 4720-4725.
(52) Ellison, M. K.; Schulz, C. E.; Scheidt, W. R. Inorg. Chem. 2000, 39, 5102-5110.
(53) Li, J.; Peng, Q.; Oliver, A. G.; Alp, E. E.; Hu, M. Y.; Zhao, J.; Sage, J. T.; Scheidt, W. R. J.
Am. Chem. Soc. 2014, 136, 18100-18110.

76
(54) Choi, I. K.; Liu, Y.; Feng, D.; Paeng, K. J.; Ryan, M. D. Inorg. Chem. 1991, 30, 1832-1839.
(55) Nasri, H.; Ellison, M. K.; Chen, S.; Huynh, B. H.; Scheidt, W. R. J. Am. Chem. Soc. 1997,
119, 6274-6283.
(56) Sanders, B. C.; Patra, A. K.; Harrop, T. C. J. Inorg. Biochem. 2013, 118, 115-127.
(57) Lehnert, N.; Praneeth, V. K. K.; Paulat, F. J. Comput. Chem. 2006, 27, 1338-1351.
(58) Pellegrino, J.; Bari, S. E.; Bikiel, D. E.; Doctorovich, F. J. Am. Chem. Soc. 2009, 132, 989-
995.
(59) Abucayon, E. G.; Khade, R. L.; Powell, D. R.; Zhang, Y.; Richter-Addo, G. B. J. Am. Chem.
Soc. 2016, 138, 104-107.
(60) Xu, N.; Richter-Addo, G. B. Prog. Inorg. Chem. 2014, 59, 381-446.
(61) Farmer, P. J.; Sulc, F. J. Inorg. Biochem. 2005, 99, 166-184.
(62) For technical reasons, it is not possible to monitor the UV-Visible spectrum during the
generation of 5 for Mössbauer spectroscopy. Stoichiometric [OMe3][BF4] was therefore added to
prevent the rapid decomposition that occurs in the presence of excess [OMe3][BF4], which caused
only partial conversion of 2 to 5 in this case.
(63) Montenegro, A. C.; Amorebieta, V. T.; Slep, L. D.; Martín, D. F.; Roncaroli, F.; Murgida, D.
H.; Bari, S. E.; Olabe, J. A. Angew. Chem. Int. Ed. 2009, 48, 4213-4216.
(64) Immoos, C. E.; Sulc, F.; Farmer, P. J.; Czarnecki, K.; Bocian, D. F.; Levina, A.; Aitken, J.
B.; Armstrong, R. S.; Lay, P. A. J. Am. Chem. Soc. 2004, 127, 814-815.
(65) Derbyshire, E. R.; Tran, R.; Mathies, R. A.; Marletta, M. A. Biochemistry 2005, 44, 16257-
16265.
(66) Lanci, M. P.; Smirnov, V. V.; Cramer, C. J.; Gauchenova, E. V.; Sundermeyer, J.; Roth, J.
P. J. Am. Chem. Soc. 2007, 129, 14697-14709.
(67) Boduszek, B.; Shine, H. J. J. Org. Chem. 1988, 53, 5142-5143.
(68) Hathaway, B. J.; Holah, D. G.; Underhill, A. E. J. Chem. Soc. 1962, 2444-2448.
(69) Saba, S.; Hernandez, R.; Choy, C. C.; Carta, K.; Bennett, Y.; Bondi, S.; Kolaj, S.; Bennett,
C. J. Fluorine Chem. 2013, 153, 168-171.
(70) a) Sheldrick, G.M. SHELXTL, v. 2014/6; Bruker Analytical X-ray, Madison, WI, 2014. b)
CrystalClear Expert 2.0 r16, Rigaku Americas and Rigaku Corporation (2014), Rigaku Americas,
9009, TX, USA 77381-5209, Rigaku Tokyo, 196-8666, Japan. c) CrysAlisPro 1.171.38.41
(Rigaku Oxford Diffraction, 2015).

77
(71) Sage, J. T.; Paxson, C.; Wyllie, G. R. A.; Sturhahn, W.; Durbin, S. M.; Champion, P. M.;
Alp, E. E.; Scheidt, W. R. J. Phys.: Condens. Matter 2001, 13, 7707.
(72) Sturhahn, W. J. Phys. Condens. Matter 2004, 16, S497-S530.
(73) Galinato, M. G. I.; Spolitak, T.; Ballou, D. P.; Lehnert, N. Biochemistry 2011, 50, 1053-1069.
(74) Neese, F. Wiley Interdiscip. Rev.: Comput. Mol. Sci. 2012, 2, 73-78.
(75) Sinnecker, S.; Slep, L. D.; Bill, E.; Neese, F. Inorg. Chem. 2005, 44, 2245-2254.

78
Chapter 3
Reduction of Mono- and Di-nuclear Non-Heme {FeNO}7 Complexes
As discussed in Chapter 1, upon reduction, the [{FeNO}7]2 dimer complex
[Fe2(BPMP)(OPr)(NO)2](BPh4)2 (1) rapidly (within one minute) and quantitatively produces N2O,
presumably passing through an {FeNO}8 intermediate.1 However, the behavior of high-spin
{FeNO}8 complexes is generally not well-understood. Only a few electrochemical studies of high-
spin {FeNO}7 complexes have been reported in the literature2-6, and quasi-reversible or
irreversible reductive chemistry was observed in all cases (with the exception of the studies of
TMG3tren7 discussed in Chapter 2). In the only reported study6 of reductive decomposition of an
{FeNO}7 complex, no N2O production was observed; however, this study employed β-
diketiminate and bromide ligands which are dissimilar to the BPMP co-ligand employed in
complex 1. Thus, it is unclear whether ligand frameworks similar to BPMP generally promote N2O
formation upon reduction of corresponding {FeNO}7 complexes, or whether the geometric and/or
electronic structure of complex 1 uniquely promotes this type of reactivity.
In this chapter, a set of monomeric and dimeric {FeNO}7 complexes with coordination
environments similar to the BPMP ligand are characterized. Their decomposition upon reduction
is explored. In addition, follow-up studies on dinuclear [{FeNO}7]2 dimer complexes with the
BPMP ligand are reported. The synthesis and characterization of complex 4 was reported in part
in reference 1. Some of the reactivity studies of complexes 2 and 6 described in Section 3.2 were

79
performed by undergraduate student Claire Kozemchak, and the synthesis and characterization of
complex 5 was first performed by undergraduate REU student Sarah Neville.
3.1 Synthesis and Characterization of Non-Heme {FeNO}7 Complexes
As noted above, the behavior of non-heme {FeNO}7 complexes following reduction has
not been well-examined in the literature. With this in mind, we designed a set of complexes with
the BMPA-PhOH ligand (Scheme 3.1) which has a coordination motif similar to the BPMP ligand,
but does not force cofacial binding of NO units. Furthermore, we also synthesized and
characterized complexes with TPA and the more-electron rich TPA* ligand. The {FeNO}7
complexes were generated by addition of NO to the corresponding ferrous precursors. The
characterization of these compounds by X-ray crystallography, EPR, and IR spectroscopy is
reported below.
Scheme 3.1 Ligand frameworks employed in this chapter and in selected compounds from the literature.

80
Structural Characterization
[Fe(BMPA-PhO)(NO)]2(OTf)2 (2), [Fe(BMPA-OMePhO)(NO)]2(OTf)2 (3), [Fe(BMPA-
tBu2PhO)(NO)(OTf)] (4), and [Fe(TPA)(NO)(OTf)](OTf) (6) were crystallographically
characterized (Figure 3.1). In general, the geometric parameters of the Fe-N-O unit in these
compounds are similar to those reported in the literature for other high-spin {FeNO}7 complexes
with pyridyl ligands (see Table 3.1). As observed with the BMPA-Pr ligand5, the NO is in all cases
bound trans to the amine moiety of the ligand, but the arrangement of the other ligand moieties
differs between complexes.
The structures of complexes 2 and 3 reveal phenoxo-bridged dimers. In these complexes,
the three nitrogen donors form a trigonal face of an overall octahedral geometry. Note that as a
consequence of this geometric arrangement, the NO ligands are bound to opposite sides of the
dimer. In contrast, complex 4 crystallizes as a monomer with the triflate counterion bound in the
sixth coordination site. In this case, the three nitrogen donors form a meridional plane, although
both the fac and mer isomers likely exist in solution. For example, in the analogous complex
[Fe(BMPA-Pr)(NO)(Cl)], only the fac isomer was crystallized; however, the energy difference
between fac and mer isomers was calculated by DFT to be less than 3 kcal/mol.5
Complex 6 crystallizes as a monomer with the sixth coordination site occupied by a triflate
counterion. The Fe-N-O angle is surprisingly nearly linear ( Fe-N-O = 170°). In many reported
compounds, Fe-N-O unit linearization was attributed to sterics4,8, whereas in 6 this phenomenon
must arise from purely electronic factors. A similar linearization (average Fe-N-O = 172°) was
observed for the complex [Fe(T1Et4iPrIP)(NO)(THF)(OTf)](OTf) (T1Et4iPrIP = tris(1-ethyl-4-
isopropylimidazolyl)phosphine), which also contains all neutral donor ligands (with the exception
of the bound counterion).9 As discussed below (and in Chapters 1 and 2 ), in complexes with fewer

81
Figure 3.1 Crystal structures of complexes 2 (a), 3 (b), 4 (c), and 6 (d). In all cases, hydrogen atoms, outer-
sphere triflate counterions and solvent molecules have been omitted for clarity. Thermal ellipsoids are shown
at 30% probability. Key geometric parameters for the Fe-N-O unit are given in Table 3.1. In complex 4, the
metal-bound triflate is disordered over two positions (occupancy ratio 63.3/36.7) and is shown in only one
of the orientations for clarity.
Table 3.1 Key geometric parameters and N-O stretching frequencies for complexes 1-7 and selected
{FeNO}7 compounds from the literature.
Compound Fe-N N-O Fe-N-O (NO)
Solid
(NO)
CH2Cl2
Ref.
[Fe2(BPMP)(OPr)(NO)2](BPh4)2 (1) 1.786a 1.165a 150a 1760 n.d. 1
[Fe(BMPA-PhO)(NO)]2(OTf)2 (2) 1.785a 1.170a 148a 1730 1756 t.w.
[Fe(BMPA-OMePhO)(NO)]2(OTf)2 (3) 1.817 1.117 149 1731 1752 t.w.
[Fe(BMPA-tBu2PhO)(NO)(OTf)] (4) 1.777 1.100 163 1741 1753 t.w.
[Fe(BMPA-NO2PhO)(NO)(OTf)] (5) n.d. n.d. n.d. 1770 1774 t.w.
[Fe(BMPA-Pr)(NO)(Cl)] 1.783 1.154 152 1726 n.d. 5
[Fe(BMPA-Pr)(NO)]6(OTf)6 1.76a 1.17a 149a 1784 1787 5
[Fe(TPA)(NO)(OTf)](OTf) (6) 1.755 1.144 170 1806 1800 5, t.w.
[Fe(TPA*)(NO)(OTf)](OTf) (7) n.d. n.d. n.d. 1804 1788 t.w.
[Fe(TPA)(BF)(NO)](ClO4) 1.722 1.152 159 1794 n.d. 10
[Fe(N4Py)(NO)](BF4)2b 1.732 1.157 145 1672 n.d. 11-12
[Fe(N3PyS)(NO)](BF4)c 1.732 1.150 147 1753, 1660 n.d. 11-12 a Average value for non-equivalent Fe-N-O units b Low-spin complex. c Samples of this complex are a mixture of
high-spin ((NO) = 1753 cm-1) and low-spin ((NO) = 1660 cm-1) species. The cited bond lengths were obtained at
low temperature and are reflective of the low-spin version of the complex.
(a) (b)
(d) (c)

82
anionic ligands, increased -donation from NO to the iron center is observed.5 Thus the
linearization observed in these two complexes likely stems from the stronger interaction between
the Fe dxz and dyz orbitals and the NO * orbitals as a result of the neutral ligand which results in
an electron-poor iron center. A similar argument has been used to explain the linearization of the
Fe-N-O bond in ferric heme nitrosyls.13 This phenomenon also explains the previously observed
correlation between (N-O) and Fe-N-O bond angle for 6-coordinate high-spin {FeNO}7
complexes.9
EPR Spectroscopy: Solution Speciation
Figure 3.2 EPR spectra of complexes 2 and 4 (5 mM in CH2Cl2) recorded at 4.2 K.
In order to determine whether the crystallographically determined structures are retained
in solution, EPR spectroscopy was employed. Complexes 2 and 3 are expected to be EPR-silent
since the presence of two bridging phenoxo ligands and the short (~ 3.3 Å) Fe-Fe bond distance
should lead to strong magnetic coupling between the Fe centers. Correspondingly, although an
EPR signal is observed for both of these complexes in CH2Cl2, spin integration indicates that the
100 200 300 400
g = 2.01
De
rivative
EP
R I
nte
nsity
B / mT
2
4
g = 3.83
g = 3.91

83
signals of 2 and 3 only account for approximately 5% of the material in solution. On the other
hand, complex 4 exhibits an intense S = 3/2 EPR signal with g-values centered around g = 4 and g
= 2 characteristic of a high-spin {FeNO}7 (Figure 3.2).14 This signal accounts for ~75% of the
material in solution which indicates that 4 remains primarily monomeric in solution. Although we
have been unable to structurally characterize [Fe(BMPA-NO2PhO)(NO)(OTf)] (5), the EPR spin
integration indicates ~65% monomer formation. While in complex 4, steric clash between the
ortho tert-butyl group of the phenolate ligand and the pyridine moieties likely accounts for the
formation of a monomeric structure, in complex 5 this must be determined by the electronic
properties of the complex, most likely the reduced donation of the nitro-substituted phenolate
ligand.
As noted above, neither complex 4 nor complex 5 can be demonstrated to exist as a purely
monomeric {FeNO}7 complex in solution. Complexes 2 and 3 also contain small amounts of
monomeric {FeNO}7. Additionally, the EPR spin integration for these compounds is solvent-
dependent; for instance, complexes 4 and 5 contain only ~30% monomeric {FeNO}7 in 1:1
propionitrile:butyronitrile. While the low spin integration can potentially be attributed to NO loss
or to diamagnetic or integer spin impurities, it is also possible that 4 and/or 5 are able to dimerize
under certain conditions (and, similarly, that 2 and 3 may be monomeric under certain conditions).
Further studies are therefore needed to definitively assess the purity and solution speciation of
these compounds.
Samples of complex 6 contain approximately 90% monomeric {FeNO}7 in CH2Cl2 as
determined by EPR spectroscopy. The 1H NMR of the compound also supports this high degree
of nitrosylation, and shows only a small amount (~5%) of the ferrous precursor. Interestingly, in
CH3CN solution, in addition to the S = 3/2 EPR signal at g = 3.95, an additional signal is observed

84
at g = 2 (Figure 3.3a), indicative of formation of a low-spin {FeNO}7 species.15 This is further
demonstrated by the solution IR spectra of this complex (Figure 3.3b). Whereas in CH2Cl2
solution, a single NO stretching frequency characteristic of a high-spin {FeNO}7 complex is
observed at 1800 cm-1, in CH3CN solution two peaks are observed at 1811 cm-1 and 1701 cm-1.
The lower energy band is indicative of partial formation of a low-spin {FeNO}7 complex. This
phenomenon is not surprising, given that the precursor complex [Fe(TPA)(OTf)2] exhibits similar
spin state changes in these solvents, although in this case the complex is purely high-spin in CH2Cl2
and purely low-spin in CH3CN.16 Additionally, the ferrous nitrosyl with the tetrapyridyl ligand
N4Py has been shown to be low-spin11, and a complex with the N3PyS ligand has been shown be
a mixture of high- and low-spin12. [Fe(TPA*)(NO)(OTf)](OTf) (7) generally behaves in a similar
fashion.
Figure 3.3 (a) EPR spectra of 6 in frozen CH2Cl2 solution (top) and in frozen CH3CN solution (bottom)
recorded at 4.2 K. (b) Solution IR spectra of 6 in CH2Cl2 solution (top) and in CD3CN solution (bottom).
IR Spectroscopy: Tuning of Fe-NO Unit by Ligand Substitution
This set of complexes also allows us to examine the effect of substitutions of the ligand
periphery on the electronic properties of the Fe-N-O unit. As discussed in Chapter 1, in a previous
100 200 300 400
g = 3.95 g = 2.00
g = 2.00
CH3CN
Derivative E
PR
Inte
nsity
g = 3.91CH2Cl
2
B / mT
1900 1800 1700 1600
Absorb
ance
CH2Cl
2
CH3CN
1800
Energy / cm-1
1701
1811
(a) (b)

85
study in our group, the effect of changes in the primary coordination sphere on electronic structure
in {FeNO}7 complexes was examined.5 Importantly, vibrational spectroscopy (i.e. N-O and Fe-
N(O) stretching frequencies) is a very sensitive probe of the electronic properties of the Fe-N-O
unit. By combining vibrational spectroscopy DFT calculations, our group demonstrated that in
complexes where the iron center has a higher effective nuclear charge, the NO ligand donates
additional electron density into the iron dxz and dyz orbitals leading to an increase in the N-O
stretching frequency. For example, the N-O stretch of [Fe(BMPA-Pr)(NO)(Cl)], which contains
two anionic donors, is 80 cm-1 lower than that of [Fe(TPA)(NO)](ClO4)2 which contains only
neutral donors. More recently, Darensbourg and co-workers demonstrated that in a series of
{Fe(NO)2}9 dinitrosyl iron complexes (DNICs), substitutions on the ligand periphery can lead to
shifts as large as 15 cm-1 in NO stretching frequency.17 However, there are no comparable studies
examining the effect of peripheral ligand substitution on monomeric {FeNO}7 complexes.
Figure 3.4 Solution IR spectra in CH2Cl2 comparing (a) dimeric phenoxo-bridged complexes 2 and 3 (b)
monomeric complexes 4 and 5 and (c) monomeric TPA derivatives 6 and 7.
Complexes 2 and 3 have nearly identical NO stretching frequencies at ~1730 cm-1 in the
solid state, as expected for such a minor change in the ligand periphery. However, the energy of
1900 1800 1700 1600 1500
Absorb
ance
Energy / cm-1
6
71800
1788
1900 1800 1700 1600 1500
Absorb
ance
Energy / cm-1
4
51774 1753
1900 1800 1700 1600 1500
Absorb
ance
Energy / cm-1
2
31756
1752
(a) (b) (c)
86
this NO stretching frequency is surprisingly low. For instance, the ligand framework of 2 is similar
to that of 1, but complex 1 exhibits an NO stretch in the solid state at 1760 cm-1. In order to
determine whether the low NO stretching frequency of 2 can be attributed to solid state effects,
the solution IR spectrum of the complex was recorded in CH2Cl2. Surprisingly, the N-O stretching
frequency of complex 2 upshifts dramatically to 1756 cm-1 in solution (Figure 3.4a). Similar
behavior is observed for complex 3.
The N-O stretching frequencies of complexes 4 and 5 are observed at 1741 cm-1 and 1770
cm-1, respectively, in the solid state and at 1753 cm-1 and 1774 cm-1 in CH2Cl2 solution (Figure
3.4b). Although the NO stretches of complexes 6 and 7 are nearly identical (~1805 cm-1) in the
solid state, in CH2Cl2 solution they are observed at 1800 cm-1 and 1788 cm-1, respectively, in
accordance with the strongly electron-donating nature of the TPA* ligand as compared to TPA
(Figure 3.4c).
Overall, these findings demonstrate that the Fe-N-O unit in {FeNO}7 complexes can indeed
be tuned by substitutions on the ligand periphery. Interestingly, changes in the NO stretching
frequencies upon dissolving in solution vary from compound to compound. Whereas the NO
stretching frequencies of 5, 6, and the related complex [Fe(BMPA-Pr)(NO)]6(OTf)6 are nearly
identical in solid state and in solution, those of 2, 3, and 4 upshift significantly, and that of 7
downshifts significantly. This study therefore also highlights the importance of considering both
solution and solid state data when comparing iron nitrosyl complexes, since solid state effects can
vary dramatically between complexes.

87
3.2 Reduction of High-Spin Non-Heme Iron Nitrosyls
Complexes 2, 4, and 6 were selected as representative examples for studies of reduction.
All reactions were carried out in CH2Cl2 since under these conditions, complex 4 is primarily
monomeric and complex 6 remains high-spin. All of these compounds show little to no loss of NO
in CH2Cl2 solution over several hours as judged by IR spectroscopy. This indicates that any
observed reactivity upon reduction must arise from the reduced compound and not from reduction
of free NO released from the {FeNO}7 complex. (Note that NO is reduced at approximately 1 V
vs ferrocene in organic solution.18) For bulk studies of the product(s) of reduction, cobaltocene
(CoCp2, E1/2 = 1.3 V vs ferrocene in CH2Cl219) was employed as a reductant.
Figure 3.5 (a) Cyclic voltammogram of complex 2 in CH2Cl2 containing 0.1 M NBu4ClO4 as supporting
electrolyte. Scan rate: 200 mv•s-1. (b) IR spectrum of a 7.5 mM solution of 2 in CH2Cl2 solution following
treatment with cobaltocene at 5 minutes (red) and 45 minutes (blue). The region from 2150 to 2250 cm-1 has
been magnified 10x to show the band at 2222 cm-1 which corresponds to a small amount of N2O.
The cyclic voltammogram of the phenoxo-bridged dimer complex 2 in CH2Cl2 shows two
overlapping redox events at approximately 1 V vs ferrocene (Figure 3.5a). Chemical reduction
leads to a complete disappearance of the (N-O) band in the IR spectrum. Curiously, however, the
solution IR reveals only a few low-intensity bands potentially associated with the NO unit in the
(a) (b)
2200 1900 1800 1700 1600 1500
0.0
0.1
0.2
0.3
Absorb
ance
Energy / cm-1
Initial
t = 5 min
t = 45 min
10 x
2222
1690
1670
1632
1594
1756
-0.4 -0.6 -0.8 -1.0 -1.2 -1.4 -1.6 -1.8
-5
0
5
10
15
Curr
ent /
A
Potential / V vs ferrocene
Ep = -1.07 V

88
1500-2000 cm-1 region in which high-spin iron NO-containing species typically appear (Figure
3.5b). Since the observed bands fall in a region which overlaps significantly with ligand vibrations,
isotope labeling studies are needed to determine which, if any, of the observed features correspond
to NO-containing species. Assays of the gas headspace of 2 stirred with cobaltocene for 5 minutes
show little to no N2O production. Over longer periods of time, a more significant amount of N2O
is produced (approximately 40% after 30 minutes). The amount of N2O produced is dependent on
the initial concentration of the complex and on the solvent, and thus far has proven to be
irreproducible which has prevented thorough mechanistic understanding of the process leading to
N2O production. In fact, preliminary studies indicate that the rate of N2O production is comparable
to that of the reduction of free NO by cobaltocene1 which suggests that the observed N2O
production may not be iron-mediated, and may simply stem from release of NO from the complex.
Regardless, this finding indicates that not all dimeric [{FeNO}7]2 complexes produce N2O rapidly
upon reduction. The lack of N2O production from 2 presumably results from the trans orientation
of the NO moieties (see Figure 3.1a), which prevents intramolecular N-N coupling.
Figure 3.6 (a) Cyclic voltammogram of complex 4 in CH2Cl2 containing 0.1 M NBu4ClO4 as supporting
electrolyte. Scan rate: 200 mV•s-1. (b) Solution IR spectra of 4 (black) and of 4 treated with cobaltocene (red).
-0.6 -0.8 -1.0 -1.2 -1.4 -1.6 -1.8
-5
0
5
10
15
Curr
ent /
A
Potential / V vs. ferrocene
Ep = -1.07 V
(a) (b)
1900 1800 1700 1600 1500
0.0
0.1
0.2
0.3
0.4
4
4 + CoCp2
Absorb
ance
Energy / cm-1
1632
1692
1752

89
The CV of the monomeric complex 4 exhibits an irreversible reductive event at -1.07 V
versus ferrocene (Figure 3.6a). In this case, chemical or electrochemical reduction is accompanied
by the appearance of two new bands in the solution IR spectrum at 1692 and 1632 cm-1 (Figure
3.6b). Little to no N2O generation is observed within 30 minutes of reduction, although some N2O
production is observed after several hours. The positions and relative intensities of these bands are
suggestive of formation of an {Fe(NO)2}10 DNIC. For example, the {Fe(NO)2}
10 complex
[Fe(dmp)(NO)2] (dmp = 2,9-dimethyl-1,10-phenanthroline) exhibits (N-O) = 1692 and 1637 cm-
1 in CH2Cl2 solution in a similar intensity pattern (see Figure 4.2). This overall reaction
corresponds to formal transfer of NO from one iron center to another:
{FeNO}7 + e- {FeNO}8 ½ {Fe(NO)2}10 + ½ Fe(II)
Unfortunately, the formed DNIC is unstable and decays over the course of several hours at room
temperature which has prevented acquisition of structural data to confirm this hypothesis.
However, this type of behavior has been observed previously by Lippard and co-workers with a
β-diketiminate ligand.6 In this case both the formed {Fe(NO)2}10 DNIC and the ferrous product
were isolable. This suggests that DNIC formation is plausible for our system. Furthermore, as
discussed in Chapter 2, [Fe(TMG2dien)(NO)(OTf)](OTf) also produces a DNIC upon reduction.
Taken together, these findings indicate that DNIC formation is in fact a general decomposition
pathway for high-spin {FeNO}8 complexes.
Note that the similarity between the IR spectra of the reduced product and [Fe(dmp)(NO)2]
implies formation of a neutral {Fe(NO)2}10 unit since the vibrational frequencies of DNICs are
very sensitive to the overall charge of the complex.20 Furthermore, a similar species is obtained
upon reduction of [Fe(BMPA-Pr)(NO)]6(OTf)6,21 and a small amount of this species is also formed
upon reduction of complex 2 (see Figure 3.5b). This implies that the complex with (N-O) = 1692,
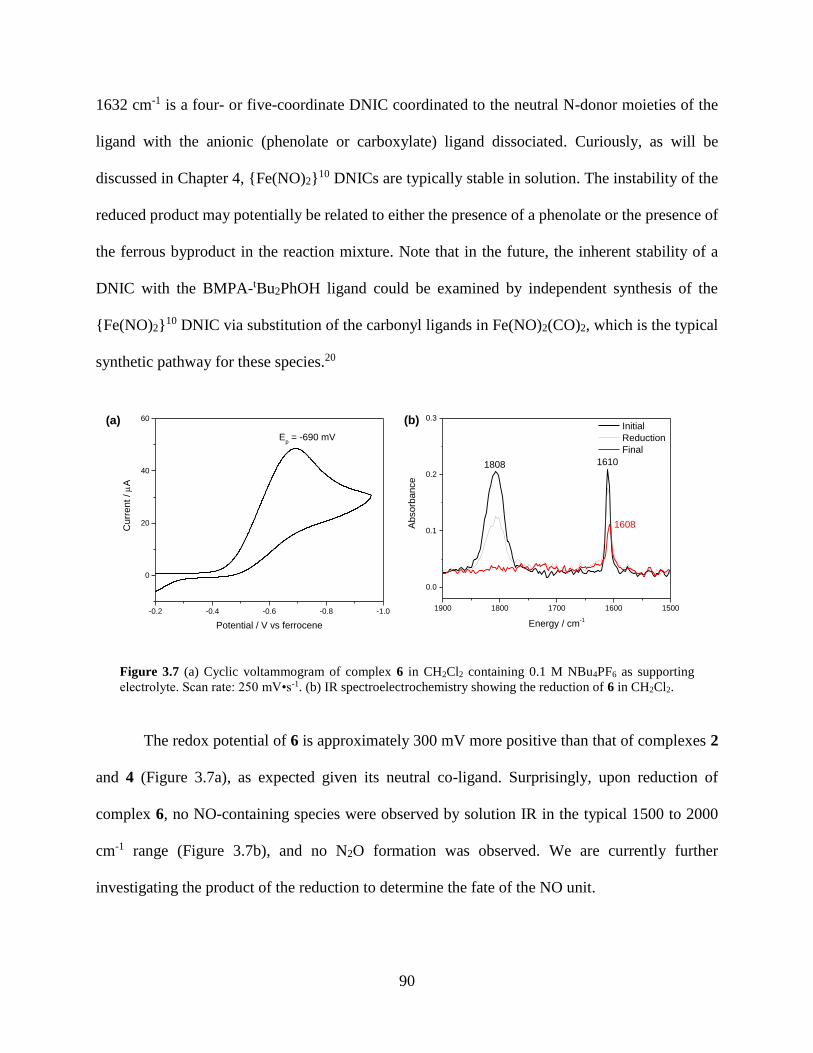
90
1632 cm-1 is a four- or five-coordinate DNIC coordinated to the neutral N-donor moieties of the
ligand with the anionic (phenolate or carboxylate) ligand dissociated. Curiously, as will be
discussed in Chapter 4, {Fe(NO)2}10 DNICs are typically stable in solution. The instability of the
reduced product may potentially be related to either the presence of a phenolate or the presence of
the ferrous byproduct in the reaction mixture. Note that in the future, the inherent stability of a
DNIC with the BMPA-tBu2PhOH ligand could be examined by independent synthesis of the
{Fe(NO)2}10 DNIC via substitution of the carbonyl ligands in Fe(NO)2(CO)2, which is the typical
synthetic pathway for these species.20
Figure 3.7 (a) Cyclic voltammogram of complex 6 in CH2Cl2 containing 0.1 M NBu4PF6 as supporting
electrolyte. Scan rate: 250 mV•s-1. (b) IR spectroelectrochemistry showing the reduction of 6 in CH2Cl2.
The redox potential of 6 is approximately 300 mV more positive than that of complexes 2
and 4 (Figure 3.7a), as expected given its neutral co-ligand. Surprisingly, upon reduction of
complex 6, no NO-containing species were observed by solution IR in the typical 1500 to 2000
cm-1 range (Figure 3.7b), and no N2O formation was observed. We are currently further
investigating the product of the reduction to determine the fate of the NO unit.
(a) (b)
1900 1800 1700 1600 1500
0.0
0.1
0.2
0.3A
bsorb
ance
Energy / cm-1
Initial
Reduction
Final
1808 1610
1608
-0.2 -0.4 -0.6 -0.8 -1.0
0
20
40
60
Curr
ent /
A
Potential / V vs ferrocene
Ep = -690 mV

91
Overall, although we do not thus far fully understand the reductive decomposition
processes for all of these compounds, several conclusions can be drawn. First, one major
decomposition product upon reduction of {FeNO}7 complexes with non-sterically hindered
ligands is a DNIC. Second, reduction of {FeNO}7 complexes does not lead to significant amounts
of N2O production on short (i.e. less than 10 minute) timescales. This suggests that cis-oriented
NO moieties in close proximity such as those found in complex 1 may be crucial for rapid, efficient
N2O formation from an {FeNO}8 species as proposed in the “super-reduced” mechanism of N2O
formation discussed in Chapter 1.
3.3 Synthesis and Reactivity of BPMP [{FeNO}7]2 Dimers
Our initially reported1 synthesis of the BPMP diferrous dinitrosyl complex 1 suffered from
several drawbacks. First, although some batches of complex yielded N2O quantitatively, typical
yields were in the 60-80% range, with yields as low as 30% in some cases. This can be partially
explained by facile NO loss during isolation of the complex which is commonly observed for iron
nitrosyls. However, elemental analysis of the precursor complex also suggested the presence of
variable amounts of salt impurities, likely stemming from an incomplete metathesis step during
the isolation of the compound and/or partial formation of a bis(-carboxylato) complex rather than
the desired mono(-carboxylato) complex. Second, 1 exhibited somewhat low solubility in organic
solution and was completely insoluble in aqueous solution, even with the use of co-solvents such
as CH3CN or DMF. We hypothesized that this insolubility may stem from the tetraphenylborate
counterion, and that the use of a different counterion could enhance the solubility of the complex.
With this in mind, a synthesis of the ferrous precursor compound with triflate counterions
was designed. The corresponding diferrous dinitrosyl compound [Fe2(BPMP)(OPr)(NO)2](OTf)2

92
(8) shows IR, UV-Visible, and 1H NMR spectra consistent with those reported previously for the
tetraphenylborate complex. The compound is soluble in excess of 10 mM in CH2Cl2 and is slightly
soluble in water with CH3CN as a co-solvent. Provided it is handled carefully during synthesis and
isolation, 8 consistently yields N2O quantitatively upon reduction.
Surprisingly, whereas initial studies of 1 indicated that quantitative N2O production is
observed only upon addition of two equivalents of reductant per dimer (i.e. one equivalent per iron
center), quantitative N2O production from 8 is observed upon addition of one equivalent of
cobaltocene per dimer (Figure 3.8). We currently hypothesize that the difference in reactivity
between 1 and 8 can be attributed to impurities in 1 rather than the change in counterion.
Figure 3.8 Solution IR spectrum (in CH2Cl2) showing the product of the reaction of 8 with one equivalent of
cobaltocene (per dimer). The band at 2222 cm-1 corresponds to N2O in solution. Inset: Gas IR of the
headspace of the reaction of 8 with cobaltocene (at t = 10 minutes). Integration of this band and comparison
to a standard indicates quantitative production of N2O.
Additionally, the complex [Fe2(BPMP)(NO)2(OTf)2](OTf) (9) which does not contain a bridging
propionate moiety was synthesized. The complex exhibits sharp symmetric and antisymmetric NO
stretching bands at 1800 cm-1 and 1782 cm-1, significantly higher than the bands in 8. Although
complex 9 exhibits low NO affinity in coordinating solvents such as CH3CN and is insoluble in
2300 2200 2100 2000 1900 1800 1700 1600 1500
0.0
0.1
0.2
0.3
0.4
0.5
2275 2250 2225 2200 2175 2150
Energy / cm-1
Gas IR of headspace
Ab
so
rban
ce
Energy / cm-1
8
+ 1 eq CoCp2
1763
17322222
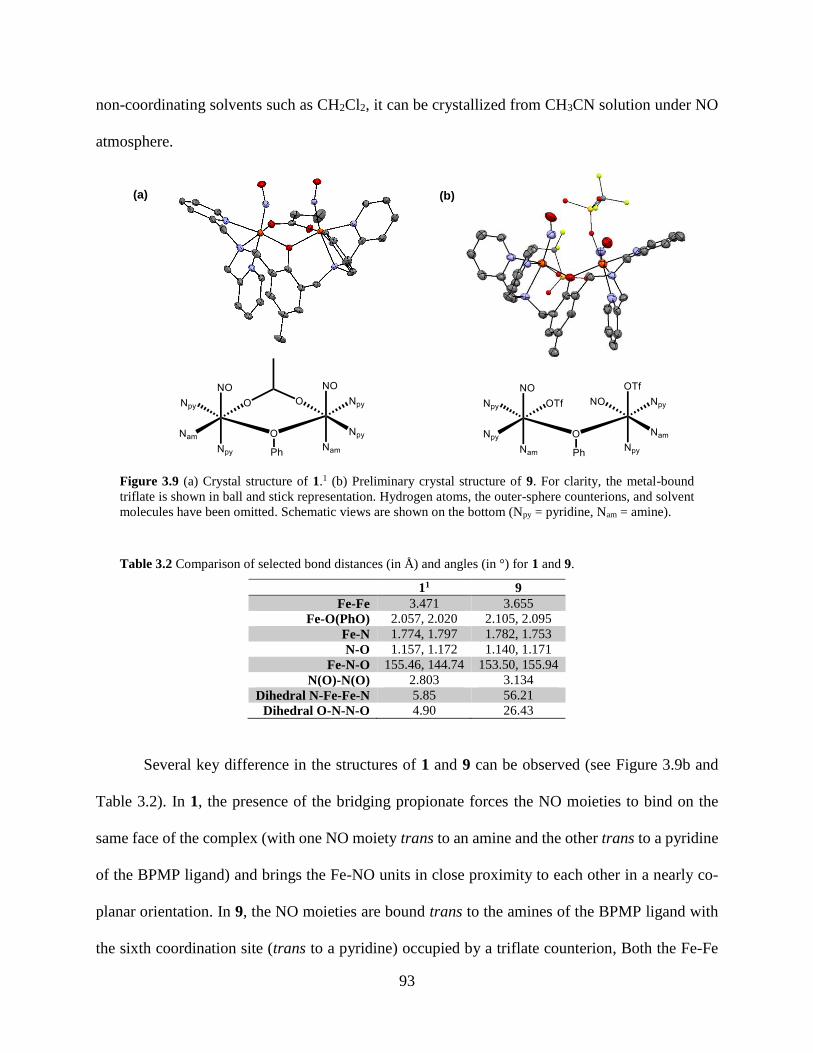
93
non-coordinating solvents such as CH2Cl2, it can be crystallized from CH3CN solution under NO
atmosphere.
Figure 3.9 (a) Crystal structure of 1.1 (b) Preliminary crystal structure of 9. For clarity, the metal-bound
triflate is shown in ball and stick representation. Hydrogen atoms, the outer-sphere counterions, and solvent
molecules have been omitted. Schematic views are shown on the bottom (Npy = pyridine, Nam = amine).
Table 3.2 Comparison of selected bond distances (in Å) and angles (in °) for 1 and 9.
11 9
Fe-Fe 3.471 3.655
Fe-O(PhO) 2.057, 2.020 2.105, 2.095
Fe-N 1.774, 1.797 1.782, 1.753
N-O 1.157, 1.172 1.140, 1.171
Fe-N-O 155.46, 144.74 153.50, 155.94
N(O)-N(O) 2.803 3.134
Dihedral N-Fe-Fe-N 5.85 56.21
Dihedral O-N-N-O 4.90 26.43
Several key difference in the structures of 1 and 9 can be observed (see Figure 3.9b and
Table 3.2). In 1, the presence of the bridging propionate forces the NO moieties to bind on the
same face of the complex (with one NO moiety trans to an amine and the other trans to a pyridine
of the BPMP ligand) and brings the Fe-NO units in close proximity to each other in a nearly co-
planar orientation. In 9, the NO moieties are bound trans to the amines of the BPMP ligand with
the sixth coordination site (trans to a pyridine) occupied by a triflate counterion, Both the Fe-Fe
(a) (b)

94
and N(O)-N(O) distances are elongated as compared to 1 as a result of the absence of the bridging
propionate. Additionally, the NO moieties are no longer in a co-planar orientation, although the
complex is likely to be conformationally flexible in solution. We hypothesize that the elongated
N(O)-N(O) distance and non-planar geometry of the Fe-NO moieties may decrease or prevent N2O
production from 9. Preliminary reactivity studies indicate that this indeed the case, although the
low N2O production from 9 upon addition of cobaltocene may instead arise from the low solution
stability and/or low solubility of 9. Future work will involve studies of 9 in different solvents in
order to determine whether N2O can be produced from this complex under different conditions,
and if N2O is not produced, what other product(s) form upon reduction.
3.4 Experimental Section
Synthesis
All reagents used for ligand synthesis were purchased and used as received.
Fe(CH3CN)2(OTf)222 was prepared by recrystallization of Fe(OTf)2 (Strem) from
acetonitrile/diethyl ether. All other reagents were purified as described in Chapter 2.
Synthesis of BMPA-PhOH Complexes
The ligands BMPA-PhOH, BMPA-tBu2PhOH, and BMPA-OMePhOH were synthesized
via reductive amination following the general procedure of Abdel-Magid et. al.23 A representative
procedure for BMPA-PhOH is given below. BMPA-NO2PhOH24 was synthesized following
literature procedure.
In general, the ferrous BMPA-PhO complexes 2-5 are highly air-sensitive. In many cases,
adventitious oxidation was observed despite careful handling of the complex under strictly
anaerobic conditions. The oxidation is easily monitored by UV-Visible spectroscopy; the

95
compounds undergo a dramatic color change upon exposure to air (see Figure 3.10 for a
representative example). Thus, in cases where the complex was significantly discolored, it was
treated with excess ethanethiol to reduce it back to the ferrous state prior to NO addition.
Figure 3.10 UV-Visible spectrum of [Fe(BMPA-tBu2PhO)(OTf)] before (black) and after (red) exposure to
air.
Because of this air sensitivity, we have been unable to obtain satisfactory elemental analyses for
most of the precursor compounds and, as is often the case for metal nitrosyl complexes, NO lability
prevents acquisition of elemental analyses for the nitrosylated compounds. Note also that we have
not crystallographically characterized any of the precursor compounds, and are therefore uncertain
of the exact coordination environment of these species (i.e. monomer vs dimer). They are
formulated below as monomers for clarity.
N-(2-hydroxybenzyl)-N,N-bis(2-pyridylmethyl)amine (BMPA-PhOH). In a Schlenk flask,
379 mg (1.90 mmol) di-(2-picolyl)amine and 232 mg (1.90 mmol) salicylaldehyde were combined
in 20 mL 1,2-dichloroethane. The solution was placed under argon and stirred for 1 hour, at which
point 608 mg (2.87 mmol) sodium triacetoxyborohydride was added. After stirring for
300 400 500 600 700 800 900 1000
0.0
0.5
1.0
1.5A
bso
rban
ce
Wavelength / nm
[Fe(BMPA-tBu
2PhO)(OTf)]
+ O2
603 nm

96
approximately 18 hours at room temperature, 50 mL saturated aqueous sodium bicarbonate was
added and the aqueous layer was extracted with CH2Cl2. The combined organic layers were shaken
with brine, dried over sodium sulfate, and rotavaped down to a yellow oil which was dried under
high vacuum and then used for metalation without further purification. Yield: 566 mg, 97%. LCT-
MS: m/z=306 [M+H]+. 1H NMR (400 MHz, CDCl3): 11.03 (s, 1H); 8.57 (d, 2H); 7.63 (t, 2H);
7.35 (d, 2H); 7.16 (m, 3H); 7.06 (d, 1H); 6.91 (d, 1H); 6.77 (t, 1H); 3.88 (s, 4H); 3.80 (s, 2H).
[Fe(BMPA-PhO)]OTf. Under inert atmosphere, 566 mg (1.85 mmol) BMPA-PhOH and 129 mg
(1.84 mmol) potassium methoxide were combined in 5 mL MeOH. The resulting suspension was
stirred for several minutes, and 599 mg (1.69 mmol) Fe(OTf)2 was then added. The reaction was
stirred for 45 min, then filtered. Diethyl ether was added to the filtrate, causing a yellow solid to
precipitate. The product was allowed to precipitate at -33°C overnight. The yellow solid was
isolated by vacuum filtration and recrystallized from CH2Cl2/hexanes to remove salt impurities.
Yield: 593 mg, 63%. Elemental analysis: Expected: C: 47.17, H: 3.56, N: 8.25; Found: C: 47.03,
H: 3.75, N: 8.13.
[Fe(BMPA-PhO)(NO)]2OTf2 (2). Under inert atmosphere, 460 mg [Fe(BMPA-PhO)]OTf was
dissolved in a minimal volume of CH2Cl2 (approximately 10 mL) and exposed to excess NO gas.
The solution immediately turned dark red. The reaction was stirred under NO headspace for 30
minutes. Hexanes was then added, and the product was allowed to precipitate at -33°C overnight.
The solution was filtered under inert atmosphere to give the title compound as a brown solid.
Yield: 455 mg, 93%. UV-Visible and FT-IR spectra are shown in Figure 3.11.
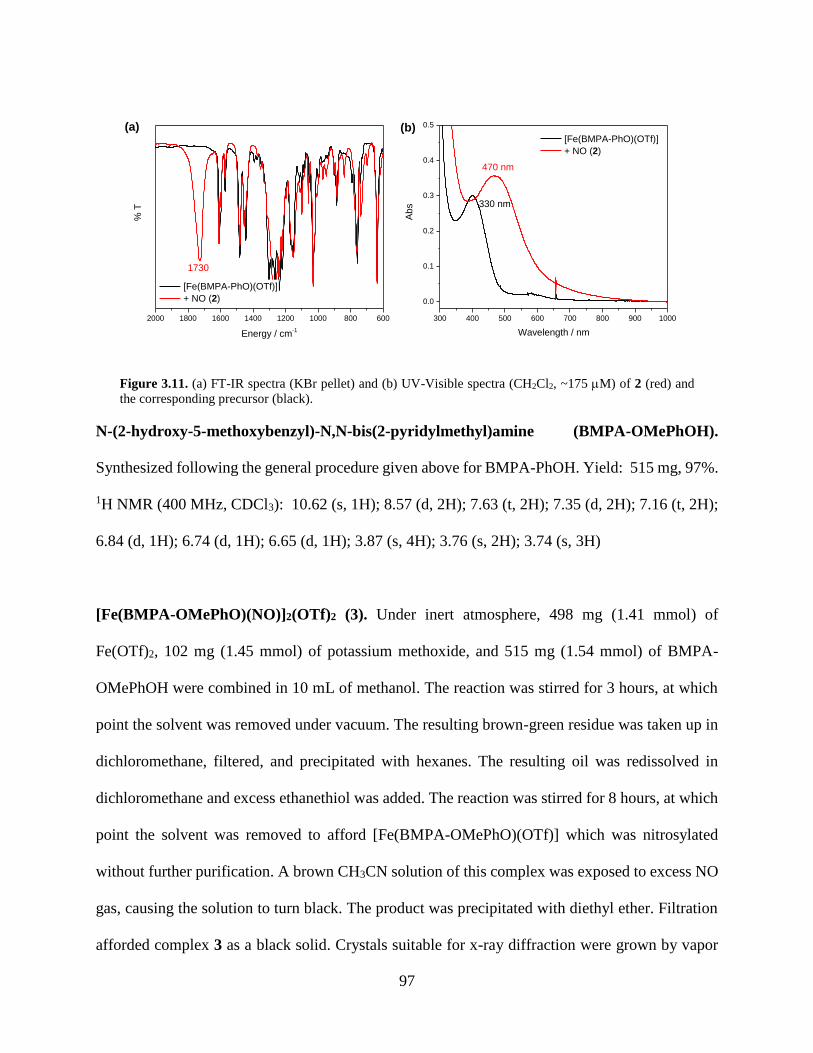
97
Figure 3.11. (a) FT-IR spectra (KBr pellet) and (b) UV-Visible spectra (CH2Cl2, ~175 M) of 2 (red) and
the corresponding precursor (black).
N-(2-hydroxy-5-methoxybenzyl)-N,N-bis(2-pyridylmethyl)amine (BMPA-OMePhOH).
Synthesized following the general procedure given above for BMPA-PhOH. Yield: 515 mg, 97%.
1H NMR (400 MHz, CDCl3): 10.62 (s, 1H); 8.57 (d, 2H); 7.63 (t, 2H); 7.35 (d, 2H); 7.16 (t, 2H);
6.84 (d, 1H); 6.74 (d, 1H); 6.65 (d, 1H); 3.87 (s, 4H); 3.76 (s, 2H); 3.74 (s, 3H)
[Fe(BMPA-OMePhO)(NO)]2(OTf)2 (3). Under inert atmosphere, 498 mg (1.41 mmol) of
Fe(OTf)2, 102 mg (1.45 mmol) of potassium methoxide, and 515 mg (1.54 mmol) of BMPA-
OMePhOH were combined in 10 mL of methanol. The reaction was stirred for 3 hours, at which
point the solvent was removed under vacuum. The resulting brown-green residue was taken up in
dichloromethane, filtered, and precipitated with hexanes. The resulting oil was redissolved in
dichloromethane and excess ethanethiol was added. The reaction was stirred for 8 hours, at which
point the solvent was removed to afford [Fe(BMPA-OMePhO)(OTf)] which was nitrosylated
without further purification. A brown CH3CN solution of this complex was exposed to excess NO
gas, causing the solution to turn black. The product was precipitated with diethyl ether. Filtration
afforded complex 3 as a black solid. Crystals suitable for x-ray diffraction were grown by vapor
(a) (b)
2000 1800 1600 1400 1200 1000 800 600
% T
Energy / cm-1
[Fe(BMPA-PhO)(OTf)]
+ NO (2)
1730
300 400 500 600 700 800 900 1000
0.0
0.1
0.2
0.3
0.4
0.5
Abs
Wavelength / nm
[Fe(BMPA-PhO)(OTf)]
+ NO (2)
470 nm
330 nm
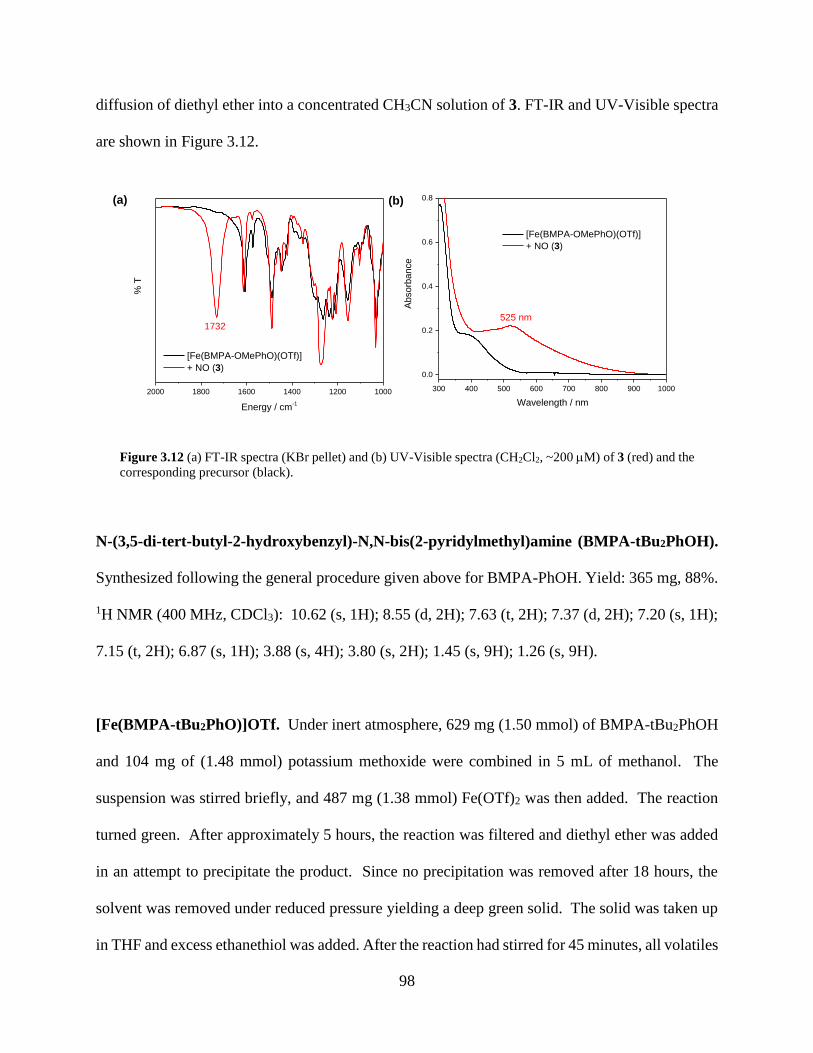
98
diffusion of diethyl ether into a concentrated CH3CN solution of 3. FT-IR and UV-Visible spectra
are shown in Figure 3.12.
Figure 3.12 (a) FT-IR spectra (KBr pellet) and (b) UV-Visible spectra (CH2Cl2, ~200 M) of 3 (red) and the
corresponding precursor (black).
N-(3,5-di-tert-butyl-2-hydroxybenzyl)-N,N-bis(2-pyridylmethyl)amine (BMPA-tBu2PhOH).
Synthesized following the general procedure given above for BMPA-PhOH. Yield: 365 mg, 88%.
1H NMR (400 MHz, CDCl3): 10.62 (s, 1H); 8.55 (d, 2H); 7.63 (t, 2H); 7.37 (d, 2H); 7.20 (s, 1H);
7.15 (t, 2H); 6.87 (s, 1H); 3.88 (s, 4H); 3.80 (s, 2H); 1.45 (s, 9H); 1.26 (s, 9H).
[Fe(BMPA-tBu2PhO)]OTf. Under inert atmosphere, 629 mg (1.50 mmol) of BMPA-tBu2PhOH
and 104 mg of (1.48 mmol) potassium methoxide were combined in 5 mL of methanol. The
suspension was stirred briefly, and 487 mg (1.38 mmol) Fe(OTf)2 was then added. The reaction
turned green. After approximately 5 hours, the reaction was filtered and diethyl ether was added
in an attempt to precipitate the product. Since no precipitation was removed after 18 hours, the
solvent was removed under reduced pressure yielding a deep green solid. The solid was taken up
in THF and excess ethanethiol was added. After the reaction had stirred for 45 minutes, all volatiles
300 400 500 600 700 800 900 1000
0.0
0.2
0.4
0.6
0.8
Ab
so
rban
ce
Wavelength / nm
[Fe(BMPA-OMePhO)(OTf)]
+ NO (3)
525 nm
(a) (b)
2000 1800 1600 1400 1200 1000
% T
Energy / cm-1
[Fe(BMPA-OMePhO)(OTf)]
+ NO (3)
1732
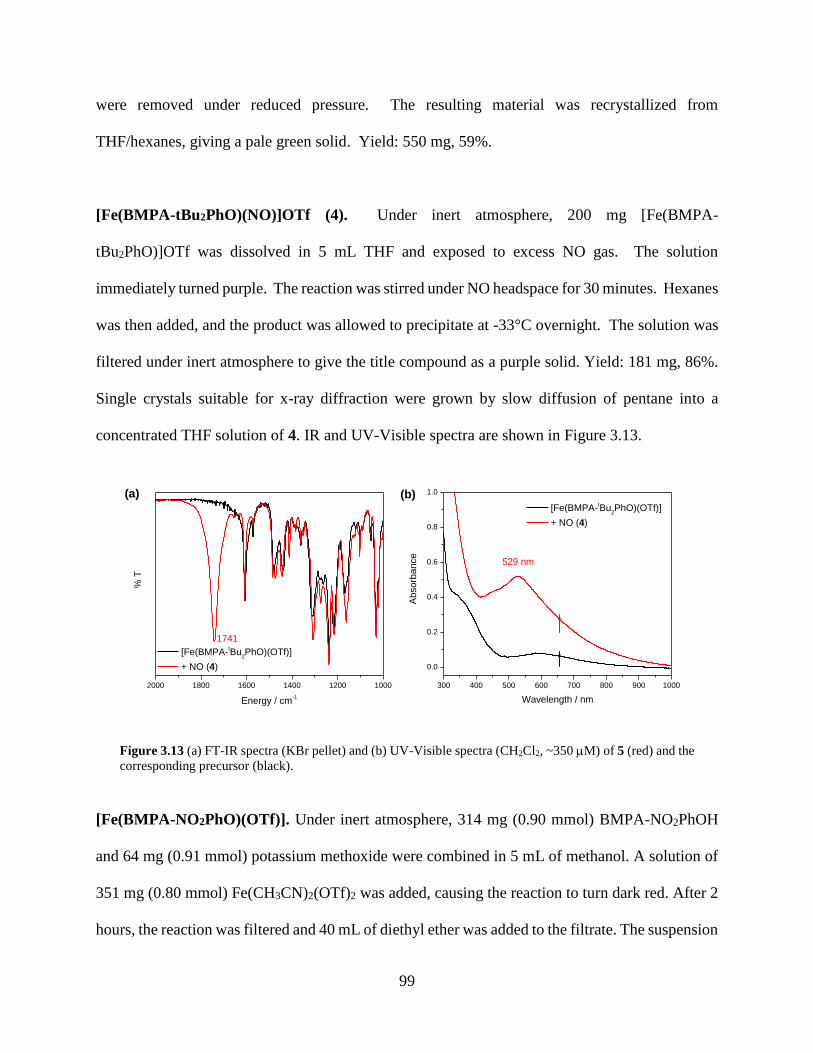
99
were removed under reduced pressure. The resulting material was recrystallized from
THF/hexanes, giving a pale green solid. Yield: 550 mg, 59%.
[Fe(BMPA-tBu2PhO)(NO)]OTf (4). Under inert atmosphere, 200 mg [Fe(BMPA-
tBu2PhO)]OTf was dissolved in 5 mL THF and exposed to excess NO gas. The solution
immediately turned purple. The reaction was stirred under NO headspace for 30 minutes. Hexanes
was then added, and the product was allowed to precipitate at -33°C overnight. The solution was
filtered under inert atmosphere to give the title compound as a purple solid. Yield: 181 mg, 86%.
Single crystals suitable for x-ray diffraction were grown by slow diffusion of pentane into a
concentrated THF solution of 4. IR and UV-Visible spectra are shown in Figure 3.13.
Figure 3.13 (a) FT-IR spectra (KBr pellet) and (b) UV-Visible spectra (CH2Cl2, ~350 M) of 5 (red) and the
corresponding precursor (black).
[Fe(BMPA-NO2PhO)(OTf)]. Under inert atmosphere, 314 mg (0.90 mmol) BMPA-NO2PhOH
and 64 mg (0.91 mmol) potassium methoxide were combined in 5 mL of methanol. A solution of
351 mg (0.80 mmol) Fe(CH3CN)2(OTf)2 was added, causing the reaction to turn dark red. After 2
hours, the reaction was filtered and 40 mL of diethyl ether was added to the filtrate. The suspension
(a) (b)
2000 1800 1600 1400 1200 1000
% T
Energy / cm-1
[Fe(BMPA-tBu
2PhO)(OTf)]
+ NO (4)
1741
300 400 500 600 700 800 900 1000
0.0
0.2
0.4
0.6
0.8
1.0
Ab
sorb
ance
Wavelength / nm
[Fe(BMPA-tBu
2PhO)(OTf)]
+ NO (4)
529 nm
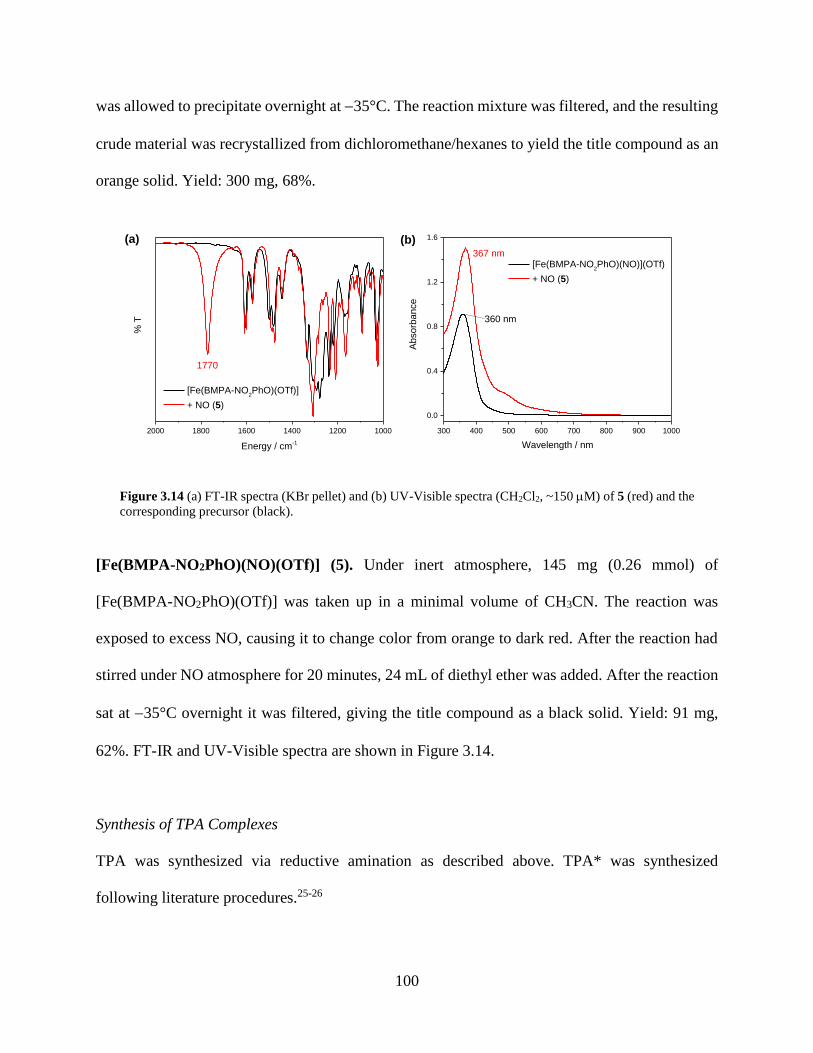
100
was allowed to precipitate overnight at 35°C. The reaction mixture was filtered, and the resulting
crude material was recrystallized from dichloromethane/hexanes to yield the title compound as an
orange solid. Yield: 300 mg, 68%.
Figure 3.14 (a) FT-IR spectra (KBr pellet) and (b) UV-Visible spectra (CH2Cl2, ~150 M) of 5 (red) and the
corresponding precursor (black).
[Fe(BMPA-NO2PhO)(NO)(OTf)] (5). Under inert atmosphere, 145 mg (0.26 mmol) of
[Fe(BMPA-NO2PhO)(OTf)] was taken up in a minimal volume of CH3CN. The reaction was
exposed to excess NO, causing it to change color from orange to dark red. After the reaction had
stirred under NO atmosphere for 20 minutes, 24 mL of diethyl ether was added. After the reaction
sat at 35°C overnight it was filtered, giving the title compound as a black solid. Yield: 91 mg,
62%. FT-IR and UV-Visible spectra are shown in Figure 3.14.
Synthesis of TPA Complexes
TPA was synthesized via reductive amination as described above. TPA* was synthesized
following literature procedures.25-26
(a) (b)
300 400 500 600 700 800 900 1000
0.0
0.4
0.8
1.2
1.6
Abso
rbance
Wavelength / nm
[Fe(BMPA-NO2PhO)(NO)](OTf)
+ NO (5)
360 nm
367 nm
2000 1800 1600 1400 1200 1000
% T
Energy / cm-1
[Fe(BMPA-NO2PhO)(OTf)]
+ NO (5)
1770
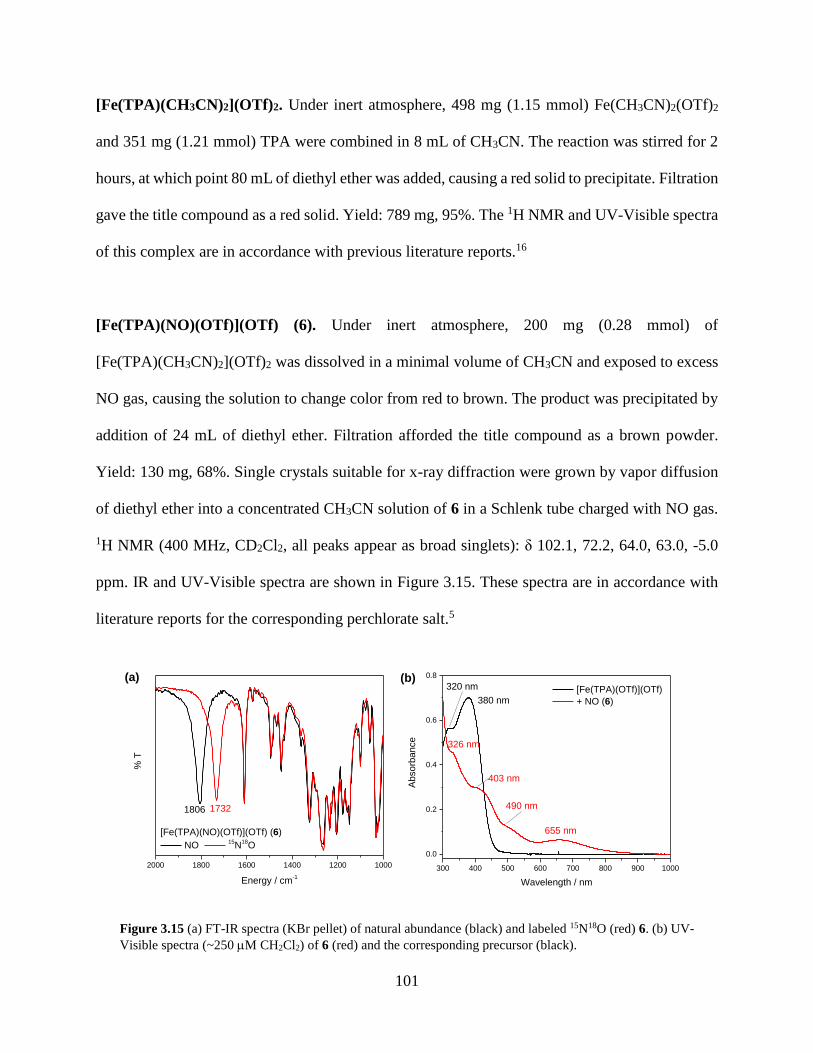
101
[Fe(TPA)(CH3CN)2](OTf)2. Under inert atmosphere, 498 mg (1.15 mmol) Fe(CH3CN)2(OTf)2
and 351 mg (1.21 mmol) TPA were combined in 8 mL of CH3CN. The reaction was stirred for 2
hours, at which point 80 mL of diethyl ether was added, causing a red solid to precipitate. Filtration
gave the title compound as a red solid. Yield: 789 mg, 95%. The 1H NMR and UV-Visible spectra
of this complex are in accordance with previous literature reports.16
[Fe(TPA)(NO)(OTf)](OTf) (6). Under inert atmosphere, 200 mg (0.28 mmol) of
[Fe(TPA)(CH3CN)2](OTf)2 was dissolved in a minimal volume of CH3CN and exposed to excess
NO gas, causing the solution to change color from red to brown. The product was precipitated by
addition of 24 mL of diethyl ether. Filtration afforded the title compound as a brown powder.
Yield: 130 mg, 68%. Single crystals suitable for x-ray diffraction were grown by vapor diffusion
of diethyl ether into a concentrated CH3CN solution of 6 in a Schlenk tube charged with NO gas.
1H NMR (400 MHz, CD2Cl2, all peaks appear as broad singlets): δ 102.1, 72.2, 64.0, 63.0, -5.0
ppm. IR and UV-Visible spectra are shown in Figure 3.15. These spectra are in accordance with
literature reports for the corresponding perchlorate salt.5
Figure 3.15 (a) FT-IR spectra (KBr pellet) of natural abundance (black) and labeled 15N18O (red) 6. (b) UV-
Visible spectra (~250 M CH2Cl2) of 6 (red) and the corresponding precursor (black).
2000 1800 1600 1400 1200 1000
1732
% T
Energy / cm-1
[Fe(TPA)(NO)(OTf)](OTf) (6)
NO 15
N18
O
1806
300 400 500 600 700 800 900 1000
0.0
0.2
0.4
0.6
0.8
Absorb
ance
Wavelength / nm
[Fe(TPA)(OTf)](OTf)
+ NO (6)380 nm
320 nm
326 nm
403 nm
490 nm
655 nm
(a) (b)
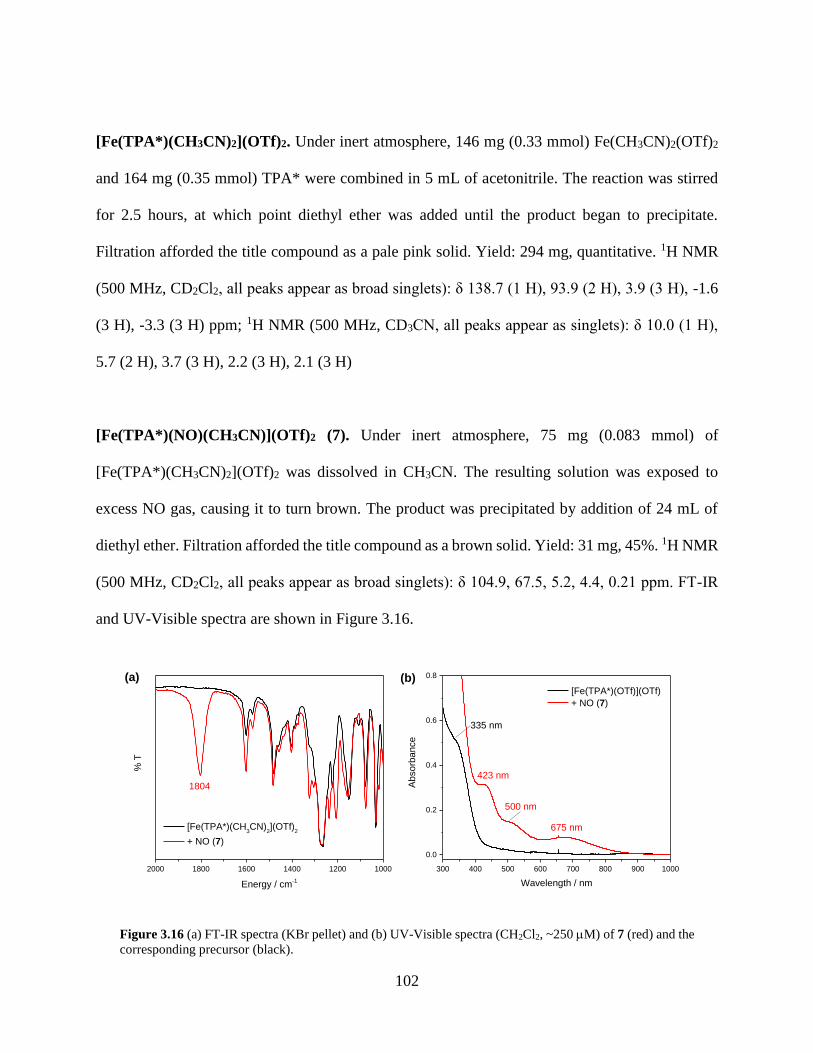
102
[Fe(TPA*)(CH3CN)2](OTf)2. Under inert atmosphere, 146 mg (0.33 mmol) Fe(CH3CN)2(OTf)2
and 164 mg (0.35 mmol) TPA* were combined in 5 mL of acetonitrile. The reaction was stirred
for 2.5 hours, at which point diethyl ether was added until the product began to precipitate.
Filtration afforded the title compound as a pale pink solid. Yield: 294 mg, quantitative. 1H NMR
(500 MHz, CD2Cl2, all peaks appear as broad singlets): δ 138.7 (1 H), 93.9 (2 H), 3.9 (3 H), -1.6
(3 H), -3.3 (3 H) ppm; 1H NMR (500 MHz, CD3CN, all peaks appear as singlets): δ 10.0 (1 H),
5.7 (2 H), 3.7 (3 H), 2.2 (3 H), 2.1 (3 H)
[Fe(TPA*)(NO)(CH3CN)](OTf)2 (7). Under inert atmosphere, 75 mg (0.083 mmol) of
[Fe(TPA*)(CH3CN)2](OTf)2 was dissolved in CH3CN. The resulting solution was exposed to
excess NO gas, causing it to turn brown. The product was precipitated by addition of 24 mL of
diethyl ether. Filtration afforded the title compound as a brown solid. Yield: 31 mg, 45%. 1H NMR
(500 MHz, CD2Cl2, all peaks appear as broad singlets): δ 104.9, 67.5, 5.2, 4.4, 0.21 ppm. FT-IR
and UV-Visible spectra are shown in Figure 3.16.
Figure 3.16 (a) FT-IR spectra (KBr pellet) and (b) UV-Visible spectra (CH2Cl2, ~250 M) of 7 (red) and the
corresponding precursor (black).
300 400 500 600 700 800 900 1000
0.0
0.2
0.4
0.6
0.8
Absorb
ance
Wavelength / nm
[Fe(TPA*)(OTf)](OTf)
+ NO (7)
675 nm
423 nm
500 nm
335 nm
2000 1800 1600 1400 1200 1000
% T
Energy / cm-1
[Fe(TPA*)(CH3CN)
2](OTf)
2
+ NO (7)
1804
(a) (b)

103
Synthesis of BPMP Complexes
H-BPMP, [Fe2(BPMP)(OPr)](OTf)2, and [Fe2(BPMP)(OPr)(NO)2](OTf)2 were all synthesized
following modified literature procedures.1,27-28
H-BPMP. In an oven-dried Schlenk flask under argon, 515.8 mg (2.59 mmol) of di-(2-
picolyl)amine and 0.5 mL (3.58 mmol) of triethylamine were combined in 10 mL of dry THF. The
flask was placed on ice, and a solution of 265.2 mg (1.29 mmol) of 2,6-bis(chloromethyl)-4-
methylphenol in 10 mL of THF was slowly added dropwise over approximately 1.5 hours. The
reaction was then heated to reflux. After approximately 3 hours, the reaction was cooled to room
temperature and filtered to remove the triethylammonium chloride byproduct. The filtrate was
rotavaped down to a yellow oil, which was recrystallized from dichloromethane/hexanes to afford
the title compound as a yellow powder. Yield: 546 mg, 80%. The 1H NMR of the product is in
accordance with previous reports for this ligand.1,27-28
[Fe2(BPMP)(OPr)](OTf)2. Under inert atmosphere, 104 mg (0.20 mmol) of H-BPMP and 14.6
mg (0.21 mmol) of potassium methoxide were combined in approximately 3 mL of methanol,
giving a yellow solution. A solution of 171 mg (0.40 mmol) of Fe(CH3CN)2(OTf)2 in 1 mL of
methanol was added. The reaction was stirred for approximately 5 minutes, and 18.8 mg (0.20
mmol) of sodium propionate in 0.5 mL methanol was slowly added. The resulting orange-yellow
solution was stirred for 1 hour. Approximately 70 mL of diethyl ether was added to the flask. The
product was precipitated by allowing the reaction to sit at 35°C overnight. The resulting crude
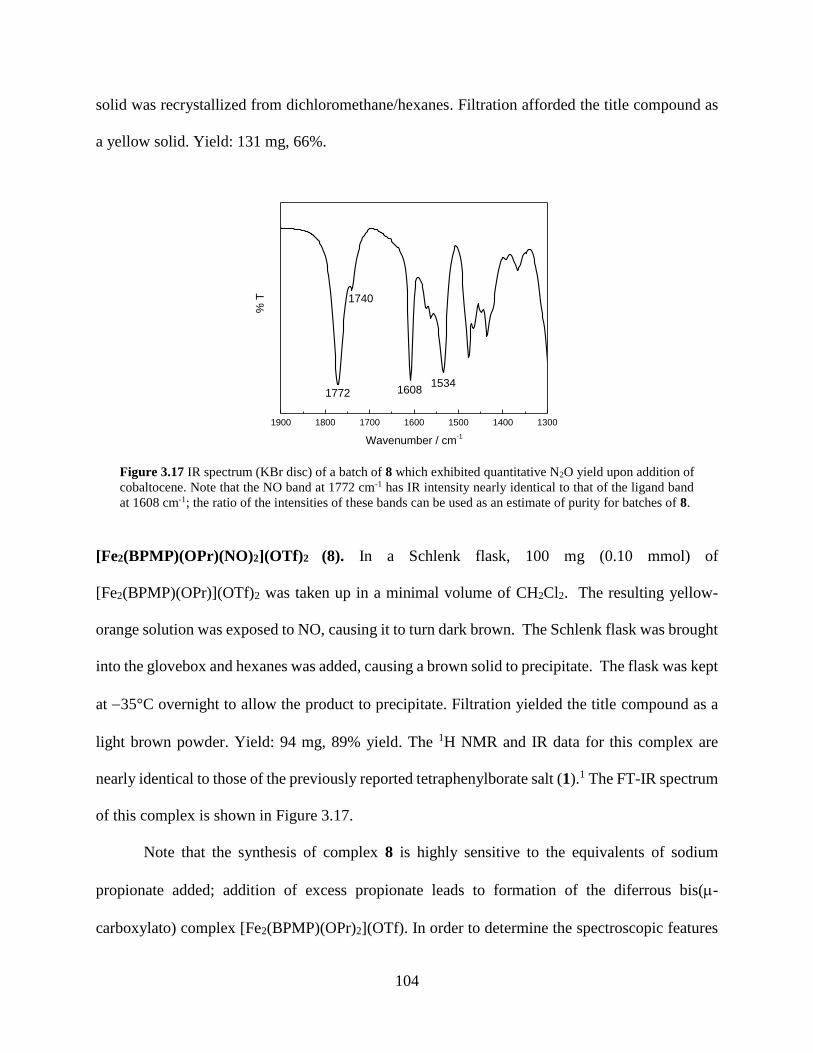
104
solid was recrystallized from dichloromethane/hexanes. Filtration afforded the title compound as
a yellow solid. Yield: 131 mg, 66%.
Figure 3.17 IR spectrum (KBr disc) of a batch of 8 which exhibited quantitative N2O yield upon addition of
cobaltocene. Note that the NO band at 1772 cm-1 has IR intensity nearly identical to that of the ligand band
at 1608 cm-1; the ratio of the intensities of these bands can be used as an estimate of purity for batches of 8.
[Fe2(BPMP)(OPr)(NO)2](OTf)2 (8). In a Schlenk flask, 100 mg (0.10 mmol) of
[Fe2(BPMP)(OPr)](OTf)2 was taken up in a minimal volume of CH2Cl2. The resulting yellow-
orange solution was exposed to NO, causing it to turn dark brown. The Schlenk flask was brought
into the glovebox and hexanes was added, causing a brown solid to precipitate. The flask was kept
at 35°C overnight to allow the product to precipitate. Filtration yielded the title compound as a
light brown powder. Yield: 94 mg, 89% yield. The 1H NMR and IR data for this complex are
nearly identical to those of the previously reported tetraphenylborate salt (1).1 The FT-IR spectrum
of this complex is shown in Figure 3.17.
Note that the synthesis of complex 8 is highly sensitive to the equivalents of sodium
propionate added; addition of excess propionate leads to formation of the diferrous bis(-
carboxylato) complex [Fe2(BPMP)(OPr)2](OTf). In order to determine the spectroscopic features
1900 1800 1700 1600 1500 1400 1300
% T
Wavenumber / cm-1
16081772
1740
1534

105
of the corresponding nitrosylated complex, this complex was independently synthesized and
exposed to NO gas.
[Fe2(BPMP)(OPr)2](OTf). Under inert atmosphere, 205 mg (0.39 mmol) H-BPMP and 27.7 mg
(0.40 mmol) potassium methoxide were combined in 3 mL of dry methanol. A solution of 327.3
mg (0.75 mmol) Fe(OTf)2•2 CH3CN in 2 mL of methanol was added. A solution of 104 mg (1.08
mmol) of sodium propionate was added, causing the solution to change color from yellow to
orange. The reaction was stirred for several hours, and diethyl ether was added to precipitate the
product. The resulting crude material was recrystallized from dichloromethane/hexanes to afford
316 mg (90% yield) of the title compound as an orange microcrystalline solid. All analytical data
are in accordance with literature reports for this species.28-30
Exposure of this compound to NO in CH3CN, followed by precipitation with diethyl ether
afforded a complex which, surprisingly, exhibits an N-O stretching frequency at 1768 cm-1, nearly
identical to that of 8 (albeit with a different morphology, see Figure 3.18), despite the presence of
an additional carboxylate ligand. (Note that the carboxylate stretching modes of 8 are shifted from
those of this complex, which suggests that these two complexes may have different primary
coordination spheres.) Importantly, this finding indicates that the presence of small amounts of the
nitrosylated bis(-carboxylato) complex cannot be detected by simple examination of the N-O
stretching region. Thus, in future studies it will be key to examine the reactivity of the bis(-
carboxylato) complex in order to determine what effect the presence of small amounts of this
complex could be expected to have on reactivity and N2O yield.
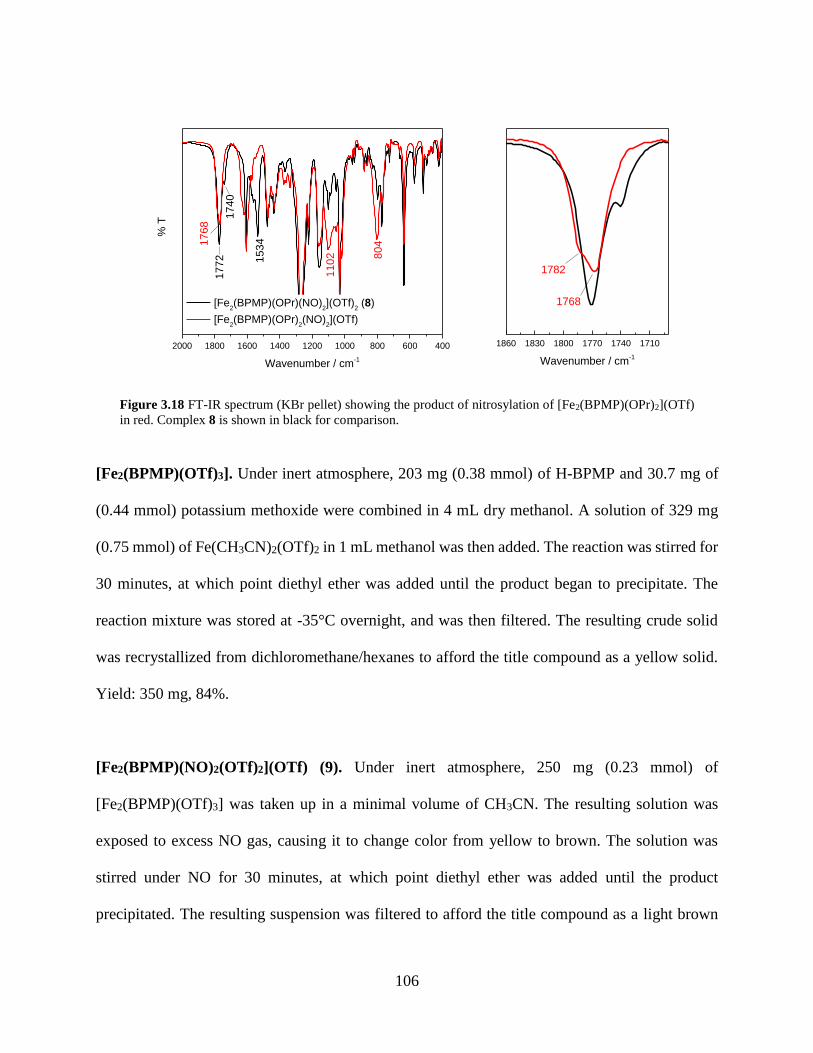
106
Figure 3.18 FT-IR spectrum (KBr pellet) showing the product of nitrosylation of [Fe2(BPMP)(OPr)2](OTf)
in red. Complex 8 is shown in black for comparison.
[Fe2(BPMP)(OTf)3]. Under inert atmosphere, 203 mg (0.38 mmol) of H-BPMP and 30.7 mg of
(0.44 mmol) potassium methoxide were combined in 4 mL dry methanol. A solution of 329 mg
(0.75 mmol) of Fe(CH3CN)2(OTf)2 in 1 mL methanol was then added. The reaction was stirred for
30 minutes, at which point diethyl ether was added until the product began to precipitate. The
reaction mixture was stored at -35°C overnight, and was then filtered. The resulting crude solid
was recrystallized from dichloromethane/hexanes to afford the title compound as a yellow solid.
Yield: 350 mg, 84%.
[Fe2(BPMP)(NO)2(OTf)2](OTf) (9). Under inert atmosphere, 250 mg (0.23 mmol) of
[Fe2(BPMP)(OTf)3] was taken up in a minimal volume of CH3CN. The resulting solution was
exposed to excess NO gas, causing it to change color from yellow to brown. The solution was
stirred under NO for 30 minutes, at which point diethyl ether was added until the product
precipitated. The resulting suspension was filtered to afford the title compound as a light brown
2000 1800 1600 1400 1200 1000 800 600 400
[Fe2(BPMP)(OPr)(NO)
2](OTf)
2 (8)
[Fe2(BPMP)(OPr)
2(NO)
2](OTf)
804
% T
Wavenumber / cm-1
110215341768
1772
1740
1860 1830 1800 1770 1740 1710
% T
Wavenumber / cm-1
1768
1782

107
solid. Yield: 155 mg, 57%. Single crystals suitable for x-ray diffraction were grown by vapor
diffusion of diethyl ether into a concentrated CH3CN solution of 9 in a Schlenk tube charged with
NO gas. The FT-IR spectrum of this complex is shown in Figure 3.19.
Figure 3.19 IR spectrum (KBr disc) of complex 9.
Physical Methods
N2O detection was performed as follows. A 25 mL round-bottom flask containing a nitrosyl
compound dissolved in CH2Cl2 was sealed with a rubber septum, and a solution of cobaltocene
was syringed into the flask. The total volume of CH2Cl2 was 3 mL. The solution was stirred for
the desired reaction time, and the gas headspace of the flask was then transferred to an evacuated
(~150 mtorr) Pike Technologies short-path HT gas IR cell with 100 mm path length equipped with
CaF2 windows. The IR signal for N2O gas was integrated between 2150 and 2275 cm-1. The
following relation was used to determine the amount of N2O produced:
mol N2O = 0.524 + 2.073*(area)
This relation was determined from a set of N2O standards generated by the breakdown of Piloty’s
acid under aqueous conditions as previously described.1 (Construction of the calibration curve was
2000 1800 1600 1400 1200 1000
17821608
% T
Wavenumber / cm-1
1800
108
performed by James Shanahan). The estimated error margins for this method of N2O detection are
±10%. All other spectroscopic data were obtained as described in Chapter 2.
3.5 References
(1) Zheng, S.; Berto, T. C.; Dahl, E. W.; Hoffman, M. B.; Speelman, A. L.; Lehnert, N. J. Am.
Chem. Soc. 2013, 135, 4902-4905.
(2) Pohl, K.; Wieghardt, K.; Nuber, B.; Weiss, J. J. Chem. Soc., Dalton Trans. 1987, 0, 187-192.
(3) Shepherd, R. E.; Sweetland, M. A.; Junker, D. E. J. Inorg. Biochem. 1997, 65, 1-14.
(4) Ray, M.; Golombek, A. P.; Hendrich, M. P.; Yap, G. P. A.; Liable-Sands, L. M.; Rheingold,
A. L.; Borovik, A. S. Inorg. Chem. 1999, 38, 3110-3115.
(5) Berto, T. C.; Hoffman, M. B.; Murata, Y.; Landenberger, K. B.; Alp, E. E.; Zhao, J.;
Lehnert, N. J. Am. Chem. Soc. 2011, 133, 16714-16717.
(6) Tonzetich, Z. J.; Héroguel, F.; Do, L. H.; Lippard, S. J. Inorg. Chem. 2011, 50, 1570-1579.
(7) Speelman, A. L.; Lehnert, N. Angew. Chem. Int. Ed. 2013, 52, 12283-12287.
(8) Hammes, B. S.; Ramos-Maldonado, D.; Yap, G. P. A.; Liable-Sands, L.; Rheingold, A. L.;
Young, V. G.; Borovik, A. S. Inorg. Chem. 1997, 36, 3210-3211.
(9) Li, J.; Banerjee, A.; Pawlak, P. L.; Brennessel, W. W.; Chavez, F. A. Inorg. Chem. 2014, 53,
5414-5416.
(10) Chiou, Y.-M.; Que, L. Inorg. Chem. 1995, 34, 3270-3278.
(11) McQuilken, A. C.; Ha, Y.; Sutherlin, K. D.; Siegler, M. A.; Hodgson, K. O.; Hedman, B.;
Solomon, E. I.; Jameson, G. N. L.; Goldberg, D. P. J. Am. Chem. Soc. 2013, 135, 14024-14027.
(12) McQuilken, A. C.; Matsumura, H.; Dürr, M.; Confer, A. M.; Sheckelton, J. P.; Siegler, M.
A.; McQueen, T. M.; Ivanović-Burmazović, I.; Moënne-Loccoz, P.; Goldberg, D. P. J. Am.
Chem. Soc. 2016, 138, 3107-3117.
(13) Goodrich, L. E.; Paulat, F.; Praneeth, V. K. K.; Lehnert, N. Inorg. Chem. 2010, 49, 6293-
6316.
(14) Berto, T. C.; Speelman, A. L.; Zheng, S.; Lehnert, N. Coord. Chem. Rev. 2013, 257, 244-
259.
(15) Lehnert, N.; Scheidt, W. R.; Wolf, M. W. Struct. Bond. 2014, 154, 155-223.
109
(16) Diebold, A.; Hagen, K. S. Inorg. Chem. 1998, 37, 215-223.
(17) Pulukkody, R.; Kyran, S. J.; Drummond, M. J.; Hsieh, C.-H.; Darensbourg, D. J.;
Darensbourg, M. Y. Chem. Sci. 2014, 5, 3795-3802.
(18) Bartberger, M. D.; Liu, W.; Ford, E.; Miranda, K. M.; Switzer, C.; Fukuto, J. M.; Farmer,
P. J.; Wink, D. A.; Houk, K. N. Proc. Natl. Acad. Sci. USA 2002, 99, 10958-10963.
(19) Connelly, N. G.; Geiger, W. E. Chem. Rev. 1996, 96, 877-910.
(20) Tran, C. T.; Skodje, K. M.; Kim, E. Prog. Inorg. Chem. 2014, 59, 339-380.
(21) Berto, T. C. "Synthetic, Spectroscopic, and Theoretical Investigations into the Interactions
and Detoxification of Nitric Oxide in Biology" Ph.D. Thesis, University of Michigan, Ann
Arbor, MI, 2012.
(22) Hagen, K. S. Inorg. Chem. 2000, 39, 5867-5869.
(23) Abdel-Magid, A. F.; Carson, K. G.; Harris, B. D.; Maryanoff, C. A.; Shah, R. D. J. Org.
Chem. 1996, 61, 3849-3862.
(24) Nishida, Y.; Shimo, H.; Kida, S. J. Chem. Soc., Chem. Commun. 1984, 1611-1612.
(25) Rasberry, R. D.; Smith, M. D.; Shimizu, K. D. Org. Lett. 2008, 10, 2889-2892.
(26) Schröder, K.; Mathers, R. T.; Buback, J.; Konkolewicz, D.; Magenau, A. J. D.;
Matyjaszewski, K. ACS Macro Lett. 2012, 1, 1037-1040.
(27) Suzuki, M.; Kanatomi, H.; Murase, I. Chem. Lett. 1981, 10, 1745-1748.
(28) Borovik, A. S.; Papaefthymiou, V.; Taylor, L. F.; Anderson, O. P.; Que, L. J. Am. Chem.
Soc. 1989, 111, 6183-6195.
(29) Borovik, A. S.; Hendrich, M. P.; Holman, T. R.; Munck, E.; Papaefthymiou, V.; Que, L. J.
Am. Chem. Soc. 1990, 112, 6031-6038.
(30) Borovik, A. S.; Que, L. J. Am. Chem. Soc. 1988, 110, 2345-2347.

110
Chapter 4
Synthesis and Electronic Structure of Dinitrosyl Iron Complexes
In biological systems, dinitrosyl iron complexes (DNICs) are, along with nitrosothiols, the
most common cellular NO-containing species, and are considered a major pool for NO in
mammals.1-2 The most well-known DNICs in biological systems contain thiolate ligation and are
formed via NO-induced breakdown of iron-sulfur clusters or by interaction of NO with the cellular
labile iron pool. Additionally, DNICs with histidine ligation have been proposed to form in
biological systems, for example the ferric uptake regulation protein (Fur)3, mitochondrial
aconitase4, serum albumin5, and ferritin.6 Based on model complex studies, DNICs with histidine
ligands have also been suggested as potential products of NO-induced degradation of Reiske
centers.7
Among mononuclear DNICs, both the {Fe(NO)2}9 and {Fe(NO)2}
10 redox states are
commonly encountered. The spectroscopic parameters of mononuclear DNICs have recently been
reviewed and will be discussed only briefly here.8-10 It is known from EPR spectroscopy that
{Fe(NO)2}9 DNICs are paramagnetic with total spin S = 1/2, whereas NMR studies have shown
that {Fe(NO)2}10 DNICs are diamagnetic.1,8 However, thorough studies of the differences in the
electronic structures of the two forms of DNICs are challenging, because mononuclear complexes
that are stable in both redox states are relatively uncommon. The most well-characterized
{Fe(NO)2}9/10 system is [Fe(ar-nacnac)(NO)2]
0/1, which employs a -diketiminate co-ligand,

111
reported by Lippard and co-workers.7 In this case, both the {Fe(NO)2}9 and {Fe(NO)2}
10
complexes were characterized by X-ray crystallography and Mössbauer spectroscopy. By
comparing DFT-predicted Mössbauer parameters to experiment, Ye and Neese obtained detailed
descriptions of the electronic structures of these compounds.11 Their calculations indicate that the
reduction of the {Fe(NO)2}9 complex is iron-centered, and that -backbonding is significantly
enhanced in the {Fe(NO)2}10 as compared to the {Fe(NO)2}
9 species. However, this claim is
difficult to prove experimentally. In particular, since Mössbauer spectroscopy probes only the
electron density of the iron nucleus, this method is only an indirect reporter of the bonding in the
Fe(NO)2 unit, and hence, limits the ability to accurately calibrate DFT calculations. For example,
the differences in the Mössbauer isomer shifts of the [Fe(ar-nacnac)(NO)2]0/1 complexes are
relatively minor ( = 0.19 mm/s for the {Fe(NO)2}9 and = 0.22 mm/s for the {Fe(NO)2}
10
complex). Therefore, it is desirable to further investigate the electronic structures of the two DNIC
oxidation states using an alternative spectroscopic method that is more sensitive to changes in iron-
NO bonding.
Vibrational spectroscopy is a useful tool to examine differences in Fe-NO bonding, since
Fe-N(O) stretching and Fe-N-O bending vibrations are much more directly correlated to the Fe-
NO interactions as compared to Mössbauer isomer shifts. Although Raman studies have been used
to examine DNICs,12-13 Raman spectroscopy is limited by optical selection rules. In addition,
metal-nitrosyl complexes often photodecompose under laser irradiation. In contrast, 57Fe nuclear
resonance vibrational spectroscopy (NRVS) provides a complete set of vibrations involving the
iron nucleus, and does not have any optical selection rules. Instead, the intensity of NRVS features
scales with the amount of iron displacement in a given vibrational mode.14-15 (Note that this
technique is also referred to as nuclear inelastic scattering (NIS) and nuclear resonant inelastic

112
scattering (NRIXS) in the literature.) Previous studies have shown that NRVS can be used to
distinguish between different forms of DNICs.16-17 However, there are no NRVS studies reported
for an {Fe(NO)2}9/10 pair examining the differences in the vibrational spectra of these complexes
and correlating their vibrational spectra to electronic structure.
Here, we report the spectroscopic and structural characterization of the stable {Fe(NO)2}9
DNIC [Fe(dmp)(NO)2](OTf) (1, dmp = 2,9-dimethyl-1,10-phenanthroline). This compound is
synthesized from a ferrous dmp species via an unusual pathway involving disproportionation of a
transiently formed {FeNO}7 complex. The {Fe(NO)2}9 DNIC can be chemically reduced to yield
the corresponding {Fe(NO)2}10 species [Fe(dmp)(NO)2] (2), allowing us to perform a detailed
characterization of these analogous DNICs in two oxidation states. In particular, the Mössbauer
and NRVS spectra of the dmp DNIC in both redox levels are compared and correlated to DFT
calculations. Taken together, these results provide direct experimental support for previous
proposals that the reduction of {Fe(NO)2}9 species to the {Fe(NO)2}
10 redox level is (1) primarily
iron centered and (2) leads to a significant increase in -backbonding.
This chapter is adapted from a submitted manuscript: Speelman, A.L.; Zhang, B.; Silakov,
A.; Skodje, K.M.; Alp, E.E.; Zhao, J.; Hu, M.Y.; Kim, E.; Krebs, C.; Lehnert. N. “An Unusual
Synthetic Pathway for an {Fe(NO)2}9 Dinitrosyl Iron Complex (DNIC) and Insight into DNIC
Electronic Structure via Nuclear Resonance Vibrational Spectroscopy”. The Mössbauer studies
described in Section 4.3 were performed by Dr. Bo Zhang and Prof. Carsten Krebs (Pennsylvania
State University). Dr. Alexey Silakov (Pennsylvania State University) is also acknowledged for
performing 57Fe ENDOR experiments on complex 1 that will not be discussed in this thesis. The
TMEDA complexes in Section 4.4 were synthesized by Kelsey Skodje from the lab of Prof.
Eunsuk Kim (Brown University).

113
4.1 Generation and Spectroscopic Characterization of the dmp {Fe(NO)2}9 DNIC
Upon exposure of a methanol solution of iron(II) triflate and dmp to excess NO gas, a color
change from yellow to brown is observed, corresponding to the appearance of broad absorption
features at ~ 450 nm, 666 nm, and 1062 nm (Figure 4.1a). Analysis of the reaction products using
EPR and IR spectroscopy as well as X-ray crystallography indicates formation of the cationic
{Fe(NO)2}9 DNIC [Fe(dmp)(NO)2](OTf) (1). (The mechanism of DNIC formation will be further
discussed in Section 4.2.) The IR spectrum of complex 1 in the solid state exhibits antisymmetric
and symmetric NO stretching frequencies, respectively, at 1746 cm-1 and 1840 cm-1, which are
similar to those for other reported cationic {Fe(NO)2}9 DNICs (Table 4.1). Additionally, the EPR
spectra of monomeric {Fe(NO)2}9 DNICs exhibit a characteristic S = 1/2 signal centered at g =
2.03.8 Accordingly, 1 exhibits a rhombic S = 1/2 EPR spectrum in frozen methanol solution at
liquid nitrogen temperature (Figure 4.1b).
Figure 4.1 (a) UV-Visible spectrum of a 10 mM solution of [Fe(dmp)2](OTf)2 (3) before and after exposure
to NOg in methanol. (Inset: 2 mM solution at t = 2 hr.) (b) EPR spectrum of 1 recorded at 77 K in frozen
methanol solution.
The {Fe(NO)2}10 form of this DNIC, [Fe(dmp)(NO)2] (2), was previously reported18, with
an {Fe(NO)2}9/10 redox couple of 0.402 V vs ferrocene. In order to further confirm that 1 is the
300 310 320 330 340 350
g = 2.003
g = 2.045
De
rivative
EP
R I
nte
nsity
B (mT)
g = 2.075
500 600 700 800 900 1000 1100
0.0
0.5
1.0
1.5
2.0
400 500 600 700 800 900 1000 1100
0.0
0.5
1.0
1.5
Abs.
Wavelength (nm)
Ab
s
Wavelength (nm)
Initial
t = 1 hr
t = 2 hr
t = 3 hr
666 1062
(a) (b)

114
one-electron oxidized form of 2, 1 was reduced with cobaltocene. Upon reduction in CH2Cl2
solution, the NO stretches shift from 1765 cm-1 and 1835 cm-1 in 1 to 1637 cm-1 and 1692 cm-1,
respectively, in 2 (Figure 4.2). Precipitation yielded a species which exhibits NO stretches at 1628
and 1692 cm-1 in the solid state which are identical to those reported for 2.
Figure 4.2 Solution IR spectrum of {Fe(NO)2}9 DNIC 1 before (black) and after (red) addition of cobaltocene
in CH2Cl2, leading to formation of {Fe(NO)2}10 DNIC 2.
Interestingly, 1 exhibits long-term solution stability as demonstrated by its solution IR
spectrum which shows minimal changes, even after stirring for 48 hours in CH3CN at room
temperature. In contrast, other reported four-coordinate {Fe(NO)2}9 complexes with neutral N-
donor ligands are unstable in solution. For example, [Fe(sparteine)(NO)2]+ decomposes
spontaneously over 5 hours in solution.19 [Fe(TMEDA)(NO)2]+ loses NO rapidly in solution,
although an {Fe(NO)2}9 intermediate can be observed spectroscopically upon either oxidation of
the corresponding {Fe(NO)2}10 species or halide abstraction from the (stable) five-coordinate
{Fe(NO)2}9 iodo complex, [Fe(TMEDA)(I)(NO)2].
20 DNICs with NHC coordination also lose
NO slowly in solution.21 Li and co-workers also reported transient formation of the {Fe(NO)2}9
2000 1900 1800 1700 1600 1500
0.0
0.2
0.4
0.6
0.8
1637
Abs
Wavenumber / cm-1
{Fe(NO)2}9 1
{Fe(NO)2}10
2
1835
1765
1692
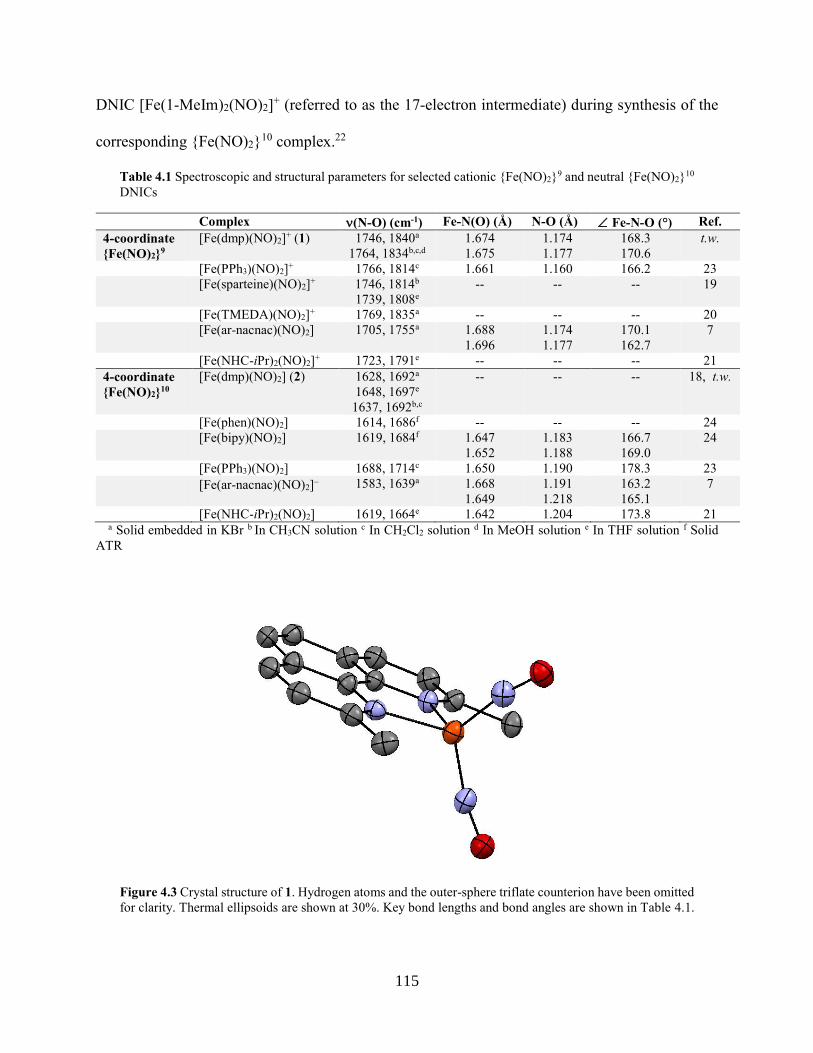
115
DNIC [Fe(1-MeIm)2(NO)2]+ (referred to as the 17-electron intermediate) during synthesis of the
corresponding {Fe(NO)2}10 complex.22
Table 4.1 Spectroscopic and structural parameters for selected cationic {Fe(NO)2}9 and neutral {Fe(NO)2}10
DNICs
Complex (N-O) (cm-1) Fe-N(O) (Å) N-O (Å) Fe-N-O (°) Ref.
4-coordinate
{Fe(NO)2}9
[Fe(dmp)(NO)2]+ (1) 1746, 1840a
1764, 1834b,c,d
1.674
1.675
1.174
1.177
168.3
170.6
t.w.
[Fe(PPh3)(NO)2]+ 1766, 1814c 1.661 1.160 166.2 23
[Fe(sparteine)(NO)2]+ 1746, 1814b
1739, 1808e
-- -- -- 19
[Fe(TMEDA)(NO)2]+ 1769, 1835a -- -- -- 20
[Fe(ar-nacnac)(NO)2] 1705, 1755a 1.688
1.696
1.174
1.177
170.1
162.7
7
[Fe(NHC-iPr)2(NO)2]+ 1723, 1791e -- -- -- 21
4-coordinate
{Fe(NO)2}10
[Fe(dmp)(NO)2] (2) 1628, 1692a
1648, 1697e
1637, 1692b,c
-- -- -- 18, t.w.
[Fe(phen)(NO)2] 1614, 1686f -- -- -- 24
[Fe(bipy)(NO)2] 1619, 1684f 1.647
1.652
1.183
1.188
166.7
169.0
24
[Fe(PPh3)(NO)2] 1688, 1714c 1.650 1.190 178.3 23
[Fe(ar-nacnac)(NO)2] 1583, 1639a 1.668
1.649
1.191
1.218
163.2
165.1
7
[Fe(NHC-iPr)2(NO)2] 1619, 1664e 1.642 1.204 173.8 21 a Solid embedded in KBr b In CH3CN solution c In CH2Cl2 solution d In MeOH solution e In THF solution f Solid
ATR
Figure 4.3 Crystal structure of 1. Hydrogen atoms and the outer-sphere triflate counterion have been omitted
for clarity. Thermal ellipsoids are shown at 30%. Key bond lengths and bond angles are shown in Table 4.1.

116
Due to the high solution stability of 1, the complex can be crystallized from methanol
solution (Figure 4.3). This is the first example of a crystal structure of a four-coordinate cationic
{Fe(NO)2}9 DNIC with a neutral N-donor ligand. The complex displays nearly ideal C2v symmetry
with an average Fe-N(O) bond length of 1.675 Å and an average N-O bond length of 1.176 Å. The
Fe-N-O units are slightly bent with an average Fe-N-O of 169.5 °, and are in an “attracto”
conformation where the nitrosyl units are bent toward each other25 with N-Fe-N of 116.3° and
O-Fe-O of 107.6°. These metric parameters are generally similar to those of other four-
coordinate {Fe(NO)2}9 DNICs (Table 4.1). Although the structure of 2 is not available, the closely
related complex [Fe(bipy)(NO)2], which has very similar vibrational properties, can be examined
as a structural analog of 2. Complex 1 shows a slightly increased average Fe-N(O) bond length
and a slightly decreased average N-O bond length as compared to [Fe(bipy)(NO)2]; this trend is
consistent with that reported for the [Fe(Ar-nacnac)(NO)2]-1/0 and [Fe(PPh3)2(NO)2]
+/0 systems.7,23
4.2 Mechanism of DNIC Formation
Neutral monomeric {Fe(NO)2}10 DNICs that contain neutral coligands are typically
synthesized via substitution of the carbonyl ligands in [Fe(NO)2(CO)2] as shown in Scheme 4.1,
although other synthetic pathways exist.8 The typical co-ligands in these systems are N-donors
(e.g. imidazole, pyridine, amine), N-heterocyclic carbenes (NHCs), and phosphines. The one-
electron oxidized, cationic {Fe(NO)2}9 forms of these DNICs can be generated by oxidation of the
corresponding {Fe(NO)2}10 complexes with reagents such as nitrosonium and ferrocenium salts.
However, these cationic {Fe(NO)2}9 DNICs are often unstable, typically due to facile NO loss, as
discussed above.

117
Scheme 4.1 Typical synthetic pathway for neutral {Fe(NO)2}9 and {Fe(NO)2}10 DNICs from iron dicarbonyl
dinitrosyl.
Importantly, cationic {Fe(NO)2}9 DNICs are usually not generated directly from ferrous
precursors. However, the formation of an {Fe(NO)2}9 DNIC from a ferrous precursor has been
reported for anionic tetrathiolate complexes.26-28 In these systems, the ferrous compound
undergoes ligand substitution of RS for NO to yield an {FeNO}7 complex. Binding of the second
equivalent of NO is accompanied by formation of 0.5 equivalents of disulfide, yielding an anionic
bis-thiolato {Fe(NO)2}9 DNIC as shown in Scheme 4.2.
Scheme 4.2 Mechanism of {Fe(NO)2}9 DNIC formation from ferrous tetrathiolate complexes
Direct formation of an {Fe(NO)2}9 DNIC from a ferrous precursor with neutral N-donor ligands
is uncommon since these complexes cannot reductively eliminate ligands. Instead, the additional
electron required to form an {Fe(NO)2}9 species from a ferrous precursor would have to come
from an external reductant. For example, the reaction could proceed via a reductive nitrosylation
pathway, which would require reduction of an {FeNO}7 or an {Fe(NO)2}8 complex by NO. We
consider direct reduction of an {FeNO}7 species by NO unlikely since the reduction of {FeNO}7
complexes typically occurs at negative redox potentials29 and NO gas is a weak reductant
(E(NO/NO+) = +870 mV vs ferrocene in acetonitrile). We also consider formation of a DNIC via
an {Fe(NO)2}8 intermediate unlikely since this type of DNIC has been only rarely observed.30-32

118
Note that a reductive nitrosylation pathway was proposed in the formation of a DNIC in the ferric
uptake regulation protein (Fur) based on the stoichiometry of approximately 3 molecules of NO
consumed per {Fe(NO)2}9 DNIC formed, starting from the ferrous state.3 In this case, however,
the exact identity of the DNIC is unknown and the mechanism of DNIC formation was not
determined.
Alternatively, DNIC formation could proceed via disproportionation. For example, Que
and co-workers reported that upon exposure of ferrous 6-Me3TPA (tris[(6-
methyl)pyridylmethyl]amine) complexes with a monoprotonated catecholate co-ligand to NO, the
isolated products were an {Fe(NO)2}9 DNIC and a ferric catecholate complex, which were formed
via disproportionation of a metastable {FeNO}7 intermediate33:
2 [Fe(6-Me3TPA)(CatH)(NO)]+ [Fe(6-Me3TPA)(NO)2]+ + [Fe(6-Me3TPA)(Cat)]+ + CatH2
A similar equilibrium between an {FeNO}7 complex and a ferric species and an
{Fe(NO)2}9 DNIC was proposed for [Fe(Ar-nacnac)(NO)(Br)]. In this case, mixtures of the a ferric
compound and DNIC led to formation of {FeNO}7, indicating that the equilibrium lies almost
entirely toward the {FeNO}7 complex.34 Given the similar types of nitrogen donors in 6-Me3TPA
and dmp, these results suggest that {Fe(NO)2}9 formation with the ferrous dmp complex could
follow a mechanistic pathway similar to that proposed for the 6-Me3TPA complex.
In order to determine whether this is indeed the case, we first began by characterizing the
ferrous dmp precursor [Fe(dmp)2(OTf)2] (3). Although we were unable to grow high-quality
crystals, we have obtained preliminary crystallographic data which reveal a five-coordinate bis-
dmp compound with a single triflate counterion bound in a highly distorted trigonal bipyramidal
geometry (τ = 0.63, see Figure 4.4). The triflate counterion is not bound in solution at room
temperature, as evidenced by the 19F NMR signal in CD3OD, which shows a single peak at -78
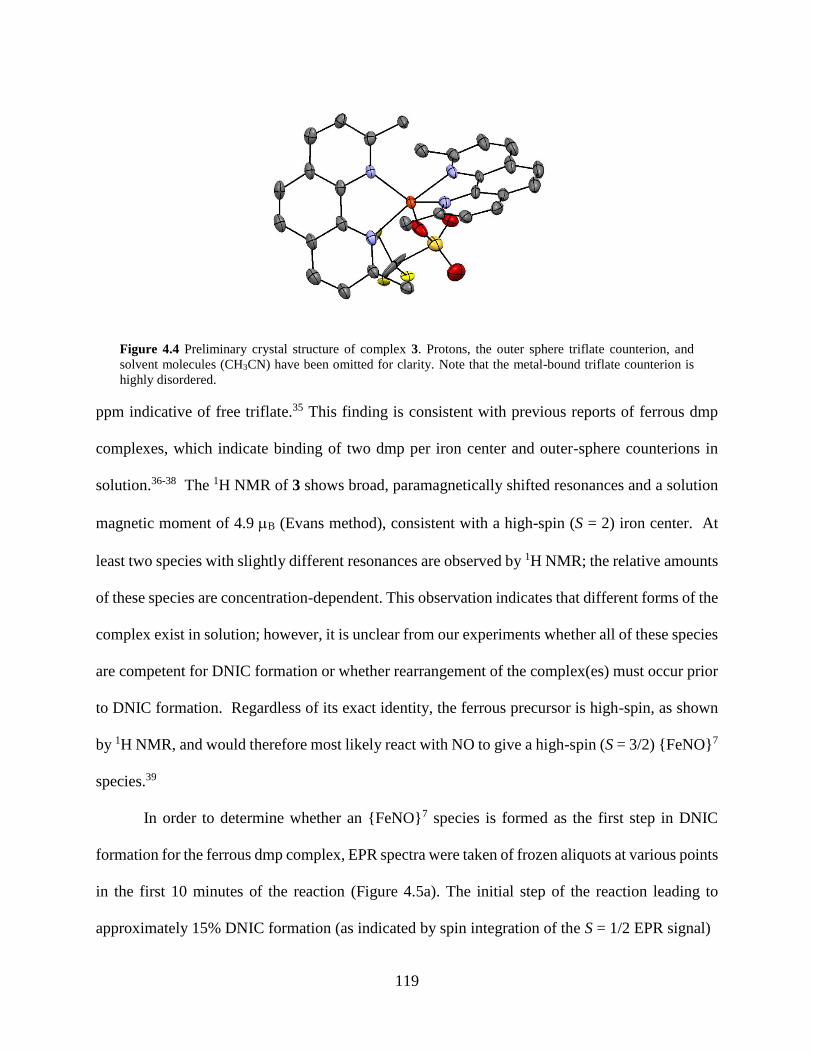
119
Figure 4.4 Preliminary crystal structure of complex 3. Protons, the outer sphere triflate counterion, and
solvent molecules (CH3CN) have been omitted for clarity. Note that the metal-bound triflate counterion is
highly disordered.
ppm indicative of free triflate.35 This finding is consistent with previous reports of ferrous dmp
complexes, which indicate binding of two dmp per iron center and outer-sphere counterions in
solution.36-38 The 1H NMR of 3 shows broad, paramagnetically shifted resonances and a solution
magnetic moment of 4.9 B (Evans method), consistent with a high-spin (S = 2) iron center. At
least two species with slightly different resonances are observed by 1H NMR; the relative amounts
of these species are concentration-dependent. This observation indicates that different forms of the
complex exist in solution; however, it is unclear from our experiments whether all of these species
are competent for DNIC formation or whether rearrangement of the complex(es) must occur prior
to DNIC formation. Regardless of its exact identity, the ferrous precursor is high-spin, as shown
by 1H NMR, and would therefore most likely react with NO to give a high-spin (S = 3/2) {FeNO}7
species.39
In order to determine whether an {FeNO}7 species is formed as the first step in DNIC
formation for the ferrous dmp complex, EPR spectra were taken of frozen aliquots at various points
in the first 10 minutes of the reaction (Figure 4.5a). The initial step of the reaction leading to
approximately 15% DNIC formation (as indicated by spin integration of the S = 1/2 EPR signal)

120
Figure 4.5 (a) EPR spectra (recorded at 4.2 K) of freeze-quenched aliquots of a solution of 10 mM
[Fe(dmp)2(OTf)2] in methanol after exposure to excess NO gas at room temperature. (b) EPR spectra
(recorded at 4.2 K) of freeze-quenched aliquots of a solution of 5 mM [Fe(dmp)2(OTf)2] in methanol after
exposure to excess NO gas at 80°C for 10 minutes (black) and after warming of the same solution to room
temperature (red) over 20 minutes. A reaction run for 30 minutes at room temperature is shown for
comparison (blue). The sharp signal at g = 1.98 (indicated by the asterisk) arises from a ferric product in the
reaction mixture.
occurs in less than 3 minutes at room temperature. The EPR spectra also reveal a small S = 3/2
signal (comprising less than 5% of the iron in solution) characteristic of a monomeric high-spin
{FeNO}7 complex.40 Since the EPR data suggest that DNIC formation proceeds rapidly at room
temperature, the reaction was run at 80°C in order determine whether {FeNO}7 formation
precedes DNIC formation. Freeze-quenched aliquots of the reaction mixture reveal a clean signal
for the {FeNO}7 species (Figure 4.5b) which disappears upon warming to room temperature;
however, we were unable to isolate the {FeNO}7 intermediate at low temperature, likely due to its
propensity to lose NO upon warming, even in the solid state.
The second phase of DNIC formation occurs on a longer time scale, and is conveniently
monitored by solution IR, following the appearance of the characteristic DNIC N-O stretching
bands at 1834 cm-1 and 1764 cm-1 (see Figure 4.6). The reaction can also be followed by EPR
spectroscopy (see Figure 4.7) but, due to the presence of other S = 1/2 species in the reaction
100 150 200 250 300 350 400
g = 2.04
g = 2.01
g = 2.07
B (mT)
1 min
3 min
5 min
7 min
g = 3.96
100 150 200 250 300 350 400 450
B (mT)
At -80°C
Warmed to room temperature
Reaction run at room temperature
*
(a) (b)

121
Figure 4.6 Fit of integrated IR intensity over time following exposure of a 10 mM solution of
[Fe(dmp)2(OTf)2] to excess NO gas. The data are fit to a single exponential function with k = 1.7*10-4 s-1.
The raw IR data are shown in the inset.
Figure 4.7 (a) EPR spectra (recorded at 4.2 K; showing only the g = 2 region) of freeze-quenched aliquots
of a solution of 10 mM 3 in methanol after exposure to excess NO gas. (b) Integrated EPR intensity over
time. The data are fit to a single exponential function with k = 8.0*10-5 s-1.
mixture and/or freezing artifacts (for example, aggregation), the time dependence of the EPR
signal shows more scattering than the solution IR data. The second phase of the reaction shows a
dependence on the concentration of iron initially present in solution, where the reaction proceeds
0 100 200 300 400
14
16
18
20
22
24
26
28
1900 1850 1800 1750 1700
0.0
0.2
0.4
0.6
0.8
1.0
Abso
rbance
Energy (cm-1)
Inte
gra
ted I
R I
nte
nsity
Time (min)
300 320 340 360
B (mT)
t = 20 min
t = 40 min
t = 1 hr
t = 1 hr 30 min
t = 2 hr
t = 2 hr 30 min
t = 3 hr
t = 4 hr
t = 5 hr
t = 6 hr
t = 7 hr
0 100 200 300 400
20
30
40
50
60
70
80
% Y
ield
of S
= 1
/2 S
pe
cie
s
Time (min)
(a) (b)
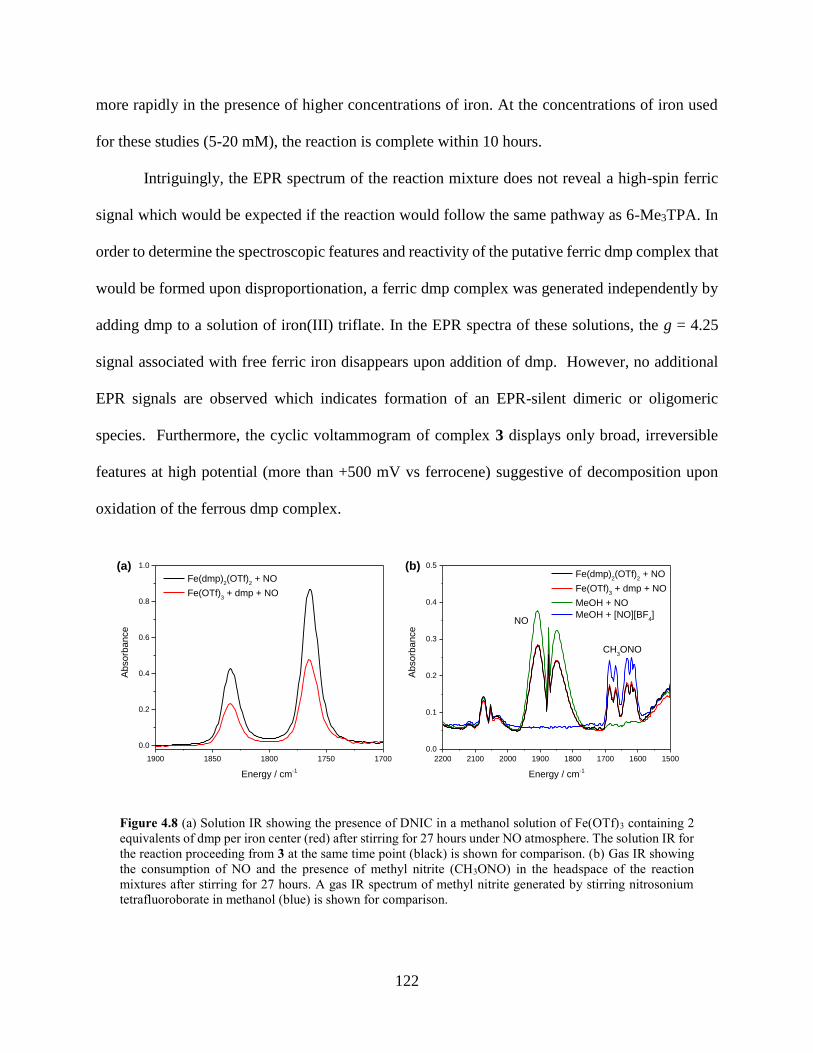
122
more rapidly in the presence of higher concentrations of iron. At the concentrations of iron used
for these studies (5-20 mM), the reaction is complete within 10 hours.
Intriguingly, the EPR spectrum of the reaction mixture does not reveal a high-spin ferric
signal which would be expected if the reaction would follow the same pathway as 6-Me3TPA. In
order to determine the spectroscopic features and reactivity of the putative ferric dmp complex that
would be formed upon disproportionation, a ferric dmp complex was generated independently by
adding dmp to a solution of iron(III) triflate. In the EPR spectra of these solutions, the g = 4.25
signal associated with free ferric iron disappears upon addition of dmp. However, no additional
EPR signals are observed which indicates formation of an EPR-silent dimeric or oligomeric
species. Furthermore, the cyclic voltammogram of complex 3 displays only broad, irreversible
features at high potential (more than +500 mV vs ferrocene) suggestive of decomposition upon
oxidation of the ferrous dmp complex.
Figure 4.8 (a) Solution IR showing the presence of DNIC in a methanol solution of Fe(OTf)3 containing 2
equivalents of dmp per iron center (red) after stirring for 27 hours under NO atmosphere. The solution IR for
the reaction proceeding from 3 at the same time point (black) is shown for comparison. (b) Gas IR showing
the consumption of NO and the presence of methyl nitrite (CH3ONO) in the headspace of the reaction
mixtures after stirring for 27 hours. A gas IR spectrum of methyl nitrite generated by stirring nitrosonium
tetrafluoroborate in methanol (blue) is shown for comparison.
2200 2100 2000 1900 1800 1700 1600 1500
0.0
0.1
0.2
0.3
0.4
0.5
Fe(dmp)2(OTf)
2 + NO
Fe(OTf)3 + dmp + NO
MeOH + NO
MeOH + [NO][BF4]
CH3ONO
Abso
rbance
Energy / cm-1
NO
1900 1850 1800 1750 1700
0.0
0.2
0.4
0.6
0.8
1.0
Abso
rbance
Energy / cm-1
Fe(dmp)2(OTf)
2 + NO
Fe(OTf)3 + dmp + NO
(a) (b)

123
This high oxidation potential implies that a ferric complex formed during the
disproportionation should be able to oxidize NOg and re-form a ferrous species. Accordingly,
exposure of a methanol solution of iron(III) triflate in the presence of dmp to NO results in DNIC
formation and release of methyl nitrite, which is the product formed by the reaction of nitrosonium
(NO+) with methanol (Figure 4.8). Methyl nitrite is also produced when 3 is stirred under NO
atmosphere, which implies formation of a species that is reduced by NO gas. The final amount of
DNIC observed in the reactions that start from ferric iron is lower than that observed for the
reaction proceeding from ferrous iron, presumably due to formation of an unreactive (likely ferric)
byproduct. However, this finding supports our mechanistic conclusion that the ferric dmp species
is further reactive towards NO, and can re-enter the reaction via reduction by NO gas as indicated
in Scheme 4.3.
Scheme 4.3 Proposed mechanism of formation of DNIC 1 from the ferrous precursor complex 3.
The formation of {Fe(NO)2}9 DNICs from ferrous precursors with N,O-type ligand sets
has been observed in a few other cases, although the mechanism of DNIC formation was not
studied in these systems. Vanin and co-workers reported the formation of DNIC from ferrous iron
in the presence of dmp in aqueous solution.41 Addition of 2-methyl-8-quinolinol to a solution of
iron(II) perchlorate in the presence of NO leads to formation of the corresponding {Fe(NO)2}9
DNIC. However, if 8-quinolinol or 5-chloro-8-quinolinol are employed in place of the methylated
derivative, {FeNO}7-type complexes are isolated.42 Additionally, as noted above, DNIC formation

124
is observed upon NO addition to ferrous 6-Me3TPA33 with a catecholate co-ligand, although with
a benzoylformate coligand, NO binding is weak and no DNIC formation is observed.43 On the
other hand, a monomeric {FeNO}7 complex is isolated with TPA.29,43 These findings suggest that
the presence of an α-methyl group in pyridyl ligands might favor formation of DNIC rather than a
stable monomeric {FeNO}7 complex, potentially through the same disproportionation pathway
observed here.
4.3 Mössbauer Spectroscopy
The major species in the 4.2 K low-field (53 mT) Mössbauer spectra of 1 exhibits
magnetically split subspectra consistent with the presence of a species with a half-integer spin
ground state (Figure 4.9). The spectrum can be fit with an 83% contribution from an S = 1/2 species
with = 0.37 mm/s and ΔEQ = + 1.80 mm/s assigned as the {Fe(NO)2}9 DNIC 1. The sample also
contains a small amount (5 %) of the {Fe(NO)2}10 complex 2 as well as a 12% contribution from
an unknown impurity with = 0.42 mm/s and ΔEQ = 1.69 mm/s, which we tentatively assign as
the unreactive ferric species seen in the EPR studies.
In the sample of complex 2 (obtained via chemical reduction of 1 with cobaltocene as
described in Section 4.1), the major species (80% of total intensity) gives rise to a quadrupole
doublet with = 0.29 mm/s and ΔEQ = 0.83 mm/s (Figure 4.10). There is also a small contribution
from the precursor complex 3, as well as a 15% contribution from the same unknown impurity that
was observed in the sample of complex 1.
Other Mössbauer studies of {Fe(NO)2}9/10 pairs have been reported in the literature with
β-diketiminate, NHC, bipyridine, and di-(2-pyridyl) ketone coligands (Table 4.2). While [Fe(ar-

125
Figure 4.9 4.2-K/53-mT Mössbauer spectra of a sample containing the {Fe(NO)2}9 complex 1. The
experimental data are shown as black vertical bars. The orientation of the externally applied magnetic field
relative to the γ–beam is indicated in the spectra. Spin Hamiltonian simulations of 1 with the following
parameters are shown as red lines: S = 1/2, g = 2.0, = 0.37 mm/s, ΔEQ = + 1.80 mm/s, η = 0.2, A = (-36.5,
-31.8, -7.4) MHz (83% of total intensity). The blue and green lines show the contributions of the {Fe(NO)2}10
complex, 2, ( = 0.29 mm/s, ΔEQ = 0.83 mm/s, 5% of total intensity) and the unknown impurity ( = 0.42
mm/s, ΔEQ = 1.69 mm/s, 12% of total intensity), respectively. The black solid line represents the added
contributions of all three components identified in the sample. Spectrum collected and analyzed by Dr. Bo
Zhang.
Figure 4.10 4.2-K/53-mT Mössbauer spectrum of a sample of the {Fe(NO)2}10 complex 2. The experimental
data are shown as black vertical bars. The blue, orange, and green lines are simulations of the {Fe(NO)2}10
complex ( = 0.29 mm/s; ΔEQ = 0.83 mm/s), the reactant complex 3 ( = 1.18 mm/s; ΔEQ = 2.92 mm/s), and
an impurity ( = 0.42 mm/s; ΔEQ = 1.69 mm/s). The added contributions of these species is shown as the
solid black line. Spectrum collected and analyzed by Dr. Bo Zhang.
nacnac)(NO)2] exhibits a slight (0.03 mm/s) increase in isomer shift upon reduction, the other
complexes with N-donor ligands exhibit decreases in isomer shift between 0.05 and 0.12 mm/s
upon reduction, which is similar in magnitude to the 0.10 mm/s decrease observed upon reduction

126
of 1 to 2. This result is counterintuitive, as the reduction of the complex would be expected to lead
to an increase of the isomer shift. This finding is further discussed in Section 4.7 The differences
in both the magnitude and direction of the change in isomer shift with redox state in these different
complexes highlight the difficulty in using Mössbauer parameters alone to probe differences in
electronic structure in complexes with complicated bonding situations like DNICs.
Table 4.2 Mössbauer parameters for sets of {Fe(NO)2}9 and {Fe(NO)2}10 DNICs
Redox Level δ (mm/s) |ΔEQ| (mm/s) Ref.
[Fe(dmp)(NO)2]+ (1) {Fe(NO)2}9 0.37 1.80 t.w.
[Fe(dmp)(NO)2] (2) {Fe(NO)2}10 0.29 0.83 t.w.
[Fe(ar-nacnac)(NO)2] {Fe(NO)2}9 0.19 0.79 7
[Fe(ar-nacnac)(NO)2] {Fe(NO)2}10 0.22 1.31 7
[Fe(NHC-iPr)2(NO)2]+ {Fe(NO)2}9 0.11 0.27 44
[Fe(NHC-iPr)2(NO)2] {Fe(NO)2}10 0.05 1.34 44
[Fe(bipy)(NO)2]+ {Fe(NO)2}9 0.64 0.66 45
[Fe(bipy)(NO)2] {Fe(NO)2}10 0.52 0.72 45
[Fe(di-2-pyridyl ketone)(NO)2]+ {Fe(NO)2}9 0.53 0.74 45
[Fe(di-2-pyridyl ketone)(NO)2] {Fe(NO)2}10 0.48 0.54 45
[Fe(2-methyl-8-quinolinate)(NO)2+]+ {Fe(NO)2}9 0.47 0.88 42
4.4 Nuclear Resonance Vibrational Spectroscopy (NRVS)
The NRVS spectrum of the {Fe(NO)2}9 DNIC 1 is very distinct from that of the
{Fe(NO)2}10 DNIC 2. The spectrum of 1 (Figure 4.11a) exhibits two intense features at 581 cm-1
and 534 cm-1 that shift to 564 cm-1 and 518 cm-1 upon 15N18O isotope substitution, respectively, as
well as a third, lower-energy band at 355 cm-1 that is observed at 345 cm-1 in the 15N18O analog.
This spectrum is qualitatively similar to the reported Raman and NRVS data of four-coordinate
monomeric {Fe(NO)2}9 DNICs with thiophenolate and selenophenolate ligands.12,17 In contrast,
the spectrum of the {Fe(NO)2}10 complex 2 (Figure 4.11b) exhibits four intense features at 646
cm-1, 615 cm-1, 559 cm-1, and 545 cm-1 that shift to 631 cm-1, 600 cm-1, and a combined feature at
538 cm-1 with 15N18O, respectively.

127
Figure 4.11 (a) NRVS spectrum of {57Fe(NO)2}9 DNIC 1 (black) and the corresponding 15N18O isotopolog
(red). (b) NRVS spectrum of {57Fe(NO)2}10 DNIC 2 (black) and the corresponding 15N18O isotopolog (red).
In order to determine whether the observed patterns in the vibrational spectra are general,
we also measured NRVS data for the {Fe(NO)2}10 DNIC [Fe(TMEDA)(NO)2] (4). In this case,
since the four-coordinate {Fe(NO)2}9 DNIC is not stable, we measured the corresponding five-
coordinate complex [Fe(TMEDA)(I)(NO)2] (5) instead. The NRVS data of these DNICs are
qualitatively very similar to 1 and 2. The {Fe(NO)2}10 DNIC 4 (Figure 4.12b) again exhibits a
four-band pattern at high energy with features at 665 cm-1, 625 cm-1, 563 cm-1 and 541 cm-1, which
downshift to 643 cm-1, 617 cm-1, 555 cm-1, and 522 cm-1, respectively, upon labeling with 15NO
In contrast, the spectrum of the {Fe(NO)2}9 species 5 (Figure 4.12a) contains an isotope-sensitive
feature at 569 cm-1, which splits into a major band at 565 cm-1 with a shoulder at 549 cm-1 upon
labeling with 15NO, and a second feature at 519 cm-1, which downshifts to 515 cm-1 in the 15NO
labeled complex. However, the 5-coordinate complex 5 lacks the lower-energy feature observed
in the four-coordinate complex 1. These findings provide further evidence that NRVS can be a
useful technique for distinguishing between DNICs of different coordination environments and
oxidation states as demonstrated previously by Cramer and co-workers.16-17
0 100 200 300 400 500 600 700
0.000
0.005
0.010
0.015
0.020
0.025V
DO
S (
cm
)
Energy (cm-1)
{Fe(NO)2}9 1-NO
{Fe(15
N18
O)2}9 1-
15N
18O
581565
534
518
355347
0 100 200 300 400 500 600 700
0.000
0.005
0.010
0.015
0.020
VD
OS
(cm
)
Energy (cm-1)
{Fe(NO)2}10
2-NO
{Fe(15
N18
O)2}10
2-15
N18
O
631
616
600
559
545
646
538
(a) (b)
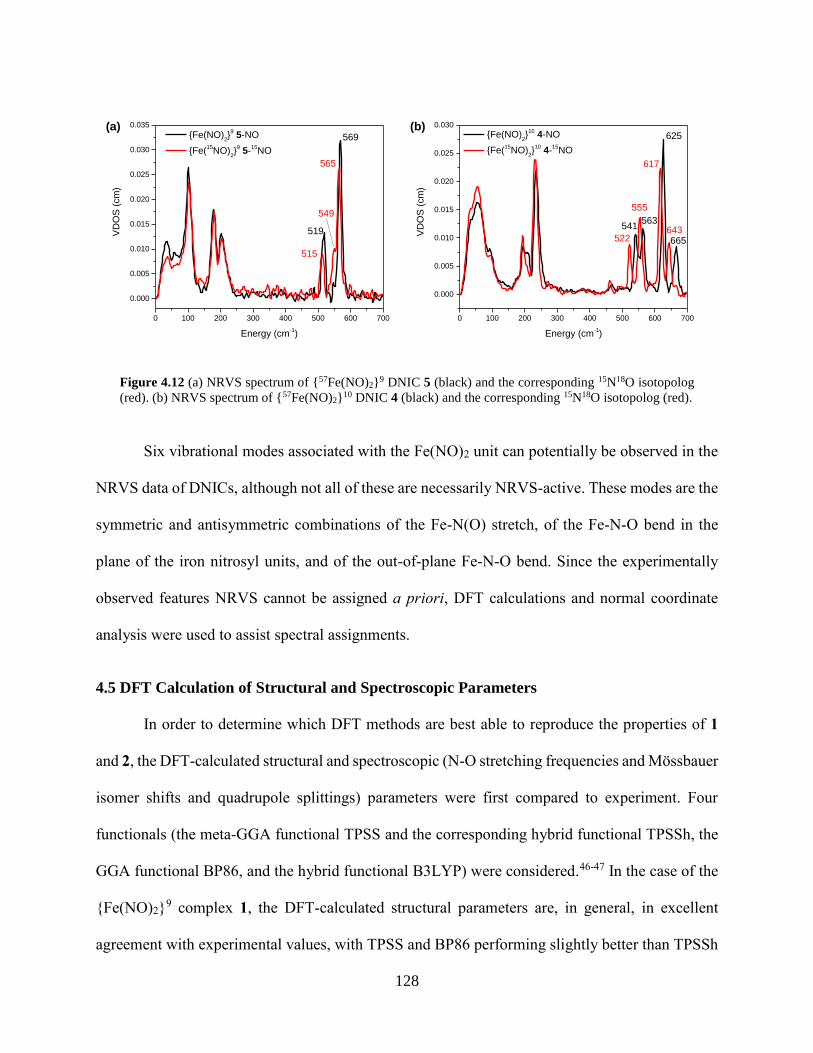
128
Figure 4.12 (a) NRVS spectrum of {57Fe(NO)2}9 DNIC 5 (black) and the corresponding 15N18O isotopolog
(red). (b) NRVS spectrum of {57Fe(NO)2}10 DNIC 4 (black) and the corresponding 15N18O isotopolog (red).
Six vibrational modes associated with the Fe(NO)2 unit can potentially be observed in the
NRVS data of DNICs, although not all of these are necessarily NRVS-active. These modes are the
symmetric and antisymmetric combinations of the Fe-N(O) stretch, of the Fe-N-O bend in the
plane of the iron nitrosyl units, and of the out-of-plane Fe-N-O bend. Since the experimentally
observed features NRVS cannot be assigned a priori, DFT calculations and normal coordinate
analysis were used to assist spectral assignments.
4.5 DFT Calculation of Structural and Spectroscopic Parameters
In order to determine which DFT methods are best able to reproduce the properties of 1
and 2, the DFT-calculated structural and spectroscopic (N-O stretching frequencies and Mössbauer
isomer shifts and quadrupole splittings) parameters were first compared to experiment. Four
functionals (the meta-GGA functional TPSS and the corresponding hybrid functional TPSSh, the
GGA functional BP86, and the hybrid functional B3LYP) were considered.46-47 In the case of the
{Fe(NO)2}9 complex 1, the DFT-calculated structural parameters are, in general, in excellent
agreement with experimental values, with TPSS and BP86 performing slightly better than TPSSh
0 100 200 300 400 500 600 700
0.000
0.005
0.010
0.015
0.020
0.025
0.030
0.035V
DO
S (
cm
)
Energy (cm-1)
{Fe(NO)2}9 5-NO
{Fe(15
NO)2}9 5-
15NO
569
549
565
519
515
0 100 200 300 400 500 600 700
0.000
0.005
0.010
0.015
0.020
0.025
0.030
VD
OS
(cm
)
Energy (cm-1)
{Fe(NO)2}10
4-NO
{Fe(15
NO)2}10
4-15
NO
665643
625
617
563
555
541
522
(a) (b)

129
and B3LYP (Table 4.3). In all cases, the calculated N-O stretching frequencies are considerably
higher than experimental values, and the splitting between the symmetric and antisymmetric
stretches is underestimated. Note that a previous DFT study showed that the NO stretching
frequencies of DNICs are generally not very well-predicted by DFT (the highest accuracy achieved
was only to within ± 40 cm-1) and vary considerably with both functional and basis set.48 The
Mössbauer parameters are reasonably well-predicted by DFT and are within the typical error range
to the experimentally observed values.
Table 4.3 Comparison of experimental bond lengths and spectroscopic parameters to DFT-calculated values
for {Fe(NO)2}9 DNIC 1.
Exptl. TPSS BP86 TPSSh B3LYP
Fe-N(O) (Å) 1.674
1.675
1.674
1.675
1.674
1.674
1.708
1.709
1.752
1.753
N-O (Å) 1.174
1.177
1.163
1.163
1.164
1.164
1.158
1.158
1.158
1.158
Fe-N-O (°) 168.33
170.62
167.12
167.36
166.10
166.29
167.83
167.97
167.82
168.10
N(O)-Fe-N(O) (°) 116.26 113.97 113.28 115.81 117.42
Fe-N(phen) (Å) 2.037
2.047
2.025
2.038
2.031
2.040
2.056
2.056
2.099
2.099
(NO) (cm-1)
1840
1746
1859
1814
1851
1808
1902
1849
1900
1840
δ (mm/s) 0.39 0.26 0.21 0.30 0.43
|ΔEQ| (mm/s) 1.54 1.54 1.52 1.65 1.77
In the case of the {Fe(NO)2}10 complex 2, which has a singlet ground state, both closed-
shell (RKS) and broken symmetry (BS) solutions were considered. As observed previously by Ye
and Neese11, the broken symmetry calculations with the pure functionals BP86 and TPSS always
collapse to the corresponding closed-shell solutions. With hybrid functionals, however, a broken-
symmetry solution was obtained. In the case of TPSSh, the energies of the broken-symmetry and
closed-shell solutions are nearly identical and in the case of B3LYP, the broken symmetry solution
is 9.8 kcal/mol lower in energy than the closed shell solution. Since the structure of 2 is not
reported, the DFT-calculated structures were compared to the experimental structure of the closely
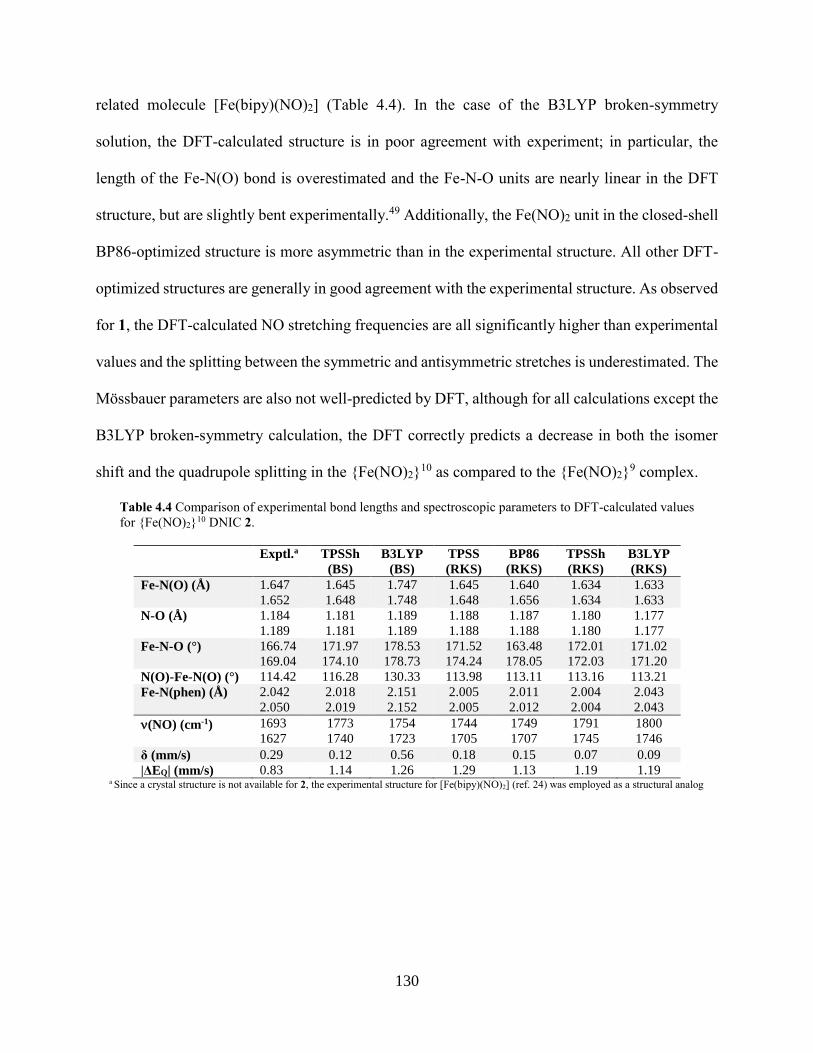
130
related molecule [Fe(bipy)(NO)2] (Table 4.4). In the case of the B3LYP broken-symmetry
solution, the DFT-calculated structure is in poor agreement with experiment; in particular, the
length of the Fe-N(O) bond is overestimated and the Fe-N-O units are nearly linear in the DFT
structure, but are slightly bent experimentally.49 Additionally, the Fe(NO)2 unit in the closed-shell
BP86-optimized structure is more asymmetric than in the experimental structure. All other DFT-
optimized structures are generally in good agreement with the experimental structure. As observed
for 1, the DFT-calculated NO stretching frequencies are all significantly higher than experimental
values and the splitting between the symmetric and antisymmetric stretches is underestimated. The
Mössbauer parameters are also not well-predicted by DFT, although for all calculations except the
B3LYP broken-symmetry calculation, the DFT correctly predicts a decrease in both the isomer
shift and the quadrupole splitting in the {Fe(NO)2}10 as compared to the {Fe(NO)2}
9 complex.
Table 4.4 Comparison of experimental bond lengths and spectroscopic parameters to DFT-calculated values
for {Fe(NO)2}10 DNIC 2.
Exptl.a TPSSh
(BS)
B3LYP
(BS)
TPSS
(RKS)
BP86
(RKS)
TPSSh
(RKS)
B3LYP
(RKS)
Fe-N(O) (Å) 1.647
1.652
1.645
1.648
1.747
1.748
1.645
1.648
1.640
1.656
1.634
1.634
1.633
1.633
N-O (Å) 1.184
1.189
1.181
1.181
1.189
1.189
1.188
1.188
1.187
1.188
1.180
1.180
1.177
1.177
Fe-N-O (°) 166.74
169.04
171.97
174.10
178.53
178.73
171.52
174.24
163.48
178.05
172.01
172.03
171.02
171.20
N(O)-Fe-N(O) (°) 114.42 116.28 130.33 113.98 113.11 113.16 113.21
Fe-N(phen) (Å) 2.042
2.050
2.018
2.019
2.151
2.152
2.005
2.005
2.011
2.012
2.004
2.004
2.043
2.043
(NO) (cm-1)
1693
1627
1773
1740
1754
1723
1744
1705
1749
1707
1791
1745
1800
1746
δ (mm/s) 0.29 0.12 0.56 0.18 0.15 0.07 0.09
|ΔEQ| (mm/s) 0.83 1.14 1.26 1.29 1.13 1.19 1.19 a Since a crystal structure is not available for 2, the experimental structure for [Fe(bipy)(NO)2] (ref. 24) was employed as a structural analog

131
4.6 Assignment of DNIC NRVS Features and Determination of Force Constants for the
Fe(NO)2 Unit Using QCC-NCA
The experimental and DFT-calculated NRVS data were then compared, as shown in Figure
4.13. In general, DFT qualitatively reproduces the vibrational features of 1 and 2, although the
energies are considerably shifted from experiment and the relative intensities are not well
reproduced in all cases. In the case of the {Fe(NO)2}9 complex 1, for the TPSS and BP86
calculations, the energies of the Fe-N(O) vibrations are higher than experiment. In both the TPSSh
and B3LYP spectra, the general pattern of the Fe-N(O) vibrations is reproduced and the energies
are reasonably close to experiment, although the predicted feature at ~500 cm-1 is split due to
coupling with internal dmp vibrations. For the {Fe(NO)2}10 complex 2, the spectra predicted from
the RKS calculations all exhibit Fe-N(O) vibrations considerably higher than experiment. The
geometry of the B3LYP broken symmetry calculation deviates considerably from experiment and
correspondingly, the predicted NRVS data do not match experiment. In contrast, the predicted
spectrum at the TPSSh level reproduces the four-band pattern observed experimentally, although
the energies are shifted compared to experiment.
According to the DFT calculations, the symmetric and antisymmetric Fe-N(O) stretching
vibrations and the symmetric in-plane and out-of-plane Fe-N-O bends have significant NRVS
intensity above 300 cm-1, while the antisymmetric bending modes occur at low energy and are not
NRVS active. However, given the general failure of DFT to reproduce the experimentally observed
N-O stretching frequencies and Mössbauer parameters of DNICs 1 and 2, as noted in Section 4.5,
inaccuracy in the energies of the bands in the calculated NRVS data can also be expected. Thus,
the observed vibrational features should not be assigned based on their relative positions in the

132
DFT calculations alone, especially since some of the vibrational features are similar in energy or
overlap in the experimental spectra.
Figure 4.13 Comparison of experimental and DFT-predicted NRVS spectra for {Fe(NO)2}9 complex 1 (a)
and {Fe(NO)2}10 complex 2 (b). Natural abundance spectra are shown in black and the isotopically labeled
(15N18O) spectra are shown in red.
In addition, it is in fact force constants, rather than vibrational frequencies, that are
correlated to experimental bond strengths. In cases where there is considerable mixing between
internal coordinates and the vibrational modes are not pure, experimental frequencies cannot be
directly correlated to bond strengths.50 For example, this is the case in ferrous heme-nitrosyls,
where considerable mixing between the Fe-N(O) stretching and Fe-N-O bending coordinates is
observed51; a similar effect can be expected for DNICs. Since the degree of mixing varies among
complexes, a rigorous comparison of bond strengths between complexes can be made only by a
450 500 550 600 650 700 750
450 500 550 600 650 700 750
nai NO
15
N18
OExperimental
B3LYP (BS)
TPSSh (BS)
B3LYP (RKS)
TPSSh (RKS)
BP86 (RKS)
NR
VS
Inte
nsity
TPSS (RKS)
Energy (cm-1)
300 350 400 450 500 550 600 650 700
300 350 400 450 500 550 600 650 700
nai NO
15
N18
O
Experimental
TPSSh
NR
VS
Inte
nsity
B3LYP
TPSS
Energy (cm-1)
BP86
(a) (b)

133
determination of the corresponding force constants. While the full set of force constants for the
entire molecule cannot be determined experimentally, an initial force field can be generated using
DFT calculations. Then, following the quantum chemistry centered normal coordinate analysis
(QCC-NCA) approach, a minimal subset of these force constants can be adjusted in order to
reproduce the experimental spectra.50 Since the TPSSh functional is able to reproduce the
structural and spectroscopic parameters of both 1 and 2 reasonably well (see Section 4.5), this
functional was selected for construction of an initial set of force constants. This choice of
functional is in agreement with the results from Ye and Neese.11 In general, only minor adjustments
to the Fe(NO)2 force constants are required to reproduce the experimental NRVS spectra (Figure
4.14). A list of key force constants from DFT and from the QCC-NCA fits is shown in Table 4.5.
Assignments of the NRVS features associated with the Fe(NO)2 unit are presented in Tables 4.6
and 4.7.
Based on the QCC-NCA fits for the {Fe(NO)2}9 complex 1, the highest intensity feature at
581 cm-1 is assigned as the antisymmetric Fe-N(O) stretch. The lower intensity feature at 534 cm-
1 is assigned as the symmetric Fe-N(O) stretch, and the low-energy feature at 355 cm-1 is assigned
as the symmetric out-of-plane Fe-N-O bend. While the relative positions of the symmetric and
antisymmetric Fe-N(O) stretches and the symmetric out-of-plane bend are consistent with previous
assignments for [Fe(SPh)2(NO)2] based on NRVS17 and Raman12 spectra, neither of these studies
reported the position of the symmetric in-plane Fe-N-O bend. However, the calculations clearly
indicate that this mode should be NRVS active in 1 (and presumably in other {Fe(NO)2}9 DNICs).
This is shown by the amount of iron motion in the mode (e2Fe) which is directly proportional to

134
Figure 4.14 Experimental NRVS spectra (black) and QCC-NCA fit (red) for {Fe(NO)2}9 DNIC 1 (a) and
{Fe(NO)2}10 DNIC 2 (b). The natural abundance NO spectra are shown on the top and the isotopically labeled
(15N18O) data are shown on the bottom. The experimental spectra were scaled up to match the simulated
NRVS intensities.
Table 4.5 Key force constants (in mdyn/Å or mdyn•Å) for the Fe(NO)2 unit in 1 and 2.
DFT QCC-NCA
Force Constant {Fe(NO)2}9 {Fe(NO)2}10 {Fe(NO)2}9 {Fe(NO)2}10
N-O 14.5 12.5 13.0 11.0
Fe-N(O) 3.3 3.9 3.8 4.0
Fe-N-O 0.30 0.42 0.38 0.42
N(O)-Fe-N(dmp) 0.28 0.48
0.50 0.28 0.50
Fe-NO torsion 0.011
0.0033
0.0078 0.012 0.0018
NRVS intensity (the values of e2Fe are given in Table 4.6).14-15 Close examination of the NRVS
data reveals a shoulder on the high-energy side of the antisymmetric Fe-N(O) stretch. Although
the NRVS data are not of sufficient resolution to unambiguously determine the position of this
(a) (b) 300 400 500 600 700
0.00
0.01
0.02
0.03
0.04
300 400 500 600 700
0.00
0.01
0.02
0.03
0.04
VD
OS
(cm
)
{Fe(NO)2}9 1-NO
Expt
QCC-NCA fit
VD
OS
(cm
)
Energy (cm-1)
{Fe(15
N18
O)2}9 1-
15N
18O
450 500 550 600 650 700
0.00
0.01
0.02
0.03
450 500 550 600 650 700
0.00
0.01
0.02
0.03
VD
OS
(cm
)
{Fe(NO)2}10
2-NO
Expt
QCC-NCA fit
{Fe(15
N18
O)2}10
2-15
N18
O
VD
OS
(cm
)
Energy (cm-1)

135
shoulder, the pattern of NRVS intensities in the high-energy region is reproduced only when the
symmetric in-plane Fe-N-O bending vibration is at slightly higher energy (~594 cm-1) than the
antisymmetric Fe-N(O) stretch. A similar shoulder to higher energy of the antisymmetric Fe-N(O)
stretch was observed in the NRVS spectrum of [Fe(SPh)2(NO)2] but was assigned in this case as
a Fermi resonance17; our studies imply that this band should instead be assigned as the symmetric
in-plane Fe-N-O bend.
Table 4.6 Assignment of NRVS features and comparison of {57Fe(NO)2}9 experimental, DFT-calculated,
and QCC-NCA fitted energies. The intensity of each feature is indicated by the value of e2Fe (the normalized
square of iron motion). The corresponding values with 15N18O are shown in parenthesis.
Band Assignment Experimental DFT QCC-NCA e2Fe
(N-O)as 1748 (1673) 1850 (1770) 1748 (1674) --
(N-O)s 1836 (1759) 1903 (1820) 1835 (1757) --
(Fe-NO)s 534 (518) 502/485a (475) 534 (518) 0.263 (0.242)
(Fe-NO)as 581 (565) 566 (548) 580 (564) 0.415 (0.439)
δ(Fe-N-O)s, ip 581 (565)b 572 (554) 594 (576) 0.138 (0.169)
δ(Fe-N-O)s, oop 355 (347) 352 (342) 357 (346) 0.127 (0.152) a In the DFT-predicted natural abundance NO spectrum, (Fe-NO)s is mixed with other vibrations
in the phenanthroline ligand backbone, leading to a split feature b The exact position δ(Fe-N-O)s, ip
is uncertain due to significant overlap with (Fe-NO)as
Table 4.7 Assignment of NRVS features and comparison of {57Fe(NO)2}10 experimental, DFT-calculated,
and QCC-NCA fitted energies. The intensity of each feature is indicated by the value of e2Fe (the normalized
square of iron motion). The corresponding values with 15N18O are shown in parenthesis.
Band Assignment Experimental DFT QCC-NCA e2Fe
(N-O)as 1621 (1559) 1741 (1667) 1621 (1553) --
(N-O)s 1688 (1617) 1774 (1699) 1689 (1616) --
(Fe-NO)s 559 (538) 523 (511) 558 (541) 0.233 (0.239)
(Fe-NO)as 616 (600) 632 (614) 615 (599) 0.440 (0.462)
δ(Fe-N-O)s, ip 646 (631) 672 (652) 647(629) 0.163 (0.201)
δ(Fe-N-O)s, oop 545 (538) 592 (576) 545 (534) 0.208 (0.208)
In the case of the {Fe(NO)2}10 complex 2, the highest intensity NRVS feature at 632 cm-1
can also be assigned as the antisymmetric Fe-N(O) stretch, and the highest energy feature at 672
cm-1 can be assigned as the symmetric Fe-N-O in-plane bend. Although the features at 559 cm-1
and 545 cm-1 have similar intensities and therefore cannot be assigned based on their position
alone, a satisfactory QCC-NCA fit of the experimental data (including the isotope shift) can only

136
be obtained when the higher energy band (559 cm-1, large isotope shift) is assigned as the
symmetric stretch and the band at 545 cm-1 with the smaller isotope shift is assigned to the
symmetric out-of-plane bend.
Whereas the symmetric and antisymmetric Fe-N(O) stretches and the symmetric in-plane
bend increase only moderately (by 24 cm-1, 35 cm-1, and 53 cm-1, respectively) upon reduction of
1 to 2, the out-of-plane symmetric bend exhibits a remarkable 188 cm-1 upshift upon reduction,
indicating a difference in electronic structure between these complexes. The underlying reason for
this finding is further elucidated by a comparison of the force constants of 1 and 2. Interestingly,
the Fe-N(O) stretching and Fe-N-O bending force constants increase only slightly (by 0.2 mdyn/Å
and 0.04 mdyn•Å, respectively) for 2 as compared to 1, and the Fe-N(O) torsion actually decreases
in 2. However, the N(O)-Fe-N(dmp) tetrahedral bending force constants nearly double from 0.28
mdyn•Å in 1 to 0.50 mdyn•Å in 2. These findings indicate an overall stiffening of the Fe(NO)2
core and therefore, an increase in iron-ligand bond order upon reduction. At the same time, the N-
O stretching frequencies and the N-O stretching force constants decrease in 2. This experimental
finding can be explained by a significant increase in Fe-NO backbonding for 2, which would
then be responsible for the stiffening of the Fe(NO)2 core and an increase in electron density in the
NO * orbitals at the same time. This result provides direct, experimental insight into Fe-NO
bonding in 2 as compared to 1.
4.7 Electronic Structure
In order to correlate the changes in spectroscopic properties between 1 and 2 with changes
in the electronic structure of the Fe(NO)2 unit, DFT calculations were employed. Schematic MO
diagrams for 1 and 2 with orbitals calculated at the TPSSh/def2-TZVP level are shown in Figures

137
4.15 and 4.16. The electronic structure picture that arises from these calculations is consistent with
the previous proposal by Ye and Neese.11
Figure 4.15 Schematic MO diagram showing unrestricted corresponding orbitals (UCOs) for {Fe(NO)2}9
DNIC 1. Sαβ indicates the amount of spatial overlap between the α-spin and β-spin orbitals.
For the {Fe(NO)2}9 species 1, in the α-spin manifold, the orbitals have predominantly iron
character, whereas in the β-spin manifold the orbitals have approximately equal contributions from
iron and NO, indicating very covalent Fe-NO -bonds. This suggests that the {Fe(NO)2}9 complex
can be described as a high-spin ferric center (S = 5/2) antiferromagnetically coupled to two NO
55% Fe
43% NO
dyz85% Fe d
13% NOyz
S =0.92a
42% Fe d
58% NOz2/x2-y281% Fe d
18% NOz2/x2-y2
S =0.87a
S =0.86a
78% Fe d
14% NOxy
S =0.80a
36% Fe
59% NO
dxz
31% Fe
67% NO
dxy
92% Fe d
4% NOz2/x2-y2
77% Fe d
18% NOxz

138
(nitroxyl) ligands (each with S = 1), where the triplet NO ligands then act as strong -donors to
the -spin d-orbitals of the ferric iron center, leading to strong antiferromagnetic coupling between
the iron center and the nitroxyl ligands. Alternatively, the complex could be described as a high-
spin ferrous center (S = 2) antiferromagnetically coupled to an overall (NO)2 ligand (S = 3/2). In
analogous thiolate-ligated {Fe(NO)2}9 DNICs, this electronic structure picture is also supported
both by Fe K-edge XAS and by valence-to-core Fe Kβ x-ray emission spectroscopy.9,52-53
Figure 4.16 Schematic MO diagram showing unrestricted corresponding orbitals (UCOs) for {Fe(NO)2}10
DNIC 2. Sαβ indicates the amount of spatial overlap between the α-spin and β-spin orbitals.
46% Fe
43% NO
dz2/xz61% Fe d
29% NOz2/xz
S =0.98a
47% Fe
49% NO
dz2/xz63% Fe
33% NO
dz2/xzS =0.98a
S =0.97a
62% Fe d
35% NOxy
S =0.92a
51% Fe
46% NO
dyz
30% Fe d
68% NOxy
74% Fe
24% NO
dyz
86% Fe d
11% NOx2-y2

139
In 2, the dx2-y2 orbital becomes doubly occupied, which indicates that the reduction leading
to the {Fe(NO)2}10 species is in fact iron-centered. Note that due to the slight asymmetry in the
DFT-optimized structure of 2 (see Table 4.4), the interaction of the dz2/dxz orbitals with the two
nitrosyl units is asymmetric. While the overall composition of the β-spin orbitals remains relatively
similar, the α-spin orbitals have significantly more NO character in 2 as compared to 1, indicating
a substantial increase in -backbonding. Complex 2 is thus best described as a high-spin ferrous
center (S = 2) antiferromagentically coupled to two NO ligands (each with S = 1) and features
extremely covalent Fe-NO bonding interactions (also indicated by the large overlap (Sαβ) between
the α- and β-spin UCOs in this complex), even more so than complex 1.
As noted previously11,44, this electronic structure description explains the counterintuitive
trends in the Fe-N(O) bond strengths and Mössbauer isomer shifts observed for 1 and 2. Typically,
iron-ligand bond lengths increase upon reduction of an iron center and an increase in the
Mössbauer isomer shift is observed. However, in the case of DNIC 1, although the reduction is
metal-centered, the isomer shift in 2 decreases, indicating an overall more oxidized iron center
upon reduction. This contradiction can be explained by a considerable increase in -backbonding
in the reduced complex 2. This leads to an overall increase in the Fe-NO bond strengths in 2, and
hence, a decrease of the Fe-NO bond lengths, and an increase in the corresponding Fe-NO force
constants. This is also in agreement with the general observation that isomer shifts are very
sensitive to -backbonding, with stronger -backbonds leading to smaller isomer shifts.54 In this
way, the isomer shift of 2 decreases relative to 1, despite the compound undergoing an iron-
centered reduction. Finally, the increase in Fe-NO double bond character in 2 (caused by the
stronger -backbonding) greatly stiffens the Fe(NO)2 core, which is evident experimentally from
the 180 cm-1 increase in the energy of the symmetric out of plane Fe-N-O bend in 2 relative to 1.

140
The highly covalent Fe-NO bonds of DNICs also have implications for the reactivity of
these species. Although both {Fe(NO)2}9 and {Fe(NO)2}
10 DNICs contain the requisite number of
NO moieties and electrons to couple and produce N2O and either a ferric or ferrous product, this
reactivity has never been observed. This can be explained by the strong antiferromagnetic coupling
between the NO ligands and the iron center which forces the spins of the NO ligands to be parallel
(ferromagnetically aligned). However, in order to form an N-N bond as required for N2O
formation, the spins of the two NO ligands must be antiparallel. The electronic structure of the
DNICs therefore makes the N-N coupling reaction strongly spin-forbidden and leads to a high
reaction barrier (DFT estimates show that the energy required to break the spin alignment is > 40
kcal/mol). This stabilizes the Fe(NO)2 core against N-N coupling, hyponitrite formation, and
decomposition. In contrast, in an [{FeNO}8]2 dimeric (diiron) core the spins of the {FeNO}8
centers are generally weakly coupled, therefore allowing for facile N-N bond formation if the two
Fe-NO units are in the right relative orientation.55 Similarly, two isolated M-NO units therefore
have the potential to couple and form an N-N bond, as observed by Hayton and coworkers for
{NiNO}10 complexes.56 These results further argue against the formation of DNIC species as an
intermediate in N-N bond formation as proposed in the cis-FeB mechanism for bacterial nitric
oxide reductases as discussed in Chapter 1.40
4.8 Experimental Section
Synthesis
All syntheses as well as reagent and solvent purification were carried out following the general
procedures outlined in Chapter 2.

141
[Fe(dmp)(NO)2](OTf) (1). Under an inert atmosphere, 150 mg of Fe(CH3CN)2(OTf)2 (0.34
mmol) and 72 mg of neocuproine (0.35 mmol) were combined in 2.5 mL of methanol. The
resulting solution was exposed to excess NO gas, then stirred under NO headspace. After 24 hours,
24 mL of diethyl ether was added to precipitate the product, and the flask was kept at 35°C
overnight. The reaction was then filtered, giving 116 mg (0.24 mmol, 71% yield) of 1 as a light
brown powder. Samples prepared in this manner are approximately 80% pure by Mössbauer
spectroscopy. Characterization: IR (KBr pellet): (NO) = 1840, 1746 cm-1; EPR (77 K, MeOH):
g = 2.075, 2.045, 2.003; Mössbauer (4.2 K, frozen 1:1 EtCN:PrCN solution): δ = 0.38 mm/s; ΔEQ
= +1.54 mm/s Single crystals suitable for X-ray diffraction were grown by vapor diffusion of
diethyl ether into a concentrated methanol solution of 1.
Note: In initial experiments, the pre-formed complex [Fe(dmp)2](OTf)2 (3) was used as the starting
material for the synthesis of 1 in reactions performed under analogous conditions to those
described above. We later determined that the same product is obtained from 1:1 or 1:2 mixtures
of Fe(CH3CN)2(OTf)2 and neocuproine in methanol.
[Fe(dmp)(NO)2] (2). Under an inert atmosphere, 13.2 mg (69.8 mmol) of CoCp2 and 30.5 mg
(64.5 mmol) of 1 were combined in 3 mL of THF and stirred for 45 minutes. The reaction was
then filtered (in order to remove the cobaltocenium byproduct) and hexanes was added to the
filtrate. Filtration of the resulting suspension afforded 2 as a brown powder. Samples prepared in
this manner are approximately 80% pure by Mössbauer spectroscopy. The spectroscopic data
match the previous literature reports for this complex.18 Other characterization: Mössbauer (4.2 K,
frozen 1:1 EtCN:PrCN solution): δ = 0.29 mm/s; |ΔEQ| = 0.83 mm/s
142
[Fe(dmp)2](OTf)2 (3). In a glovebox, 620 mg (1.75 mmol) of iron(II) triflate and 723 mg of 2,9-
dimethyl-1,10-phenanthroline (3.50 mmol) were combined in 15 mL of acetonitrile. The resulting
slurry was stirred overnight. The suspension was filtered, and diethyl ether was added to the filtrate
causing the compound to precipitate. The reaction mixture was placed in a freezer (-35°C)
overnight. Upon filtration, 1.27 g (1.6 mmol, 94% yield) of a yellow solid was obtained. Crystals
were grown by vapor diffusion of diethyl ether into a concentrated CH3CN solution of 3. Elemental
analysis: Calc. for C30H24F6FeN4O6S2: C 46.76, N 7.27, H 3.14, obtained: C 46.49, N 7.36, H 3.13;
Mössbauer (4.2 K, frozen 1:1 EtCN:PrCN solution): δ = 1.18 mm/s; |ΔEQ| = 2.92 mm/s; 1H NMR
(400 MHz, CD3OD, all peaks appear as broad singlets): 52.3, 50.1, 29.8, 25.7, 8.3, 7.8, 7.7, 5.2,
2.9, -28.8, -34.1 ppm. Note: As discussed in Section 4.2, the exact solution speciation of this
complex is unclear.
Synthesis of 57Fe Complexes. 57Fe-labeled complexes 1 and 2 were synthesized in a manner
analogous to the unlabeled complexes from 57Fe(OTf)2, generated in situ via metathesis of 57FeCl2
with Ag(OTf) as previously described.29 [57Fe(-I)(NO)2]2, generated from 57Fe powder, was used
to synthesize [57Fe(TMEDA)(I)(NO)2] (5) following literature procedures.57-58 Reduction of 5 with
CoCp2 following a literature procedure58 afforded the complex [57Fe(TMEDA)(NO)2] (4).
(Complexes 4 and 5 were prepared by Kelsey Skodje, Brown University).
Mechanistic Studies. In a 50 mL Schlenk flask, 3 was dissolved in 10 mL of methanol. The
resulting solution was stirred under NO pressure for 10 minutes, then sealed off and left to stir
under NO headspace. IR aliquots were syringe transferred out of the flask into a solution IR cell
in a glovebox. EPR aliquots were syringe transferred out of the flask into anaerobically sealed EPR

143
tubes and flash frozen in liquid nitrogen. For gas IR studies, the gas headspace of the reaction was
transferred to an evacuated (~100 mtorr) gas IR cell via a cannula needle.
Phyiscal Measurements
Physical measurements, including X-ray crystallography and Mössbauer spectroscopy, were
performed as described in Chapter 2.
DFT Calculations and QCC-NCA Fitting
DFT Calculations. Geometry optimizations and frequency calculations (performed in the gas
phase) were performed with the ORCA program package (version 2.9).59 The B3LYP60-61,
TPSSh62, TPSS62-63, and BP8664-65 functionals were used with the def2-TZVP basis set66-67 and the
def2-TZVP/J auxiliary basis set.68-69 The RI68-69 (BP86, TPSS) or RIJCOX70 (B3LYP, TPSSh)
approximation was employed. The broken symmetry formalism71 implemented in ORCA was used
(BS(5,4) in the case of the {Fe(NO)2}9 complex and BS(4,4) in the case of the {Fe(NO)2}
10
complex). To facilitate comparison between the {Fe(NO)2}9 and {Fe(NO)2}
10 complexes, the
canonical orbitals for the broken symmetry solutions were transformed into unrestricted
corresponding orbitals (UCOs).72 Note that because of the UCO transformation, the orbital
energies are not well-defined. The UCOs were plotted using the orca_plot tool and visualized using
Molekel version 5.473 (electron density isosurface value = 0.05). Mössbauer parameters were
calculated using the same functional as the optimization step and basis sets CP(PPP)74 on Fe,
TZVP66 on N and O, and SV(P) on C and H. Isomer shifts (δ) were obtained using the correlation
of calculated electron density ρ(0) to experimental δ reported in the literature.75 DFT-calculated
NRVS spectra were generated from frequency calculations using the orca_vib tool.76-77
144
QCC-NCA Fitting. Normal coordinate analysis was performed using our QCC-NCA package as
previously described.78-79 The initial force field was generated from Gaussian0980 frequency
calculations performed at the TPSSh/def2-TZVP level. Force constants were transformed into
internal coordinates and extracted using a modified version of the program Redong (QCPE 628).81
Using our modified NCA program79 based on QCPE 576 by Peterson and McIntosh82, the NRVS
VDOS spectra were calculated and then fit by adjusting the necessary force constants.
4.9 References and Notes
(1) Lewandowska, H.; Kalinowska, M.; Brzoska, K.; Wojciuk, K.; Wojciuk, G.; Kruszewski, M.
Dalton Trans. 2011, 40, 8273-8289.
(2) Hickok, J. R.; Sahni, S.; Shen, H.; Arvind, A.; Antoniou, C.; Fung, L. W. M.; Thomas, D. D.
Free Radical Biol. Med. 2011, 51, 1558-1566.
(3) D'Autréaux, B.; Horner, O.; Oddou, J.-L.; Jeandey, C.; Gambarelli, S.; Berthomieu, C.; Latour,
J.-M.; Michaud-Soret, I. J. Am. Chem. Soc. 2004, 126, 6005-6016.
(4) Kennedy, M. C.; Antholine, W. E.; Beinert, H. J. Biol. Chem. 1997, 272, 20340-20347.
(5) Boese, M.; Mordvintcev, P. I.; Vanin, A. F.; Busse, R.; Mülsch, A. J. Biol. Chem. 1995, 270,
29244-29249.
(6) Lee, M.; Arosio, P.; Cozzi, A.; Chasteen, N. D. Biochemistry 1994, 33, 3679-3687.
(7) Tonzetich, Z. J.; Do, L. H.; Lippard, S. J. J. Am. Chem. Soc. 2009, 131, 7964-7965.
(8) Tran, C. T.; Skodje, K. M.; Kim, E. Prog. Inorg. Chem. 2014, 59, 339-380.
(9) Tsai, M.-L.; Tsou, C.-C.; Liaw, W.-F. Acc. Chem. Res. 2015, 48, 1184-1193.
(10) Pulukkody, R.; Darensbourg, M. Y. Acc. Chem. Res. 2015, 48, 2049-2058.
(11) Ye, S.; Neese, F. J. Am. Chem. Soc. 2010, 132, 3646-3647.
(12) Dai, R. J.; Ke, S. C. J. Phys. Chem. B 2007, 111, 2335-2346.
(13) Lu, T.-T.; Lai, S.-H.; Li, Y.-W.; Hsu, I. J.; Jang, L.-Y.; Lee, J.-F.; Chen, I. C.; Liaw, W.-F.
Inorg. Chem. 2011, 50, 5396-5406.

145
(14) Scheidt, W. R.; Durbin, S. M.; Sage, J. T. J. Inorg. Biochem. 2005, 99, 60-71.
(15) Zeng, W.; Silvernail, N. J.; Scheidt, W. R.; Sage, J. T. Nuclear Resonance Vibrational
Spectroscopy (NRVS). In Encyclopedia of Inorganic and Bioinorganic Chemistry; Scott, R.A.,
Lukehart, C.M., Eds.; John Wiley & Sons, Ltd: Chichester, U.K., 2007; pp 1-21.
(16) Tinberg, C. E.; Tonzetich, Z. J.; Wang, H.; Do, L. H.; Yoda, Y.; Cramer, S. P.; Lippard, S. J.
J. Am. Chem. Soc. 2010, 132, 18168-18176.
(17) Tonzetich, Z. J.; Wang, H.; Mitra, D.; Tinberg, C. E.; Do, L. H.; Jenney, F. E.; Adams, M.
W. W.; Cramer, S. P.; Lippard, S. J. J. Am. Chem. Soc. 2010, 132, 6914-6916.
(18) Skodje, K. M.; Williard, P. G.; Kim, E. Dalton Trans. 2012, 41, 7849-7851.
(19) Hung, M.-C.; Tsai, M.-C.; Lee, G.-H.; Liaw, W.-F. Inorg. Chem. 2006, 45, 6041-6047.
(20) Skodje, K. M.; Kwon, M.-Y.; Chung, S. W.; Kim, E. Chem. Sci. 2014, 5, 2374-2378.
(21) Hess, J. L.; Hsieh, C.-H.; Reibenspies, J. H.; Darensbourg, M. Y. Inorg. Chem. 2011, 50,
8541-8552.
(22) Reginato, N.; McCrory, C. T. C.; Pervitsky, D.; Li, L. J. Am. Chem. Soc. 1999, 121, 10217-
10218.
(23) Atkinson, F. L.; Blackwell, H. E.; Brown, N. C.; Connelly, N. G.; Crossley, J. G.; Orpen, A.
G.; Rieger, A. L.; Rieger, P. H. J. Chem. Soc., Dalton Trans. 1996, 3491-3502.
(24) Wang, R.; Wang, X.; Sundberg, E. B.; Nguyen, P.; Grant, G. P. G.; Sheth, C.; Zhao, Q.;
Herron, S.; Kantardjieff, K. A.; Li, L. Inorg. Chem. 2009, 48, 9779-9785.
(25) Martin, R. L.; Taylor, D. Inorg. Chem. 1976, 15, 2970-2976.
(26) Harrop, T. C.; Song, D.; Lippard, S. J. J. Am. Chem. Soc. 2006, 128, 3528-3529.
(27) Harrop, T. C.; Song, D.; Lippard, S. J. J. Inorg. Biochem. 2007, 101, 1730-1738.
(28) Lu, T.-T.; Chiou, S.-J.; Chen, C.-Y.; Liaw, W.-F. Inorg. Chem. 2006, 45, 8799-8806.
(29) Berto, T. C.; Hoffman, M. B.; Murata, Y.; Landenberger, K. B.; Alp, E. E.; Zhao, J.; Lehnert,
N. J. Am. Chem. Soc. 2011, 133, 16714-16717.
(30) Lorković, I.; Ford, P. C. J. Am. Chem. Soc. 2000, 122, 6516-6517.
(31) Roncaroli, F.; van Eldik, R.; Olabe, J. A. Inorg. Chem. 2005, 44, 2781-2790.

146
(32) Wang, J.; Schopfer, M. P.; Sarjeant, A. A. N.; Karlin, K. D. J. Am. Chem. Soc. 2009, 131,
450-451.
(33) Jo, D.-H.; Chiou, Y.-M.; Que, L. Inorg. Chem. 2001, 40, 3181-3190.
(34) Tonzetich, Z. J.; Héroguel, F.; Do, L. H.; Lippard, S. J. Inorg. Chem. 2011, 50, 1570-1579.
(35) Britovsek, G. J. P.; England, J.; White, A. J. P. Inorg. Chem. 2005, 44, 8125-8134.
(36) Fox, D.; Hall, J.; Plowman, R. Aust. J. Chem. 1962, 15, 235-241.
(37) Onggo, D.; Goodwin, H. Aust. J. Chem. 1991, 44, 1539-1551.
(38) König, E.; Ritter, G.; Madeja, K. J. Inorg. Nucl. Chem. 1981, 43, 2273-2280.
(39) Brown, C. A.; Pavlosky, M. A.; Westre, T. E.; Zhang, Y.; Hedman, B.; Hodgson, K. O.;
Solomon, E. I. J. Am. Chem. Soc. 1995, 117, 715-732.
(40) Berto, T. C.; Speelman, A. L.; Zheng, S.; Lehnert, N. Coord. Chem. Rev. 2013, 257, 244-
259.
(41) Vanin, A. F.; Serezhenkov, V. A.; Malenkova, I. V. Nitric Oxide 2001, 5, 166-175.
(42) Miki, E.; Motonaga, M.; Mizumachi, K.; Ishimori, T.; Katada, M. Bull. Chem. Soc. Jpn.
1982, 55, 2858-2862.
(43) Chiou, Y.-M.; Que, L. Inorg. Chem. 1995, 34, 3270-3278.
(44) Hess, J. L.; Hsieh, C.-H.; Brothers, S. M.; Hall, M. B.; Darensbourg, M. Y. J. Am. Chem.
Soc. 2011, 133, 20426-20434.
(45) Dessy, R. E.; Charkoudian, J. C.; Rheingold, A. L. J. Am. Chem. Soc. 1972, 94, 738-745.
(46) We note that, as suggested in the literature47, while DFT methods can at times give reasonably
accurate structural parameters for DNICs, multireference calculations may be better suited to
obtain a detailed understanding of the electronic structure of DNICs. However, such a treatment is
beyond the scope of this work.
(47) Liu, K.-Y.; Yu, J.-S. K. Inorg. Chem. 2014, 53, 10785-10787.
(48) Brothers, S. M.; Darensbourg, M. Y.; Hall, M. B. Inorg. Chem. 2011, 50, 8532-8540.
(49) This phenomenon appears to be correlated to the amount of Hartree-Fock exchange in the
functional. For example, a similar linearization was observed in structures optimized with TPSS0
and PBE0 (25% HF exchange; B3LYP = 20% HF exchange).
147
(50) Lehnert, N. Quantum Chemistry Centered Normal Coordinate Analysis (QCC-NCA):
Routine Application of Normal Coordinate Analysis for the Simulation of the Vibrational Spectra
of Large Molecules. In Encyclopedia of Inorganic Chemistry; Solomon, E.I., King, R.B., Scott,
R.A., Eds.; John Wiley & Sons, Ltd: Chichester, U.K. 2009; pp 123-140.
(51) Lehnert, N.; Sage, J. T.; Silvernail, N.; Scheidt, W. R.; Alp, E. E.; Sturhahn, W.; Zhao, J.
Inorg. Chem. 2010, 49, 7197-7215.
(52) Tsai, M.-C.; Tsai, F.-T.; Lu, T.-T.; Tsai, M.-L.; Wei, Y.-C.; Hsu, I. J.; Lee, J.-F.; Liaw, W.-
F. Inorg. Chem. 2009, 48, 9579-9591.
(53) Lu, T.-T.; Weng, T.-C.; Liaw, W.-F. Angew. Chem. Int. Ed. 2014, 53, 11562-11566.
(54) Li, M.; Bonnet, D.; Bill, E.; Neese, F.; Weyhermüller, T.; Blum, N.; Sellmann, D.; Wieghardt,
K. Inorg. Chem. 2002, 41, 3444-3456.
(55) Zheng, S.; Berto, T. C.; Dahl, E. W.; Hoffman, M. B.; Speelman, A. L.; Lehnert, N. J. Am.
Chem. Soc. 2013, 135, 4902-4905.
(56) Wright, A. M.; Hayton, T. W. Inorg. Chem. 2015, 54, 9330-9341.
(57) Haymore, B.; Feltham, R. D.; Morris, B. E.; Clement, R. A. Inorg. Synth. 1973, 14, 81-89.
(58) Chen, C.-H.; Ho, Y.-C.; Lee, G.-H. J. Organomet. Chem. 2009, 694, 3395-3400.
(59) Neese, F. Wiley Interdiscip. Rev.: Comput. Mol. Sci. 2012, 2, 73-78.
(60) Becke, A. D. J. Chem. Phys. 1993, 98, 5648-5652.
(61) Lee, C.; Yang, W.; Parr, R. G. Phys. Rev. B 1988, 37, 785-789.
(62) Tao, J.; Perdew, J. P.; Staroverov, V. N.; Scuseria, G. E. Phys. Rev. Lett. 2003, 91, 146401.
(63) Perdew, J. P.; Tao, J.; Staroverov, V. N.; Scuseria, G. E. J. Chem. Phys. 2004, 120, 6898-
6911.
(64) Becke, A. D. Phys. Rev. A 1988, 38, 3098-3100.
(65) Perdew, J. P. Phys. Rev. B 1986, 33, 8822-8824.
(66) Schäfer, A.; Horn, H.; Ahlrichs, R. J. Chem. Phys. 1992, 97, 2571-2577.
(67) Weigend, F.; Ahlrichs, R. PCCP 2005, 7, 3297-3305.
(68) Eichkorn, K.; Treutler, O.; Öhm, H.; Häser, M.; Ahlrichs, R. Chem. Phys. Lett. 1995, 240,
283-290.
148
(69) Eichkorn, K.; Weigend, F.; Treutler, O.; Ahlrichs, R. Theor. Chem. Acc. 1997, 97, 119-124.
(70) Neese, F.; Wennmohs, F.; Hansen, A.; Becker, U. Chem. Phys. 2009, 356, 98-109.
(71) Kirchner, B.; Wennmohs, F.; Ye, S.; Neese, F. Curr. Opin. Chem. Biol. 2007, 11, 134-141.
(72) Neese, F. J. Phys. Chem. Solids 2004, 65, 781-785.
(73) Varetto, U. Molekel 5.4
(74) Neese, F. Inorg. Chim. Acta 2002, 337, 181-192.
(75) Römelt, M.; Ye, S.; Neese, F. Inorg. Chem. 2009, 48, 784-785.
(76) Petrenko, T.; DeBeer George, S.; Aliaga-Alcalde, N.; Bill, E.; Mienert, B.; Xiao, Y.; Guo,
Y.; Sturhahn, W.; Cramer, S. P.; Wieghardt, K.; Neese, F. J. Am. Chem. Soc. 2007, 129, 11053-
11060.
(77) Petrenko, T.; Sturhahn, W.; Neese, F. Hyperfine Interact. 2008, 175, 165-174.
(78) Praneeth, V. K. K.; Näther, C.; Peters, G.; Lehnert, N. Inorg. Chem. 2006, 45, 2795-2811.
(79) Paulat, F.; Berto, T. C.; DeBeer George, S.; Goodrich, L.; Praneeth, V. K. K.; Sulok, C. D.;
Lehnert, N. Inorg. Chem. 2008, 47, 11449-11451.
(80) Frisch, M. J.; Trucks, G. W.; Schlegel, H. B.; Scuseria, G. E.; Robb, M. A.; Cheeseman, J.
R.; Scalmani, G.; Barone, V.; Mennucci, B.; Petersson, G. A.; Nakatsuji, H.; Caricato, M.; Li, X.;
Hratchian, H. P.; Izmaylov, A. F.; Bloino, J.; Zheng, G.; Sonnenberg, J. L.; Hada, M.; Ehara, M.;
Toyota, K.; Fukuda, R.; Hasegawa, J.; Ishida, M.; Nakajima, T.; Honda, Y.; Kitao, O.; Nakai, H.;
Vreven, T.; Montgomery Jr., J. A.; Peralta, J. E.; Ogliaro, F.; Bearpark, M. J.; Heyd, J.; Brothers,
E. N.; Kudin, K. N.; Staroverov, V. N.; Kobayashi, R.; Normand, J.; Raghavachari, K.; Rendell,
A. P.; Burant, J. C.; Iyengar, S. S.; Tomasi, J.; Cossi, M.; Rega, N.; Millam, N. J.; Klene, M.;
Knox, J. E.; Cross, J. B.; Bakken, V.; Adamo, C.; Jaramillo, J.; Gomperts, R.; Stratmann, R. E.;
Yazyev, O.; Austin, A. J.; Cammi, R.; Pomelli, C.; Ochterski, J. W.; Martin, R. L.; Morokuma,
K.; Zakrzewski, V. G.; Voth, G. A.; Salvador, P.; Dannenberg, J. J.; Dapprich, S.; Daniels, A. D.;
Farkas, Ö.; Foresman, J. B.; Ortiz, J. V.; Cioslowski, J.; Fox, D. J.; Gaussian, Inc.: Wallingford,
CT, USA, 2009.
(81) Allouche, A.; Pourcin, J. Spectrochim. Acta A 1993, 49, 571-580.
(82) McIntosh, D. F.; Peterson, M. R. QCPE 576

149
Chapter 5
Conclusions
The interaction of both ferric and ferrous hemes with NO to give low-spin {FeNO}n (n =
6-8) species has been extensively studied in the literature.1 While high-spin ferrous NO
complexes are well-understood2, the coordination chemistry of high-spin non-heme iron in other
oxidation states with NO remains relatively unexplored. Importantly, our group recently reported
that the complex [Fe2(BPMP)(OPr)(NO)2]2+ produces N2O upon reduction, suggesting that high-
spin {FeNO}8 (iron nitroxyl) complexes are competent intermediates for N-N bond formation.3
These species may in fact be key intermediates in bacterial NO reductases (NORs).4 However,
until the work presented here there were no examples of well-characterized high-spin {FeNO}8
complexes in the literature and thus the properties of these compounds were essentially
unknown. The generation, spectroscopic characterization, and reactivity of high-spin iron
nitrosyl and nitroxyl complexes has been the focus of this thesis.
5.1 Summary of Thesis
In Chapter 2, the first high-spin {FeNO}6-8 series was investigated. In the first section,
the {FeNO}7 complex [Fe(TMG3tren)(NO)]2+, which is the starting material for generation of the
{FeNO}6 and {FeNO}8 species, was characterized. As discussed in Section 2.2, the steric bulk of
the TMG3tren ligand prevents the disproportionation and formation of DNICs observed upon
150
reduction of other {FeNO}7 complexes.5 This allowed us to generate the first stable high-spin
{FeNO}8 model complex.6 Additionally, TMG3tren is a strongly donating ligand that can
stabilize metals in high oxidation states7-10, which allowed us to isolate and crystallize a rare
paramagnetic {FeNO}6 complex.11 These three compounds were then characterized by UV-
Visible, MCD, IR, NRVS, 1H NMR, and Mössbauer spectroscopies. By comparing the
spectroscopic parameters of these species and correlating them to DFT calculations, the
electronic structures of the {FeNO}6, {FeNO}7, and {FeNO}8 complexes were determined to be
high-spin Fe(IV)-NO, high-spin Fe(III)-NO, and high-spin Fe(II)-NO, respectively. This iron-
centered redox chemistry was contrasted to the NO-centered redox chemistry observed for low-
spin complexes.1,4 Importantly, -donation from the NO ligand to the iron center decreases
along the TMG3tren {FeNO}6-8 series, leading to a decrease in the covalency of the Fe-NO bond.
This indicates that reduction to the {FeNO}8 redox level can activate {FeNO}7 complexes,
which typically have highly covalent Fe-NO bonds and are therefore unreactive2 towards
protonation of the NO unit and show little other reactivity. Correspondingly, whereas the
TMG3tren {FeNO}7 complex is not appreciably basic, the {FeNO}8 species can be protonated to
give an {FeN(H)O}8 complex which is stable at low temperature as discussed in Section 2.4.
Characterization of this compound is still ongoing, but current spectroscopic evidence suggests
assignment of this species as an S = 2 {FeHNO}8 complex with a very covalent Fe-HNO
interaction. An analogous {FeN(Me)O}8 complex was also investigated and shown to have
essentially identical spectroscopic features.
In Chapter 3, the reduction of high-spin {FeNO}7 complexes without steric protection
was explored. In the first section, a series of ferrous nitrosyl complexes with the BMPA-PhO and
TPA ligand frameworks were generated. Depending on the substitution on the phenolate moiety,

151
the BMPA-PhO complexes can exist in solution as phenoxo-bridged dimers or as corresponding
monomeric species. Interestingly, the TPA complexes are high-spin in dichloromethane, but
exist as a mixture of high- and low-spin species in acetonitrile. The N-O stretching frequencies
of all of these complexes were also compared and used to demonstrate that the electronic
properties of the Fe-N-O unit of iron nitrosyl complexes are highly tunable.
As discussed in Chapter 2, reduction of the TMG3tren {FeNO}7 complex leads to a
decrease in Fe-NO bond covalency. {FeNO}8 complexes are therefore expected to be much more
reactive than their {FeNO}7 counterparts. Whereas in the TMG3tren {FeNO}8 system the
reactivity of the Fe-NO unit is suppressed by the steric bulk of the ligand (see Section 2.2), in the
compounds described in Chapter 3, no well-defined {FeNO}8 species is observed upon reduction
of the {FeNO}7 complexes. Instead, a variety of decomposition pathways were observed as
discussed in Sections 3.2 and 3.3. Previous work in our group showed that reduction of the
model complex [Fe2(BPMP)(OPr)(NO)2]2+ results in rapid and quantitative N2O formation.3 In
Section 3.3, it was demonstrated that N2O formation from this complex requires only a one-
electron reduction, rather than a two-electron reduction as previously proposed. As shown in
Section 3.2, reduction of the dimeric complexes [Fe(BMPA-PhO)(NO)]22+ and
[Fe(BPMP)(NO)2(OTf)2]+ in which the NO units are not adjacent does not result in similarly
rapid N2O formation, which implies that a diiron core with cis NO motifs is required for efficient
N2O production. In contrast, reduction of the monomeric complex [Fe(BMPA-
tBu2PhO)(NO)(OTf)] leads to rapid disproportionation and DNIC formation; this phenomenon
was also observed by Lippard and co-workers.5 Interestingly, the decomposition of the TPA
{FeNO}7 complex upon reduction follows an as-yet uncharacterized decomposition pathway that
does not lead to DNIC formation or N2O generation.
152
Finally, in Chapter 4 the synthesis and spectroscopic characterization of the {Fe(NO)2}9
DNIC [Fe(dmp)(NO)2]+ was reported.12 The synthesis of this complex was shown to proceed
from a ferrous precursor in an unusual reaction involving disproportionation of an {FeNO}7
species to yield the {Fe(NO)2}9 DNIC and a ferric species that is reduced by NO gas to
regenerate a ferrous complex, which can re-enter the reaction cycle. Interestingly, the
disproportionation reaction parallels the DNIC formation via disproportionation of {FeNO}8
complexes discussed in Chapters 2 and 3:
{FeNO}7 ½ {Fe(NO)2}9 + FeIII
{FeNO}8 ½ {Fe(NO)2}10 + FeII
The instability of {FeNO}8 complexes is not surprising, as discussed above. However, it is
unclear why the dmp {FeNO}7 complex is unstable. Note that Lippard and co-workers
demonstrated that an {Fe(NO)2}9 DNIC and a ferric compound can comproportionate to give an
{FeNO}7 complex.5 This suggests that mono- and di-nitrosyl iron species may generally be in
equilibrium, where the equilibrium usually lies to the left for {FeNO}7 complexes and to the
right for {FeNO}8 complexes.
Chemical reduction of the {Fe(NO)2}9 species [Fe(dmp)(NO)2]
+ afforded the analogous
{Fe(NO)2}10 DNIC [Fe(dmp)(NO)2], allowing us to characterize analogous DNICs in two
different oxidation states. Whereas the Mössbauer isomer shifts of the {Fe(NO)2}9 and
{Fe(NO)2}10 DNICs differ by only 0.1 mm/s, the NRVS spectra of these species are extremely
distinct. Notably, the energy of the out-of-plane Fe-N-O bending mode increased substantially in
the {Fe(NO)2}10 DNIC as compared to the {Fe(NO)2}
9 DNIC. QCC-NCA fits of the
experimental spectra show that this arises from an increase in the tetrahedral N(dmp)-Fe-N(O)
bending force constants in the {Fe(NO)2}10 species as compared to the {Fe(NO)2}
9 species,

153
resulting in a stiffening of the Fe(NO)2 core. These findings are explained by DFT calculations
which indicate that the reduction of the {Fe(NO)2}9 DNIC to the corresponding {Fe(NO)2}
10
species is iron centered and leads to an increase in -backbonding consistent with a previous
study by Ye and Neese.13
Interestingly, the bonding changes upon reduction of {Fe(NO)2}9 DNICs to the
{Fe(NO)2}10 redox level are distinct from those observed upon reduction of mononuclear
{FeNO}7 complexes to the {FeNO}8 form. This can be rationalized by considering the
differences in the bonding interactions in DNICs as compared to monomeric iron nitrosyl
complexes. As discussed in Chapter 2, in mononuclear high-spin {FeNO}7 compounds, the -
backbonding interaction is extremely weak and the Fe-NO bonding interaction is dominated by
-donation from the filled NO * orbitals into the d-orbitals of the iron center. Upon either
direct one-electron reduction of the iron center (as shown in Chapter 2) or upon a decrease in the
effective nuclear charge of the iron due to changes in coordination environment (as shown in
Chapter 3 and ref. 14), -donation from the NO ligand to the iron center decreases. This results
in a simultaneous weakening of the Fe-N(O) and N-O bonds without causing a change in -
backbonding. In contrast, in DNICs the Fe-NO bonding interaction consists of both -
backbonding (Fe-to-NO) and -donation (NO-to-Fe); in this case, the -backbonding interaction
increases in the {Fe(NO)2}10 DNIC as compared to the {Fe(NO)2}
9 DNIC, and the -donation
from NO to iron remains relatively unchanged. This means that in {Fe(NO)2}10 DNICs, the Fe-
N(O) bonds are stronger than in {Fe(NO)2}9 DNICs, whereas in {FeNO}8 complexes, the Fe-
N(O) bond is weaker than in the corresponding {FeNO}7 form. Importantly, this can be directly
observed in the NRVS spectra of these compounds. Note that in an approach developed by Ye
and Neese13,15, previous studies in the literature have used a combination of Mössbauer
154
spectroscopy and DFT to examine the differences in bonding in iron nitrosyls in different redox
states. The studies described in Chapters 2 and 4 demonstrate that NRVS can provide additional
and more direct evidence for the electronic structures proposed based on DFT calculations.
5.2 Future Directions
While it has been extremely useful in the isolation and characterization of the first high-
spin {FeNO}6-8 series, there are also some disadvantages associated with the TMG3tren ligand.
First, since TMG3tren is an extremely strong donor7 the {FeNO}7/8 redox couple for the NO
complex is relatively negative (1.34 V vs ferrocene). Consequently, reaction of the {FeNO}8
with NO gas leads to regeneration of the {FeNO}7 complex, presumably via outer-sphere
electron transfer. It thus remains unclear whether monomeric {FeNO}8 complexes can react with
either NO or with an {FeNO}7 to form an N-N bond. Note that this is an important point, since,
as discussed in Section 3.3, our recent results with [Fe2(BPMP)(OPr)(NO)2]2+ indicate that N2O
production can proceed from a mixed-valence {FeNO}7/{FeNO}8 dimer. Although N2O
formation may proceed directly from this dimer, it is also possible that reduction triggers loss of
either NO• or NO from one of the iron centers; the released NO moiety would then react with
the second Fe-NO unit. Furthermore, as discussed in Chapter 1, in several cases N2O production
has been proposed to arise from attack of NO• on a monomeric nitroxyl-like complex.16-18
A second challenge associated with using the TMG3tren ligand to investigate nitroxyl
complexes arises from the relatively high basicity of the guanidinium groups of this ligand.7 We
currently hypothesize that at least part of the decomposition of the {FeHNO}8 complex can be
attributed to transfer of the proton from the bound HNO to one of the TMG3tren guanidinium

155
groups. Generation of a more stable HNO complex will require use of a less basic ligand that still
maintains sufficient steric bulk to prevent disproportionation reactions in corresponding
{FeNO}8 complexes. However, since the use of a sterically bulky ligand may prevent reactivity,
an alternative synthetic pathway for a ferrous HNO complex should be considered.
Unfortunately, the direct generation of synthetic HNO model complexes from ferrous precursors
is challenging because, while several aqueous HNO donors (e.g. Piloty’s acid, Angeli’s salt)
exist, there are no reported HNO donors that can be used in organic solution. Alternatively, it
may be possible to generate an {FeRNO}8 complex directly by addition of a nitrosoalkane (for
example, 2-methyl-2-nitrosopropane or nitrosobenzene, both of which are commercially
available) to a ferrous precursor, thereby avoiding the challenge of creating a stable {FeNO}8
complex. Since, as discussed in Section 2.4, the TMG3tren {FeHNO}8 and {FeMeNO}8
complexes have nearly identical spectroscopic parameters, an {FeRNO}8 could then be used as a
surrogate for an {FeHNO}8 complex in reactivity and stability studies (assuming that the
protonated {FeNO}8 species is N-protonated on the NO moiety). Note, however, that it is
currently unclear whether high-spin HNO and RNO complexes are generally unstable, and it
may be necessary to add the nitrosoalkane at low temperature to avoid decomposition.
Additional studies should also focus on the reactivity of the monomeric complexes
[Fe(BMPA-tBu2PhO)(NO)](OTf) and [Fe(TPA)(NO)(OTf)](OTf). The decomposition of these
complexes upon reduction has so far been exclusively studied by vibrational spectroscopy. The
vibrational data indicate that reduction of [Fe(BMPA-tBu2PhO)(NO)](OTf) yields, in part, an
{Fe(NO)2}10 DNIC but it is unclear whether other products are formed. For example, the
decomposition of reduced [Fe(TPA)(NO)(OTf)](OTf) clearly follows a different pathway that
does not lead to DNIC formation. Further 1H NMR (and, if possible, Mössbauer experiments)

156
could be insightful. Additionally, preliminary experiments suggest that unlike most {Fe(NO)2}10
DNICs, the DNIC formed upon reduction of [Fe(BMPA-tBu2PhO)(NO)](OTf) is unstable and
decays over time to slowly produce N2O, which may merit further investigation.
Finally, further studies of the dimeric BPMP model compounds discussed in Section 3.3
are needed. In addition to mechanistic studies of N2O production from
[Fe2(BPMP)(OPr)(NO)2]2+, it will be important to determine whether the bis-carboxylato
complex [Fe2(BPMP)(OPr)2(NO)2]+ or the complex [Fe2(BPMP)(NO)2]
3+ which does not contain
a bridging carboxylate moiety also produce N2O upon reduction, or whether this reactivity is
specific to the mono--carboxylato complex. It should also be noted that experimental studies of
flavodiiron proteins clearly demonstrate that it is possible for an [{FeNO}7]2 dimer to decay and
release N2O. Additionally, in at least one case, formation of a ferric species has been observed
upon addition of NO to a monomeric ferrous precursor, implying that it is possible for an
{FeNO}7 species to release NO.19 Exploration of iron nitrosyl and nitroxyl complexes with
different ligand platforms is therefore merited.
5.3 References
(1) Lehnert, N.; Scheidt, W. R.; Wolf, M. W. Struct. Bond. 2014, 154, 155-223.
(2) Berto, T. C.; Speelman, A. L.; Zheng, S.; Lehnert, N. Coord. Chem. Rev. 2013, 257, 244-
259.
(3) Zheng, S.; Berto, T. C.; Dahl, E. W.; Hoffman, M. B.; Speelman, A. L.; Lehnert, N. J. Am.
Chem. Soc. 2013, 135, 4902-4905.
(4) Speelman, A. L.; Lehnert, N. Acc. Chem. Res. 2014, 47, 1106-1116.
(5) Tonzetich, Z. J.; Héroguel, F.; Do, L. H.; Lippard, S. J. Inorg. Chem. 2011, 50, 1570-1579.
(6) Speelman, A. L.; Lehnert, N. Angew. Chem. Int. Ed. 2013, 52, 12283-12287.

157
(7) Wittmann, H.; Raab, V.; Schorm, A.; Plackmeyer, J.; Sundermeyer, J. Eur. J. Inorg. Chem.
2001, 2001, 1937-1948.
(8) England, J.; Farquhar, E. R.; Guo, Y.; Cranswick, M. A.; Ray, K.; Munck, E.; Que, L. Inorg.
Chem. 2011, 50, 2885-2896.
(9) England, J.; Guo, Y.; Farquhar, E. R.; Young Jr, V. G.; Münck, E.; Que Jr, L. J. Am. Chem.
Soc. 2010, 132, 8635-8644.
(10) England, J.; Martinho, M.; Farquhar, E. R.; Frisch, J. R.; Bominaar, E. L.; Münck, E.; Que,
L. Angew. Chem. Int. Ed. 2009, 48, 3622-3626.
(11) Speelman, A. L.; Zhang, B.; Krebs, C.; Lehnert, N. Angew. Chem. Int. Ed. 2016.
(12) Speelman, A. L.; Zhang, B.; Silakov, A.; Skodje, K. M.; Alp, E. E.; Zhao, J.; Hu, M. Y.;
Kim, E.; Krebs, C.; Lehnert, N. 2016, Submitted.
(13) Ye, S.; Neese, F. J. Am. Chem. Soc. 2010, 132, 3646-3647.
(14) Berto, T. C.; Hoffman, M. B.; Murata, Y.; Landenberger, K. B.; Alp, E. E.; Zhao, J.;
Lehnert, N. J. Am. Chem. Soc. 2011, 133, 16714-16717.
(15) Ye, S.; Price, J. C.; Barr, E. W.; Green, M. T.; Bollinger, J. M.; Krebs, C.; Neese, F. J. Am.
Chem. Soc. 2010, 132, 4739-4751.
(16) Hayashi, T.; Miner, K. D.; Yeung, N.; Lin, Y.-W.; Lu, Y.; Moënne-Loccoz, P.
Biochemistry 2011, 50, 5939-5947.
(17) Hayashi, T.; Caranto, J. D.; Matsumura, H.; Kurtz, D. M.; Moënne-Loccoz, P. J. Am.
Chem. Soc. 2012, 134, 6878-6884.
(18) Jiang, Y.; Hayashi, T.; Matsumura, H.; Do, L. H.; Majumdar, A.; Lippard, S. J.; Moënne-
Loccoz, P. J. Am. Chem. Soc. 2014, 136, 12524-12527.
(19) Jo, D.-H.; Chiou, Y.-M.; Que, L. Inorg. Chem. 2001, 40, 3181-3190.