Embed Size (px)
Citation preview
Investigation of Swelling and Elastic Property Changes Resultingfrom CO2 Injection into Cuboid Coal SpecimensBrijes Mishra* and Bongani Dlamini
Department of Mining Engineering, West Virginia University, Morgantown, West Virginia 26506, United States
ABSTRACT: To study and quantify the effect of CO2 injection on sorption-induced strain (swelling) and coal elastic properties,specifically ultrasonic velocity (Vp and Vs) and elastic moduli, an experimental approach was followed. Two cuboid coalspecimens with approximate dimensions of 25 cm (9.8 in.) × 17 cm (6.7 in.) × 6 cm (2.4 in.) were prepared. The coal specimensused were from the Lower Sunnyside Coal Seam of the Books Cliffs Coalfields in Utah. A specially designed steel frame was usedto contain the specimens. Two extreme cases were tested using the specimens. For case one, a high injection pressure and a highconfining pressure were used, and for case two, both injection pressure and confining pressure were dramatically decreased. Theconventional pulse transmission method was used to determine P- and S-wave velocities. This method uses transducers to sendan ultrasonic wave through the specimen, where corresponding transducers on the other end of the specimen then pick up thesignal. Pre-injection measurements of ultrasonic velocity (Vp and Vs) were taken using the OYO New Sonic-Viewer. From Vp andVs, other pre-injection properties, such as Poisson’s ratio and shear, bulk, and Young’s moduli (dynamic), were calculated. Digitaldeformation gauges were also strategically placed on the specimens to measure strain during the injection phase. CO2 wasinjected into the first specimen at a high confining pressure and a high injection pressure, while both confining and injectionpressures were dramatically lowered. Injection proceeded for 5 days for each of the specimens (25 h of actual injection). Anincrease in compressional velocity (as high as 21%) was measured at 12.41 MPa confining pressure and 4.14 MPa injectionpressure. Because the dynamic elastic moduli are influenced by velocity, increases in elastic moduli were also observed withvelocity increases. Adsorption strain as high as 0.9% was measured at 12.41 MPa confining pressure and 4.14 MPa injectionpressure. It was also noted that significant changes in confining and injection pressures influenced the adsorption strain rate aswell as the rate of change of compressional velocity and elastic moduli. At high injection pressure (4.14 MPa) and high confiningpressure (12.41 MPa), adsorption strain, compressional velocity, and bulk modulus all had high rates of change. The oppositewas observed at low injection pressure (1.8 MPa) and low confining pressure (1.8 MPa), with adsorption strain, compressionalvelocity, and bulk modulus all having low rates of change.
■ INTRODUCTIONBackground. Carbon dioxide capture and storage (CCS) is
viewed as a potential solution to reducing CO2 emissions.Unmineable coal seams have been identified as a possible CO2
geologic storage formation. There are a couple of reasons thatmake coal an attractive CO2 geologic storage formation.Unmineable coal seams are considered to be uneconomical andare therefore left in their natural state. Coal seams are alsoattractive because of the fact that methane is removed from theseams in a similar process. Coalbeds typically contain largeamounts of methane-rich gas that is adsorbed onto the surfaceof the coal. The current practice for recovering coalbedmethane is to depressurize the bed, usually by pumping waterout of the reservoir. An alternative approach of displacingmethane is to inject CO2 into the bed. Tests have shown theadsorption rate for CO2 to be approximately twice that ofmethane, giving it the potential to efficiently displace methaneand remain stored in the bed. CO2 recovery of coalbedmethane has been demonstrated in limited field tests. In ourcurrent research, we concentrated our effort at the microscopiclevel to understand the effect of injection on adsorption andswelling of the coal specimen. Understanding adsorption andswelling of coal is integral to the stability of the overlying strata.This information is crucial to ensure that carbon storage willnot affect the geologic integrity of an underground formation as
well as surface structures and that CO2 storage is safe andenvironmentally acceptable.1
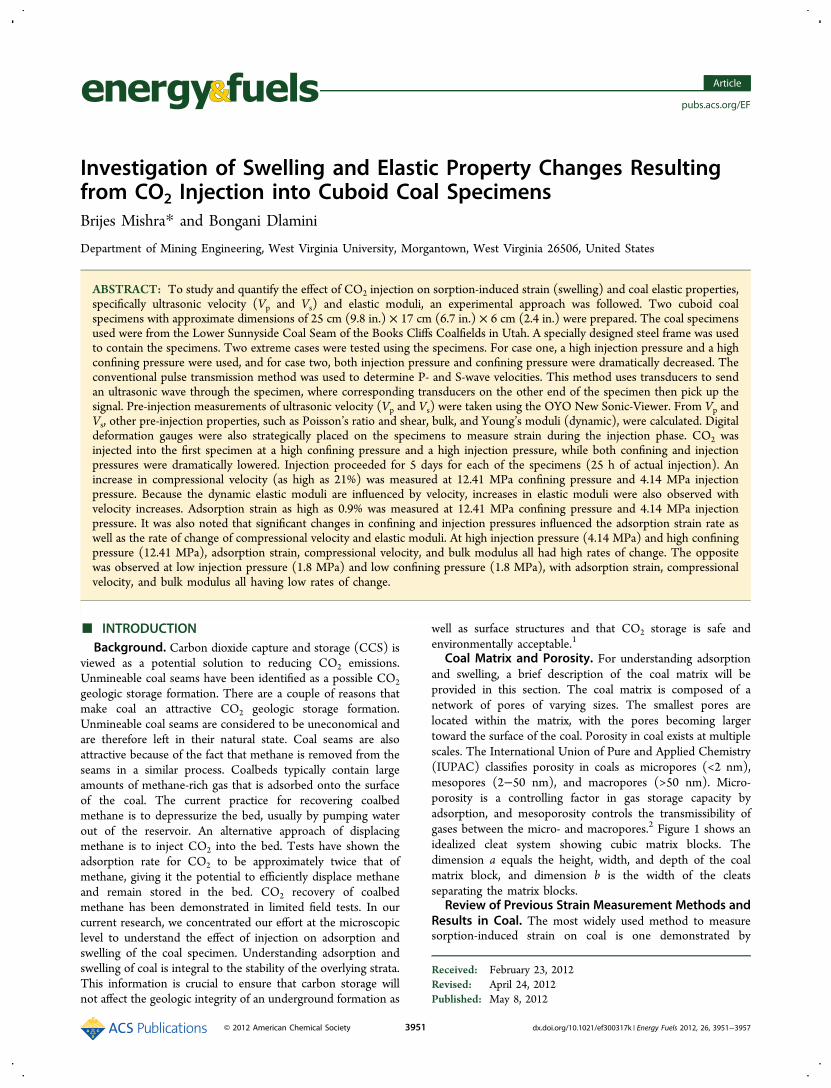
Coal Matrix and Porosity. For understanding adsorptionand swelling, a brief description of the coal matrix will beprovided in this section. The coal matrix is composed of anetwork of pores of varying sizes. The smallest pores arelocated within the matrix, with the pores becoming largertoward the surface of the coal. Porosity in coal exists at multiplescales. The International Union of Pure and Applied Chemistry(IUPAC) classifies porosity in coals as micropores (<2 nm),mesopores (2−50 nm), and macropores (>50 nm). Micro-porosity is a controlling factor in gas storage capacity byadsorption, and mesoporosity controls the transmissibility ofgases between the micro- and macropores.2 Figure 1 shows anidealized cleat system showing cubic matrix blocks. Thedimension a equals the height, width, and depth of the coalmatrix block, and dimension b is the width of the cleatsseparating the matrix blocks.
Review of Previous Strain Measurement Methods andResults in Coal. The most widely used method to measuresorption-induced strain on coal is one demonstrated by
Received: February 23, 2012Revised: April 24, 2012Published: May 8, 2012
Article
pubs.acs.org/EF
© 2012 American Chemical Society 3951 dx.doi.org/10.1021/ef300317k | Energy Fuels 2012, 26, 3951−3957
Harpalani and Schraufnagel.4 Strain gauges are attached to thesurfaces of a cylindrical coal specimen, one each for axial andradial strains, 180° apart. A coal specimen measuring 1.5 in. indiameter and 3 in. in length is then placed into a pressure cell.The strain gauges are connected to the strain indicators outsidethe cell by passing the connecting wires through O-rings usedto seal the pressure cell. Other measuring methods used arebased on this one, with slight modifications. Some researchershave reported that adsorption-induced strain varies linearly withthe gas pressure for both CO2 and methane.3 Harpalani andSchraufnagel have reported that sorption-induced coal straindid not necessarily vary linearly with the gas pressure but mightbe nonlinear with a decreasing gas pressure.4 A differentmethod for measuring strain in coal specimens was introducedby Robertson.5 The apparatus used included an opticalmicroscope mounted to a pressure vessel with transparentview ports through which changes in coal length could beoptically detected.Review of Previous Ultrasonic Velocity Measurement
Methods and Results in Coal. Some published studiessuggest that the injection of CO2 into coal results in changes inultrasonic velocity (Vp and Vs), which, in turn, results inacoustic impedance changes in the coal.6 Xue and Oshumiperformed laboratory measurements on the coal matrix swellingduring CO2 injection, by monitoring strain and P-wave velocitychanges.6 Cylindrical coal specimens were drilled from largeblocks collected from the Kushiro coal mine, Hokkaido, Japan.Larger swelling strains were observed because of CO2adsorption compared to N2 adsorption at the same coalspecimen. A significant (10% increase at 2.5 MPa and perhapsup to 12.7% at 12 MPa) increase in P-wave velocity was alsoobserved as a result of the coal matrix swelling. Nishomoto7
also observed an increase (2.2% at 12 MPa) in P-wave velocity.On the other hand, using seismic detection, McCrank8
observed that CO2 injection into the Ardley coal, Calgary,Alberta, Canada, resulted in a decrease (about 10%) in P-wavevelocity, attributed to increased coal plasticity. Field tests usingvertical seismic profiling did not reveal any significant changesin acoustic properties, such as velocity.9
■ OBJECTIVE OF STUDY
The behavior of coal in response to CO2 injection is not yetfully understood or well-documented. There is a need tounderstand and quantify the physical changes of coal inresponse to CO2 injection. These physical changes includeproperties such as strain (swelling), ultrasonic velocity (Vp andVs), and elastic moduli. Understanding the physical changesundergone by coal during CO2 injection is crucial in evaluatingthe efficiency and integrity of coal as a potential geologicstorage formation. The general purpose of this study is to gainan understanding of the behavior of coal in response to CO2injection by monitoring and quantifying physical changes in thecoal. The specific objectives are as follows: (1) Set up a physicalmodel and inject CO2 into a coal specimen. (2) Measure thestrain and ultrasonic velocity (Vp and Vs) during pre-injectionand injection phases. (3) Calculate/determine elastic moduliduring pre-injection and injection phases. (4) Compare pre-injection measurements with injection phase measurements.
■ EXPERIMENTAL PROCEDURECoal Description. The coal specimen used was from the Lower
Sunnyside Coalbed of the Books Cliffs Coalfields in Utah. Coal fromthe Book Cliffs field generally has low ash content, low to moderatesulfur contents, and high heat contents. The rank of the coal rangesfrom high-volatile C bituminous to high-volatile A bituminous. TheSunnyside coal is known for its good coking quality. Mean proximate
analytical values in Table 1 show the Lower Sunnyside bed to be lowin sulfur content (0.8%), low in ash content (6.5%), low in moisturecontent (5.33%), and high in heating value (29 644 kJ/kg) on an as-received basis.10
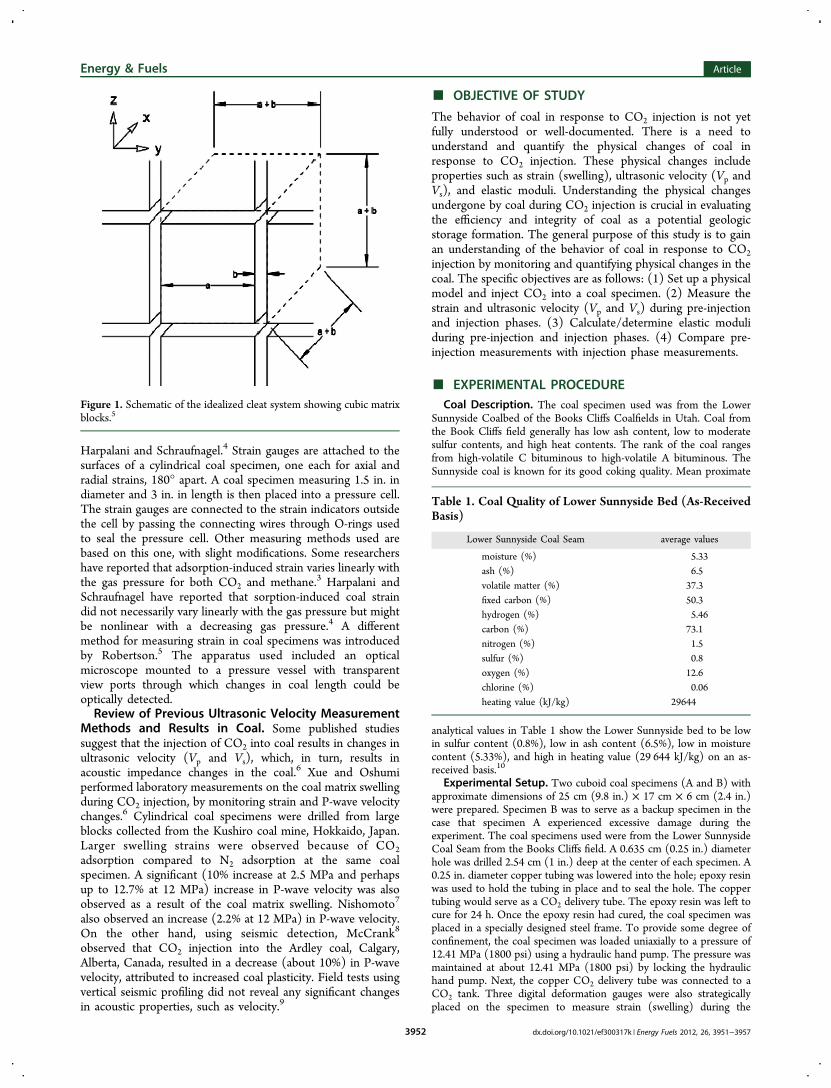
Experimental Setup. Two cuboid coal specimens (A and B) withapproximate dimensions of 25 cm (9.8 in.) × 17 cm × 6 cm (2.4 in.)were prepared. Specimen B was to serve as a backup specimen in thecase that specimen A experienced excessive damage during theexperiment. The coal specimens used were from the Lower SunnysideCoal Seam from the Books Cliffs field. A 0.635 cm (0.25 in.) diameterhole was drilled 2.54 cm (1 in.) deep at the center of each specimen. A0.25 in. diameter copper tubing was lowered into the hole; epoxy resinwas used to hold the tubing in place and to seal the hole. The coppertubing would serve as a CO2 delivery tube. The epoxy resin was left tocure for 24 h. Once the epoxy resin had cured, the coal specimen wasplaced in a specially designed steel frame. To provide some degree ofconfinement, the coal specimen was loaded uniaxially to a pressure of12.41 MPa (1800 psi) using a hydraulic hand pump. The pressure wasmaintained at about 12.41 MPa (1800 psi) by locking the hydraulichand pump. Next, the copper CO2 delivery tube was connected to aCO2 tank. Three digital deformation gauges were also strategicallyplaced on the specimen to measure strain (swelling) during the
Figure 1. Schematic of the idealized cleat system showing cubic matrixblocks.5
Table 1. Coal Quality of Lower Sunnyside Bed (As-ReceivedBasis)
Lower Sunnyside Coal Seam average values
moisture (%) 5.33ash (%) 6.5volatile matter (%) 37.3fixed carbon (%) 50.3hydrogen (%) 5.46carbon (%) 73.1nitrogen (%) 1.5sulfur (%) 0.8oxygen (%) 12.6chlorine (%) 0.06heating value (kJ/kg) 29644
Energy & Fuels Article
dx.doi.org/10.1021/ef300317k | Energy Fuels 2012, 26, 3951−39573952
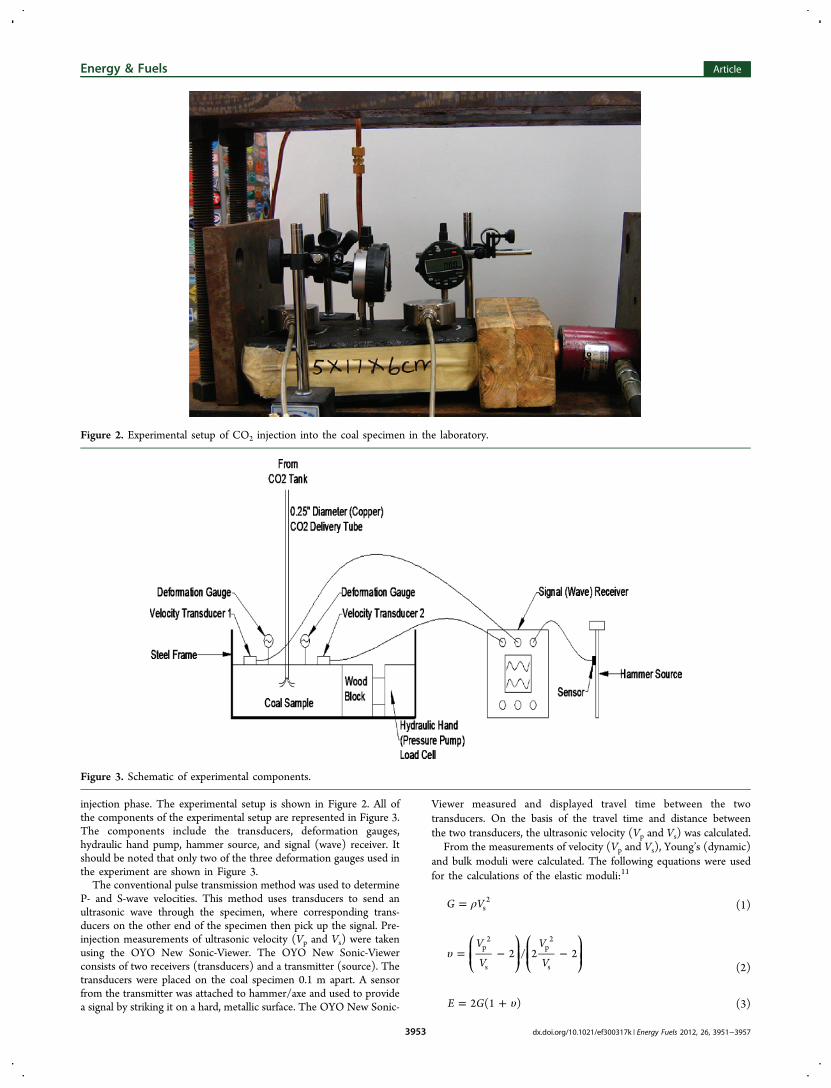
injection phase. The experimental setup is shown in Figure 2. All ofthe components of the experimental setup are represented in Figure 3.The components include the transducers, deformation gauges,hydraulic hand pump, hammer source, and signal (wave) receiver. Itshould be noted that only two of the three deformation gauges used inthe experiment are shown in Figure 3.The conventional pulse transmission method was used to determine
P- and S-wave velocities. This method uses transducers to send anultrasonic wave through the specimen, where corresponding trans-ducers on the other end of the specimen then pick up the signal. Pre-injection measurements of ultrasonic velocity (Vp and Vs) were takenusing the OYO New Sonic-Viewer. The OYO New Sonic-Viewerconsists of two receivers (transducers) and a transmitter (source). Thetransducers were placed on the coal specimen 0.1 m apart. A sensorfrom the transmitter was attached to hammer/axe and used to providea signal by striking it on a hard, metallic surface. The OYO New Sonic-
Viewer measured and displayed travel time between the twotransducers. On the basis of the travel time and distance betweenthe two transducers, the ultrasonic velocity (Vp and Vs) was calculated.
From the measurements of velocity (Vp and Vs), Young’s (dynamic)and bulk moduli were calculated. The following equations were usedfor the calculations of the elastic moduli:11
ρ=G Vs2 (1)
υ = − −⎛⎝⎜⎜
⎞⎠⎟⎟
⎛⎝⎜⎜
⎞⎠⎟⎟
V
V
V
V2 / 2 2p
2
s
p2
s (2)
υ= +E G2 (1 ) (3)
Figure 2. Experimental setup of CO2 injection into the coal specimen in the laboratory.
Figure 3. Schematic of experimental components.
Energy & Fuels Article
dx.doi.org/10.1021/ef300317k | Energy Fuels 2012, 26, 3951−39573953
υ= −KE3
(1 2 )(4)
where ρ is the density, G is the shear modulus, Vp is the shear wavevelocity, and Vs is the compressional wave velocity. Dynamic Young’smodulus E was calculated using the shear modulus and dynamicPoisson’s ratio (υ). The bulk modulus K was calculated using dynamicYoung’s modulus E and Poisson’s ratio (υ). The laboratory-measureddensity of the Lower Sunnyside Coal ranges between 1340 and 1400kg/m3. On the basis of this range, the highest density of 1400 kg/m3
was used for the calculations. The measured and calculated changes incoal properties because of CO2 injection in specimens A and B areshown in Tables 2 and 3. Time zero measurements are the pre-injection measurements.
Injection Cycles. The CO2 injection phase commenced for a totalof 5 days at an injection pressure of 4.14 MPa (600 psi). Coalspecimen A was injected for a continuous 5 h a day; injection wouldthen be completely stopped and resumed the following day for another5 h period. This cycle was repeated for 5 days, resulting in 25 h ofactual injection. After 25 h of injection at 4.14 MPa (600 psi), majorcracks developed in specimen A and excessive leakage was observed.As a result, no further injection was conducted beyond 25 h. Damagedspecimen A was replaced with specimen B, and the same experimentalprocedure previously described was followed. All experimentalparameters where kept the same with the exception of the injectionpressure and confining pressure, which were both decreased. Theinjection pressure was dropped from 4.14 MPa (600 psi) to 1.8 MPa(200 psi), and the confining pressure was dropped from 12.41 MPa(1800 psi) to 1.8 MPa (200 psi).The 5 h−5 day injection cycle was selected for two reasons.
Previous researchers, such as Robertson, have obtained satisfactorycoal strain measurements in cylindrical specimens using a 5 h injectioncycle.5 Second, alternating periods of injection and non-injectionallows for adequate CO2 adsorption by the coal.
■ RESULTSExperimental Results. During the injection phase, strain
(swelling) and ultrasonic (Vp and Vs) measurements wereperformed, as described in the Experimental Procedure. Itshould be noted that the apparatus used to measure signaltravel time can experience a time delay of approximately 100 μs.
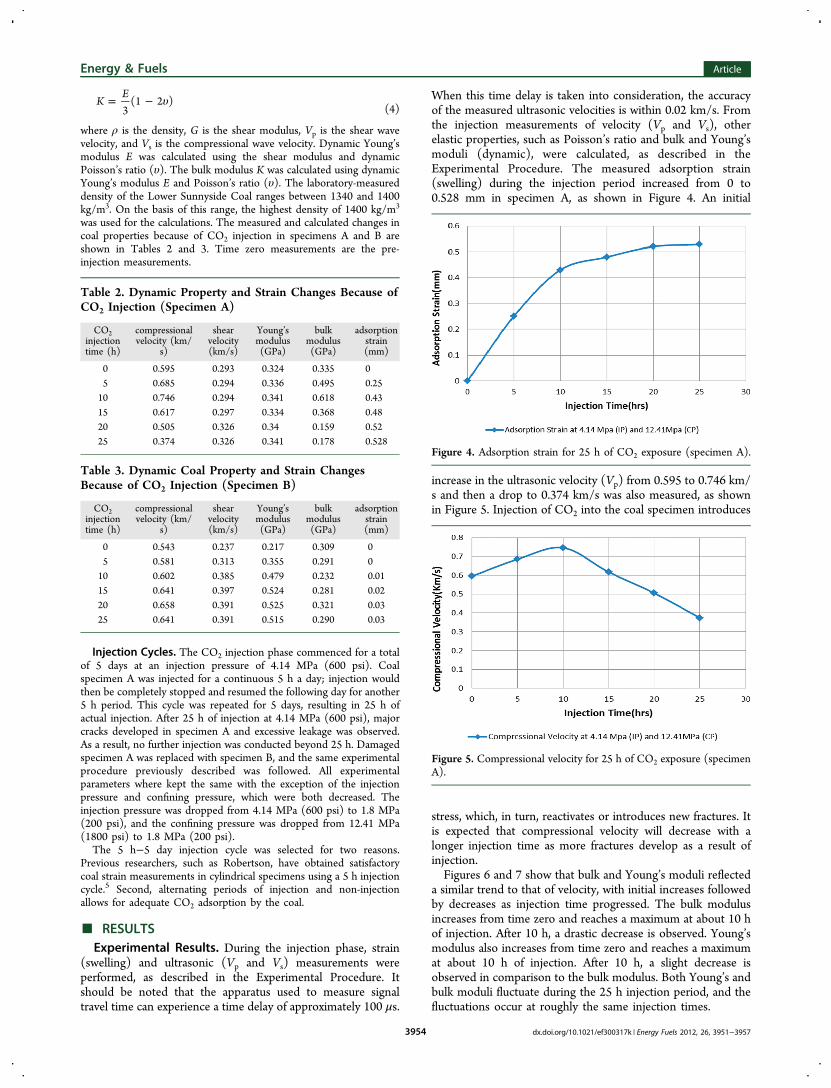
When this time delay is taken into consideration, the accuracyof the measured ultrasonic velocities is within 0.02 km/s. Fromthe injection measurements of velocity (Vp and Vs), otherelastic properties, such as Poisson’s ratio and bulk and Young’smoduli (dynamic), were calculated, as described in theExperimental Procedure. The measured adsorption strain(swelling) during the injection period increased from 0 to0.528 mm in specimen A, as shown in Figure 4. An initial
increase in the ultrasonic velocity (Vp) from 0.595 to 0.746 km/s and then a drop to 0.374 km/s was also measured, as shownin Figure 5. Injection of CO2 into the coal specimen introduces
stress, which, in turn, reactivates or introduces new fractures. Itis expected that compressional velocity will decrease with alonger injection time as more fractures develop as a result ofinjection.Figures 6 and 7 show that bulk and Young’s moduli reflected
a similar trend to that of velocity, with initial increases followedby decreases as injection time progressed. The bulk modulusincreases from time zero and reaches a maximum at about 10 hof injection. After 10 h, a drastic decrease is observed. Young’smodulus also increases from time zero and reaches a maximumat about 10 h of injection. After 10 h, a slight decrease isobserved in comparison to the bulk modulus. Both Young’s andbulk moduli fluctuate during the 25 h injection period, and thefluctuations occur at roughly the same injection times.
Table 2. Dynamic Property and Strain Changes Because ofCO2 Injection (Specimen A)
CO2injectiontime (h)
compressionalvelocity (km/
s)
shearvelocity(km/s)
Young’smodulus(GPa)
bulkmodulus(GPa)
adsorptionstrain(mm)
0 0.595 0.293 0.324 0.335 05 0.685 0.294 0.336 0.495 0.2510 0.746 0.294 0.341 0.618 0.4315 0.617 0.297 0.334 0.368 0.4820 0.505 0.326 0.34 0.159 0.5225 0.374 0.326 0.341 0.178 0.528
Table 3. Dynamic Coal Property and Strain ChangesBecause of CO2 Injection (Specimen B)
CO2injectiontime (h)
compressionalvelocity (km/
s)
shearvelocity(km/s)
Young’smodulus(GPa)
bulkmodulus(GPa)
adsorptionstrain(mm)
0 0.543 0.237 0.217 0.309 05 0.581 0.313 0.355 0.291 010 0.602 0.385 0.479 0.232 0.0115 0.641 0.397 0.524 0.281 0.0220 0.658 0.391 0.525 0.321 0.0325 0.641 0.391 0.515 0.290 0.03
Figure 4. Adsorption strain for 25 h of CO2 exposure (specimen A).
Figure 5. Compressional velocity for 25 h of CO2 exposure (specimenA).
Energy & Fuels Article
dx.doi.org/10.1021/ef300317k | Energy Fuels 2012, 26, 3951−39573954
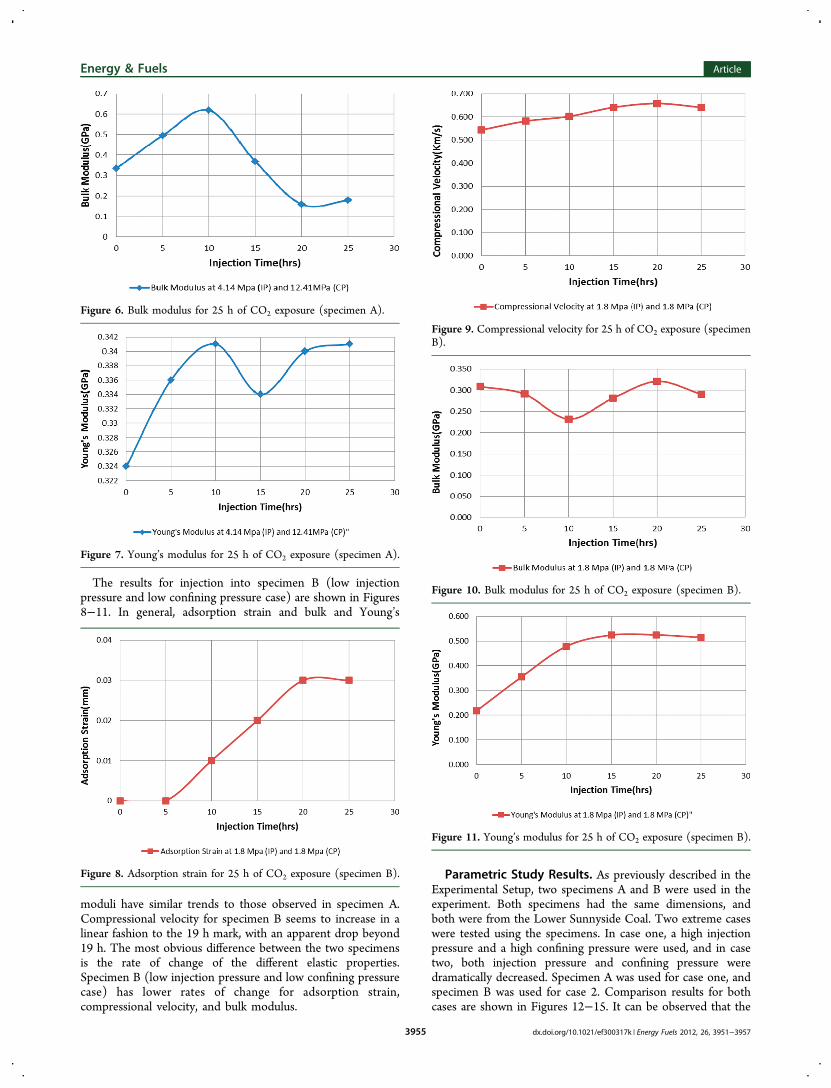
The results for injection into specimen B (low injectionpressure and low confining pressure case) are shown in Figures8−11. In general, adsorption strain and bulk and Young’s
moduli have similar trends to those observed in specimen A.Compressional velocity for specimen B seems to increase in alinear fashion to the 19 h mark, with an apparent drop beyond19 h. The most obvious difference between the two specimensis the rate of change of the different elastic properties.Specimen B (low injection pressure and low confining pressurecase) has lower rates of change for adsorption strain,compressional velocity, and bulk modulus.
Parametric Study Results. As previously described in theExperimental Setup, two specimens A and B were used in theexperiment. Both specimens had the same dimensions, andboth were from the Lower Sunnyside Coal. Two extreme caseswere tested using the specimens. In case one, a high injectionpressure and a high confining pressure were used, and in casetwo, both injection pressure and confining pressure weredramatically decreased. Specimen A was used for case one, andspecimen B was used for case 2. Comparison results for bothcases are shown in Figures 12−15. It can be observed that the
Figure 6. Bulk modulus for 25 h of CO2 exposure (specimen A).
Figure 7. Young’s modulus for 25 h of CO2 exposure (specimen A).
Figure 8. Adsorption strain for 25 h of CO2 exposure (specimen B).
Figure 9. Compressional velocity for 25 h of CO2 exposure (specimenB).
Figure 10. Bulk modulus for 25 h of CO2 exposure (specimen B).
Figure 11. Young’s modulus for 25 h of CO2 exposure (specimen B).
Energy & Fuels Article
dx.doi.org/10.1021/ef300317k | Energy Fuels 2012, 26, 3951−39573955
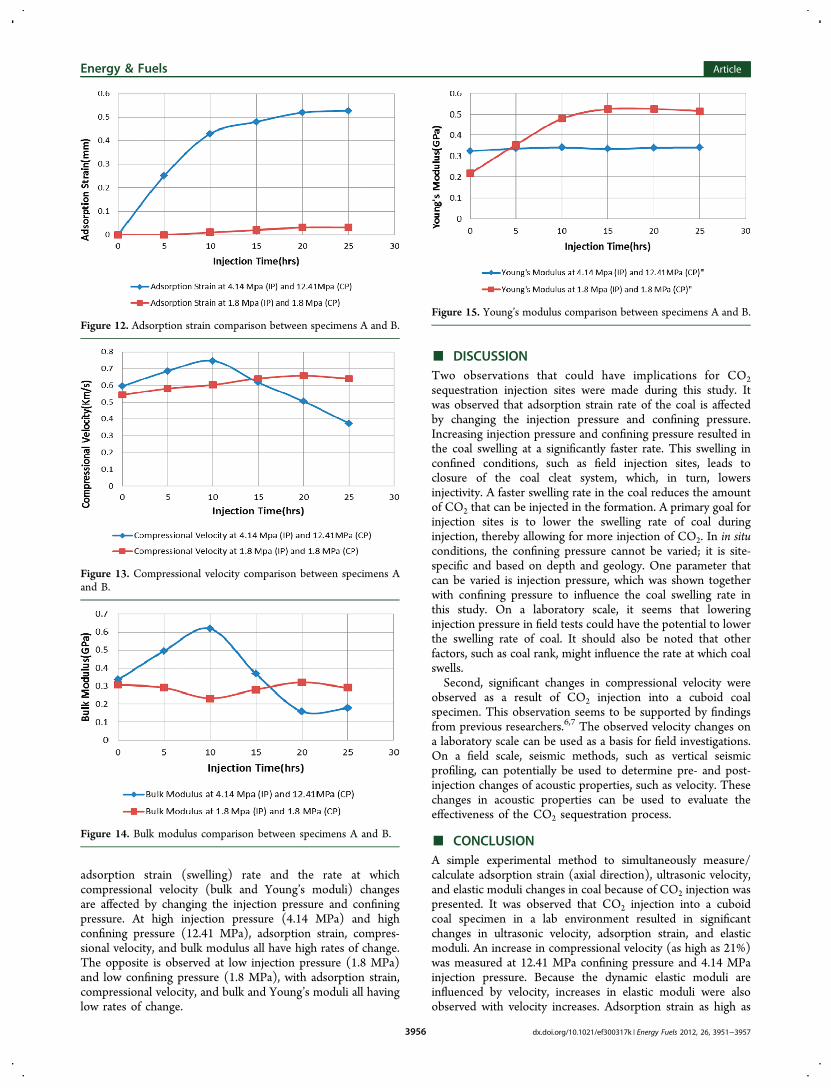
adsorption strain (swelling) rate and the rate at whichcompressional velocity (bulk and Young’s moduli) changesare affected by changing the injection pressure and confiningpressure. At high injection pressure (4.14 MPa) and highconfining pressure (12.41 MPa), adsorption strain, compres-sional velocity, and bulk modulus all have high rates of change.The opposite is observed at low injection pressure (1.8 MPa)and low confining pressure (1.8 MPa), with adsorption strain,compressional velocity, and bulk and Young’s moduli all havinglow rates of change.
■ DISCUSSIONTwo observations that could have implications for CO2sequestration injection sites were made during this study. Itwas observed that adsorption strain rate of the coal is affectedby changing the injection pressure and confining pressure.Increasing injection pressure and confining pressure resulted inthe coal swelling at a significantly faster rate. This swelling inconfined conditions, such as field injection sites, leads toclosure of the coal cleat system, which, in turn, lowersinjectivity. A faster swelling rate in the coal reduces the amountof CO2 that can be injected in the formation. A primary goal forinjection sites is to lower the swelling rate of coal duringinjection, thereby allowing for more injection of CO2. In in situconditions, the confining pressure cannot be varied; it is site-specific and based on depth and geology. One parameter thatcan be varied is injection pressure, which was shown togetherwith confining pressure to influence the coal swelling rate inthis study. On a laboratory scale, it seems that loweringinjection pressure in field tests could have the potential to lowerthe swelling rate of coal. It should also be noted that otherfactors, such as coal rank, might influence the rate at which coalswells.Second, significant changes in compressional velocity were
observed as a result of CO2 injection into a cuboid coalspecimen. This observation seems to be supported by findingsfrom previous researchers.6,7 The observed velocity changes ona laboratory scale can be used as a basis for field investigations.On a field scale, seismic methods, such as vertical seismicprofiling, can potentially be used to determine pre- and post-injection changes of acoustic properties, such as velocity. Thesechanges in acoustic properties can be used to evaluate theeffectiveness of the CO2 sequestration process.
■ CONCLUSIONA simple experimental method to simultaneously measure/calculate adsorption strain (axial direction), ultrasonic velocity,and elastic moduli changes in coal because of CO2 injection waspresented. It was observed that CO2 injection into a cuboidcoal specimen in a lab environment resulted in significantchanges in ultrasonic velocity, adsorption strain, and elasticmoduli. An increase in compressional velocity (as high as 21%)was measured at 12.41 MPa confining pressure and 4.14 MPainjection pressure. Because the dynamic elastic moduli areinfluenced by velocity, increases in elastic moduli were alsoobserved with velocity increases. Adsorption strain as high as
Figure 12. Adsorption strain comparison between specimens A and B.
Figure 13. Compressional velocity comparison between specimens Aand B.
Figure 14. Bulk modulus comparison between specimens A and B.
Figure 15. Young’s modulus comparison between specimens A and B.
Energy & Fuels Article
dx.doi.org/10.1021/ef300317k | Energy Fuels 2012, 26, 3951−39573956
0.9% was measured at 12.41 MPa confining pressure and 4.14MPa injection pressure.It was also noted that significant changes in confining
pressure and injection pressure influenced the adsorption strainrate and the rate of change of compressional velocity and elasticmoduli. At high injection pressure (4.14 MPa) and highconfining pressure (12.41 MPa), adsorption strain, compres-sional velocity, and bulk modulus all had high rates of change.The opposite was observed at low injection pressure (1.8 MPa)and low confining pressure (1.8 MPa), with adsorption strain,compressional velocity, and bulk modulus all having low ratesof change.
■ AUTHOR INFORMATIONCorresponding Author*E-mail: [email protected] authors declare no competing financial interest.
■ REFERENCES(1) United States Department of Energy (U.S. DOE). Carbon StorageResearch; U.S. DOE: Washington, D.C., 2011; http://www.fossil.energy.gov/programs/sequestration/geologic (accessed on April 15,2012).(2) Gamson, P.; Beamish, B.; Johnson, D. Coal microstructure andsecondary mineralization: Their effect on methane recovery: Coalbedmethane and coal geology. Geol. Soc. Spec. Publ. 1996, 109, 165−179.(3) Gray, I. Reservoir engineering in coal seams: Part 1Thephysical process of gas storage and movement in coal seams. SPEReservoir Eng. 1987, 2, 28−34.(4) Harpalani, S.; Schraufnagel, R. A. Influence of matrix shrinkageand compressibility on gas production from coalbed methanereservoirs. Proceedings of the Society of Petroleum Engineers (SPE)Annual Technical Conference and Exhibition; New Orleans, LA, Sept23−26, 1990.(5) Robertson, E. Measurement and Modeling of Sorption-InducedStrain and Permeability Changes in Coal; Idaho National Laboratory,United States Department of Energy (U.S. DOE): Washington, D.C.,2005.(6) Xue, Z.; Ohsumi, T. Experimental studies on coal matrix swellingdue to carbon dioxide adsorption and its effect on coal permeability. J.MMIJ 2005, 121, 231−239.(7) Nishimoto, S. Experimental study of coal matrix swelling and gaspermeability during adsorption of supercritical CO2. Proceedings of theGeoscience Union Meeting; Chiba, Japan, May 19−24, 2007.(8) McCrank, M. Seismic detection and characterization of a CO2flood in Ardley coals. M.S. Thesis, University of Calgary, Calgary,Alberta, Canada, 2009.(9) Wilson, T. Pre- and post-injection vertical seismic profiling overthe Southwest Regional Partnership’s phase II fruitland coal CO2 pilot.Proceedings of the Rocky Mountain American Association of PetroleumGeologists Section Meeting; Durango, CO, June 13−16, 2010.(10) Doelling, H. H. Central Utah Coalfields: Sevier-Sanpete, WasatchPlateau, Book Cliffs, and Emery; Utah Geological and MineralogicalSurvey: Salt Lake City, UT, 1972; issue 3, pp 571−572, http://books.google.com/books?id=zx8nQgAACAAJ&source=gbs_navlinks_s (ac-cessed on April 15, 2012).(11) Takahashi, T.; Takeuchi, T. ISRM suggested methods forborehole geophysics in rock engineering. Int. J. Rock Mech. Min. Sci.2006, 43, 337−368.
Energy & Fuels Article
dx.doi.org/10.1021/ef300317k | Energy Fuels 2012, 26, 3951−39573957