Embed Size (px)
Citation preview
Investigation of silo honking: slip-stick excitation and wall vibration
J. M. Buick1,2, J. Chavez-Sagarnaga1, Z. Zhong1, J. Y. Ooi1, Pankaj1, D.M. Campbell3
and C.A. Greated3
(1) Institute for Infrastructure & Environment, School of Engineering & Electronics, University of Edinburgh, Edinburgh EH9 3JN, U.K. (2) Department of Physics and Electronics, School of Biological, Biomedical and Molecular Sciences, The University of New England, Armidale, NSW 2351, Australia. (3) School of Physics, University of Edinburgh, Edinburgh EH9 3JZ, UK.
Abstract Silo honking is an acoustical emission with a fundamental frequency of several hundred Hertz and an intensity often greater than 100 dB. It occurs when a silo is discharging and is similar to the `honk' of a lorry horn. The high amplitude of the honk makes it a significant noise pollution issue for workers at the site and for neighbouring businesses and residents. This paper considers some possible excitation mechanisms that may be responsible for honking and presents measurements obtained from a full scale honking silo detailing the acoustic emissions and the associated vibration of the silo walls. Experimental results are presented which comprise of simultaneous measurements of the three components of the wall vibrations and the acoustic pressure. The wall vibrations have an initial impulse response with a high amplitude O(100g) and subsequent oscillatory accelerations with amplitude O(10g). The frequency spectra of the acceleration and acoustic pressure measurements comprises a sharp peak at the fundamental acoustic frequency and a harmonic series of peaks at integer multiples of the fundamental frequency. It is shown that the honking is not generated by a resonance inside the silo, as in a flute or organ pipe; the sound is generated by the silo walls acting as large speakers. The interaction between the wall and the sliding pellets is considered as a possible excitation mechanism for the acoustic emissions. Laboratory friction measurements are presented using pellets from the honking silo and a wall sample. The results of these measurements show that the particles exhibit a slip-stick behaviour when sheared against the wall material. This slip-stick behaviour is characterised under different conditions for pellets that are known to produce honking. Particles that have not been observed to honk were also tested and did not produce slip-stick motion at the wall.
1 Introduction Huge quantities of bulk materials in the form of granular solids are handled each year throughout the world. During emptying from storage structures, many of these granular solids, such as plastic pellets (Wei and Johnson, 1974), corn (Roberts and Wiche, 1991), coal (Levison and Munch-Andersen, 1994) and rape seeds (Tejchman and Gudehus, 1993) induce significant vibrations and dynamic loads on the storage systems. In addition to
these dynamic loads, some granular solids, such as PET pellets, nylon pellets and PVC powder, emit very loud intermittent honking sounds during discharge from thin-walled metal silos. This honking noise contains much higher frequencies and differs radically in nature from the periodic thumping or banging which can be heard in some silos during discharge. Honking of silos has been a fairly common industrial problem and has been known to exist in thin walled metal silos with differing dimensions and fills in a variety of locations worldwide. As noise pollution becomes increasingly unacceptable, silo honking has become an issue that needs to be addressed. Honking with sound pressure levels in excess of 100-110dB can cause long term hearing damage if hearing protection is not worn. The intermittent nature of silo honking can cause an unexpected distraction and create further hazards. The noise can also create problems for the local population residing close to industrial plants and in some cases, has been known to cause curtailment of normal silo operations (fill levels and operating hours).
In recent years, the dynamic effects during silo discharge have been studied to a limited extent and various descriptive terms such as silo vibration, silo quaking, silo music or silo shocks have been used (Roberts and Wiche, 1991; Gudehus and Tejchman, 1992; Roberts, 1993; Tejchman, 1995; Schulze, 1998). However all these studies predominantly focused on the additional dynamic loads induced on the silo structure during flow and did not address, to any significant extent, the acoustic effects of the vibrations. Indeed a significant number of these studies were on concrete structures rather than on thin-walled metal silos in which honking occurs. A recent study (Tejchman, 1999) examined the displacement and acceleration response of the walls of a honking silo, but did not consider the causes of honking. The two main solutions proposed to date are the installation of waffle sheets (rough wall plates) or a central discharge tube. These silo modifications can be expensive to implement, interfere considerably with the industrial processes, are not well accepted by the industry due their complexity and, since they have been developed for specific silos without a comprehensive understanding of phenomenon, they may not work in all situations. Moreover, waffle sheets change the flow pattern and introduce additional non-uniform loading on the silo walls that can have serious implications on the structural integrity of thin-walled metal silos. Several sources of the dynamic excitations in silos have been proposed (Gudehus and Tejchman, 1992; Roberts, 1993; Schulze, 1998; Tejchman, 1999). These include slip-stick behaviour between stored solids and silo walls, internal slip-stick behaviour within the stored solids, alternating flow patterns during flow, collapsing arches and solid dilation during flow.
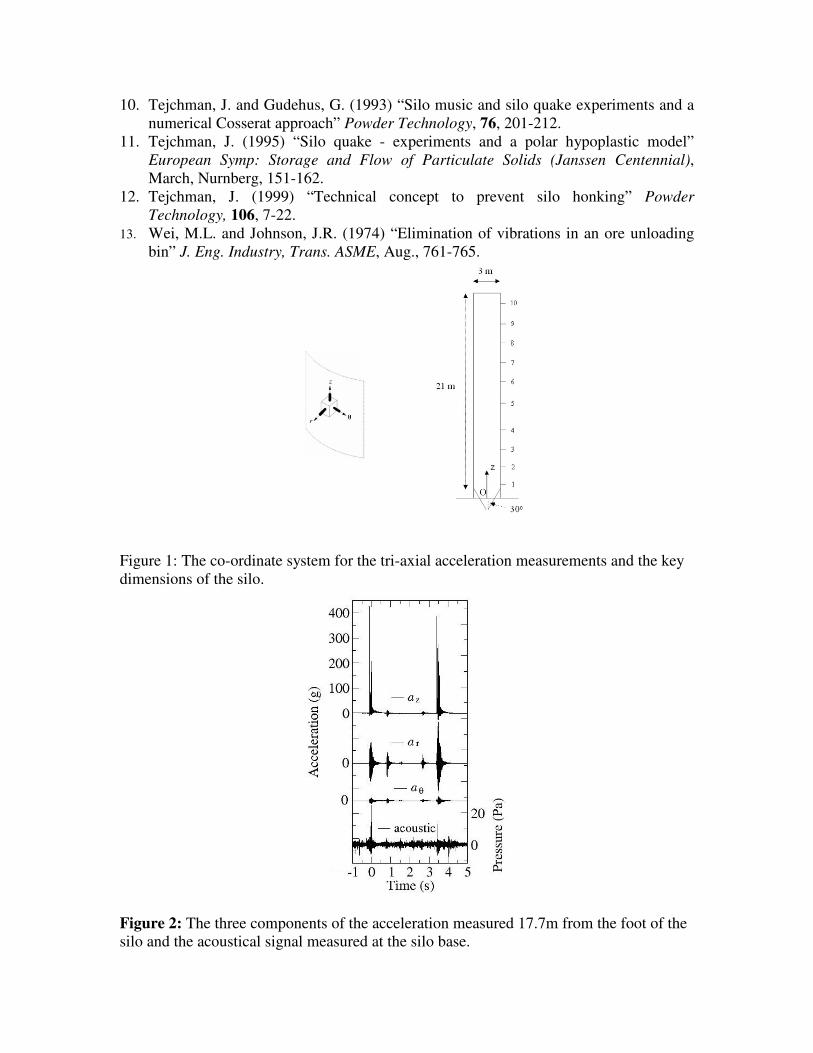
2 Silo Honking: Field Measurements 2.1 Silo Properties Measurements were obtained during honking from a full-scale cylindrical aluminium silo with diameter of 3 m and height of 21 m above the cone section. The silo is constructed from horizontal aluminium strips which have three thicknesses: 4.0 mm, 5.2 mm and 6.2 mm from top to bottom. The cone half angle to the vertical is 30o and the silo is designed such that the PET pellets inside the silo undergo mass flow. 2.2 Instrumentation The silo was instrumented using a tri-axial accelerometer consisting of three PCB 303A02 accelerometers that were calibrated between 1 and 10 kHz. Outwith this range
they had a maximum error of ± 10% up to 20 kHz. For acoustic recording an Audio-Technica microphone ATM33a with an approximately flat frequency response between 200 Hz and 2 kHz and a variation of no more than 5dB between 40Hz and 200 Hz and between 2kHz and 20 kHz; and a CEL-254 digital impulse sound level meter with a measurement range of 35-135 dB and a frequency range of 10 Hz to 25 kHz, that was calibrated with a CEL-282 acoustic calibrator, were used. The combination of the tri-axial accelerometer and the microphone enabled simultaneous measurements of the acoustic emission and the three components of the silo wall vibration in the axial, z; radial, r; and circumferential, �, directions, (Figure 1). Measurements were obtained with the tri-axial accelerometer at 10 different heights on the silo. Access to these positions was obtained by scaffolding that was erected at the back of the silo. The position of the accelerometer at each level is described by its axial co-ordinate, z (see Figure 1). The origin of the axial co-ordinate was the roof level of a single story building that contained the cone section. This is 105 cm below the transition between the cylindrical section and the hopper. The key silo dimensions are also indicated in figure 1. The accelerometers were placed vertically above each other. Sound pressure measurements were also taken at different heights to characterize the acoustical emissions. Acoustic records were obtained using the microphone at the base of the silo. 2.3 Results 2.3.1 Wall acceleration and acoustic pressure measurements Figure 2 shows the acceleration measurements obtained from the tri-axial accelerometer attached to the silo wall at a height z = 17.7m. Also shown in Figure 2 is the acoustical emission measured by the microphone at the base of the silo. Each signal was captured at a sampling frequency of 25 kHz. The data acquisition was performed within Matlab and was triggered when one of the signals exceeded a preset threshold. The signals were, however, continuously sampled, enabling the signal just prior to triggering to be recovered from the system’s buffer. This enabled the full honking event to be captured including the buildup before the system is triggered (negative time in Figure 2). The measurements presented in Figure 2 correspond to one discharge cycle of the silo during which the silo was heard to honk 5 times, Honk 1 at t ~ 0.0, Honk 2 at t ~ 0.8, Honk 3 at t ~ 1.5, Honk 4 at t ~ 2.6 and Honk 5 at t ~ 3.5 s. At these times the acceleration plots in Figure 2 show corresponding wall accelerations of varying magnitudes that can be associated with the acoustic emissions. It is not, however, possible to detect the individual honks from a visual display of the pressure readings obtained from the microphone; this will be discussed in more detail later. Figure 3 shows a magnification of the axial acceleration and the acoustic signal around Honk 1.The axial component of the acceleration, az, shows peak accelerations of over 400 g which is in line with the magnitude of acceleration measured elsewhere (Tejchman 1999), however Figure 3 indicates that these accelerations are non-oscillatory, intermittent impulsive responses. In fact, Figure 3 shows that typical acceleration amplitudes of the oscillatory response are typically in the range of 10g – 20g. Figure 3 also shows high acceleration peaks that correspond to the large acceleration values observed in Figure 2. These typically correspond to only a single point in the sampled record and so last for no longer than 50 �s. Such peaks could not be responsible for
creating an acoustical emission at an audible frequency. In each case the peaks correspond to an acceleration in the positive direction, towards the top of the silo. In some of the measurements, acceleration peaks with a similar magnitude were also observed in the radial component of acceleration, always in the outward direction, however, these were much less common. We also note an impulsive response in the microphone signal in Figure 3. Considering only the oscillatory components of the measured accelerations and ignoring the impulsive responses, the results show that for each honk the wall vibrates rapidly within an envelope. The shape of the envelope is similar for each honk and for each component: it builds up rapidly over a few hundredths of a second before decaying more gradually over several tenths of a second. The amplitude of the envelope varies between different honks. The amplitude of the circumferential accelerations is always the smallest and is generally about an order of magnitude smaller than the other components (see the radial and circumferential components in Figure 2). The radial and axial components are generally similar with the radial component slightly larger than the axial component, however, the relative strengths of these two components varied with the position at which the accelerometer was placed suggesting that the silo is oscillating in a nodal manner.
Figure 2 highlights a number of features of the silo honking which were typical of a large number of measurements obtained at different heights on the silo wall. Throughout the measurement period the fill level in the silo was maintained between 85% and 100%. Typically sound pressure measurements at the base of the silo were in the range 100-110 dB (this measurement corresponds to the loudest single honk during any discharge cycle). Within this variation no noticeable trend was observed due to the position of the accelerometers (other than variation discussed above which were attributed to the nodal nature of the oscillations) or the fill level. It is, however, known that honking is not a problem when the fill level is less than about 40 %, the enforced operating conditions for the silo to prevent honking occurring. Sound pressure measurements were also obtained at different positions on the scaffolding. Again, the variations observed in the sound pressure level at different heights were no more than the general variation between honks. 2.3.2 The Acoustic Signal It is clear from Figure 2 that the acoustic honks can be observed in the wall acceleration records as regions of high acceleration. Although it is not possible to detect the individual honks from a visual inspection of the microphone recording, they are clearly audible when playing back the signal through a speaker. The reason for this is the high level of background noise that was present at the plant and was measured between 85 and 90 dB. During discharge the level was higher due to the additional noise of the particulate solids falling through the silo. In Figure 3, however, a difference in the acoustic signal can be observed. Before t = -0.1 s and after t ~ 0.15 s the signal is varying slowly in time with a period of a few hundredths of a second corresponding to the low frequency background noise with a frequency of the order of tens of Hertz. Between these times the signal is varying between positive and negative pressures with a period which is too small to determine on the scale of Figure 3: this corresponds to the high frequency honking. This can be seen in more detail by considering the frequency spectrum of the acoustic signal which is shown in Figure 4. The spectrum shows a series of harmonic peaks with the
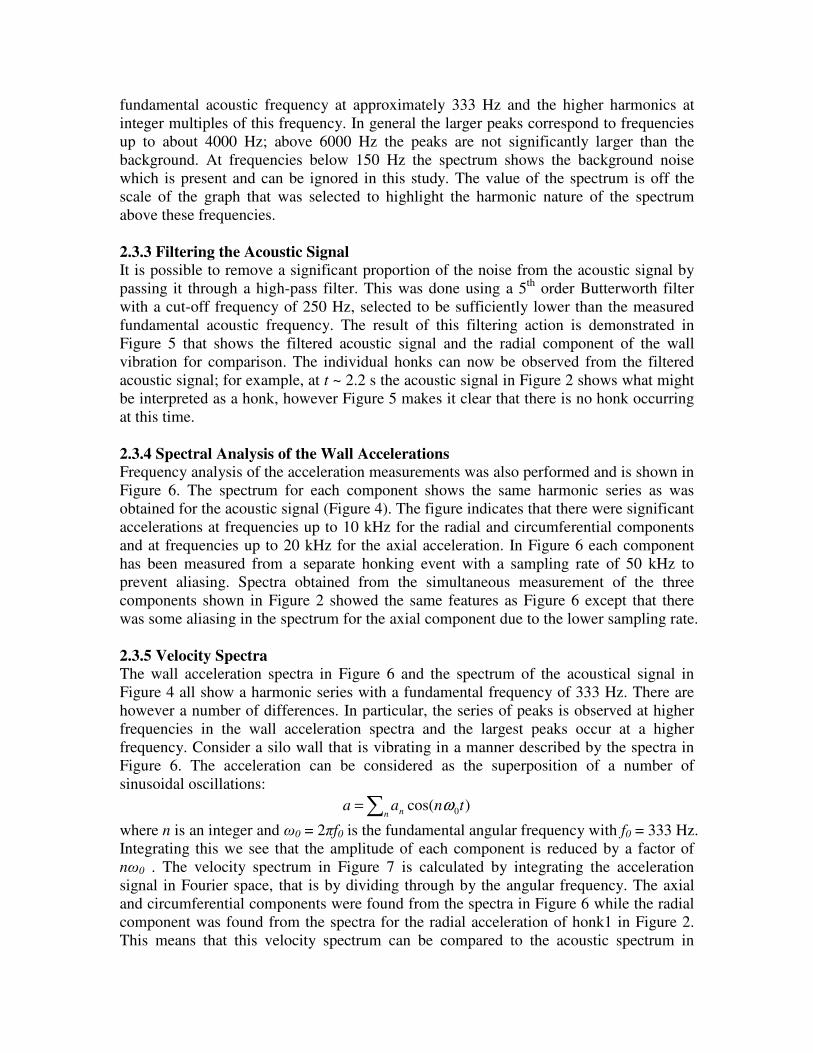
fundamental acoustic frequency at approximately 333 Hz and the higher harmonics at integer multiples of this frequency. In general the larger peaks correspond to frequencies up to about 4000 Hz; above 6000 Hz the peaks are not significantly larger than the background. At frequencies below 150 Hz the spectrum shows the background noise which is present and can be ignored in this study. The value of the spectrum is off the scale of the graph that was selected to highlight the harmonic nature of the spectrum above these frequencies. 2.3.3 Filtering the Acoustic Signal It is possible to remove a significant proportion of the noise from the acoustic signal by passing it through a high-pass filter. This was done using a 5th order Butterworth filter with a cut-off frequency of 250 Hz, selected to be sufficiently lower than the measured fundamental acoustic frequency. The result of this filtering action is demonstrated in Figure 5 that shows the filtered acoustic signal and the radial component of the wall vibration for comparison. The individual honks can now be observed from the filtered acoustic signal; for example, at t ~ 2.2 s the acoustic signal in Figure 2 shows what might be interpreted as a honk, however Figure 5 makes it clear that there is no honk occurring at this time. 2.3.4 Spectral Analysis of the Wall Accelerations Frequency analysis of the acceleration measurements was also performed and is shown in Figure 6. The spectrum for each component shows the same harmonic series as was obtained for the acoustic signal (Figure 4). The figure indicates that there were significant accelerations at frequencies up to 10 kHz for the radial and circumferential components and at frequencies up to 20 kHz for the axial acceleration. In Figure 6 each component has been measured from a separate honking event with a sampling rate of 50 kHz to prevent aliasing. Spectra obtained from the simultaneous measurement of the three components shown in Figure 2 showed the same features as Figure 6 except that there was some aliasing in the spectrum for the axial component due to the lower sampling rate. 2.3.5 Velocity Spectra The wall acceleration spectra in Figure 6 and the spectrum of the acoustical signal in Figure 4 all show a harmonic series with a fundamental frequency of 333 Hz. There are however a number of differences. In particular, the series of peaks is observed at higher frequencies in the wall acceleration spectra and the largest peaks occur at a higher frequency. Consider a silo wall that is vibrating in a manner described by the spectra in Figure 6. The acceleration can be considered as the superposition of a number of sinusoidal oscillations:
)cos( 0tnaan n ω�=
where n is an integer and �0 = 2�f0 is the fundamental angular frequency with f0 = 333 Hz. Integrating this we see that the amplitude of each component is reduced by a factor of n�0 . The velocity spectrum in Figure 7 is calculated by integrating the acceleration signal in Fourier space, that is by dividing through by the angular frequency. The axial and circumferential components were found from the spectra in Figure 6 while the radial component was found from the spectra for the radial acceleration of honk1 in Figure 2. This means that this velocity spectrum can be compared to the acoustic spectrum in
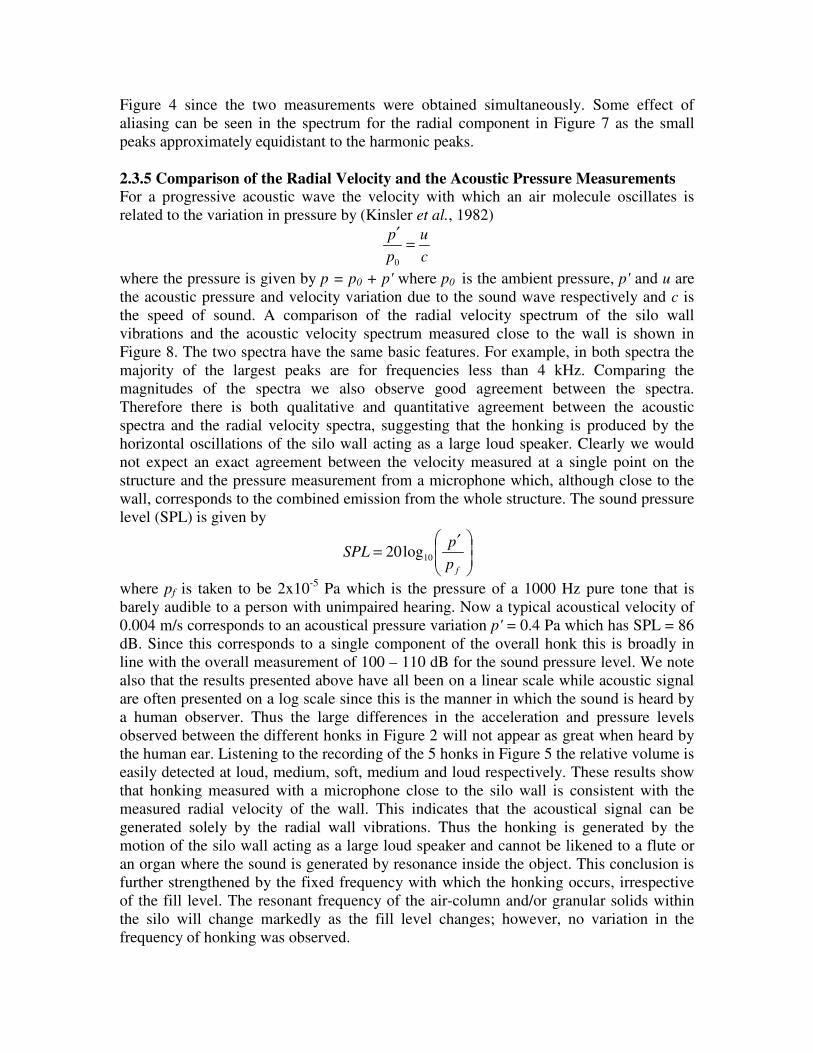
Figure 4 since the two measurements were obtained simultaneously. Some effect of aliasing can be seen in the spectrum for the radial component in Figure 7 as the small peaks approximately equidistant to the harmonic peaks.
2.3.5 Comparison of the Radial Velocity and the Acoustic Pressure Measurements For a progressive acoustic wave the velocity with which an air molecule oscillates is related to the variation in pressure by (Kinsler et al., 1982)
cu
pp =
′
0
where the pressure is given by p = p0 + p' where p0 is the ambient pressure, p' and u are the acoustic pressure and velocity variation due to the sound wave respectively and c is the speed of sound. A comparison of the radial velocity spectrum of the silo wall vibrations and the acoustic velocity spectrum measured close to the wall is shown in Figure 8. The two spectra have the same basic features. For example, in both spectra the majority of the largest peaks are for frequencies less than 4 kHz. Comparing the magnitudes of the spectra we also observe good agreement between the spectra. Therefore there is both qualitative and quantitative agreement between the acoustic spectra and the radial velocity spectra, suggesting that the honking is produced by the horizontal oscillations of the silo wall acting as a large loud speaker. Clearly we would not expect an exact agreement between the velocity measured at a single point on the structure and the pressure measurement from a microphone which, although close to the wall, corresponds to the combined emission from the whole structure. The sound pressure level (SPL) is given by
��
�
�
��
�
� ′=
fpp
SPL 10log20
where pf is taken to be 2x10⁻⁵ Pa which is the pressure of a 1000 Hz pure tone that is barely audible to a person with unimpaired hearing. Now a typical acoustical velocity of 0.004 m/s corresponds to an acoustical pressure variation p' = 0.4 Pa which has SPL = 86 dB. Since this corresponds to a single component of the overall honk this is broadly in line with the overall measurement of 100 – 110 dB for the sound pressure level. We note also that the results presented above have all been on a linear scale while acoustic signal are often presented on a log scale since this is the manner in which the sound is heard by a human observer. Thus the large differences in the acceleration and pressure levels observed between the different honks in Figure 2 will not appear as great when heard by the human ear. Listening to the recording of the 5 honks in Figure 5 the relative volume is easily detected at loud, medium, soft, medium and loud respectively. These results show that honking measured with a microphone close to the silo wall is consistent with the measured radial velocity of the wall. This indicates that the acoustical signal can be generated solely by the radial wall vibrations. Thus the honking is generated by the motion of the silo wall acting as a large loud speaker and cannot be likened to a flute or an organ where the sound is generated by resonance inside the object. This conclusion is further strengthened by the fixed frequency with which the honking occurs, irrespective of the fill level. The resonant frequency of the air-column and/or granular solids within the silo will change markedly as the fill level changes; however, no variation in the frequency of honking was observed.
3 Wall Excitations: A Laboratory Study 3.1 Excitation Mechanisms In this section possible excitation mechanisms for the silo walls during discharge are considered. There are a number of possible excitation mechanisms which could potentially be responsible for exciting the silo walls: a) Slip-stick behaviour between pellets and silo walls: The wall friction between the stored solid and the silo walls is an important parameter in the design of a storage structure. This is often measured using a direct shear tester, in which a shallow box containing a sample of the granular solid is sheared against a wall specimen. For some granular solids, the frictional traction needed for the solid to move against the wall material fluctuates considerably. It is possible that the slip-stick fluctuations generate the vibrations that lead to honking. b) Internal slip-stick behaviour within the pellets: The stored solid must go through considerable deformation and shear failure during discharge. Slip-stick behaviour can also occur internally within the granular medium. This again can be a significant source of vibration that occurs during discharge. c) Changing pattern of flow during discharge: In a cylindrical silo with a hopper, the stored solid may flow predominantly either in mass flow or funnel flow. In mass flow, the entire content of a silo is in motion, moving towards the outlet. In funnel flow, only part of the content is in motion whilst the rest remains stationary. Funnel flow often occurs as an internal flow channel with surrounding zones of stationary solid. Funnel flow occurs when the hopper is too shallow, the hopper walls are too rough, or when a mass flow silo has not been adequately designed. It has been suggested that for some silos, the changes in the properties of the bulk solid during flow can result in alternating flow patterns during discharge. The periodic slips against the hopper walls can induce significant vibrations. d) Dilation of the bulk solid during flow: It has been recognised that most granular solids have to dilate to flow. However the degree of dilation which is required to move a solid from its storing state to its flowing state varies considerably between different granular solids. The dilation of the solid leads to reduction in bulk density and a corresponding reduction in the magnitude of the stresses within the flow regimes. The reducing stress regimes can then lead to either changing flow patterns, or changing flow boundaries. These unstable phenomena can result in significant dynamic effects during flow.
3.2 Particulate Solids and Wall Materials Three different particles were used in the laboratory measurements. PET1 pellets are very uniform in size and each particle has the shape of an elliptical cylinder with an approximately elliptical cross-section. The average dimensions are 2.0 x 3.2 mm and 4.0mm long. These have been reported to produce honking in thin walled metal silos.
PET2 is a “pillow” shaped PET pellet with similar dimensions which is also know to have a tendency to honk. The third type of particle was blue polypropylene pellets which have not been reported to exhibiting honking. Aluminium plates were used with the same grade and thickness as used in silo constructions. Stainless steel plates were also used for comparison.
3.3 Evaluation of the Stress State in a Silo The behaviour of particulate solids is highly stress level and stress history dependent. It is thus important to evaluate the stress state in a typical silo, which can then be simulated in the laboratory tests. The most commonly used theory for calculating stresses in the solid contained in a cylindrical vessel is the Janssen theory (Janssen, 1895;Rotter, 2001):
q = �zo (1 -e-z/zo) P = k q � = � P
and
zo = R
2µk
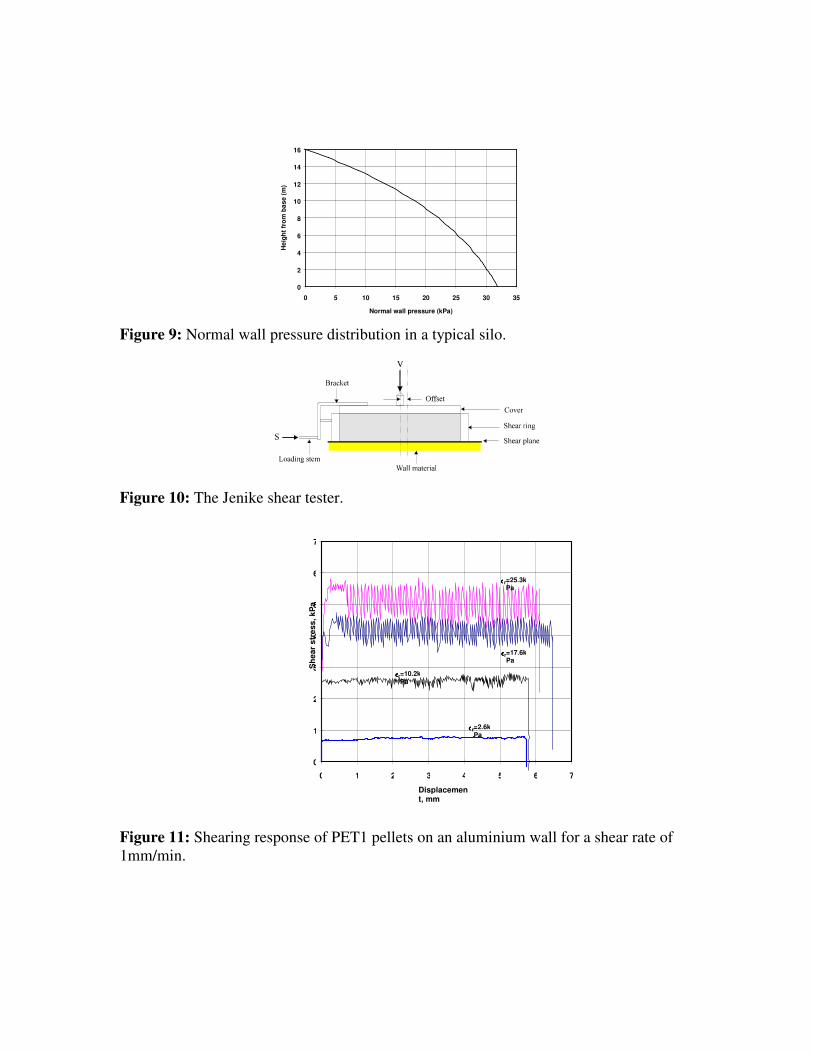
where q is the mean vertical stress in the stored material at depth z, P is the normal wall pressure (radial stress), � is the wall frictional traction, � = unit weight of the stored material, R = radius of the vessel, � is the wall friction coefficient and k = p/q is the lateral pressure ratio which is commonly assumed to depend on the angle of internal friction of the solid �, and normally lies between 0.3 to 0.7. In this study k = 0.5 is assumed. The following typical silo geometry and pellets properties were used in the calculations: R = 2.1 m; � = 0.21; filled height of the cylindrical section, H = 16.0 m; and bulk unit weight of the particles γ= 8.0 kN/m3. Figure 9 shows the normal wall pressure distribution expected for the cylindrical section of the silo when it is filled to 16m. The normal wall pressure or the horizontal normal stress in the pellets increases to just over 30 kPa near the hopper transition. The testing of the mechanical behaviour of the pellets was therefore conducted with the stress level between 0-30 kPa.
3.4 Slip-stick Behaviour at the Silo Walls This section reports a sample of wall friction tests conducted to investigate the shearing behaviour of pellets on a wall material. Tests were performed to investigate the effects of shearing rate, stress level and time under load. The wall friction tests were conducted using a Jenike shear tester with a large shear cell of 143 mm in diameter, as shown in Figure 10 (IChE, 1989). In each test, the shear ring was positioned on top of the plate and then carefully filled with the pellets. After
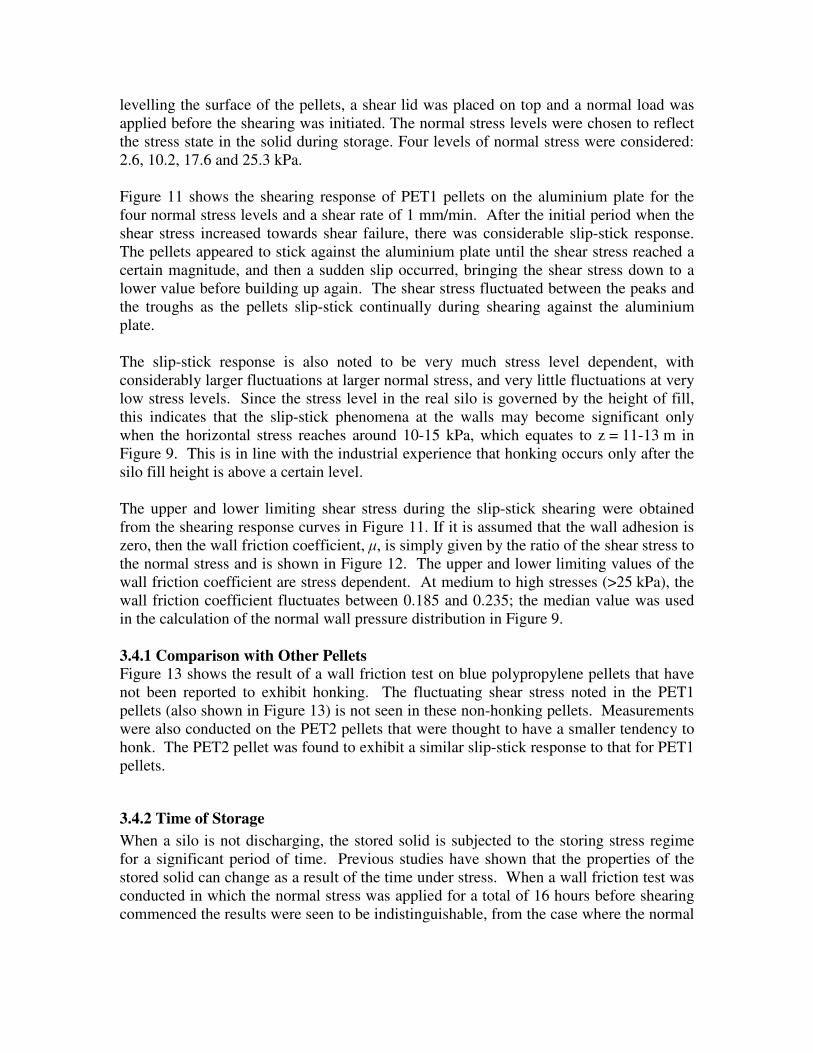
levelling the surface of the pellets, a shear lid was placed on top and a normal load was applied before the shearing was initiated. The normal stress levels were chosen to reflect the stress state in the solid during storage. Four levels of normal stress were considered: 2.6, 10.2, 17.6 and 25.3 kPa. Figure 11 shows the shearing response of PET1 pellets on the aluminium plate for the four normal stress levels and a shear rate of 1 mm/min. After the initial period when the shear stress increased towards shear failure, there was considerable slip-stick response. The pellets appeared to stick against the aluminium plate until the shear stress reached a certain magnitude, and then a sudden slip occurred, bringing the shear stress down to a lower value before building up again. The shear stress fluctuated between the peaks and the troughs as the pellets slip-stick continually during shearing against the aluminium plate.
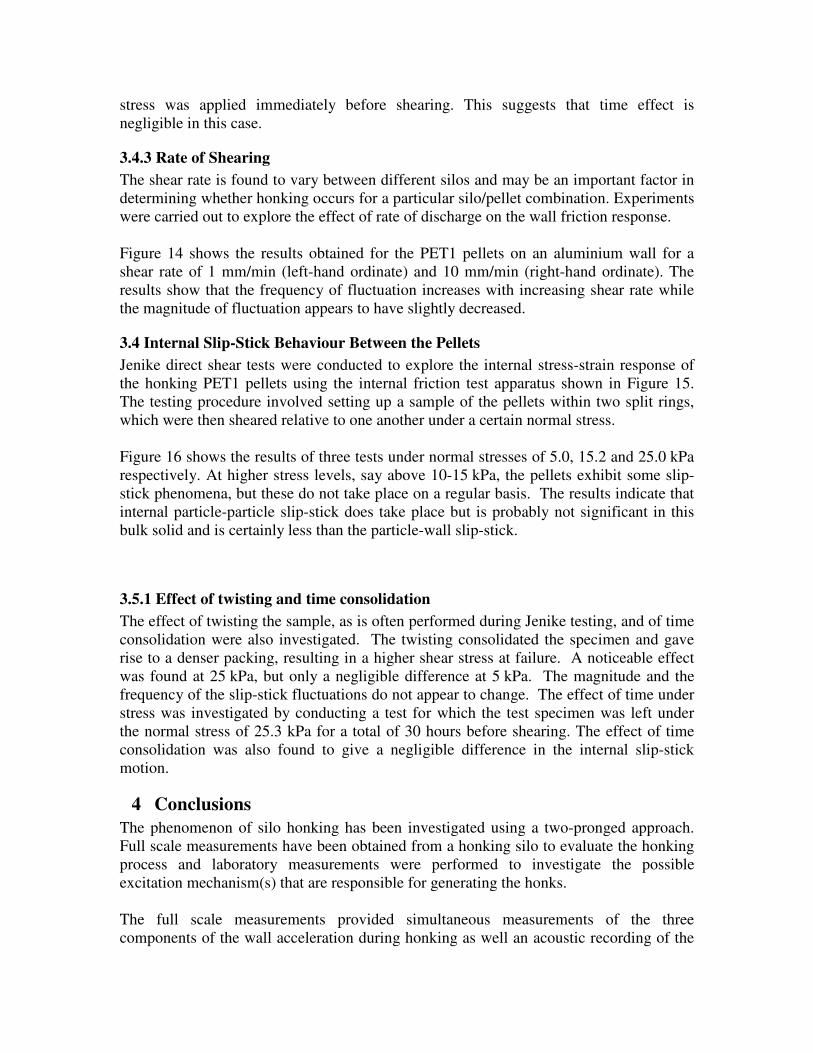
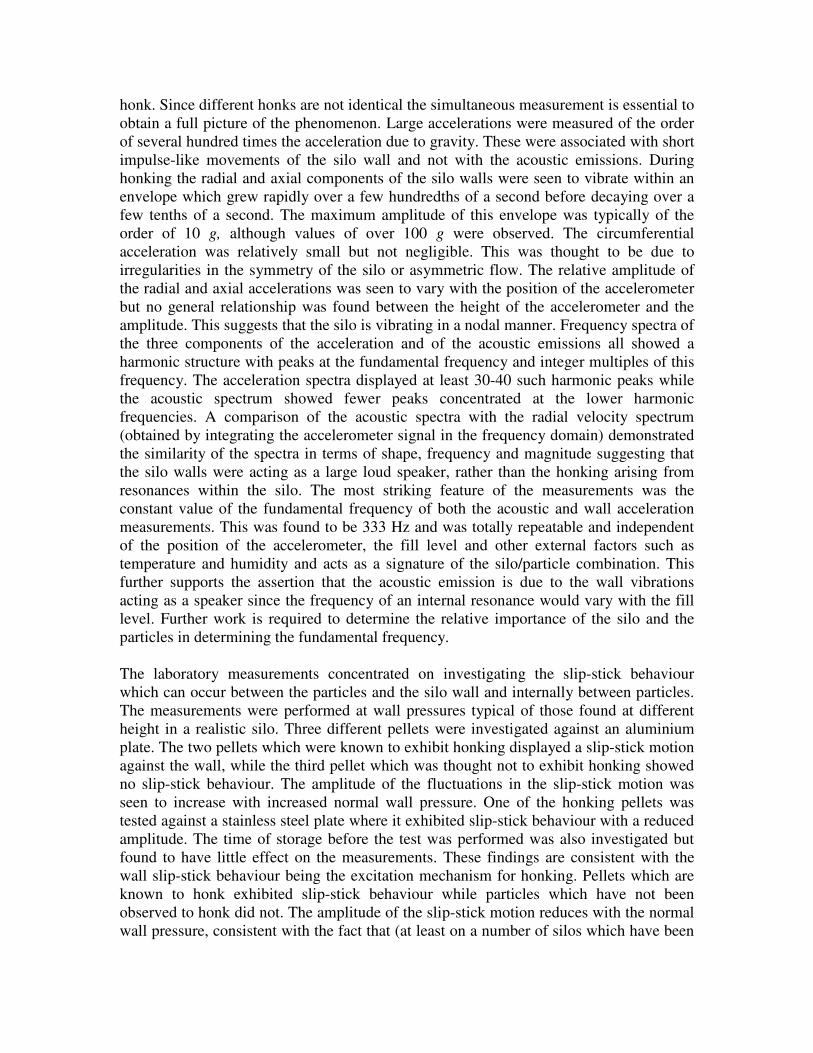
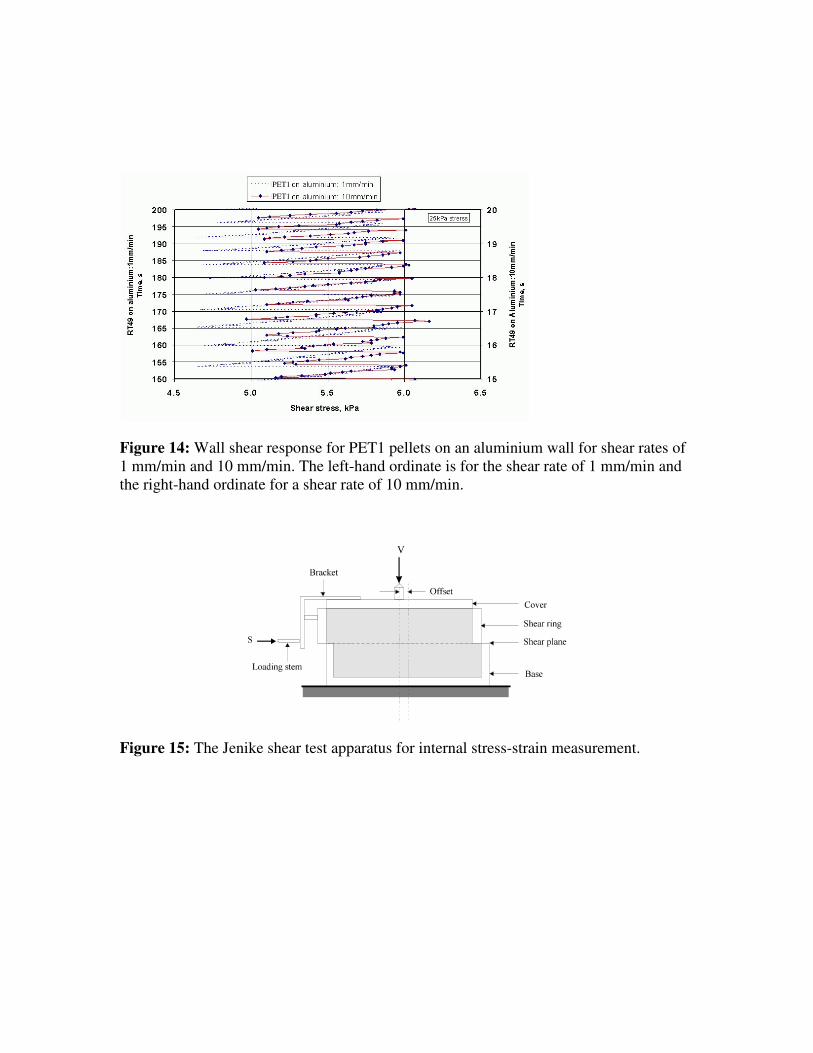
The slip-stick response is also noted to be very much stress level dependent, with considerably larger fluctuations at larger normal stress, and very little fluctuations at very low stress levels. Since the stress level in the real silo is governed by the height of fill, this indicates that the slip-stick phenomena at the walls may become significant only when the horizontal stress reaches around 10-15 kPa, which equates to z = 11-13 m in Figure 9. This is in line with the industrial experience that honking occurs only after the silo fill height is above a certain level. The upper and lower limiting shear stress during the slip-stick shearing were obtained from the shearing response curves in Figure 11. If it is assumed that the wall adhesion is zero, then the wall friction coefficient, �, is simply given by the ratio of the shear stress to the normal stress and is shown in Figure 12. The upper and lower limiting values of the wall friction coefficient are stress dependent. At medium to high stresses (>25 kPa), the wall friction coefficient fluctuates between 0.185 and 0.235; the median value was used in the calculation of the normal wall pressure distribution in Figure 9. 3.4.1 Comparison with Other Pellets Figure 13 shows the result of a wall friction test on blue polypropylene pellets that have not been reported to exhibit honking. The fluctuating shear stress noted in the PET1 pellets (also shown in Figure 13) is not seen in these non-honking pellets. Measurements were also conducted on the PET2 pellets that were thought to have a smaller tendency to honk. The PET2 pellet was found to exhibit a similar slip-stick response to that for PET1 pellets.
3.4.2 Time of Storage When a silo is not discharging, the stored solid is subjected to the storing stress regime for a significant period of time. Previous studies have shown that the properties of the stored solid can change as a result of the time under stress. When a wall friction test was conducted in which the normal stress was applied for a total of 16 hours before shearing commenced the results were seen to be indistinguishable, from the case where the normal
stress was applied immediately before shearing. This suggests that time effect is negligible in this case.
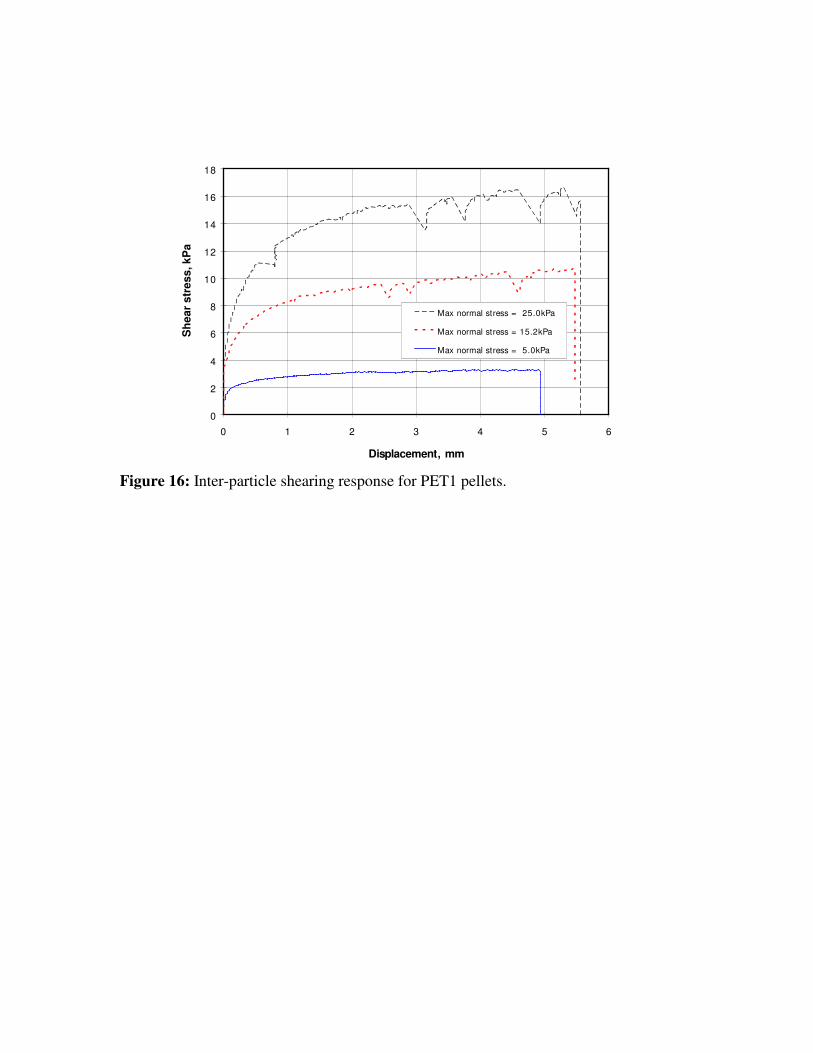
3.4.3 Rate of Shearing The shear rate is found to vary between different silos and may be an important factor in determining whether honking occurs for a particular silo/pellet combination. Experiments were carried out to explore the effect of rate of discharge on the wall friction response. Figure 14 shows the results obtained for the PET1 pellets on an aluminium wall for a shear rate of 1 mm/min (left-hand ordinate) and 10 mm/min (right-hand ordinate). The results show that the frequency of fluctuation increases with increasing shear rate while the magnitude of fluctuation appears to have slightly decreased.
3.4 Internal Slip-Stick Behaviour Between the Pellets Jenike direct shear tests were conducted to explore the internal stress-strain response of the honking PET1 pellets using the internal friction test apparatus shown in Figure 15. The testing procedure involved setting up a sample of the pellets within two split rings, which were then sheared relative to one another under a certain normal stress.
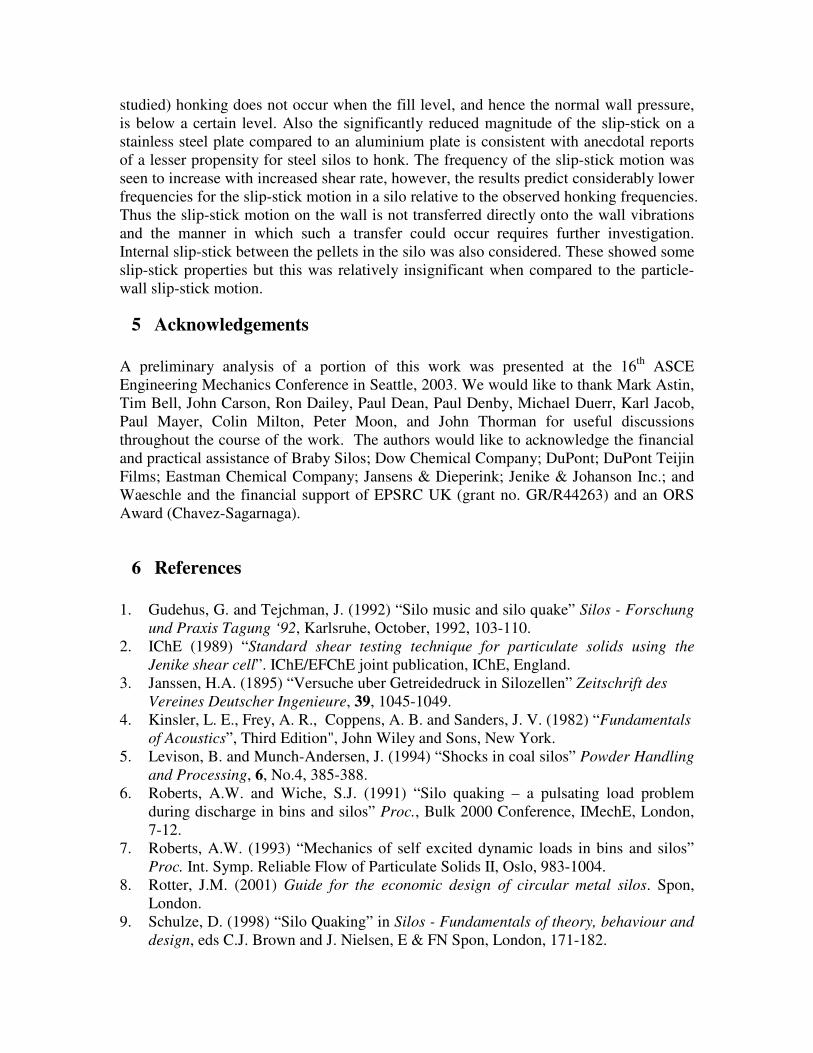
Figure 16 shows the results of three tests under normal stresses of 5.0, 15.2 and 25.0 kPa respectively. At higher stress levels, say above 10-15 kPa, the pellets exhibit some slip-stick phenomena, but these do not take place on a regular basis. The results indicate that internal particle-particle slip-stick does take place but is probably not significant in this bulk solid and is certainly less than the particle-wall slip-stick.
3.5.1 Effect of twisting and time consolidation The effect of twisting the sample, as is often performed during Jenike testing, and of time consolidation were also investigated. The twisting consolidated the specimen and gave rise to a denser packing, resulting in a higher shear stress at failure. A noticeable effect was found at 25 kPa, but only a negligible difference at 5 kPa. The magnitude and the frequency of the slip-stick fluctuations do not appear to change. The effect of time under stress was investigated by conducting a test for which the test specimen was left under the normal stress of 25.3 kPa for a total of 30 hours before shearing. The effect of time consolidation was also found to give a negligible difference in the internal slip-stick motion.
4 Conclusions The phenomenon of silo honking has been investigated using a two-pronged approach. Full scale measurements have been obtained from a honking silo to evaluate the honking process and laboratory measurements were performed to investigate the possible excitation mechanism(s) that are responsible for generating the honks. The full scale measurements provided simultaneous measurements of the three components of the wall acceleration during honking as well an acoustic recording of the
honk. Since different honks are not identical the simultaneous measurement is essential to obtain a full picture of the phenomenon. Large accelerations were measured of the order of several hundred times the acceleration due to gravity. These were associated with short impulse-like movements of the silo wall and not with the acoustic emissions. During honking the radial and axial components of the silo walls were seen to vibrate within an envelope which grew rapidly over a few hundredths of a second before decaying over a few tenths of a second. The maximum amplitude of this envelope was typically of the order of 10 g, although values of over 100 g were observed. The circumferential acceleration was relatively small but not negligible. This was thought to be due to irregularities in the symmetry of the silo or asymmetric flow. The relative amplitude of the radial and axial accelerations was seen to vary with the position of the accelerometer but no general relationship was found between the height of the accelerometer and the amplitude. This suggests that the silo is vibrating in a nodal manner. Frequency spectra of the three components of the acceleration and of the acoustic emissions all showed a harmonic structure with peaks at the fundamental frequency and integer multiples of this frequency. The acceleration spectra displayed at least 30-40 such harmonic peaks while the acoustic spectrum showed fewer peaks concentrated at the lower harmonic frequencies. A comparison of the acoustic spectra with the radial velocity spectrum (obtained by integrating the accelerometer signal in the frequency domain) demonstrated the similarity of the spectra in terms of shape, frequency and magnitude suggesting that the silo walls were acting as a large loud speaker, rather than the honking arising from resonances within the silo. The most striking feature of the measurements was the constant value of the fundamental frequency of both the acoustic and wall acceleration measurements. This was found to be 333 Hz and was totally repeatable and independent of the position of the accelerometer, the fill level and other external factors such as temperature and humidity and acts as a signature of the silo/particle combination. This further supports the assertion that the acoustic emission is due to the wall vibrations acting as a speaker since the frequency of an internal resonance would vary with the fill level. Further work is required to determine the relative importance of the silo and the particles in determining the fundamental frequency. The laboratory measurements concentrated on investigating the slip-stick behaviour which can occur between the particles and the silo wall and internally between particles. The measurements were performed at wall pressures typical of those found at different height in a realistic silo. Three different pellets were investigated against an aluminium plate. The two pellets which were known to exhibit honking displayed a slip-stick motion against the wall, while the third pellet which was thought not to exhibit honking showed no slip-stick behaviour. The amplitude of the fluctuations in the slip-stick motion was seen to increase with increased normal wall pressure. One of the honking pellets was tested against a stainless steel plate where it exhibited slip-stick behaviour with a reduced amplitude. The time of storage before the test was performed was also investigated but found to have little effect on the measurements. These findings are consistent with the wall slip-stick behaviour being the excitation mechanism for honking. Pellets which are known to honk exhibited slip-stick behaviour while particles which have not been observed to honk did not. The amplitude of the slip-stick motion reduces with the normal wall pressure, consistent with the fact that (at least on a number of silos which have been
studied) honking does not occur when the fill level, and hence the normal wall pressure, is below a certain level. Also the significantly reduced magnitude of the slip-stick on a stainless steel plate compared to an aluminium plate is consistent with anecdotal reports of a lesser propensity for steel silos to honk. The frequency of the slip-stick motion was seen to increase with increased shear rate, however, the results predict considerably lower frequencies for the slip-stick motion in a silo relative to the observed honking frequencies. Thus the slip-stick motion on the wall is not transferred directly onto the wall vibrations and the manner in which such a transfer could occur requires further investigation. Internal slip-stick between the pellets in the silo was also considered. These showed some slip-stick properties but this was relatively insignificant when compared to the particle-wall slip-stick motion.
5 Acknowledgements A preliminary analysis of a portion of this work was presented at the 16th ASCE Engineering Mechanics Conference in Seattle, 2003. We would like to thank Mark Astin, Tim Bell, John Carson, Ron Dailey, Paul Dean, Paul Denby, Michael Duerr, Karl Jacob, Paul Mayer, Colin Milton, Peter Moon, and John Thorman for useful discussions throughout the course of the work. The authors would like to acknowledge the financial and practical assistance of Braby Silos; Dow Chemical Company; DuPont; DuPont Teijin Films; Eastman Chemical Company; Jansens & Dieperink; Jenike & Johanson Inc.; and Waeschle and the financial support of EPSRC UK (grant no. GR/R44263) and an ORS Award (Chavez-Sagarnaga).
6 References 1. Gudehus, G. and Tejchman, J. (1992) “Silo music and silo quake” Silos - Forschung
und Praxis Tagung ‘92, Karlsruhe, October, 1992, 103-110. 2. IChE (1989) “Standard shear testing technique for particulate solids using the
Jenike shear cell”. IChE/EFChE joint publication, IChE, England. 3. Janssen, H.A. (1895) “Versuche uber Getreidedruck in Silozellen” Zeitschrift des
Vereines Deutscher Ingenieure, 39, 1045-1049. 4. Kinsler, L. E., Frey, A. R., Coppens, A. B. and Sanders, J. V. (1982) “Fundamentals
of Acoustics”, Third Edition", John Wiley and Sons, New York. 5. Levison, B. and Munch-Andersen, J. (1994) “Shocks in coal silos” Powder Handling
and Processing, 6, No.4, 385-388. 6. Roberts, A.W. and Wiche, S.J. (1991) “Silo quaking – a pulsating load problem
during discharge in bins and silos” Proc., Bulk 2000 Conference, IMechE, London, 7-12.
7. Roberts, A.W. (1993) “Mechanics of self excited dynamic loads in bins and silos” Proc. Int. Symp. Reliable Flow of Particulate Solids II, Oslo, 983-1004.
8. Rotter, J.M. (2001) Guide for the economic design of circular metal silos. Spon, London.
9. Schulze, D. (1998) “Silo Quaking” in Silos - Fundamentals of theory, behaviour and design, eds C.J. Brown and J. Nielsen, E & FN Spon, London, 171-182.
10. Tejchman, J. and Gudehus, G. (1993) “Silo music and silo quake experiments and a numerical Cosserat approach” Powder Technology, 76, 201-212.
11. Tejchman, J. (1995) “Silo quake - experiments and a polar hypoplastic model” European Symp: Storage and Flow of Particulate Solids (Janssen Centennial), March, Nurnberg, 151-162.
12. Tejchman, J. (1999) “Technical concept to prevent silo honking” Powder Technology, 106, 7-22.
13. Wei, M.L. and Johnson, J.R. (1974) “Elimination of vibrations in an ore unloading bin” J. Eng. Industry, Trans. ASME, Aug., 761-765.
Figure 1: The co-ordinate system for the tri-axial acceleration measurements and the key dimensions of the silo.
Figure 2: The three components of the acceleration measured 17.7m from the foot of the silo and the acoustical signal measured at the silo base.
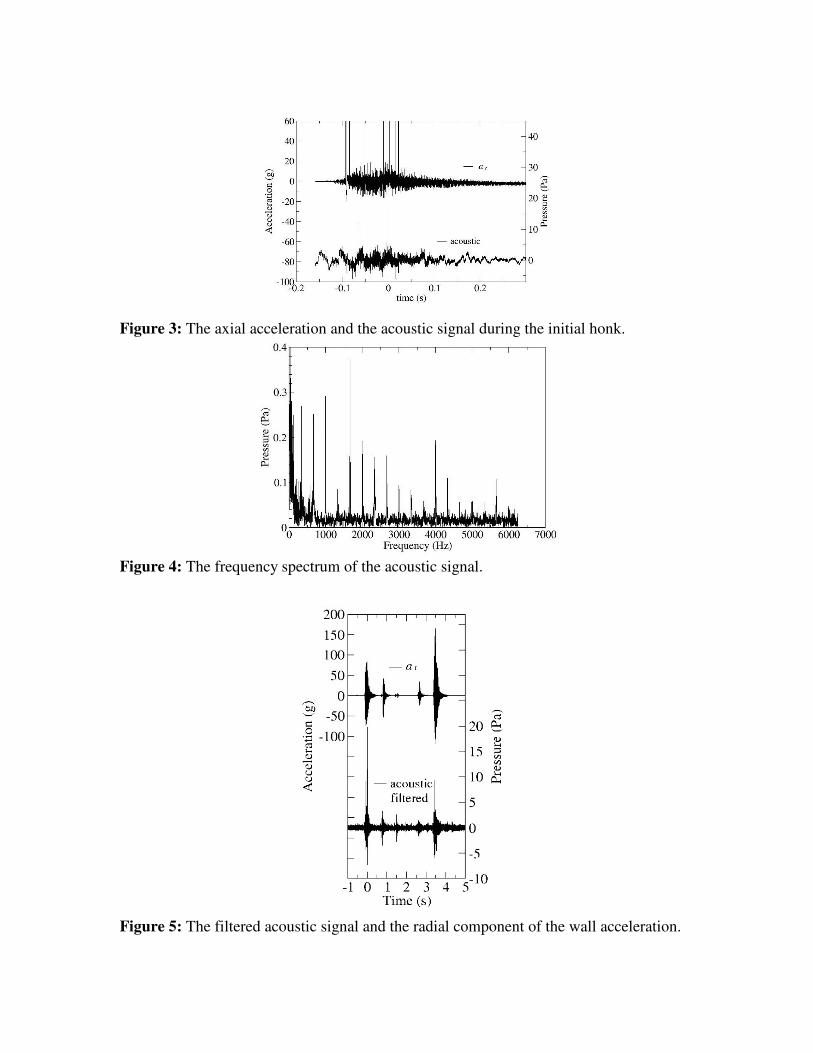
Figure 3: The axial acceleration and the acoustic signal during the initial honk.
Figure 4: The frequency spectrum of the acoustic signal.
Figure 5: The filtered acoustic signal and the radial component of the wall acceleration.
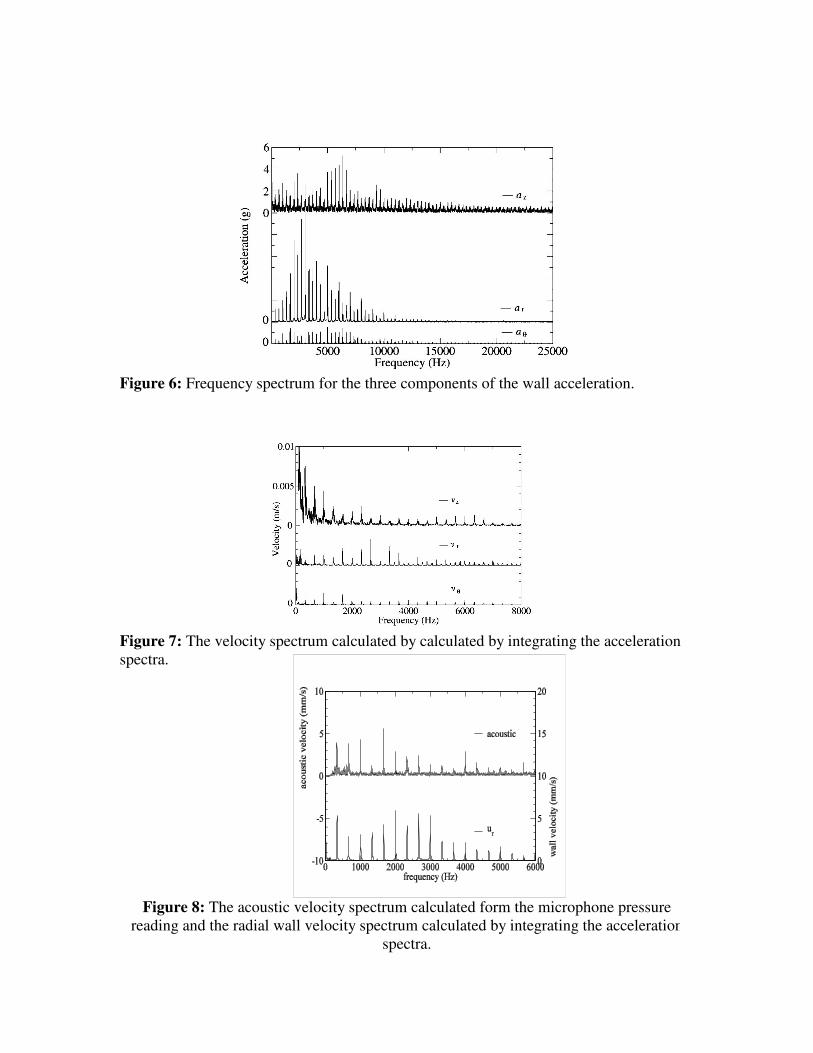
Figure 6: Frequency spectrum for the three components of the wall acceleration.
Figure 7: The velocity spectrum calculated by calculated by integrating the acceleration spectra.
Figure 8: The acoustic velocity spectrum calculated form the microphone pressure reading and the radial wall velocity spectrum calculated by integrating the acceleration
spectra.
0
2
4
6
8
10
12
14
16
0 5 10 15 20 25 30 35
Normal wall pressure (kPa)
Hei
ght f
rom
bas
e (m
)
Figure 9: Normal wall pressure distribution in a typical silo.
Figure 10: The Jenike shear tester.
Figure 11: Shearing response of PET1 pellets on an aluminium wall for a shear rate of 1mm/min.
σσσσn=25.3kPa
σσσσn=10.2kPa
σσσσn=17.6kPa
σσσσn=2.6kPa
0
1
2
3
4
5
6
7
0 1 2 3 4 5 6 7
Displacement, mm
She
ar s
tres
s, k
Pa
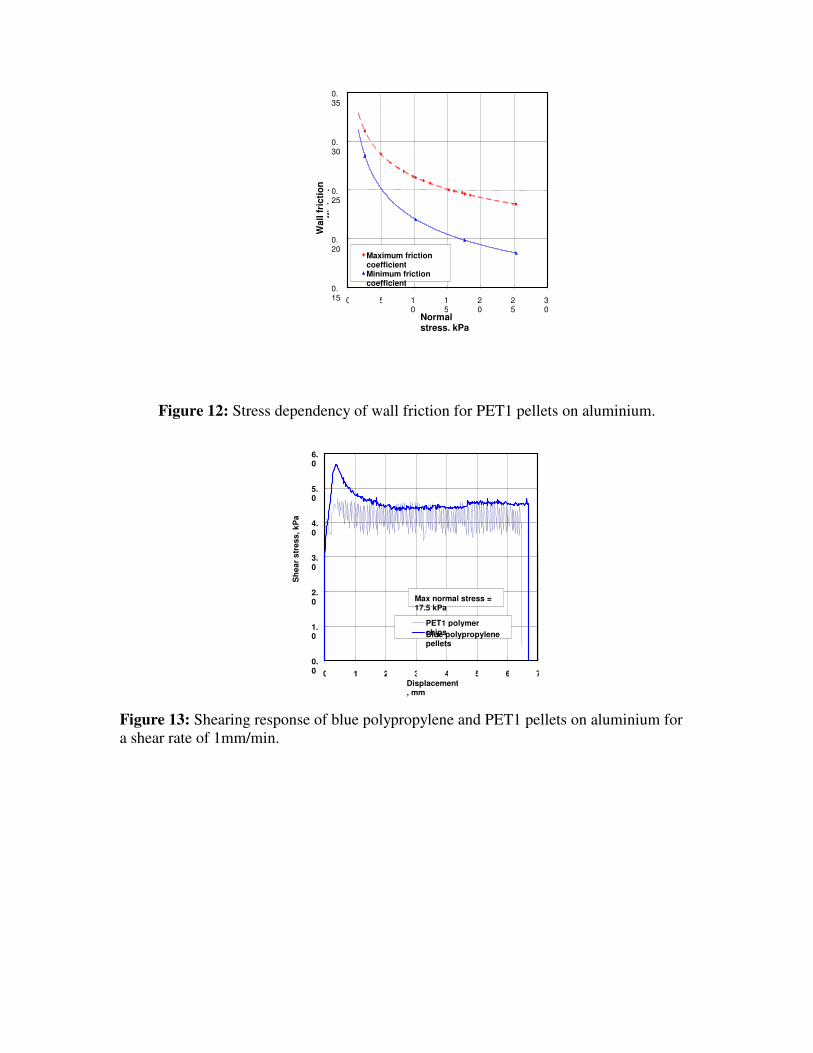
Figure 12: Stress dependency of wall friction for PET1 pellets on aluminium.
Figure 13: Shearing response of blue polypropylene and PET1 pellets on aluminium for a shear rate of 1mm/min.
0.15
0.20
0.25
0.30
0.35
0 5 10 1
5 20 2
5 30
Normal stress, kPa
Wal
l fri
ctio
n co
effic
ient
Maximum friction coefficient Minimum friction coefficient
0.0
1.0
2.0
3.0
4.0
5.0
6.0
0 1 2 3 4 5 6 7Displacement, mm
She
ar s
tres
s, k
Pa
PET1 polymer chips Blue polypropylene pellets
Max normal stress = 17.5 kPa
PET1PET1
Figure 14: Wall shear response for PET1 pellets on an aluminium wall for shear rates of 1 mm/min and 10 mm/min. The left-hand ordinate is for the shear rate of 1 mm/min and the right-hand ordinate for a shear rate of 10 mm/min.
Figure 15: The Jenike shear test apparatus for internal stress-strain measurement.
0
2
4
6
8
10
12
14
16
18
0 1 2 3 4 5 6
Displacement, mm
She
ar s
tres
s, k
Pa
Max normal stress = 25.0kPa
Max normal stress = 15.2kPa
Max normal stress = 5.0kPa
Figure 16: Inter-particle shearing response for PET1 pellets.