Embed Size (px)
Citation preview

International Journal of Signal Processing, Image Processing and Pattern Recognition
Vol.8, No.12 (2015), pp.309-322
http://dx.doi.org/10.14257/ijsip.2015.8.12.29
ISSN: 2005-4254 IJSIP
Copyright ⓒ 2015 SERSC
Investigation of EDFA based 32 Channel C-Band Optical WDM
System for Different Pumping Techniques
Mehtab Singh1 and Rajveer
2
ECE Department
Satyam Institute of Engineering and Technology, Amritsar, India [email protected],
Abstract
With the rise in demand for channel capacity, Wavelength Division Multiplexing
(WDM) technique is employed in optical communication networks. Gain Flattened
Erbium Doped Fiber Amplifier (EDFA) is used in optical WDM system to obtain a
uniform output power level. The performance of EDFA depends on various parameters
such as fiber length, pump power, pumping wavelength and pumping technique. The
objective of this paper is to analyze the performance of EDFA for different pumping
techniques namely co-propagating, counter-propagating and bidirectional propagating in
a 32 channel C-band optical WDM transmission system at different levels of pump power
and different fiber lengths. The system has been analyzed on the basis of received power,
BER, gain, noise figure and Q- Factor in the wavelength range of 1528nm to 1562nm at -
25dBm transmission power and 0.5nm channel spacing. The results obtained using
different pumping techniques are compared to find an appropriate pumping technique
which optimizes the performance of the optical WDM transmission system.
Keywords: WDM, EDFA, pumping techniques, BER, Q- Factor, received power
1. Introduction
In order to achieve high data transmission rate, long lifespan, and large capacity optical
amplifiers are essential features in optical WDM communication system networks as they
are capable of compensating the loss incurred by transmission of information signal
through the transmission medium, power splitters for multiple connectivity points and
passive networks components [1]. In optical WDM transmission technique, many
information carrying signals at different wavelengths are transmitted using the same fiber
at the same time in order to increase the capacity of the transmission system of the order
of hundreds of Gigabytes per second over a transmission distance of hundreds of
kilometer [2]. Today, many nations have employed optical WDM system as a backbone to
their Internet Infrastructure to achieve high data rates and channel capacity.
Optical Amplifiers can be utilized as in-line optical amplifiers, pre-optical amplifiers
and booster optical amplifiers, in order to efficiently transmit the information carrying
signal at a distance of more than 100 km, which has been a major area of concern for
communication systems these days.
In order to reduce loss in data transmission, optical amplifiers are capable of providing
an advance complicated solution. Optical amplifiers are capable of increasing the power
of incident light carrying information by a stimulated emission process or optical power
transmission process. Optical amplifiers are largely used in optical WDM systems which
a have high number of channels and require high pump power. Optical pumps generally
consist of semiconductor lasers having an output range varying from 20-40 dBm, which
can cause great damage to the human eye, skin and also possibly can cause fiber damage
if the information carrying beams are intense and are spread throughout the edges of the
fiber [3, 7]. Another important challenge which is faced by optical amplifier is the noise

International Journal of Signal Processing, Image Processing and Pattern Recognition
Vol.8, No.12 (2015)
310 Copyright ⓒ 2015 SERSC
which is generated by the amplifier also known as Amplifier Stimulated Noise (ASE) and
also the cross talk between different channels produced due to non-linear effects in optical
fiber link [4].
Optical Amplifiers are capable of enhancing power budget, which as a result reduces
total number of connectivity points. Optical amplifiers designs are also capable of
reducing the disastrous effects of chromatic dispersion and fiber attenuation which as a
result improves the performance of long-haul fiber optic transmission link [12]. Optical
amplifiers provide a better performance than old generation electronic regeneration
systems which convert electrical signal to optical signal and vice-versa to transmit signal
in a long-haul optical communication link.
In this paper, analysis has been done to evaluate the performance of EDFA in a 32-
channel C-band WDM optical communication link for different pumping techniques.
Performance has been evaluated on the basis of received power, BER values, eye
diagrams, gain, noise figure and Q-Factor values.
The rest of the paper is organized as follows: In Section 2, a literature survey is
presented. In Section 3, Erbium Doped Fiber Amplifier (EDFA) is discussed in brief and
also simulation setup is presented. Results and discussions are discussed in Section 4. The
conclusion to this paper is given in Section 5.
2. Literature Review
The following section shows researches carried out by different authors to investigate
the performance of EDFA in an optical WDM transmission link.
M.C. Paul, A. Pal, M. Pal, A. Dhar, R. Sen, S.K Bhandra, K. Dasgupta [5],
presents the comparison of EDFA noise figure and power gain using different
pumping techniques for a 16 channel WDM optical transmission link. Brief
introduction about different pumping techniques has been given and also the
comparison between them has been presented.
R.S Kaler and R. Kaler [6], discussed to the performance of EDFA on the basis of
noise figure and gain of EDFA and compact EDFA.
M.A Malek and A. Malekmohammadi [7], described the gain optimization of
EDFA having 32X10 Gbps data rate. In this paper, the technique to optimize gain
of EDFA for a 32 channel optical WDM system is presented.
R. Vijaya and R. Deepa [8], presented the scope of utilization of bidirectional
pumping technique in EDFA for single and multiple channel optical WDM systems.
F. Vasile and P. Schiopu [9], discussed the performance analysis of different
pumping techniques in an EDFA for optical WDM transmission system.
R.F Souza, S Milo, M.B.C. Silva, E. Conforti and C. Bordonalli [10], presented the
theoretical of utilization of different wavelength and configuration of EDFA in a
WDM system.
3. Simulation Design and Analysis
3.1. System Consideration
Any communication system consists of three basic sections: transmitter,
communication channel, and a receiver. In this investigative study Optisystem 7.0
simulation software has been used to carry out different simulations and to compare
results. The transmitter section consists of a 32 channel optical WDM transmitter and an
ideal multiplexer which combines all the channels into a single fiber. The communication
channel consists of an ideal isolator which prevents the light from propagating in the
International Journal of Signal Processing, Image Processing and Pattern Recognition
Vol.8, No.12 (2015)
Copyright ⓒ 2015 SERSC 311
backward direction. Communication channel also consists of an EDFA amplifier which
amplifies the input signal .An optical fiber of length 50 km is used in this analysis. At the
receiver end, PIN diode is used as a photo detector followed by a low pass filter which
removes any high-frequency noise present in the signal.
3.2. WDM System Design
The WDM system used for this analysis is designed using Optisystem 7.0 simulation
software. In this simulation, 32 channels have been used at the input having wavelength
range between 1530nm to 1560 nm with channel spacing of 0.8nm at a data rate of 10
Gbps. -25 dBm input power is given to all the channels. The length of optical fiber is
taken to be 50 km. EDFA fiber amplifier is used to amplify the input signal which is
pumped at different power levels at 980 nm wavelength. The isolator is used at the input
side in order to avoid any effects of ASE produced during amplification in WDM system.
Isolator also prevents the information signal from traveling in the backward direction. In
this paper, a comparison between three pumping techniques is considered i.e., co-
directional pumping, counter pumping, and bidirectional pumping.
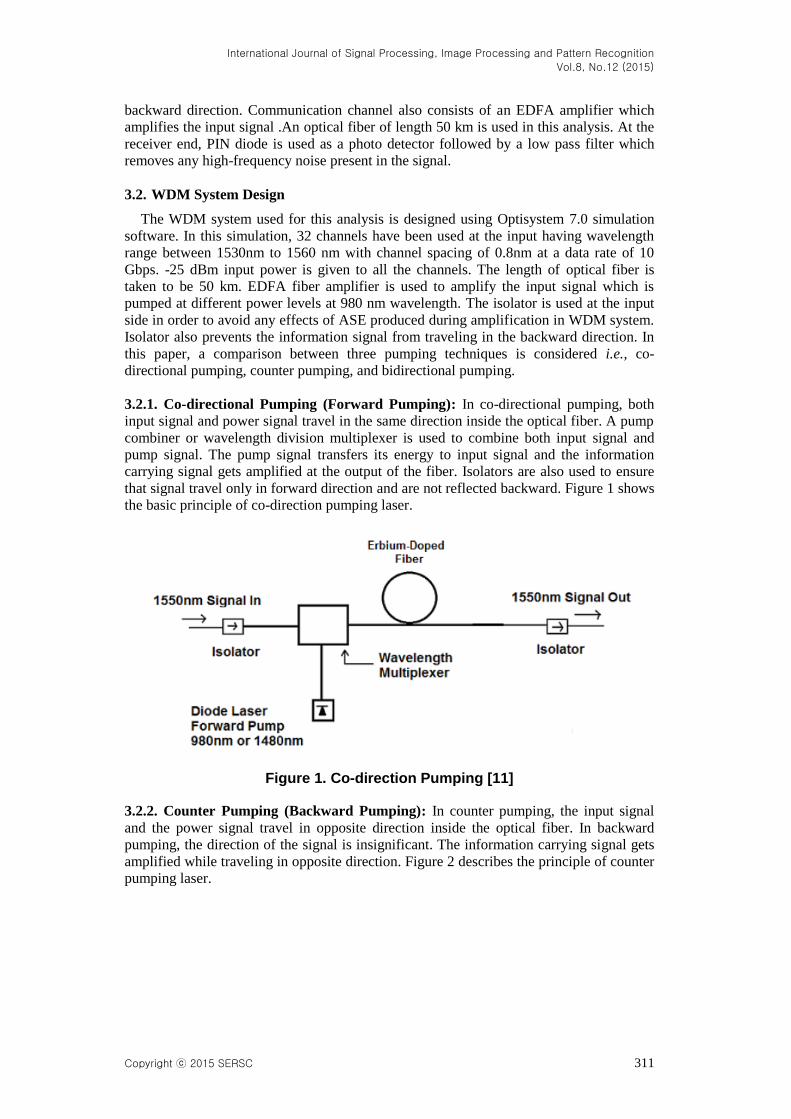
3.2.1. Co-directional Pumping (Forward Pumping): In co-directional pumping, both
input signal and power signal travel in the same direction inside the optical fiber. A pump
combiner or wavelength division multiplexer is used to combine both input signal and
pump signal. The pump signal transfers its energy to input signal and the information
carrying signal gets amplified at the output of the fiber. Isolators are also used to ensure
that signal travel only in forward direction and are not reflected backward. Figure 1 shows
the basic principle of co-direction pumping laser.
Figure 1. Co-direction Pumping [11]
3.2.2. Counter Pumping (Backward Pumping): In counter pumping, the input signal
and the power signal travel in opposite direction inside the optical fiber. In backward
pumping, the direction of the signal is insignificant. The information carrying signal gets
amplified while traveling in opposite direction. Figure 2 describes the principle of counter
pumping laser.
International Journal of Signal Processing, Image Processing and Pattern Recognition
Vol.8, No.12 (2015)
312 Copyright ⓒ 2015 SERSC
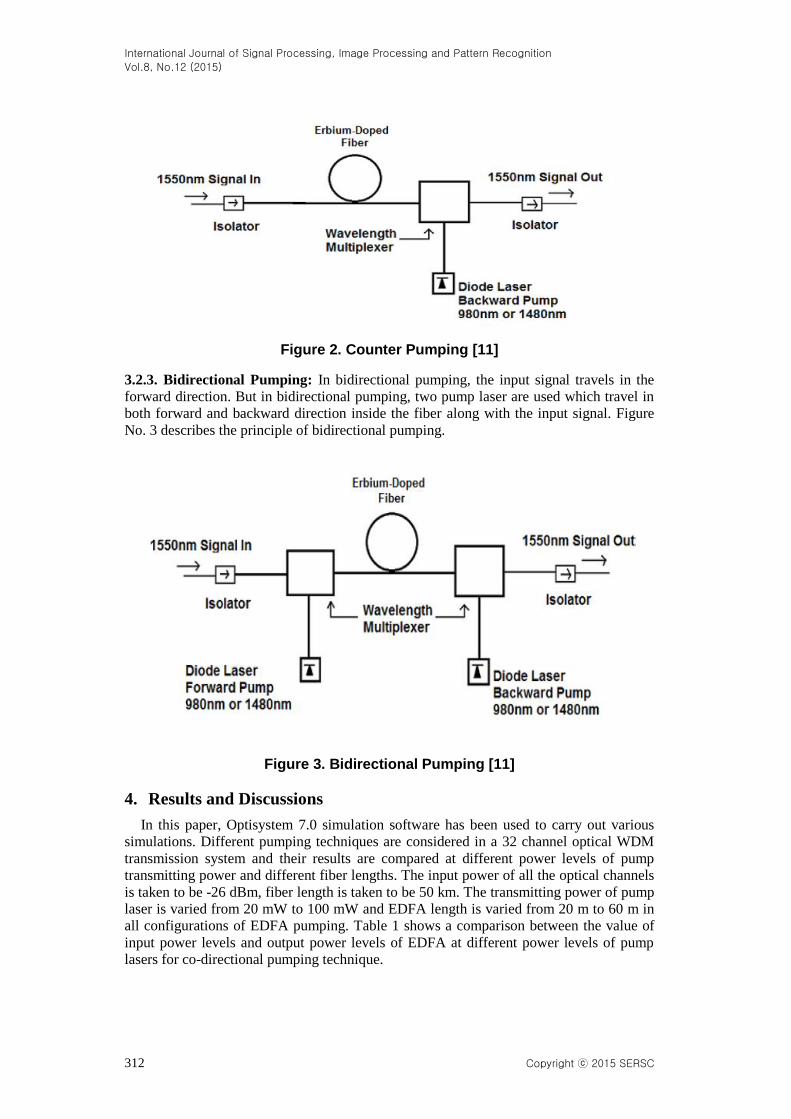
Figure 2. Counter Pumping [11]
3.2.3. Bidirectional Pumping: In bidirectional pumping, the input signal travels in the
forward direction. But in bidirectional pumping, two pump laser are used which travel in
both forward and backward direction inside the fiber along with the input signal. Figure
No. 3 describes the principle of bidirectional pumping.
Figure 3. Bidirectional Pumping [11]
4. Results and Discussions
In this paper, Optisystem 7.0 simulation software has been used to carry out various
simulations. Different pumping techniques are considered in a 32 channel optical WDM
transmission system and their results are compared at different power levels of pump
transmitting power and different fiber lengths. The input power of all the optical channels
is taken to be -26 dBm, fiber length is taken to be 50 km. The transmitting power of pump
laser is varied from 20 mW to 100 mW and EDFA length is varied from 20 m to 60 m in
all configurations of EDFA pumping. Table 1 shows a comparison between the value of
input power levels and output power levels of EDFA at different power levels of pump
lasers for co-directional pumping technique.

International Journal of Signal Processing, Image Processing and Pattern Recognition
Vol.8, No.12 (2015)
Copyright ⓒ 2015 SERSC 313
Table 1. Input and Output Power Levels for Different Pump Power Levels in Co-directional Pumping Technique
Pump Power to EDFA
(mW)
Input Power ( dBm) Output Power ( dBm)
20 -12.593 7.940
40 -12.593 12.593
60 -12.593 14.834
80 -12.593 16.320
100 -12.593 17.432
Table 2 shows a comparison between the value of input power levels and output power
levels of EDFA at different power levels of pump lasers for counter pumping technique.
Table 2. Input and Output Power levels for different Pump Power Levels in Counter Pumping Technique
Pump Power to EDFA
(mW)
Input Power ( dBm) Output Power ( dBm)
20 -12.593 -1
40 -12.593 -1
60 -12.593 -1
80 -12.593 17.078
100 -12.593 15.998
Table 3 shows a comparison between the value of input power levels and output power
levels of EDFA at different power levels of pump lasers for Bidirectional pumping
technique.
Table 3. Input and Output Power Levels for Different Pump Power Levels in Bidirectional Pumping Technique
Pump Power to EDFA
(mW)
Input Power ( dBm) Output Power ( dBm)
20 -12.593 12.488
40 -12.593 16.164
60 -12.593 18.136
80 -12.593 19.489
100 -12.593 20.521
From the above-presented tables, it can be seen that best performance is given by
bidirectional pumping technique as it gives the maximum value of output power for each
case whereas in the case of counter pumping technique the output power is negligible up
to 80 mW input power which is considered as very high value.
The performance comparison between co-directional, counter and bidirectional
pumping techniques in terms of BER and Q-factor is shown in Table 4.

International Journal of Signal Processing, Image Processing and Pattern Recognition
Vol.8, No.12 (2015)
314 Copyright ⓒ 2015 SERSC
Table 4. BER and Q-factor for Different Pumping Techniques at Different Pump Power Levels
Pump
Power
to
EDFA
(mW)
Co-Directional Pumping Counter Directional Pumping Bidirectional Pumping
Channel 1 Channel 2 Channel 1 Channel 2 Channel 1 Channel 2
BER Q -
Factor
BER Q -
Factor
BER Q -
Factor
BER Q -
Factor
BER Q -
Factor
BER Q -
Factor
20 1.23
e-
024
10.1686 2.05
e-
023
9.88909 1 0 1 0 5.45
e-
025
10.2471 3.26
e-
024
10.0715
40 8.94
e-25
10.1992 2.32
e-
024
10.1048 1 0 1 0 8.50
e-
026
10.4246 1.11
e-
025
10.3988
60 6.17
e-
026
10.4556 5.66
e-
025
10.3434 1 0 1 0 3.83
e-
026
10.5005 1.58
e-
026
10.5837
80 1.08
e-
025
10.4015 3.56
e-
024
10.2872 1.68
e-
025
10.3604 1.48
e-
024
10.1486 6.30
e-
027
10.6696 8.16
e-
026
10.8583
100 8.31
e-
027
10.6448 3.17
e-
026
10.5177 7.71
e-
024
9.98669 2.87
-024
10.0843 5.06
e-
028
10.9020 4.10
e-
028
10.921
From Table 4, it can be seen that the value of Q-factor and minimum BER is highest in
both channel 1 and channel 2 at the output of the WDM transmission system for
bidirectional pumping technique. Also it can be seen that for counter-propagating
technique, Q-Factor is 0 for low values of input power levels whereas, in the case of
bidirectional and co-propagating technique, Q-Factor increases as input power of pump
laser increases.
In this paper, the performance of EDFA has been analyzed on the basis of gain and
noise figure for different pumping techniques at different EDFA lengths (20, 40 and 60m)
and pump power levels (20, 60 and 100 mW).
4.1. Gain Characteristics
The gain for different pumping configurations has been analyzed on the basis of
varying fiber lengths at different levels of pump power 20, 60 and 100 mW as shown in
Figure 4, 5 and 6 having a constant value of the signal input. By observing the results, it
can be seen that bidirectional pumping technique presents maximum flatness of gain for a
larger range of length of fiber at pump power levels of 100 mW whereas counter pumping
technique gives worst performance of all the techniques. From the results, it can be
concluded that pump power should be increased in the case of larger fiber lengths for
more gain flatness and gain.

International Journal of Signal Processing, Image Processing and Pattern Recognition
Vol.8, No.12 (2015)
Copyright ⓒ 2015 SERSC 315
Figure 4. Gain vs. Fiber Length at 20 mW Pump Power
Figure 5. Gain vs. Fiber Length at 60 mW Pump Power
Figure 6. Gain vs. Fiber Length at 100 mW Pump Power

International Journal of Signal Processing, Image Processing and Pattern Recognition
Vol.8, No.12 (2015)
316 Copyright ⓒ 2015 SERSC
Now the gain for different pumping configurations has been analyzed on the basis of
varying pump power levels at different fiber lengths 20, 40 and 60 m as shown in Figure 7,
8 and 9 having a constant value of the signal input. By observing the results, it can be
seen that bidirectional pumping technique has more gain flatness for higher values of
pump powers at 20 m fiber length. But the gain flatness decreases as the length of the
fiber is further increased.
Figure 7. Gain vs. Pump Power at 20 m Fiber Length
Figure 8. Gain vs. Pump Power at 40 m Fiber Length

International Journal of Signal Processing, Image Processing and Pattern Recognition
Vol.8, No.12 (2015)
Copyright ⓒ 2015 SERSC 317
Figure 9. Gain vs. Pump Power at 60 m Fiber Length
4.2. Noise Figure Characteristics
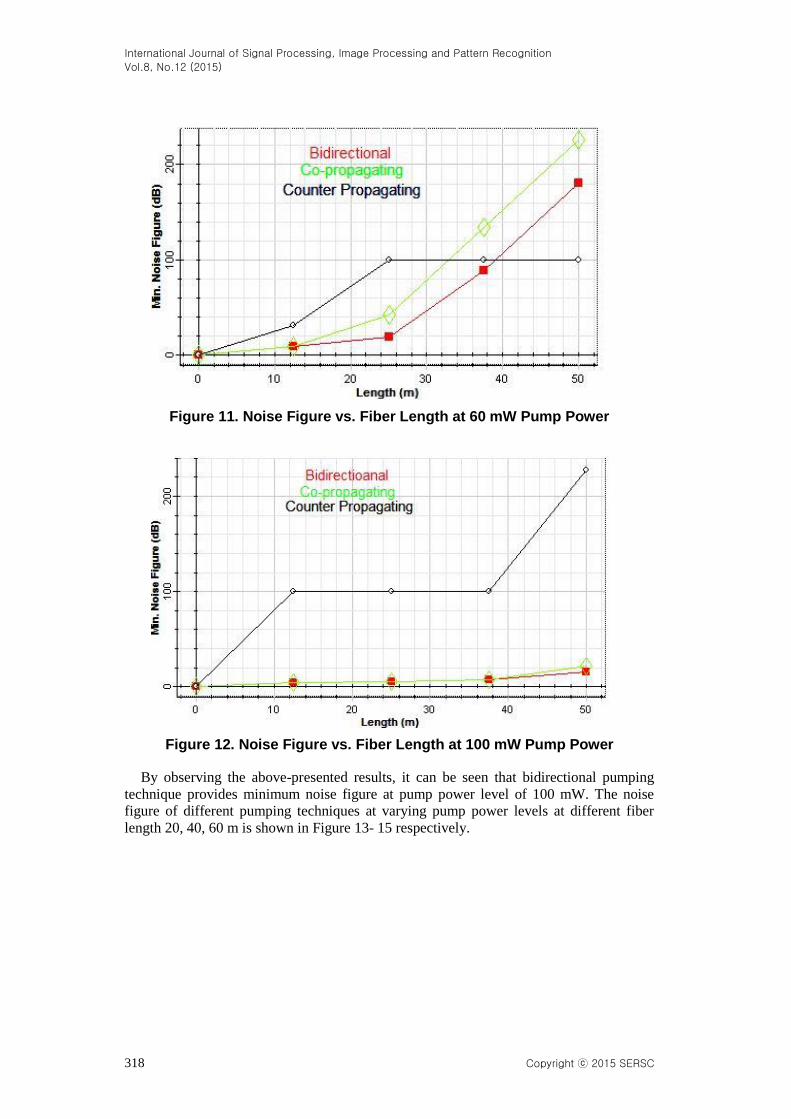
The Noise Figure for different pumping configurations has been analyzed on the basis
of varying fiber lengths at different pump power levels 20, 60 and 100 mW as shown in
Figure 10, 11 and 12 respectively.
Figure 10. Noise Figure vs. Fiber Length at 20 mW Pump Power
International Journal of Signal Processing, Image Processing and Pattern Recognition
Vol.8, No.12 (2015)
318 Copyright ⓒ 2015 SERSC
Figure 11. Noise Figure vs. Fiber Length at 60 mW Pump Power
Figure 12. Noise Figure vs. Fiber Length at 100 mW Pump Power
By observing the above-presented results, it can be seen that bidirectional pumping
technique provides minimum noise figure at pump power level of 100 mW. The noise
figure of different pumping techniques at varying pump power levels at different fiber
length 20, 40, 60 m is shown in Figure 13- 15 respectively.

International Journal of Signal Processing, Image Processing and Pattern Recognition
Vol.8, No.12 (2015)
Copyright ⓒ 2015 SERSC 319
Figure 13. Noise Figure vs. Pump Power at 20 m Fiber Length
Figure 14. Noise Figure vs. Pump Power at 40 m Fiber Length
Figure 15. Noise Figure vs. Pump Power at 60 m Fiber Length

International Journal of Signal Processing, Image Processing and Pattern Recognition
Vol.8, No.12 (2015)
320 Copyright ⓒ 2015 SERSC
From the above-presented results, it can be seen that bidirectional pumping and co-
directional pumping provide minimum noise figure in the case of 20 m fiber length but as
the length of fiber is further increased, the pumping power levels should also be increased
to reduce the noise figure.
5. Conclusion
In this paper, comparison of performance has been done for three different pumping
techniques i.e., co-directional pumping, counter pumping, and bidirectional pumping in
terms of received power level, BER, gain, noise figure and Q-factor values for pump
power varying from 20 mW to 100 mW and fiber lengths varying from 20m to 60 m in an
Erbium Doped Fiber Amplifier (EDFA) in C-band at an input power level of -25 dBm and
980 nm wavelength of pump laser. From the results discussed above it can be concluded
that the best performance is given by bidirectional pumping technique which gives the
highest value of Q-factor, BER and received power levels in each case discussed. By
observing the results presented, it can also be concluded that bidirectional pumping
provides maximum value of gain with gain flatness over a wide range of pump power
levels and a minimum value of noise figure. In the case of counter pumping, the received
power is negligible up to 60 mW and then start to increasing as the power of pump laser is
further increased.
References
[1] P. C. Becker, N.A. Olsson and J.R. Simpson, “Erbium-Doped Fiber Amplifiers: Fundamentals and
Technology”, Academic Press, New York, (1999).
[2] G. P. Agarwal, “Fiber-Optic Communication Systems”, John Wiley& Sons, New York, (1997).
[3] C. Headley and G.P. Agarwal, “Raman Amplification in Fiber Optical Communication Systems”,
Elsevier Academic Press, (2005).
[4] M.N. Islam, “Raman Amplifiers for Telecommunications 1”, Physical principles, Springer, (2004).
[5] M.C. Paul, A. Pal, M. Pal, A. Dhar, R. Sen, S.K Bhandra and K. Dasgupta, “Investigation of the optical
gain and noise figure for multichannel amplification in EDFA under optimized pump condition”, pp.407-
412, Elsevier, (2007).
[6] R.S Kaler and R. Kaler, “Gain and Noise figure performance of Erbium doped fibre amplifiers (EDFA)
and compact EDFAs”, Elsevier, (2011), pp. 440-443.
[7] M.A Malek and A. Malekmohammadi], “Limitation in the intrinsic method of EDFA gain optimization
for 32X10 Gbps WDM systems”, Elsevier, (2011).
[8] R. Vijaya and R. Deepa, “Influence of bidirectional pumping in high-power EDFA on single-channel,
Multichannel and pulsed signal amplification”, Elsevier, (2008), pp. 20-26.
[9] F. Vasile and P. Schiopu, “The EDFA Performance with gain versus pump power”, IEEE Semiconductor
Conference, vol. 1, (2004).
[10] R. F. Souza, S. Milo, M.B.C. Silva, E. Conforti and C. Bordonalli, “An EDFA Theoretical Analysis
Considering Different Configuration and Pumping Wavelengths”, IEEE Microwave and Optoelectronics
Conference, vol. 1, (2003), pp. 105-110.
[11] A.C. Cokrak and A. Altuncu, “Gain and Noise Figure Performance of Erbium Doped Fiber Amplifiers”,
Journal of Electrical & Electronics Engineering, vol. 4, (2004), pp. 1111-1122.
[12] S. Raghavan, J Downie, J Hurley, Y. Mauro and M. Sauer, “Fiber Attributes & Dispersion Compensation
Strategies in Optical Communication Systems”, International conference on Fiber Optics and Photonics,
(2008).
Authors
Mehtab Singh did his B.E in Electronics and Communication
Engineering from Thapar University, Patiala, India in the year 2013
and M.Tech in Electronics and Communication Engineering with
specialization in Communication Systems from Guru Nanak Dev
University, Amritsar, India in the year 2015. Presently, he is
working as an Assistant Professor in the department of Electronics
and Communication Engineering, Satyam Institute of Engineering
International Journal of Signal Processing, Image Processing and Pattern Recognition
Vol.8, No.12 (2015)
Copyright ⓒ 2015 SERSC 321
and Technology, Amritsar, India. His areas of interests include
Optical Fiber Communication and Communication Systems.
Rajveer did his B.Tech in Electronics and Communication
Engineering from Amritsar College of Engineering and Technology,
Amritsar, India in the year 2012 and M.Tech in Electronics and
Communication Engineering with specialization in Communication
Systems from Guru Nanak Dev University, Amritsar, India in the
year 2014. Presently, he is working as an Assistant Professor in the
department of Electronics and Communication Engineering,
Satyam Institute of Engineering and Technology, Amritsar, India.
His areas of interests include Optical Communication and
Optoelectronic Devices.

International Journal of Signal Processing, Image Processing and Pattern Recognition
Vol.8, No.12 (2015)
322 Copyright ⓒ 2015 SERSC