Embed Size (px)
Citation preview

Article 1
Investigation of disintegration and dissolution 2
behavior of mefenamic acid drug formulation using 3
numeric solution of Noyes-Whitney equation with 4
cellular automata model on microtomographic 5
surfaces and rational arrangements of tablet 6
components. 7
Reiji Yokoyama1,2, Go Kimura2, Christian Schlepütz3, Jörg Huwyler1, Maxim Puchkov1* 8 1 Department of Pharmaceutical Sciences, Division of Pharmaceutical Technology, University of Basel, 9
Klingelbergstrasse 50, CH4056 Basel, Switzerland 10 2 Formulation R&D Center, CMC R&D Division, SHIONOGI & CO., LTD., Hyogo, Japan, E-mail: 11
[email protected] 12 3 Paul Scherer Institute, Villingen, Switzerland, E-mail: [email protected] 13 * Correspondence: E-mail: [email protected]; Tel.: +41 61 207 1619 14 15
Abstract: There are numerous approaches to model an influence of manufacturing parameters on 16 the dissolution and disintegration of solid dosage forms. A modern approach for modelling and 17 simulating complex and heterogeneous systems such as pharmaceutical tablets focuses on 18 computationally-intensive finite-element or discreet element methods. Industrial challenges such as 19 Process Analytical Technology (PAT) and Quality by Design are stimulating computer-based 20 technologies to design, control and improve the quality of pharmaceutical compacts and their 21 performance. In this study the disintegration and dissolution model based on the numerical 22 solutions of the Noyes-Whitney equation and cellular automata supported disintegration model are 23 proposed and evaluated. The results from in vitro release studies of the mefenamic acid formulations 24 were compared to the calculated release patterns from the tablet structures obtained from 25 microtomography experiments and the purely algorithmically created virtual tablets. 26
Keywords: drug release simulation, disintegration simulation, poorly water soluble drug, 27 mefenamic acid, Noyes-Whitney equation, cellular automata, synchrotron microtomography 28
29
1. Introduction 30 Many different types of simulation have been developed to model the mechanical and 31
dissolution behaviour of particles and tablets [1,2] and to also understand the key factors that affect 32 the drug product quality. For example, Finite Element Method (FEM), in which the powder is treated 33 as a continuous material, has been used to simulate the mechanical behaviour such as stress 34 distribution and density distribution of tablets during compaction [3] and to simulate the drug release 35 from hydrogel-based matrix tablets [4]. The Discrete Element Method (DEM) has been applied to 36 simulate the swelling and dissolution of the hydrophilic polymer tablet with different tablet shape, 37 component and drug loading [5–8] and has also been applied to characterize the breakage of 38 agglomerates and tablets [9,10]. In addition, DEM and FEM hybrid models have been developed for 39 particle breakage and compaction simulation [11,12]. Ideally, DEM requires a large number of virtual 40 particles to take into account the microstructure and component heterogeneity of pharmaceutical 41 tablets [5,13]. However, it is computationally expensive, due to a requirement to calculate physical 42 and chemical interaction for all individual particles in the system [14]. Therefore, DEM is often using 43
Preprints (www.preprints.org) | NOT PEER-REVIEWED | Posted: 22 October 2018 doi:10.20944/preprints201810.0490.v1
© 2018 by the author(s). Distributed under a Creative Commons CC BY license.
Peer-reviewed version available at Pharmaceutics 2018, 10, 259; doi:10.3390/pharmaceutics10040259

2 of 17
larger spatial subdivisions, i.e., smaller number of larger particles as compared to those in reality [15]. 44 In addition, a knowledge about numerous input parameters is necessary to simulate complex systems 45 with DEM. The DEM model needs to be validated experimentally, which can be difficult [14]. The 46 cellular automata algorithm has been proposed as a modelling technique [16,17], and it has been 47 applied to simulate the drug release of tablets [18,19]. Three-dimensional cellular algorithms allow 48 the calculation of matrices containing several components organized a large number of discrete 49 cubes; this is possible due to the simplicity of the calculation, as compared to DEM models [14]. For 50 example, it has been reported that the disintegration time of tablets [20], buoyancy and drug release 51 profiles of gastroretentive floating tablets [21,22] were simulated with the three-dimensional cellular 52 automata algorithm. 53
Drug release of tablets is influenced by the solubility of the active pharmaceutical ingredient 54 (API) [23,24], particle size distribution [25], granule size and their arrangement [26–28]. In addition, 55 it is well known that the drug release of the pharmaceutical tablets can be influenced by the tablet 56 porosity due to change in disintegration behaviour of tablet, i.e. tablet disintegration time increase 57 with a decrease in tablet porosity, resulting in a slow water penetration into tablet [29,30]. 58 Furthermore, in general, the tablet porosity can be variable due to the batch-to-batch difference in 59 compressibility of the powders/granules and variation of compressive stress in the high-speed tablet 60 compaction. Therefore, from the formulation and process development and quality assurance point 61 of view, the development of tools for computational elucidation of material attributes and production 62 process influence on drug release is very important. 63
Validation of the simulation results is a challenging topic, mostly arising from an inability to 64 describe the internal structure of a tablet in sufficiently precise way, i.e., including internal structures 65 at simulation resolution. This challenge is addressed with X-ray computed microtomography, which 66 is a technology to visualize the three-dimensional structure of compacts, and it has been applied to 67 visualize the internal pore structure of the tablet and quantitate the density distribution [31,32]. And 68 it has also been applied to elucidate the correlation between tablet internal structure and dissolution 69 behaviour [33–35]. 70
The purpose of this study is to simulate the dissolution and disintegration behaviour of a poorly 71 soluble drug formulation applying numeric solutions for dissolution calculation based on Noyes-72 Whitney equation and cellular automata model for tablet disintegration. The influence of 73 components’ particle arrangement and tablet porosity on drug release profiles has been investigated 74 by simulation of drug release from microtomographic three-dimensional surfaces of real tablets and 75 from arrangements obtained with three-dimensional cellular automata algorithm. A combined 76 approach for modelling complex multilevel physical process such as dissolution-disintegration has 77 been proposed. 78
2. Materials and Methods 79 2.1 Materials 80
Mefenamic acid (SIGMA, USA) was used as a model compound to prepare rapid disintegrating 81 tablets. The excipients used were D-mannitol (Pearlitol 25C, Roquette, France) and microcrystalline 82 cellulose (Avicel PH-101, FMC bioPolymer, USA) as diluents, croscarmellose sodium (Ac-Di-Sol, 83 FMC bioPolymer, USA) as disintegrant, Hydroxypropyl cellulose (HPC SL, NIPPON SODA, Japan) 84 as binder and magnesium stearate (Peter Greven GmbH & Co, Germany) as a lubricant. 85 Cetyltrimethylammonium bromide (CTAB) (Merck, USA) was used as a surfactant for disintegration 86 tests and dissolution tests. 87
2.2 Methods 88
2.2.1 Preparation of tablets 89
The formulation of mefenamic acid tablet of 250 mg used for this study was prepared according 90 to Table 1. Mefenamic acid, D-mannitol, microcrystalline cellulose and croscarmellose sodium were 91
Preprints (www.preprints.org) | NOT PEER-REVIEWED | Posted: 22 October 2018 doi:10.20944/preprints201810.0490.v1
Peer-reviewed version available at Pharmaceutics 2018, 10, 259; doi:10.3390/pharmaceutics10040259

3 of 17
weighted and granulated in a high-shear mixer (MYCROMIX, OYSTAR Hüttlin, Germany). The 92 powders were pre-mixed for 1 min at an impeller speed of 250 rpm. Next, the granulation process 93 was carried out at 250 rpm of impeller speed with chopper speed of 2000 rpm. Hydroxypropyl 94 cellulose solution (10% w/w) was added at a spray rate of approx. 5 g/min. After adding the binding 95 solution, water was added at the same spray rate to flush the line. The process was continued for 1 96 min. The obtained wet-granulates were dried and milled using screen mill (Fitz mill model L1A, Fitz 97 Patrick, USA). Afterwards, the milled granules were mixed with croscarmellose sodium and 98 magnesium stearate as an external phase. Tablets were compressed using a compaction simulator 99 (StylOne, Medel pharma, France). The target dwell-time for pre-compression and main-compression 100 were set to 25 ms. The compaction parameters are shown in Table 1. An 11.28 mm round flat-faced 101 punch set was used for the preparation of formulation. 102
103
2.2.2 Determination of tablet porosity and tensile strength 104
Mean tablet weight was evaluated with an electronic balance (AX204 Delta Range, Mettler 105 Toledo, Switzerland). In addition, tablet diameter and tablet thickness were evaluated with a digital 106 caliper (CD-15CPX, Mitutoyo, Japan). All obtained values of tablet weight, diameter and thickness 107 were within 1% deviation. True densities of all raw materials were evaluated using helium 108 pycnometry (AccuPyc 1330, Micrometrics, USA). The values are given in Table 1. 109
Table 1. Formulation compositions and tablet compaction parameters (A1-A4) 110 Formulation
Formulation Composition True density (g/cm3) mg %, w/w
Granular Composition
Mefenamic acid 1.2554 250.0 50.0
D-mannitol 1.4888 165.0 33.0
Microcrystalline cellulose 1.5701 50.0 10.0
Croscarmellose sodium 1.5757 10.0 2.0
Hydroxypropyl cellulose 1.2334 15.0 3.0
Granulate - 490.0 98.0
External Phase Composition
Croscarmellose sodium 1.5757 5.0 1.0
Magnesium stearate 1.0539 5.0 1.0
Tablet weight - 500.0 -
Tablet Parameters (N=9) - A1* A2 A3 A4
Tablet porosity (%, v/v) - 6 9 14 23
Compressive stress (MPa) - 210 150 99 45
* Indicates tablet formulation from composition A compressed at 210MPa 111
112
True density of tablets were calculated according to Eq. (1). 113
휌 =1
∑ X휌 (1)
Preprints (www.preprints.org) | NOT PEER-REVIEWED | Posted: 22 October 2018 doi:10.20944/preprints201810.0490.v1
Peer-reviewed version available at Pharmaceutics 2018, 10, 259; doi:10.3390/pharmaceutics10040259
4 of 17
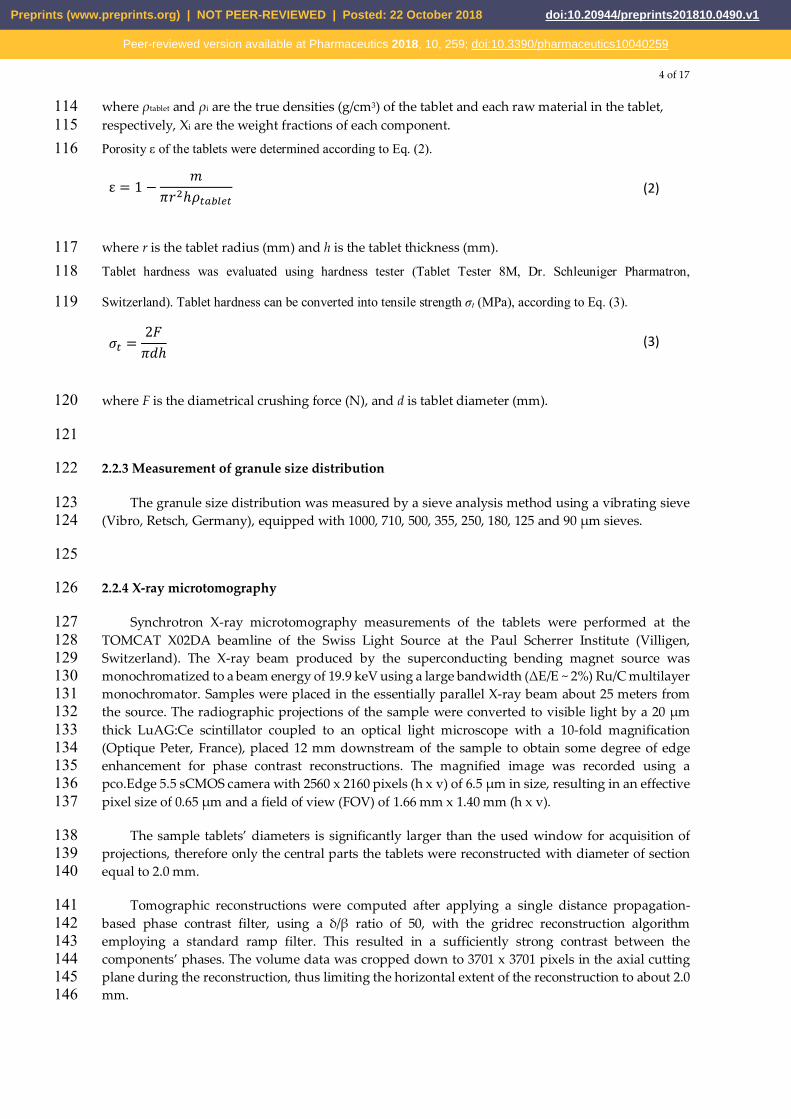
where ρtablet and ρi are the true densities (g/cm3) of the tablet and each raw material in the tablet, 114 respectively, Xi are the weight fractions of each component. 115 Porosity ε of the tablets were determined according to Eq. (2). 116
ε = 1 −푚
휋푟 ℎ휌 (2)
where r is the tablet radius (mm) and h is the tablet thickness (mm). 117 Tablet hardness was evaluated using hardness tester (Tablet Tester 8M, Dr. Schleuniger Pharmatron, 118
Switzerland). Tablet hardness can be converted into tensile strength σt (MPa), according to Eq. (3). 119
휎 =2퐹휋푑ℎ
(3)
where F is the diametrical crushing force (N), and d is tablet diameter (mm). 120
121
2.2.3 Measurement of granule size distribution 122
The granule size distribution was measured by a sieve analysis method using a vibrating sieve 123 (Vibro, Retsch, Germany), equipped with 1000, 710, 500, 355, 250, 180, 125 and 90 μm sieves. 124
125
2.2.4 X-ray microtomography 126
Synchrotron X-ray microtomography measurements of the tablets were performed at the 127 TOMCAT X02DA beamline of the Swiss Light Source at the Paul Scherrer Institute (Villigen, 128 Switzerland). The X-ray beam produced by the superconducting bending magnet source was 129 monochromatized to a beam energy of 19.9 keV using a large bandwidth (ΔE/E ~ 2%) Ru/C multilayer 130 monochromator. Samples were placed in the essentially parallel X-ray beam about 25 meters from 131 the source. The radiographic projections of the sample were converted to visible light by a 20 μm 132 thick LuAG:Ce scintillator coupled to an optical light microscope with a 10-fold magnification 133 (Optique Peter, France), placed 12 mm downstream of the sample to obtain some degree of edge 134 enhancement for phase contrast reconstructions. The magnified image was recorded using a 135 pco.Edge 5.5 sCMOS camera with 2560 x 2160 pixels (h x v) of 6.5 μm in size, resulting in an effective 136 pixel size of 0.65 μm and a field of view (FOV) of 1.66 mm x 1.40 mm (h x v). 137
The sample tablets’ diameters is significantly larger than the used window for acquisition of 138 projections, therefore only the central parts the tablets were reconstructed with diameter of section 139 equal to 2.0 mm. 140
Tomographic reconstructions were computed after applying a single distance propagation-141 based phase contrast filter, using a δ/β ratio of 50, with the gridrec reconstruction algorithm 142 employing a standard ramp filter. This resulted in a sufficiently strong contrast between the 143 components’ phases. The volume data was cropped down to 3701 x 3701 pixels in the axial cutting 144 plane during the reconstruction, thus limiting the horizontal extent of the reconstruction to about 2.0 145 mm. 146
Preprints (www.preprints.org) | NOT PEER-REVIEWED | Posted: 22 October 2018 doi:10.20944/preprints201810.0490.v1
Peer-reviewed version available at Pharmaceutics 2018, 10, 259; doi:10.3390/pharmaceutics10040259

5 of 17
The preparative processing of the reconstructed data was performed in Image J 1.51j8 (National 147 Institutes of Health, USA) by first binning by factor 4 in all dimensions using an averaging function 148 to reduce the memory footprint necessary for effective computation, followed by a SLIC Superpixels 149 [36] clustering analysis for the segmentation of tablet components. In the resulting multipage TIFF 150 file, the individual components’ corresponding pixels were mapped according to their types (e.g., for 151 mefenamic acid the value of 1 was applied) and imported directly into Particle Arrangement and 152 Compaction module of the software. 153
154
2.2.5 Disintegration test 155
The disintegration times were measured using a disintegration tester (Sotax DT3, Sotax AG, 156 Switzerland), according to USP 24 method. Tests were carried out in 900 mL of 50 mM Na-phosphate 157 buffer (pH6.8) containing 1% CTAB at 37°C±0.5 (n=3). All tests were done in triplicate using six tablets 158 for each test. 159
160
2.2.6 Dissolution test 161
Dissolution tests of the tablets were carried out using the USP dissolution apparatus II 162 (AT7smart, Sotax, Switzerland) in 900 mL of 50 mM Na-phosphate buffer (pH6.8) containing 1% 163 CTAB at 37°C±0.5 with a paddle rotation of 75 rpm (n=6). Drug concentrations in the dissolution 164 media were measured by a UV/Vis spectrophotometer (Lambda 25, Perkin Elmer, USA) at 165 wavelength of 294 nm every 5 min. 166
167
2.3 Simulation of drug release with cellular automata 168
2.3.1 Application of Noyes-Whitney equation in numeric calculation of drug dissolution 169
Drug release calculation model is based on the numeric solution of multiarticulate system 170 defined in three-dimensional space according to the tablet geometry. Tablet geometry is 171 approximated by cubic mesh, the centre of mass for all resulting voxels is in the centre of every cubic 172 mesh element. To calculate the integral drug release from all voxels, the rate of dissolution dm/dt from 173 a voxel element representing a solid drug particle surrounded by solvent voxels under sink 174 conditions can be mathematically described according to Eq. (4). 175
dm/dt=(A∙D)/λ∙(C_s-C) ,C→0 (sink condition) (4) 176
where voxel contact surface area A (cm2) is 푨 = (ퟏ/푵)흅흀ퟐ, N is the number of neighbours 177 (N=26), diffusion coefficient D (cm2/s) is according to the Stokes-Einstein relation [35], Eq. (5), Cs is 178 the solubility at equilibrium and at experimental temperature, C is the concentration of the solid in 179 the bulk of the dissolution medium at time t. The diffusion coefficient is calculated according to the 180 Eq. (5). 181
퐷 = ∙ 휅 ∙ (푇 + 273.15), (5)
where frictional coefficient f for a sphere given by the Stokes’ law is 풇 = ퟔ흅휼푹 [37], viscosity of 182 water η (Pa·s) is η = 2.414·10−5·10247.8/((T+273.15)−140) , kb=1.3806488·10-16 (cm2·kg·s-2·K-1) is Boltzmann 183 constant, T (°C) is temperature, and R (Å) is Stokes radius. 184
Preprints (www.preprints.org) | NOT PEER-REVIEWED | Posted: 22 October 2018 doi:10.20944/preprints201810.0490.v1
Peer-reviewed version available at Pharmaceutics 2018, 10, 259; doi:10.3390/pharmaceutics10040259

6 of 17
The Stocks-Einstein equation is valid only for limited conditions, and initially was applied for 185 ideal gases. To calculate the realistic diffusion of the molecules in the dissolution medium, the 186 molecular dynamic simulations are used. We employ Desmond 4.8 (D. E. Shaw Research, NY, USA) 187 molecular dynamics simulation for single mefenamic acid molecule in presence of water molecules, 188 at simulated temperature of 310K. The entire root mean deviations (RDMS) of a molecule has been 189 recorded and the diffusion coefficient has been calculated from the slope of the sums of squared 190 displacements (Figure 1, b) according to the Eq. (6) [38]: 191
퐷 = ∑⟨|푟(푡) − 푟(0)| ⟩, (6) 192
Where r(t) is the actual molecular displacement in Å2, and D is coefficient of self-diffusion. 193
194
Figure 1. (a) A molecular dynamic setup is shown to simulate the diffusion process of a single 195 molecule of the mefenamic acid in aqueous media. (b) The root squared mean deviations of the 196 target molecule within 7 ns of simulation time. The slope is the first derivative by time and is used 197 to estimate the diffusion coefficient. 198
The resulting value for the diffusion coefficient of mefenamic acid in water was 3.57e-7 cm2/s, 199 which is in combination with eq.4 and mass of a single drug voxel yields a C1 value of 22082 (Table 200 2), i.e., C1 is a voxel mass divided by the rate of the mass transfer from 1/26th of the voxel surface. 201 This constant is used for convenience during simulation, and is just an F-CAD compatible way of 202 describing dissolution kinetics. 203
The voxel contact surface area is calculated as 1/26 of total voxel area, which is calculated as a 204 surface on an inscribed sphere into the grid element. This assumption is not representing the full 205 complexity of an interface contact between liquid a solid, however allows for sufficiently accurate 206 mass transfer calculation during simulation. The spatial subdivision of the computed voxel into 26 207 individual interfaces is according to Moor type special neighborhood and is an art of stencil for 208 solving partial differential equations. An increase in number of used voxels, i.e., decrease in the voxel 209 size, improves calculation accuracy yet increases computational costs. 210
Once the rate of mass migration due to dissolution are calculated with Eq. (4), the mass of every 211 voxel is calculated during the integration step. The integration is carried out by a simple Euler scheme 212 on 26-point stencil, assuming sufficiently small Δt to minimize error. 213
To reflect the multicomponent nature of a typical pharmaceutical formulation, e.g., different 214 diffusion coefficients and solubilities of its components, the voxels are assigned type information 215 along with physicochemical properties to calculate the mass transfer rates (Eq. 4, 5). The type 216 information is used while traversing the voxel’s neighbourhood and calculating mass transfer rate 217
Preprints (www.preprints.org) | NOT PEER-REVIEWED | Posted: 22 October 2018 doi:10.20944/preprints201810.0490.v1
Peer-reviewed version available at Pharmaceutics 2018, 10, 259; doi:10.3390/pharmaceutics10040259

7 of 17
for every voxel’s interface, therefore giving an integral difference value for mass migration at a time 218 t, reflecting the heterogeneous nature of the calculated system. 219
The above described method, despite its apparent simplicity, is very useful for finding the 220 solutions of a mass distribution function, i.e., a distribution of dissolved and undissolved 221 heterogeneous materials at the defined time intervals. However, this approach is only suitable for 222 simulation of non-disintegrating, non-swelling solid pharmaceutical dosage forms, e.g., lozenges. 223
To incorporate an effect of tablet disintegration into the simulation algorithm, the concept of 224 state change is applied to each voxel after calculation of the dissolution rates and integration. The 225 algorithm of disintegration modelling consists of X stages: 226
1. As soon as a disintegrant cell is signalled to get in contact with a medium type voxel, it is state 227 is converted to “active”. 228
2. All “active” disintegrant cells mark their direct neighbours for random scattering within the 229 calculation matrix. The labelling depth, i.e., radius around the active disintegrant particles can be set 230 through the simulations parameter. In this study this parameter was kept to unity. 231
3. All marked cells are randomly distributed in the surrounding medium to maximize the contact 232 surface to the liquid. 233
4. As soon as the disintegrant cell is “activated”, it loses its action; therefore, the random scattering 234 of its neighbourhood can be fired only once. 235
The dissolution and disintegration algorithms as described above are realized in using the 236 modelling software package F-CAD v.2.0, Linux Edition (CINCAP GmbH, Switzerland) applying 237 parallel graphical processing units (Kepler architecture) and dedicated libraries (CUDA 9.1) from 238 Nvidia (Palo Alto, CA, USA) to reduce the computation time. The simplicity of the proposed 239 algorithm allows its realization on other computational platforms, such as Python or MATLAB, if the 240 usage of the specialized software is restricted. The size of the voxel matrix was set to 3303 elements, 241 including solid and dissolution medium voxel types. This calculation matrix size was kept for both 242 types of the simulation matrices, the one obtained from microtomography and algorithmically 243 created ones. 244
For a comparative analysis between the calculated release pattern obtained from 245 microtomography experiments and the algorithmically created calculation matrix the latter was 246 constructed by applying cellular automata algorithms for voxel types. To mimic the granular particle 247 arrangement, i.e., to simulate arrangement of the pre-granulated internal phase within tablet 248 constraints, the “swiss cheese” arrangement procedure was used. In details this method is described 249 in [18], where the initial granular placeholders are enlarged by sequential application of the CA rule 250 [00101110111111111111111111], where a digit position corresponds to the number of neighbour cells 251 containing the type of interest. In other words, this notation can be transformed into a set of 26 252 production rules, for example: 253
Rule: If a cell has 3 positive neighbours, then on the next epoch this cell becomes positive. 254
Rule: If a cell has 2 positive neighbours, then on the next epoch this cell remains unchanged. 255
The result of the sequential application of the above stated rule for Moor type neighbourhood, 256 on the number of cell triplets randomly distributed in the calculation space results on development 257 of sphere-like objects. These objects, consisting of multiples of individual cells, start to compete for 258 space, therefore, eventually will form a non-uniform size distribution. The rule application is stopped 259 as soon as the size distribution reaches the target values, which were set to correspond to the values 260
Preprints (www.preprints.org) | NOT PEER-REVIEWED | Posted: 22 October 2018 doi:10.20944/preprints201810.0490.v1
Peer-reviewed version available at Pharmaceutics 2018, 10, 259; doi:10.3390/pharmaceutics10040259

8 of 17
obtained from real granules after high shear granulation. The acceptance range was set to +/- 10% 261 from the average of the real granules. 262
As soon as the virtual granules were formed, the remaining volumes were blocked by an 263 auxiliary component. The virtual granular material was removed, leaving empty pores in size and 264 shapes of the granules, in other words a negative to granules. The voids were filled with randomly 265 distributed cells corresponding to mefenamic acid, D-mannitol, sodium croscarmellose, 266 hydroxypropyl cellulose, and microcrystalline cellulose. The concentrations of the visual material 267 were kept equal to the values from experimentally obtained granules. As the next step the auxiliary 268 material is removed, and the remaining intergranular voids are filled with the external phase, i.e., 269 remaining amounts of disintegrant and lubricant. In the Figure 2, the resulting matrix is shown in 270 contrast to the microCT of the real tablet. 271
272
a) b) 273
c) d) 274
e) 275
Preprints (www.preprints.org) | NOT PEER-REVIEWED | Posted: 22 October 2018 doi:10.20944/preprints201810.0490.v1
Peer-reviewed version available at Pharmaceutics 2018, 10, 259; doi:10.3390/pharmaceutics10040259

9 of 17
Figure 2. (a) The horizontal cross sectional image of formulation A2 analysed by the 276 microtomography. (b) The vertical cross sectional image of formulation A2 analysed by the 277 microtomography. (c) The results of the volume rendering from microtomographic reconstruction 278 for formulation A2 (red voxel color corresponds to mefenamic acid) and (d) algorithmically created 279 components arrangement (blue voxels correspond to virtual mefenamic acid particles). (e) The 280 skeletonized drawing of the particles distribution (only drug component) is shown after 10 seconds 281 of simulated dissolution. 282
The values used to calculate the dissolution rate constants for mefenamic acid and other 283 formulation components are summarized in the Table 2. 284
Table 2. Summary of the parameters used for the in silico dissolution simulation 285
Component
True density
(g/cm3) Type ID Component code C1 constant C2 constant
Mefenamic acid 1.2554 1 API 22082 Not applicable
D-mannitol 1.4888 10 Non swelling, soluble filler 200 Not applicable
Microcrystalline cellulose 1.5701 31 Non-swelling or negligible
swelling, insoluble fillers
insoluble Not applicable
Croscarmellose sodium 1.5757 61 Fibrous disintegrant insoluble 2
Hydroxypropyl cellulose 1.2334 41 Hydrophilic swelling matrix 1e8 1000
Magnesium stearate 1.0539 71 Hydrophobic ingredient insoluble Not applicable
286
2.3.2 Matrices arrangement of tablets 287
The simulations of the drug release of mefenamic acid tablets were carried out using the software 288 package F-CAD v.2.0. For the simulation of the experimental tablet, the flat-faced round virtual 289 tablets with a diameter of 2 mm were generated. This size was chosen to match the microtomographic 290 acquisition, where the entire tablet scanning was not carried out due to technical limitations. The 291 virtual tablet was discretized into a cubic grid using a voxel side length of 6.5 μm (with 3303 elements), 292 equal to the microtomographic resolution with voxel side length of 6.5 μm. 293
294
2.3.3 Comparison of drug release pattern between experimental and simulated profiles 295
To evaluate the similarity factor (f2) between simulated and experimental release profiles, the 296 equation (7) was used [39]. 297
푓 = 50 ∙ log 1 + ∑ (푅 − 푇 ).∙ 100 , (173) 298
where n is the number of time points, Rt is the dissolution rate of the experimental tablet at time t, Tt 299 is the dissolution rate of the simulated tablet at time t. A similarity factor (f2) greater than 50 indicates 300 close correlation between simulated and experimental data. 301
302
3. Results 303
3.1 In vitro evaluation of drug release 304
Preprints (www.preprints.org) | NOT PEER-REVIEWED | Posted: 22 October 2018 doi:10.20944/preprints201810.0490.v1
Peer-reviewed version available at Pharmaceutics 2018, 10, 259; doi:10.3390/pharmaceutics10040259

10 of 17
The properties of the experimental tablets and its compaction condition are summarized in Table 305 3. In vitro drug release of tablets with different porosities were carried out, the results are shown in 306 the Figure 3 for uncompacted granules and tablets. 307
308
Figure 3. Experimental drug release from mefenamic acid formulations. 309
As it can be seen from the Figure 3, the release rate is influenced by the tablet porosity, however 310 not for all formulations. The uncompressed granules have very distinctive release profile, quite 311 differentiating from the tablets. 312
313
3.2 Granule size distribution experimentally measured and designed in simulation matrixes. 314
The granule size distribution of the milled granules is shown in Figure 4. 315
316
Figure 4. Granule size distribution of mefenamic acid formulation. 317
318
The granule size distribution is basically single peak and the sieve fraction of 355-500 μm is 319 greater than any other size fractions, hence the granule size distributions in the algorithmically 320 created matrixes were designed to average 400 μm for formulation A1 to A4. 321
0%
5%
10%
15%
20%
25%
30%
Freq
uenc
y (%
)
Granule size (mm)
Preprints (www.preprints.org) | NOT PEER-REVIEWED | Posted: 22 October 2018 doi:10.20944/preprints201810.0490.v1
Peer-reviewed version available at Pharmaceutics 2018, 10, 259; doi:10.3390/pharmaceutics10040259

11 of 17
322
3.3 Comparison between in vitro and in silico drug release profiles. 323
The in vitro drug release and in silico drug release of the X-ray CT reconstructed tablets and 324 algorithmically created tablets are shown in Fig. 5. The analysis has been carried out for A2 and A3 325 formulations, due to difficulties to distinguish the material of the tablet components for other studied 326 formulations. 327
328
Figure 5. Comparison between in silico and in vitro release profiles obtained from simulations with 329 algorithmically created tablet component arrangements and the reconstructed matrices with the 330 help of microtomography for formulations A3 (left) and A2 (right). 331
The obtained similarity factors (f2) of the dissolution between X-ray reconstructed tablet and 332 experimental tablet are 54 and 72 for formulation A2 and A3, respectively. Also, the obtained 333 similarity factors (f2) of the dissolution between algorithmically created matrices and experimental 334 tablet are 68 and 73 for A2 and A3, respectively. As demonstrated by the similarity factors (f2), the 335 dissolution profiles from the X-ray reconstructed tablets and algorithmically created matrices were 336 like those, obtained from the experimental tablets. Important is to keep in mind, that those close 337 correlations are not the results of the fitting but ab initio calculations. These results suggest that the 338 simulation of disintegration and dissolution behaviour with calculation matrix obtained from X-ray 339 microtomography is in good agreement with the experimental tablets. 340
341
3.4 In silico evaluation of drug release 342
The in vitro and in silico drug release of algorithmically created matrices are shown in Figure 6 343 for formulations A1-A4 and the simulated curves well describe the experimental data. Also, the 344 obtained similarity factors (f2) are summarized in Table 4 and these are greater than 50, suggesting 345 that the algorithmically created matrices provided the similar drug release to those obtained from the 346 experimental tablets. The simulation dissolution rate calculated with Eq. (4) was set to 1.39e-14 g/s 347 for single contact surface of 9.75e-8 cm2 under an assumption of unstirred layer thickness equal to 2.6 348 mm. The necessity to use such large value for an unstirred diffusion layer thickness is dictated by the 349 experimental data [23] and a tendency to produce a cone of powder at the bottom of the dissolution 350 vessel, where mass migration processes are solely diffusion driven. The similarity of the simulated 351 and the experimental results can be seen for calculation with disintegration model, whereas the 352 release profiles simulated without disintegration model resulted in very slow release kinetics (data 353
Preprints (www.preprints.org) | NOT PEER-REVIEWED | Posted: 22 October 2018 doi:10.20944/preprints201810.0490.v1
Peer-reviewed version available at Pharmaceutics 2018, 10, 259; doi:10.3390/pharmaceutics10040259

12 of 17
not shown). Therefore, this result suggested that the in silico simulation with disintegration model 354 produce similar release profile as compared to the in vitro evaluation. 355
356
357
358
Figure 6. Comparison between simulated release curves obtained from algorithmically created 359 components’ arrangements and corresponding experimental data for formulations A1-A4 (a-d). 360 361 Table 3. Summary of similarity factors (f2) between in vitro and in silico drug release profiles. 362
Tablet A1 A2 A3 A4
Similarity factor (f2) X-ray reconstructed matrices NA* 54 72 NA* Algorithmically created matrices 67 68 73 71
Porosity (%, v/v) 5.6 9.5 13.7 23.1 *Due to difficulties to distinguish the material of the tablet components, drug release of X-ray 363 reconstructed matrices is not available. 364 365
4. Discussion 366
As in vitro results in Figure 3 show, the fast drug release of the formulation at the beginning of 367 the dissolution test is followed by slowed down for all studied formulations. This is an expected 368 behaviour, which correlates with the known theories for disintegration, where tablet porosity serves 369 as medium delivery route to cause the disintegrate particles to start swelling [40,41]. The release rate 370
Preprints (www.preprints.org) | NOT PEER-REVIEWED | Posted: 22 October 2018 doi:10.20944/preprints201810.0490.v1
Peer-reviewed version available at Pharmaceutics 2018, 10, 259; doi:10.3390/pharmaceutics10040259

13 of 17
from the uncompacted granules is slower than those from the tablets, which is due to depleted action 371 of the intragranular disintegrant, which was mixed with the other components during wet 372 granulation. There are literature data indicating the loss of swelling potential of the disintergrants if 373 they were wet granulated [42]. These findings support the choice of the disintegration model 374 simulation algorithmic steps. Similarly to the existing theories, the “activated” virtual disintegrant 375 cell loses its further potential to force the surrounding components to scatter. In this respect, it is 376 logical to assume that as soon all of the disintegrant in the tablets has swollen, the remaining particles 377 or granules will show different release rate. This effect can be clearly seen on the simulated curves 378 and the experimental results. 379
As the results in Figure 5 show, the simulated drug release from X-ray reconstructed simulation 380 matrices were like those from the experimental tablets, at the same time the release from the 381 algorithmically created matrices without disintegration simulation show less accurate approximation 382 of the experimental data (data not shown, maximum drug release below 10% was simulated after 60 383 min). This result suggests that the disintegration and dissolution models are logically close to real 384 physical behaviour and are in good agreement with experiment. 385
Nowadays it is still quite difficult to access the synchrotron X-ray microCT with sufficient 386 contrast phase information to distinguish between the pharmaceutical formulation components. 387 Therefore, in this study the special attention was payed to compare the release profiles between the 388 matrices created algorithmically with the support from cellular automata and from the tablet 389 microtomography. The results in Figure 5 show that the methods to construct algorithmically the 390 calculation matrix can be used to model the experimental drug release if the disintegration model is 391 engaged. The simulated release profiles amplify the bi-phasic nature of the drug release for low 392 soluble compounds, such as mefenamic acid if the formulation contains partially depleted swelling 393 action disintegrant particles, resulted in the water contact during wet high-shear granulation. As soon 394 as the disintegrant in the external phase is used, the release rate drops to the levels observable from 395 the uncompacted granules. This is well correlated with the existing disintegration theories. 396
As Figure 6 shows, the engagement of the disintegration algorithm into simulation process 397 results in higher values of similarity factors (f2) when compared to the simulation without 398 disintegration, including the calculation results from the reconstructed tablets. This suggests that the 399 proposed in silico disintegration procedure is in a good agreement with the experiment. However, 400 still the existing deviation between the in vitro and in silico drug release suggest that there are more 401 subtle mechanisms contributes to the studied processes, for example, change in granule particle size 402 during compaction, percolation effects or wicking between the disintegrant fibres. When comparing 403 the in vitro drug release of formulation A3, A4 and uncompacted granules as shown in Figure 3, the 404 formulations compacted at higher compressive stresses (i.e. 99 MPa, formulation A3), showed a faster 405 drug release than formulation A4 compacted at lower compressive stress (i.e. 45 MPa). Similar 406 behaviour is reported for the uncompressed granules. For this reason, it can be thought that the 407 granules were damaged during the compaction process and the produced fine fractions resulted in 408 faster drug release profiles. Compressive stress seems to play an important role in maintaining 409 granulometric composition within a tablet, which is well supported in the literature [43–45]. 410 However, the damage to granular structures after compressive stress application cannot be seen on 411 the microtomographic acquisitions from these tablets. On contrary, the unchanged granular patterns 412 can be seen in the consecutive cross sectional images (a part of the horizontal and vertical cross 413 sectional images shown in Figure 2). Therefore, further investigations to consider the influence of the 414 compression dwell time, the material mechanical properties and the behaviour of granular breakage 415 may be necessary for a better understanding the effect of granular partitioning on the disintegration 416 and release rates. 417
The algorithm for modelling and simulation of the disintegration behaviour proposed and 418 evaluated in this study can be considered as tool to elucidate the influences of material attributes of 419
Preprints (www.preprints.org) | NOT PEER-REVIEWED | Posted: 22 October 2018 doi:10.20944/preprints201810.0490.v1
Peer-reviewed version available at Pharmaceutics 2018, 10, 259; doi:10.3390/pharmaceutics10040259

14 of 17
tablets and process parameters on drug release and can become a useful aid in process and 420 formulation development, especially for bioavailability enhancement of the low soluble compounds, 421 quality assurance, and generally in drug product development. 422
423
5. Conclusions 424
The disintegration model proposed in this study is a first approximation attempt to construct 425 the comprehensive simulation tool to be used in the pharmaceutical development. The proposed 426 model is not featuring the fine mechanics of all acting forces superpositions during the wetting, onset 427 on swelling and final dissertation of the tablet. The used distribution approach of the disintegrated 428 particles is far from reality, however even these crude approximations are improving the simulation 429 model performance. 430
Future work on accommodating the mechanical forces actions with either soft particles 431 hydrodynamics or rigid colliding spheres may bring more insides on the understating the fine 432 mechanics of the process of tablet disintegration. 433
434 Author Contributions: For research articles with several authors, a short paragraph specifying their individual 435 contributions must be provided. The following statements should be used “conceptualization, R. Yokoyama and 436 G. Kimura; methodology, R. Yokoyama and C. Schlepütz; study concept and simulation software, M. Puchkov; 437 data curation, R. Yokoyama and M. Puchkov; writing—original draft preparation, R.Yokoyama; writing—438 review and editing, M. Puchkov. 439 440 Acknowledgments: The authors thank Shionogi & Co., LTD. for financial support and Mr. Darryl Borland for 441 editorial assistance. 442 Conflicts of Interest: The authors declare no conflict of interest. 443
444
References 445
1. Siepmann, J.; Siepmann, F. Mathematical modeling of drug dissolution. Int. J. Pharm. 2013, 446 453, 12–24, doi:10.1016/j.ijpharm.2013.04.044. 447
2. Macheras, P.; Iliadis, A. Modeling in Biopharmaceutics, Pharmacokinetics, and Pharmacodynamics; 448 Interdisciplinary Applied Mathematics; Springer-Verlag: New York, 2006; Vol. 30; ISBN 0-449 387-28178-9. 450
3. Wu, C.-Y.; Ruddy, O. M.; Bentham, A. C.; Hancock, B. C.; Best, S. M.; Elliott, J. A. Modelling 451 the mechanical behaviour of pharmaceutical powders during compaction. Powder Technol. 452 2005, 152, 107–117, doi:10.1016/j.powtec.2005.01.010. 453
4. Lamberti, G.; Galdi, I.; Barba, A. A. Controlled release from hydrogel-based solid matrices. A 454 model accounting for water up-take, swelling and erosion. Int. J. Pharm. 2011, 407, 78–86, 455 doi:10.1016/j.ijpharm.2011.01.023. 456
5. Kimber, J. A.; Kazarian, S. G.; Štěpánek, F. DEM simulation of drug release from structurally 457 heterogeneous swelling tablets. Powder Technol. 2013, 248, 68–76, 458 doi:10.1016/j.powtec.2012.12.039. 459
6. Kimber, J. A.; Kazarian, S. G.; Štěpánek, F. Modelling of pharmaceutical tablet swelling and 460 dissolution using discrete element method. Chem. Eng. Sci. 2012, doi:10.1016/j.ces.2011.10.066. 461
Preprints (www.preprints.org) | NOT PEER-REVIEWED | Posted: 22 October 2018 doi:10.20944/preprints201810.0490.v1
Peer-reviewed version available at Pharmaceutics 2018, 10, 259; doi:10.3390/pharmaceutics10040259

15 of 17
7. Kimber, J. A.; Kazarian, S. G.; Štěpánek, F. Formulation design space analysis for drug release 462 from swelling polymer tablets. Powder Technol. 2013, 236, 179–187, 463 doi:10.1016/j.powtec.2012.02.027. 464
8. Kimber, J. A.; Kazarian, S. G.; Štěpánek, F. Microstructure-based mathematical modelling and 465 spectroscopic imaging of tablet dissolution. Comput. Chem. Eng. 2011, 35, 1328–1339, 466 doi:10.1016/j.compchemeng.2010.07.008. 467
9. Thornton, C.; Ciomocos, M. T.; Adams, M. J. Numerical simulations of agglomerate impact 468 breakage. Powder Technol. 1999, 105, 74–82, doi:10.1016/S0032-5910(99)00120-5. 469
10. Mishra, B. K.; Thornton, C. Impact breakage of particle agglomerates. Int. J. Miner. Process. 470 2001, 61, 225–239, doi:10.1016/S0301-7516(00)00065-X. 471
11. Bagherzadeh-Khalkhali, A.; Mirghasemi, A. A.; Mohammadi, S. Micromechanics of breakage 472 in sharp-edge particles using combined DEM and FEM. Particuology 2008, 6, 347–361, 473 doi:10.1016/j.partic.2008.07.002. 474
12. Frenning, G. An efficient finite/discrete element procedure for simulating compression of 3D 475 particle assemblies. Comput. Methods Appl. Mech. Eng. 2008, 197, 4266–4272, 476 doi:10.1016/j.cma.2008.05.002. 477
13. Kimber, J. A.; Kazarian, S. G.; Štěpánek, F. Modelling of pharmaceutical tablet swelling and 478 dissolution using discrete element method. Chem. Eng. Sci. 2012, 69, 394–403, 479 doi:10.1016/j.ces.2011.10.066. 480
14. Ketterhagen, W. R.; AM Ende, M. T.; Hancock, B. C. Process modeling in the pharmaceutical 481 industry using the discrete element method. J. Pharm. Sci. 2009, 98, 442–470, 482 doi:10.1002/jps.21466. 483
15. Kodam, M.; Curtis, J.; Hancock, B.; Wassgren, C. Discrete element method modeling of bi-484 convex pharmaceutical tablets: Contact detection algorithms and validation. Chem. Eng. Sci. 485 2012, 69, 587–601, doi:10.1016/j.ces.2011.11.011. 486
16. Rybacki, S.; Himmelspach, J.; Uhrmacher, A. M. Experiments with Single Core, Multi-core, 487 and GPU Based Computation of Cellular Automata. 2009 First Int. Conf. Adv. Syst. Simul. 2009, 488 62–67, doi:10.1109/SIMUL.2009.36. 489
17. Stephen Wolfram: A New Kind of Science. 490 18. Puchkov, M.; Tschirky, D.; Leuenberger, H. 3-D cellular automata in computer-aided design 491
of pharmaceutical formulations: Mathematical concept and F-CAD software. In Formulation 492 Tools for Pharmaceutical Development; 2013; pp. 155–201 ISBN 9781907568992. 493
19. Laaksonen, H.; Hirvonen, J.; Laaksonen, T. Cellular automata model for swelling-controlled 494 drug release. Int. J. Pharm. 2009, 380, 25–32, doi:10.1016/j.ijpharm.2009.06.023. 495
20. Kimura, G.; Puchkov, M.; Leuenberger, H. An attempt to calculate in silico disintegration time 496 of tablets containing mefenamic acid, a low water-soluble drug. J. Pharm. Sci. 2013, 102, 2166–497 78, doi:10.1002/jps.23541. 498
21. Eberle, V. A.; Schoelkopf, J.; Gane, P. A. C.; Alles, R.; Huwyler, J.; Puchkov, M. Floating 499 gastroretentive drug delivery systems:Comparison of experimental and simulated dissolution 500 profiles and floatation behavior. Eur. J. Pharm. Sci. 2014, 58, 34–43, 501 doi:10.1016/j.ejps.2014.03.001. 502
Preprints (www.preprints.org) | NOT PEER-REVIEWED | Posted: 22 October 2018 doi:10.20944/preprints201810.0490.v1
Peer-reviewed version available at Pharmaceutics 2018, 10, 259; doi:10.3390/pharmaceutics10040259

16 of 17
22. Eberle, V. A.; Häring, A.; Schoelkopf, J.; Gane, P. A. C.; Huwyler, J.; Puchkov, M. In silico and 503 in vitro methods to optimize the performance of experimental gastroretentive floating mini-504 tablets In silico and in vitro methods to optimize the performance of experimental 505 gastroretentive floating mini-tablets. 2015, 9045, doi:10.3109/03639045.2015.1078350. 506
23. Park, S.-H.; Choi, H.-K. The effects of surfactants on the dissolution profiles of poorly water-507 soluble acidic drugs. Int. J. Pharm. 2006, 321, 35–41, doi:10.1016/j.ijpharm.2006.05.004. 508
24. Razvi, N.; Siddiqui, S. A.; Khan, L. G. The effect of surfactant on the dissolution rate of 509 ibuprofen tablets. IntI. Chern. Pharm. Med. J 2005, 2, 213–216. 510
25. Kitamori, N.; Makino, T. Effect of drug content and drug particle size on the change in particle 511 size during tablet compression. J. Pharm. Pharmacol. 1979, 31, 505–507, doi:10.1111/j.2042-512 7158.1979.tb13572.x. 513
26. Yekpe, K.; Abatzoglou, N.; Bataille, B.; Gosselin, R.; Sharkawi, T.; Simard, J.-S.; Cournoyer, A. 514 Predicting the dissolution behavior of pharmaceutical tablets with NIR chemical imaging. Int. 515 J. Pharm. 2015, 486, 242–251, doi:10.1016/j.ijpharm.2015.03.060. 516
27. Ghayas, S.; Sheraz, M. A.; Anjum, F.; Baig, M. T. Factors influencing the dissolution testing of 517 drugs. Pak. J. Heal. Res. 2013, 1, 1–11. 518
28. Yen, J. K. The dissolution rate principle in practical tablet formulation. Can. Pharm. J. 1964, 97, 519 493–499. 520
29. Desai, P. M.; Liew, C. V.; Heng, P. W. S. Review of Disintegrants and the Disintegration 521 Phenomena. J. Pharm. Sci. 2016. 522
30. Steendam, R.; Frijlink, H. W.; Lerk, C. F. Plasticisation of amylodextrin by moisture. 523 Consequences for compaction behaviour and tablet properties. Eur. J. Pharm. Sci. 2001, 14, 524 245–54. 525
31. Sinka, I. C.; Burch, S. F.; Tweed, J. H.; Cunningham, J. C. Measurement of density variations 526 in tablets using X-ray computed tomography. Int. J. Pharm. 2004, 271, 215–224, 527 doi:10.1016/j.ijpharm.2003.11.022. 528
32. Busignies, V.; Leclerc, B.; Porion, P.; Evesque, P.; Couarraze, G.; Tchoreloff, P. Quantitative 529 measurements of localized density variations in cylindrical tablets using X-ray 530 microtomography. Eur. J. Pharm. Biopharm. 2006, 64, 38–50, doi:10.1016/j.ejpb.2006.02.007. 531
33. Pajander, J.; Vanveen, B.; Korhonen, O.; Lappalainen, R.; Ketolainen, J. Liquid boundary 532 movements in cylindrical and convex hydrophobic matrix tablets: Effects on tablet cracking 533 and drug release. Eur. J. Pharm. Biopharm. 2006, 64, 167–172, doi:10.1016/j.ejpb.2006.05.011. 534
34. Westermarck, S.; Juppo, A. M.; Kervinen, L.; Yliruusi, J. Pore structure and surface area of 535 mannitol powder, granules and tablets determined with mercury porosimetry and nitrogen 536 adsorption. Eur. J. Pharm. Biopharm. 1998, 46, 61–68, doi:10.1016/S0939-6411(97)00169-0. 537
35. Smrčka, D.; Dohnal, J.; Štěpánek, F. Dissolution and disintegration kinetics of high-active 538 pharmaceutical granules produced at laboratory and manufacturing scale. Eur. J. Pharm. 539 Biopharm. 2016, doi:10.1016/j.ejpb.2016.04.005. 540
36. Shah-hosseini, H. SLIC Superpixels Compared to State-of-the-Art Superpixel Methods. IEEE 541 Trans. Pattern Anal. Mach. Intell. 2002, 24, 1388–1393, doi:10.1109/TPAMI.2012.125. 542
37. Hansen, S. Translational friction coefficients for cylinders of arbitrary axial ratios estimated 543 by Monte Carlo simulation. J. Chem. Phys. 2004, 121, 9111–9115, doi:10.1063/1.1803533. 544
Preprints (www.preprints.org) | NOT PEER-REVIEWED | Posted: 22 October 2018 doi:10.20944/preprints201810.0490.v1
Peer-reviewed version available at Pharmaceutics 2018, 10, 259; doi:10.3390/pharmaceutics10040259

17 of 17
38. Amirjalayer, S.; Tafipolsky, M.; Schmid, R. Molecular Dynamics Simulation of Benzene 545 Diffusion in MOF-5: Importance of Lattice Dynamics. Angew. Chemie Int. Ed. 2007, 46, 463–466, 546 doi:10.1002/anie.200601746. 547
39. Food and Drug Administration (FDA) Centre for Drug Evaluation and Research (CDER) 548 Guidance for Industry Guidance for Industry Dissolution Testing of Immediate. 1997, 4, 15–549 22. 550
40. Yassin, S.; Goodwin, D. J.; Anderson, A.; Sibik, J.; Wilson, D. I.; Gladden, L. F.; Zeitler, J. A. 551 The Disintegration Process in Microcrystalline Cellulose Based Tablets, Part 1: Influence of 552 Temperature, Porosity and Superdisintegrants. J. Pharm. Sci. 2015, 104, 3440–3450, 553 doi:10.1002/jps.24544. 554
41. Bi, Y. X.; Sunada, H.; Yonezawa, Y.; Danjo, K. Evaluation of rapidly disintegrating tablets 555 prepared by a direct compression method. Drug Dev. Ind. Pharm. 1999, doi:10.1081/DDC-556 100102211. 557
42. Gould, P. L.; Tan, S. Bin The effect of recompression on the dissolution of wet massed tablets 558 containing “super” disintegrants. Drug Dev. Ind. Pharm. 1986, doi:10.3109/03639048609042618. 559
43. García-Armenta, E.; Téllez-Medina, D. I.; Alamilla-Beltrán, L.; Arana-Errasquín, R.; 560 Hernández-Sánchez, H.; Gutiérrez-López, G. F. Multifractal breakage patterns of thick 561 maltodextrin agglomerates. Powder Technol. 2014, 266, 440–446, 562 doi:10.1016/j.powtec.2014.06.047. 563
44. Yap, S. F.; Adams, M. J.; Seville, J. P. K.; Zhang, Z. Single and bulk compression of 564 pharmaceutical excipients: Evaluation of mechanical properties. Powder Technol. 2008, 185, 1–565 10, doi:10.1016/j.powtec.2007.09.005. 566
45. Duberg, M.; Nyström, C. Studies on direct compression of tablets XVII. Porosity—pressure 567 curves for the characterization of volume reduction mechanisms in powder compression. 568 Powder Technol. 1986, 46, 67–75, doi:10.1016/0032-5910(86)80100-0. 569
570
571
Preprints (www.preprints.org) | NOT PEER-REVIEWED | Posted: 22 October 2018 doi:10.20944/preprints201810.0490.v1
Peer-reviewed version available at Pharmaceutics 2018, 10, 259; doi:10.3390/pharmaceutics10040259