Embed Size (px)
Citation preview

Approved for public release, distribution is unlimited.
Investigation of Deflagration to Detonation Transition for Application to Pulse Detonation Engine Ignition Systems
E. Schultz, E. Wintenberger, J. ShepherdCalifornia Institute of Technology
Pasadena, CA 91125 USA
ABSTRACT
A key issue in pulse detonation engine development is a low-energy initiation system that pro-duces a short run-up distance to detonation and has reproducible shot-to-shot performance. Current prac-tice in designing detonation initiation systems based on deflagration-to-detonation transition is highly empirical and no design guidelines are available. One of the objectives of the ONR MURI program on pulse detonation engines is developing an understanding of initiation which can be used in engine design. We report on a preliminary study of detonation initiation within a 38 mm diameter tube using spark ignition and a Schelkin spiral. A series of experiments have been performed with hydrogen, ethylene, and pro-pane fuels mixed with oxygen and diluents including argon, carbon dioxide, helium, and nitrogen. The time required for detonation development has been measured as a function of fuel type, equivalence ratio, ini-tial pressure, diluent type, and diluent concentration. The relationship of the initiator performance to the detonation and deflagration characteristics of each mixture is examined.
INTRODUCTION
A pulse detonation engine is an unsteady propulsive device in which the combustion chamber is periodically filled with a reactive gas mixture, a detonation is initiated, the detonation propagates through
the chamber, and the product gases are exhausted (Fig. 1).1-3 The high pressures and resultant momen-tum flux out of the chamber generate thrust. Quasi-steady thrust levels can be achieved by repeating this cycle at relatively high frequency and/or using more than one combustion chamber operating out of phase. The present research involves the initiation portion of a pulse detonation engine cycle (Fig. 1b), with the goal of progressing towards an efficient and reliable technique which can be used to rapidly initiate detona-tions at high frequencies.
A simple one-dimensional model of a self-propagating gaseous detonation consists of a shock wave tightly coupled to a reaction zone, propagating through a combustible gas mixture as shown in
Fuel
Oxidizer
VCJ
(a) Fill combustible mixture. (b) Detonation initiation.
(d) Combustion products exhaust.(c) Detonation propagates through engine.
Figure 1 Pulse detonation engine cycle.

Fig. 2.4 A feedback mechanism exists in that the shock wave generates the thermodynamic conditions under which the gas combusts, and the energy release from the reaction zone maintains the strength of the shock. This is in contrast to a flame, or deflagrative combustion, in which thermal and species trans-port processes dominate.
A detonation may form via direct initiation or deflagration-to-detonation transition (DDT). The former mode is dependent upon an ignition source driving a blast wave of sufficient strength such that the ignitor is directly responsible for initiating the detonation. The latter case begins with a deflagration initi-ated by some relatively weak energy source which accelerates through interactions with its surroundings into a coupled shock wave-reaction zone structure characteristic of a detonation. Direct initiation by a con-centrated source requires an extremely large energy deposition relative to deflagrative ignition. A defla-gration can be ignited in a typical hydrocarbon mixture such as 1 bar stoichiometric propane-air with a 1 mJ spark, whereas direct initiation of a detonation in the same mixture requires an energy deposition of over 100 kJ. This six order of magnitude difference in ignition source energy is indicative of the general difficulty associated with employing direct initiation techniques in pulse detonation engines. On the other hand, after a small spark has created a deflagration, the transition process can take several meters or longer and a corresponding large amount of time. The key to detonation initiation schemes applicable to pulse detonation engines is to significantly shorten the distance and time required for deflagration-to-deto-nation transition.
Deflagration-to-detonation transition is the general process by which a subsonic combustion wave
(deflagration or flame) becomes a supersonic combustion wave (detonation).5-7 After a deflagration is cre-
ReactionZone
x
P1
T1
TCJ
PCJ
NormalShock
Products Reactants
InductionLength ∆
VCJ
(a) Ideal model. (b) Laser shadowgraph (H2 + 0.5O2, P1 = 20 kPa).
Figure 2 Detonation waves.

ated, it may accelerate or decelerate to some steady state velocity or accelerate and then abruptly transi-tion to detonation. The DDT process can be divided into four phases:
• Deflagration initiation. A relatively weak energy source such as an electric spark is used to create a flame. The energy release from the initiator device along with radical production and energy release from the mixture compete with loss processes including expansion of the reacting flowfield and ther-mal conduction and species transport away from the flame front. Flammability limits which result from this competition have been extensively researched.
• Flame acceleration. Increasing energy release rate and the formation of strong shock waves are caused by flame acceleration. The observed mechanisms for flame acceleration are outlined above.
• Formation and amplification of explosion centers. One or more localized explosion centers form as pockets of reactants reach critical ignition conditions (the so-called explosion within the explosion). Critical temperatures are typically around 1100 K and 1500 K for fuel-oxygen and fuel-air mixtures, respectively. The explosion centers create small blast waves which rapidly amplify in the surround-ing mixture.
• Formation of a detonation wave. The amplified blast waves and existing shock-reaction zone com-plex merge into a supersonic detonation front which is self-sustaining.
Three positive-feedback flame acceleration mechanisms have been identified which are often involved in the DDT process:
• Flame interaction with shocked reactants. The volumetric dilatation (expansion of reactants as they are combusted to form products) caused by a deflagration causes compression waves to emanate from the combustion front. These compressions coalesce in shock waves ahead of the flame, caus-ing pressure, temperature, and velocity increases in the unreacted gas. Some flames accelerate as the pressure increases, while others decelerate. Increasing temperature typically causes flame acceleration. The particle velocity induced by the shock compression also raises the Reynolds number of the unreacted flow into which the flame propagates. At high enough Reynolds number the flow will transition from laminar to turbulent with attendant increases in burning velocity and energy release rate due to turbulent structures as discussed below.
• Flame interaction with reflected shocks. Reflected shocks interact with the flame giving rise to the Rayleigh-Taylor interface instability, which causes the flame to stretch and distort. Shock-flame interaction is typically found in confined situations because the compression waves generated by the flame reflect off of solid boundaries. As the surface area of the flame increases, the energy release rate increases and the flame accelerates. The distorted flowfield combined with increasing Reynolds number leads to turbulence which further accelerates the flame as discussed below.
• Flame interaction with solid obstacles and gasdynamic jets. Obstacles transform some of the flow kinetic energy into large scale turbulence, which later cascades into finer scales. The large scale turbulent structures cause even larger increases in flame surface area. Smaller scale structures enhance species and thermal transport processes through turbulent mixing at the molecular level, again resulting in an increase in energy release rate and effective flame propagation velocity.
There are several outstanding issues to be resolved in understanding the DDT process, which can be broken into two broad categories. First, how are the critical conditions reached which are necessary for the formation and amplification of explosion centers? The answer to this question lies within the flame acceleration mechanisms which must be studied beyond the current empirical approaches. In some cases it is clear that the critical ignition temperature is reached and a suitable induction time passes before explo-sion. This occurs in shock-shock merging followed by explosion at the resulting contact surface after an

induction delay. In other cases, the mechanism by which the critical conditions are attained is not at all clear; for example, explosions occurring near the tube wall boundary layer ahead of the turbulent flame brush when calculations indicate the fluid particle could only have undergone a small fraction of the induc-tion period.
Second, how are the blast waves from localized explosion centers amplified? Note that the explo-sion centers are not always amplified into a detonation. One explanation, the so-called Shock Wave Amplification by Coherent Energy Release (SWACER) mechanism, postulates that coherent energy release is necessary to amplify the shock. Coherent energy release is created through induction time gra-dients established by temperature and free radical distributions. The proper input or coherence leads to shock amplification, while different conditions cause damping.
The goals for basic detonation initiation research are to understand the mechanisms responsible for the flame generation of critical conditions which form explosion centers and their subsequent amplifica-tion into a detonation wave. Knowledge of these basic processes can then be used to tailor pulse detona-tion engine ignition systems for maximum performance (i.e., shortest DDT time/length scales with minimum energy expenditure). The present report is based on a set of 250 experiments with fixed hard-ware geometry and initiation system. Gas mixture parameters have been varied to explore gasdynamic and energy release effects on the DDT process. Experimental results are presented along with a prelimi-nary analysis of the data, followed by an outline of future research directions.
EXPERIMENTAL PROCEDURE
The detonation tube used for the present DDT experiments (Fig. 3) is constructed from 2024-T3 aluminum, 1.5 m long with a 38 mm internal diameter. The ignition source consists of a spark plug mounted in a Teflon end cap, followed by a Schelkin spiral which enhances transition of the spark-induced deflagration to a detonation. The spark system consists of a 5 µF capacitor at 110 V (total stored energy of 30 mJ) discharged through a 163:1 trigger transformer to a piston-engine spark plug at 18 kV. The Schel-kin spiral is 305 mm long, 38 mm outside diameter, has a wire diameter of 4 mm, and 11 mm distance between coils. The tube is connected to a test section (not shown) into which the detonation diffracts at the end of the DDT experiment. This hardware configuration was held constant throughout this experi-mental series.
Three instrument mounts spaced 40 cm apart are located along the length of the tube. These mounts hold pressure transducers for monitoring the velocity and pressure profile of the detonation wave and plumbing for the gas handling (fill and evacuation) system. A detonation wave propagating at 2000 m/s will transit the 40 cm distance between pressure transducers in 200 µs. The transducers have a 1 µs response time, and so the typical time-of-arrival measurement error is ±1 µs. It is not unreasonable to assume that the measured transit time for this hypothetical detonation could be 198 µs or 202 µs, resulting in apparent velocities of 1980 m/s and 2020 m/s, respectively. Therefore, the relatively closely-spaced pressure transducers result in a velocity measurement uncertainty of approximately ±1%.
Prior to all experiments the detonation tube was evacuated to less than 14 Pa. The mixtures investigated were comprised of either hydrogen, ethylene, or propane fuel with oxygen as the oxidizer and diluents including argon, carbon dioxide, helium, and nitrogen. Parameters varied in these experiments were the fuel type, equivalence ratio, initial pressure, diluent type, and diluent concentration. Constituent
Figure 3 Detonation tube used for DDT experiments (dimensions in inches).

gases were filled via the partial pressure technique and the final test mixture was pump-circulated for 15 min to ensure homogeneity. The initial gas mixture temperature was always within a few degrees of 295 K.
Chapman-Jouguet (CJ) detonation wave velocities (VCJ) in these mixtures were calculated with
the STANJAN thermochemical equilibrium program.8 These velocities were compared to the velocity data obtained from pressure transducer time-of-arrival measurements to deduce whether or not a CJ detonation wave had been initiated. The definition of DDT time (tDDT) corresponding to the data presented in this report is defined as the time from the spark discharge to the time at which the detonation wave reached the first pressure transducer. A successful DDT experiment was considered to have occurred if the wave propagated within +1% and -2% of VCJ from the first pressure transducer down the remainder of the deto-nation tube. This velocity criteria is consistent with the initiation of a CJ detonation wave given the afore-mentioned ±1% velocity measurement uncertainty and momentum and energy losses to the boundary
layers for relatively small tube diameters.9 DDT failure in these experiments was typically manifested by a decelerating shock wave traveling at velocities lower than 1000 m/s.
EXPERIMENTAL RESULTS
Experimental results of DDT times and transition limits are presented in this section. Multiple data points at the same condition (equivalence ratio, initial pressure, or percent dilution) in the data plots of this section indicate repeat experiments conducted under the same conditions and are analyzed in a following subsection for a quantitative measure of DDT time variability.
DEFLAGRATION-TO-DETONATION TRANSITION TIMES
DDT times versus equivalence ratio for hydrogen, ethylene, and propane fuel-oxygen mixtures are presented in Fig. 4. Ethylene and propane data currently exists only at the stoichiometric condition, whereas the hydrogen data range from 0.3 to 2.0 equivalence ratio. At the stoichiometric condition, DDT times are greatest for the propane mixture, followed by hydrogen and then ethylene with the least DDT time. The stoichiometry variation with the hydrogen mixture data exhibits the familiar u-shaped behavior. Minimum DDT times occur near the stoichiometric condition, while the DDT time rapidly increases to the fuel lean side and modestly increases on the rich side.
DDT times versus initial pressure for hydrogen, ethylene, and propane fuel-oxygen mixtures are presented in Fig. 5. The ethylene data extends from 15 to 100 kPa while the hydrogen and propane data range from 30 to 100 kPa. The initial pressure variation data demonstrates the same fuel hierarchy of pro-pane, hydrogen, and ethylene from greatest to least DDT times, respectively. In contrast to the typical
τ ~ P-1 inverse dependence of reaction time on pressure, the DDT time dependence on initial pressure over this pressure range exhibits powers of -3.2, -2.9, and -2.0 for hydrogen, ethylene, and propane, respectively.
DDT times versus percent dilution with argon, carbon dioxide, helium, and nitrogen for hydrogen, ethylene, and propane mixtures are presented in Figs. 6, 7, and 8, respectively. Ethylene and propane data currently exists only for argon and nitrogen diluents. Increasing the concentration of all diluents increases the DDT time. A given volumetric dilution of argon or nitrogen increase the DDT time by the same amount for all three fuels. For the hydrogen-based mixtures, carbon dioxide is the most effective diluent in terms of inhibiting the DDT process with the greatest increase in DDT time per percent diluent. Dilution with helium causes the least increase in DDT time relative to the other diluents for hydrogen-based mixtures. Note that all of the diluents have different concentration limits for successful DDT as discussed in the next section.

DEFLAGRATION-TO-DETONATION TRANSITION LIMITS
Experiments for which DDT was not successful are demarcated in Figs. 5, 6, and 7, and the corre-sponding conditions are summarized in Table 1. These DDT limits are dependent upon the mixture and boundary conditions imposed by the particular ignition system used in this study and therefore do not rep-resent intrinsic detonability limits of the mixture. The detonation cell width data corresponds to the average of the variable at the limit. The limits are not imposed by the minimum tube diameter condition as the cell widths for these mixtures are five to ten times smaller than the tube diameter.
Sufficient data exist for the hydrogen-oxygen dilution series to compare the DDT limits among the different diluents. Carbon dioxide diluent resulted in the lowest DDT dilution limit, consistent with the observation of carbon dioxide increasing the DDT time most for a given percent dilution. Nitrogen dilution generates the next lowest DDT limit, followed by helium and finally argon. Note that the DDT times for argon and nitrogen diluents are the same and so an important difference between dilution with these two gases lies in this transition limiting dilution level. It is also interesting to note that even though the mona-
Table 1: Deflagration-to-detonation transition limits.
Mixture VariableInitiation
LimitNo-Initiation
LimitCell Width (mm)
(Average of Limit)
C2H4 + 3O2 Initial Pressure 15 kPa 10 kPa 2.5
H2 + 0.5O2 + %Ar Dilution 67.5% 67.5% 2.5
H2 + 0.5O2 + %CO2 Dilution 14.3% 25% 5.5
H2 + 0.5O2 + %He Dilution 53.8% 60% 3.3
H2 + 0.5O2 + %N2 Dilution 40% 55.6% 5.1
C2H4 + 3O2 + %Ar Dilution 75% 76.5% 2.7
Equivalence Ratio
DD
TT
ime
(µs)
0 0.5 1 1.5 20
100
200
300
400
500
600
700
800
900
1000
(P1 = 100kPa, T1 = 295K)
φH2 + 0.5O2
φC2H4 + 3O2
φC3H8 + 5O2
Figure 4 DDT time data versus equivalence ratio for fuel-oxygen mixtures.
Initial Pressure (kPa)
DD
TT
ime
(µs)
0 20 40 60 80 1000
100
200
300
400
500
600
700
800
900
1000
(T1 = 295K)
H2 + 0.5O2
C2H4 + 3O2
C3H8 + 5O2
No DDT(C2H4 + 3O2)
Figure 5 DDT time data versus initial pressure for fuel-oxygen mixtures.
tomic diluents argon and helium have the same energetic characteristics (only capable of storing energy in translational degrees of freedom) and only differ by molecular mass, helium dilution results in shorter DDT times and a lower DDT limit than argon dilution.
Many repeat experiments were conducted at fixed conditions to quantitatively evaluate the vari-ability in measured DDT times. Figures 9 and 10 are histograms of DDT time data for stoichiometric hydrogen-oxygen mixtures at 100 kPa and 62.5 kPa initial pressure, respectively. The DDT time frequen-cies for the 100 kPa experiments follow a more normal distribution than that of the 62.5 kPa experiments, although more experiments are required at these and other initial pressures to determine whether or not the statistical distribution characteristics are influenced by the initial pressure. Variability histograms for stoichiometric, 100 kPa initial pressure ethylene-oxygen and propane-oxygen mixtures are presented in Figs. 11 and 12, respectively. These data also follow a fairly normal statistical distribution.
Dilution (%vol)
DD
TT
ime
(µs)
0 10 20 30 40 50 60 700
500
1000
1500
2000
2500
3000
3500
4000(P1 = 100kPa, T1 = 295K)
2H2 + O2 + %Ar
2H2 + O2 + %CO2
2H2 + O2 + %He
2H2 + O2 + %N2
No DDT(CO2)
(N2)
(Ar)(He)
Figure 6 DDT time data versus percent dilution for hydrogen-oxygen mixtures.
Dilution (%vol)
DD
TT
ime
(µs)
0 10 20 30 40 50 60 70 800
500
1000
1500
2000
2500
3000
3500
4000
4500(P1 = 100kPa, T1 = 295K)
C2H4 + 3O2 + %Ar
C2H4 + 3O2 + %N2
No DDT(Ar)
Dilution (%vol)
DD
TT
ime
(µs)
0 10 20 30 40 50 60 700
500
1000
1500
2000
2500
3000
3500
4000(P1 = 100kPa, T1 = 295K)
C3H8 + 5O2 + %Ar
C3H8 + 5O2 + %N2
Figure 7 DDT time data versus percent dilution for ethylene-oxygen mixtures.
Figure 8 DDT time data versus percent dilution for propane-oxygen mixtures.

All of the repeat DDT experiments have temporal deviations around the mean of approximately ±5%. This represents little variability in DDT time given the complex phenomena involved, although this is by no means conclusive due to the relatively small number of conditions from the present study for which variability data is available. While not statistically significant, there were several experiments in a stoichio-metric hydrogen-oxygen mixture diluted with 30% argon in which DDT times range from 900 - 1300 µs, suggesting that variability may be an important issue under certain mixture conditions.
DETONATION AND FLAME CHARACTERIZATION
In order to analyze the data presented in the previous section, some notions about flame and det-onation propagation need to be introduced. Flames and detonations can be characterized by idealized
DDT Time (µs)
Fre
que
ncy
450 475 500 525 5500
5
10
15
20
25 H2 + 0.5O2
P1 = 100kPa, T1 = 295K
Figure 9 Histogram of DDT times for stoichio-metric hydrogen-oxygen mixture (P1 = 100kPa)
DDT Time (µs)
Fre
quen
cy
550 575 600 625 650 675 7000
5
10
15
20 H2 + 0.5O2
P1 = 62.5kPa, T1 = 295K
Figure 10 Histogram of DDT times for stoichio-metric hydrogen-oxygen mixture (P1 = 62.5kPa)
DDT Time (µs)
Fre
quen
cy
400 425 450 475 500 5250
2
4
6
8
10C2H4 + 3O2
P1 = 100kPa, T1 = 295K
Figure 11 Histogram of DDT times for stoichi-ometric ethylene-oxygen mixture.
DDT Time (µs)
Fre
quen
cy
600 625 650 675 7000
2
4
6
8
10 C3H8 + 5O2
P1 = 100kPa, T1 = 295K
Figure 12 Histogram of DDT times for stoichi-ometric propane-oxygen mixture.

values for the speed and thickness of the combustion wave. In addition, the properties of the combustion process can be used to develop parameters such as expansion ratio, Lewis number, and Zeldovich num-ber that characterize the response of the combustion process to flow disturbances. In this section, we present data and calculations of the these parameters. We then show how they can be used to correlate the results of our DDT initiation experiments.
FLAME ACCELERATION IN SCHELKIN SPIRALS
The development of a detonation within a Schelkin spiral10 and some of the relevant physical pro-cesses are shown in Fig. 13. Although the flame begins as a laminar front traveling at a few meters per second, it quickly accelerates due to turbulence created by the wakes of the spirals and develops into a thick flame brush moving at several hundred meters per second. A detailed analysis of the acceleration phase requires consideration of the turbulent flow and the interaction of the flame with the turbulence. This would involve a model of the turbulence combustion wave, and numerical simulation of the flow that is clearly a major research effort in itself.
We choose a simpler approach based on identifying the relevant physical parameters and correlat-ing the results of our experiments with those. The relevant time scales in the experiment are shown in the idealized space-time diagram of Fig. 14. An instantaneously-initiated detonation wave would travel at a speed VCJ and arrive at the first pressure transducer at a time tCJ = L/VCJ. The combustion process within the detonation wave occurs over a finite time tznd, which results in a characteristic thickness in the detona-tion wave.
A laminar flame in a closed-end tube propagates at a speed of Vf = Suρu/ρb where ρu/ρb is the expansion ratio (volume of products/volumes of reactants) and Su is the laminar burning velocity. The fac-tor ρu/ρb arises because of the constraint of the closed end and the specific volume change due to the combustion. A laminar flame process would arrive at the first transducer at a time tlam = L/Vf which is much longer than tCJ. The laminar flame also has a characteristic thickness but this is so much smaller than the scale of the apparatus that we have not considered this as a factor in the present analysis. Although the flow is turbulent within the spiral, the characteristic flame speed is expected to scale with the laminar speed, all other parameters being held constant.
DETONATION CHARACTERIZATION
Self-sustaining detonations propagate at a unique speed VCJ that can determined by thermody-namic considerations alone. The thickness of the detonation wave can be characterized either by experi-ment measurements of the instability wave length (detonation cell width) or by an idealized thickness based on the ZND model (Fig. 2a).
ProductsFlame
Reactants
Shocks
Eddies
Wakes
Spark
Obstacles
Figure 13 Schematic of factors involved in DDT process.

Detonation velocity
Computations of the Chapman-Jouguet (CJ) detonation velocity were made by using the chemical
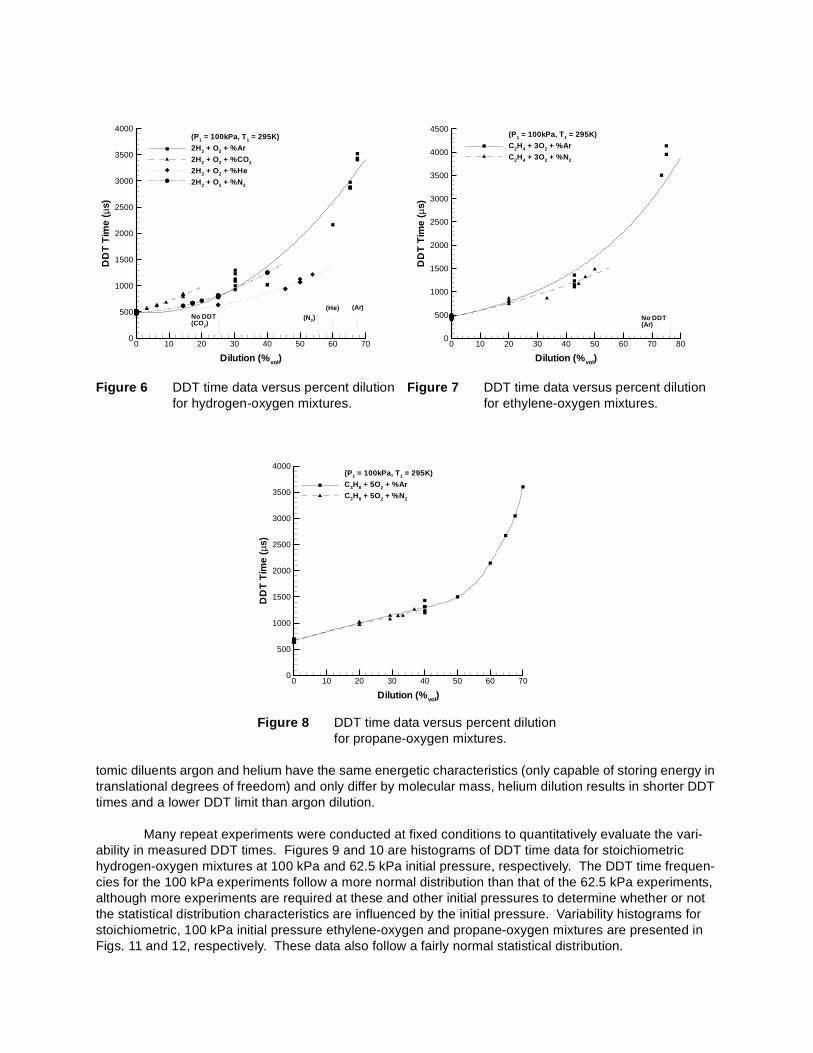
equilibrium simulation program STANJAN8 and standard (JANNAF) thermodynamic data on the reactants and products. The results are shown in Fig. 15 for each of the fuel-oxidizer diluent systems we have stud-ied. Detonation velocity is primarily a function of normalized energy release and shows a broad maximum when plotted versus equivalence ratio for ethylene and propane fuels with air. The effects of product dis-sociation cause the shift of the maximum to the rich side in the case of the hydrocarbon fuels in oxygen. The effect of dilution is dominated by the decrease in energy content of the mixtures for nitrogen and car-bon dioxide addition and by the decrease in heat capacity for helium and argon dilution. Helium dilution causes the detonation velocity to rise due to its low molecular mass. Detonation velocity is essentially independent of initial pressure (not shown in Fig. 15) for the range of pressures considered in the present study. The continuous increase in detonation velocity with hydrogen concentration is due to both the change in the energy content and the decrease in the molar mass with increasing hydrogen content in the fuel-oxidizer mixture.
Detonation reaction time
The steady, one-dimensional (ZND) model of a detonation11 was used to calculate characteristic detonation reaction times with detailed reaction mechanisms for hydrogen, ethylene, and propane oxida-tion. Implementation of this model was through a FORTRAN code utilizing the CHEMKIN chemical kinet-
ics subroutine package12 and a stiff ordinary differential equation solver.13 The Konnov reaction
mechanism14 was used for all calculations; the validation of this mechanism for use in detonation simula-
tion has been previously reported.15 The detonation reaction time is defined as the period from the shock to the maximum temperature gradient point. Reaction time is dominated by the post-shock temperature and radical chemistry rates within the endothermic or thermally neutral induction zone. Significant energy
t
x
tDDT
tCJ
Directly-initiated detonation wave trajectory
DDT wave trajectory
First pressure transducer
Spark location
Laminar flame trajectory
Figure 14 Time-distance diagram illustrating some relevant time scales.
ti
Equivalence Ratio φ
Det
onat
ion
Vel
ocity
VC
J
0 0.5 1 1.5 2 2.5 3900
1400
1900
2400
2900
3400
3900H2/O2
H2/Air
Dilution %vol
Det
onat
ion
Vel
ocity
VC
J(m
/s)
0 20 40 60 80 100900
1400
1900
2400
2900
3400
3900 2H2 + O2 + %Ar
2H2 + O2 + %CO2
2H2 + O2 + %He
2H2 + O2 + %N2
Equivalence Ratio φ
Det
onat
ion
Vel
ocity
VC
J(m
/s)
0 0.5 1 1.5 2 2.5 31000
1400
1800
2200
2600
3000
3400
3800C2H4/O2
C2H4/Air
Dilution %vol
Det
onat
ion
Vel
ocity
VC
J(m
/s)
0 20 40 60 80 1001000
1400
1800
2200
2600
3000
3400
3800C2H4 + 3O2 + %Ar
C2H4 + 3O2 + %CO2
C2H4 + 3O2 + %He
C2H4 + 3O2 + %N2
Equivalence Ratio φ
Det
onat
ion
Vel
ocity
VC
J(m
/s)
0 0.5 1 1.5 2 2.5 31000
1300
1600
1900
2200
2500
2800
3100
3400
3700C3H8/O2
C3H8/Air
Dilution %vol
Det
onat
ion
Vel
ocity
VC
J(m
/s)
0 20 40 60 80 1001000
1300
1600
1900
2200
2500
2800
3100
3400
3700C3H8 + 5O2 + %Ar
C3H8 + 5O2 + %CO2
C3H8 + 5O2 + %He
C3H8 + 5O2 + %N2
Figure 15 Detonation velocities for hydrogen, ethylene, and propane mixtures of varying stoichiom-etry and dilution.

release occurs late in the reaction zone and so does not directly affect the reaction time with the maximum temperature gradient definition. Exothermicity indirectly affects the reaction time by influencing the deto-nation shock velocity (Fig. 15) and therefore the post-shock temperature. Smaller detonation reaction times are indicative of tighter coupling between the shock wave and reaction zone and quantitatively repre-sent mixtures which are more sensitive to detonation (so-called more detonable) in terms of direct initiation
energy (E ~ t3 for spherical geometry).
Detonation reaction times versus equivalence ratio for hydrogen, ethylene, and propane fuel-oxy-gen and fuel-air mixtures are presented in Fig. 16. The reaction times are always greater for the fuel-air mixtures relative to the corresponding fuel-oxygen mixtures. Reaction times for the fuel-air mixtures exhibit a minimum near stoichiometric while the fuel-oxygen mixture curves are relatively flat, with most times less than 1ms. These trends are due to the post-shock temperature variation with equivalence ratio
among fuel-oxygen and fuel-air mixtures.15 There is a clear hierarchy of reaction time/length scales in the fuel-air mixtures, increasing from hydrogen to ethylene and finally propane. The post-shock temperatures
for these fuel-air mixtures are comparable15, and therefore the radical chemistry rates which dominate the induction zone dictate this hierarchy. The fuel-oxygen mixture with the minimum reaction time/length depends upon the equivalence ratio.
Detonation reaction times versus initial pressure for hydrogen, ethylene, and propane fuel-oxygen and fuel-air mixtures are presented in Fig. 17. Increasing initial pressure results in decreasing reaction
time, varying approximately as t ~ P-1.0 for the fuel-oxygen mixtures. This variation is expected from the
pressure dependence of rate-limiting reactions.15 The fuel-air mixture pressure dependence is somewhat less relative to the fuel-oxygen dependence due to the prevalence of three-body effects in the nitrogen-diluted mixtures. Fuel-air mixture reaction scales are always greater than the corresponding fuel-oxygen
mixture scales as expected from post-shock temperature considerations.15
Detonation reaction times versus percent dilution with argon, carbon dioxide, helium, and nitrogen for hydrogen, ethylene, and propane mixtures are presented in Figs. 18, 19, and 20, respectively. Hydro-gen is the most sensitive fuel to diluent addition. The argon and helium diluents are chemically inert and therefore have a strictly thermal inhibiting effect. Addition of these monatomic gases to a fuel-oxygen mix-ture decreases the heat capacity, decreases the energy release, and raises the post-shock temperature
Equivalence Ratio
Det
ona
tion
Rea
ctio
nT
ime
(µs)
0 1 2 310-2
10-1
100
101
102
103
104
105
106
Konnov (1998) mechanism
(P1 = 100kPa, T1 = 295K)
φH2 + 0.5(O2 + βN2)
φC2H4 + 3(O2 + βN2)
φC3H8 + 5(O2 + βN2)
Fuel/Air (β=3.76)
Fuel/Oxygen (β=0)
Figure 16 Detonation reaction times versus equivalence ratio for fuel/oxygen and fuel/air mixtures.
Initial Pressure (bar)
Det
onat
ion
Rea
ctio
nT
ime
(µs)
10-1 100 10110-2
10-1
100
101
102
Konnov (1998) mechanism
(T1 = 295K)
H2 + 0.5(O2 + βN2)
C2H4 + 3(O2 + βN2)
C3H8 + 5(O2 + βN2)
Fuel/Air (β=3.76)
Fuel/Oxygen (β=0)
τ ∝ P-0.8
τ ∝ P-1.0
Figure 17 Detonation reaction times versus ini-tial pressure for fuel/oxygen and fuel/air mixtures.

over a wide range of dilution, maintaining relatively constant reaction times over the same range.15 Argon and helium are quantitatively identical in their effect on the reaction time. Carbon dioxide increases the reaction time most significantly for all fuels, followed by nitrogen; this order is given by the effect of these
diluents on the post-shock temperature.15 The effect of carbon dioxide is primarily thermal for hydrogen
mixtures, as shown by studies in which the thermal and kinetic effects of this diluent were investigated.16 The excellent agreement between constant volume explosion induction times for mechanisms with and without nitrogen as a chemically active species indicates that nitrogen also has primarily a thermal effect
for all of the fuel-oxygen mixtures.15
Dilution (%vol)
Det
onat
ion
Rea
ctio
nT
ime
(µs)
0 20 40 60 80 10010-2
10-1
100
101
102
103
104
105
106
Konnov (1998) mechanism
(P1 = 100kPa, T1 = 295K)
H2 + 0.5O2 + %Ar
H2 + 0.5O2 + %CO2
H2 + 0.5O2 + %He
H2 + 0.5O2 + %N2
Figure 18 Detonation reaction times versus dilu-tion for hydrogen-oxygen mixtures.
Dilution (%vol)
Det
onat
ion
Rea
ctio
nT
ime
(µs)
0 20 40 60 80 10010-2
10-1
100
101
102
103
104
105
106
Konnov (1998) mechanism
(P1 = 100kPa, T1 = 295K)
C2H4 + 3O2 + %Ar
C2H4 + 3O2 + %CO2
C2H4 + 3O2 + %He
C2H4 + 3O2 + %N2
Figure 19 Detonation reaction times versus dilu-tion for ethylene-oxygen mixtures.
Dilution (%vol)
Det
onat
ion
Rea
ctio
nT
ime
(µs)
0 20 40 60 80 10010-2
10-1
100
101
102
103
104
105
106
Konnov (1998) mechanism
(P1 = 100kPa, T1 = 295K)
C3H8 + 5O2 + %Ar
C3H8 + 5O2 + %CO2
C3H8 + 5O2 + %He
C3H8 + 5O2 + %N2
Figure 20 Detonation reaction times versus dilu-tion for propane-oxygen mixtures.

FLAME CHARACTERIZATION
As discussed earlier, although the flames within the Schelkin spiral are turbulent, laminar flame characteristics are used to scale the overall flame behavior. The important parameters appear to be the
flame speed and the expansion ratio.17 Researchers have found that the expansion ratio was a key parameter is determining the onset of significant flame acceleration in experiments with repeated obsta-
cles inside of a tube.17 An expansion ratio of greater than 3.5 to 4 was required to get significant acceler-ation for stable flames and smaller values were needed for unstable flames in lean hydrogen-oxygen-diluent mixtures. Investigators have also speculated that secondary factors in flame acceleration are flame
stability which can be characterized by Lewis and Zeldovich numbers.17 The parameter b(Le - 1) has been identified as controlling stability in model computations of flames described by one-step mechanisms
of combustion.18
Flame speed
Flame speed is determined by a balance between convection, reaction and diffusion processes. Although it is possible to compute flame speeds, we have chosen to use experimental values in the present study since they were easier to obtain. One limitation of the present study is the limited data avail-able for some diluents and initial pressures.
Laminar flame speed data obtained from the literature are plotted versus equivalence ratio,19,20
initial pressure,20-22 and percent dilution23 in Figs. 21, 22, and 23, respectively. This data is multiplied by the expansion ratio to obtain the laminar flame velocity in the laboratory frame of reference for use in calcu-lating the flame propagation time (tlam). Laminar flame speeds have not yet been measured for diluted hydrocarbon mixtures and helium and carbon dioxide dilution of hydrogen mixtures.
Expansion ratio
The expansion ratio (σ) is defined as the ratio of the reactant (unburned) density to the product (burned) density for constant pressure combustion
and physically represents how much a fluid particle will expand when it combusts. The greater the expan-sion ratio, the more a fluid particle expands as it combusts and the more the surrounding fluid is com-pressed. Therefore, it is expected that a mixture having a greater expansion ratio will be more susceptible
to DDT than a mixture with a smaller expansion ratio.17 The expansion ratio was calculated by taking the unburned density as the initial mixture density and the burned density was computed at equilibrium assum-ing a constant-enthalpy, constant-pressure combustion process.
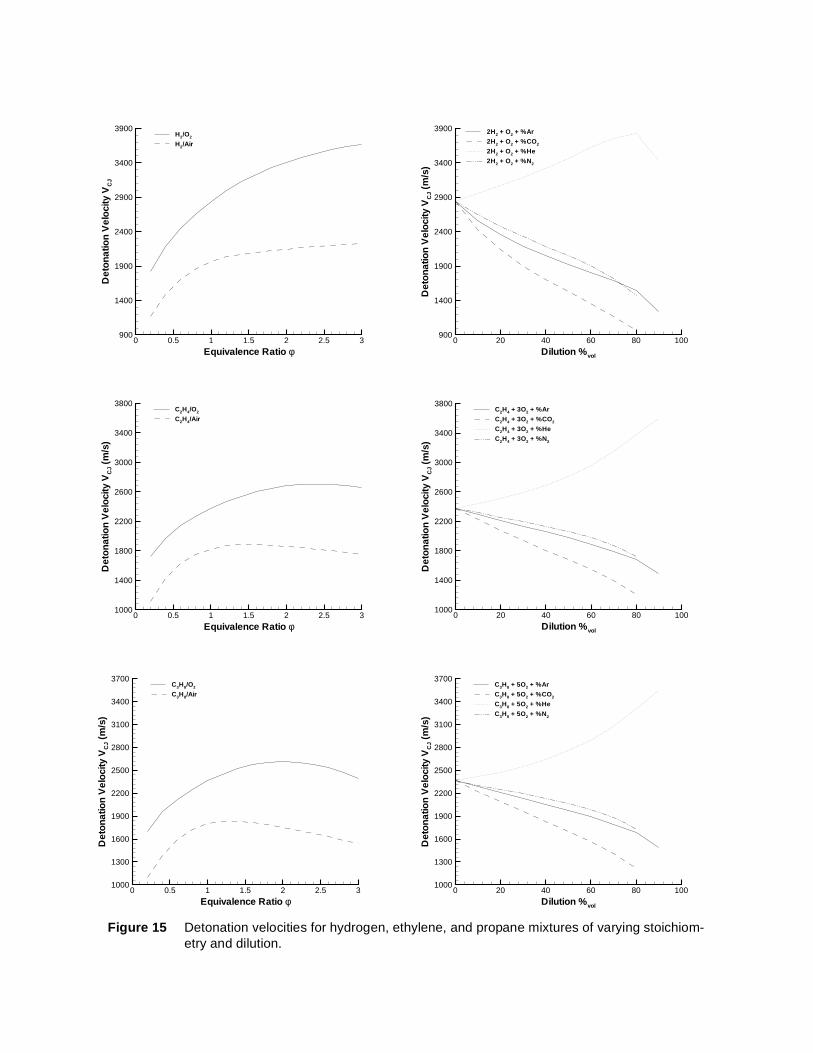
Expansion ratios versus equivalence ratio for hydrogen, ethylene, and propane fuel-oxygen mix-tures are presented in Fig. 24. The hydrogen mixtures have a maximum expansion ratio of approximately eight at the stoichiometric condition which decreases slightly on the lean and rich sides. Expansion ratios for the ethylene and propane mixtures vary by a factor of two over the equivalence ratio range from 0.2 to 3.0, with a maximum value of approximately 18 near an equivalence ratio of 2. The hydrogen and hydro-carbon mixtures all have similar flame temperatures and are at the same pressure. The greatest expan-sion ratios occur for the hydrocarbon mixtures which have a larger number of product molecules per mole of fuel than does hydrogen.
Expansion ratios versus initial pressure for hydrogen, ethylene, and propane fuel-oxygen mixtures are presented in Fig. 25. The expansion ratio is relatively insensitive to initial pressure because both the
σρu
ρb-----=

unburned and burned densities scale with the initial pressure. The hydrocarbon mixtures are again observed to have much greater expansion ratios than the hydrogen mixtures.
Expansion ratios versus percent dilution with argon, carbon dioxide, helium, and nitrogen for hydrogen, ethylene, and propane mixtures are presented in Figs. 26, 27, and 28, respectively. Dilution decreases the energy release of the mixture which results in a decrease of the flame temperature. At con-stant pressure this causes an increase in the density of the burned gas, explaining why the expansion ratio decreases with increasing dilution. Carbon dioxide dilution results in the greatest decrease, followed by nitrogen and finally argon and helium having the same quantitative effect on the expansion ratio.
Equivalence ratio
Bu
rnin
gve
loci
ty(m
/s)
0 1 2 3 40
1
2
3
4
5
6
7
8
9
10
11
12
φH2 + 0.5O2
φC2H4 + 3O2
φC3H8 + 5O2
Initial Pressure (kPa)
Bur
ning
velo
city
(m/s
)
0 25 50 75 1000
1
2
3
4
5
6
7
8
9
10
11
12H2 + 0.5O2
C2H4 + 3O2
C3H8 + 5O2
Dilution (%vol)
Bur
ning
velo
city
(m/s
)
0 20 40 60 800
1
2
3
4
5
6
7
8
9
10
H2 + 0.5O2 + %CO2
H2 + 0.5O2 + %N2
Figure 21 Laminar burning velocity versus equivalence ratio for fuel-oxygen mixtures.
Figure 22 Laminar burning velocity versus ini-tial pressure for fuel-oxygen mixtures.
Figure 23 Laminar burning velocity versus per-cent dilution for hydrogen mixtures.
Lewis number
The Lewis number is defined as the ratio of the thermal conductivity of the mixture to the diffusivity of the deficient reactant
and is indicative of the characteristic heat transfer in a mixture relative to the diffusion of the rate limiting species. The deficient reactant is the fuel in the case of a lean mixture and the oxidizer in the case of a rich mixture. Whereas the entire mixture is responsible for conductive heat losses, use of the deficient reactant diffusivity is motivated by the fact that this diffusivity is the species transport rate limiter in flame propaga-tion. The definition leads to a discontinuous jump at the stoichiometric condition since there is a switch in the deficient reactant. The Lewis numbers corresponding to the stoichiometric condition were calculated considering the fuel to be the deficient reactant. Greater Lewis numbers correspond to more heat loss and less reactant species diffusion. Therefore, a relatively low Lewis number is favorable for flame propaga-
tion. The Lewis numbers were calculated with a FORTRAN code using CHEMKIN subroutines.12
Lewis numbers versus equivalence ratio for hydrogen, ethylene, and propane fuel-oxygen mix-tures are presented in Fig. 29. The relatively large discontinuity in Lewis number for the hydrogen mix-tures at the stoichiometric condition is due to the change in species diffusivity from hydrogen as the deficient reactant on the lean side to oxygen on the rich side. The Lewis number for lean hydrogen mix-tures remains relatively constant and less than the Lewis numbers for the hydrocarbon mixtures. Rich hydrogen mixtures exhibit decreasing Lewis numbers as the equivalence ratio increases and are much greater than the hydrocarbon Lewis numbers. Lewis numbers for the hydrocarbon mixtures are similar and decrease modestly from lean to rich equivalence ratios.
Lewis numbers versus initial pressure for hydrogen, ethylene, and propane fuel-oxygen mixtures are presented in Fig. 30. The Lewis numbers remain constant despite the varying initial pressure because the diffusivity and conductivity are invariant with respect to pressure. Propane mixtures have the greatest Lewis numbers over the initial pressure range, followed by ethylene and finally hydrogen. Note that the hydrogen mixture Lewis numbers would be the greatest if the oxidizer had been considered the deficient reactant at the stoichiometric condition.
Equivalence ratio
Exp
ansi
on
ratio
0 1 2 30
2
4
6
8
10
12
14
16
18
20
φH2 + 0.5O2
φC2H4 + 3O2
φC3H8 + 5O2
Figure 24 Expansion ratios versus equivalence ratio for fuel-oxygen mixtures.
Initial Pressure (kPa)
Exp
ansi
on
ratio
0 50 100 150 2000
2
4
6
8
10
12
14
16
18
20
H2 + 0.5O2
C2H4 + 3O2
C3H8 + 5O2
Figure 25 Expansion ratios versus initial pres-sure for fuel-oxygen mixtures.
Leκm
Ddr---------=

Lewis numbers versus percent dilution with argon, carbon dioxide, helium, and nitrogen for hydro-gen, ethylene, and propane mixtures are presented in Figs. 31, 32, and 33, respectively. Helium dilution causes the Lewis numbers to rise significantly for all fuels because it increases the thermal conductivity of the mixture. The argon, carbon dioxide, and nitrogen diluents result in relatively little change in Lewis num-ber, with modest decreases in the hydrogen mixtures and increases for the hydrocarbon mixtures. Note that all dilution effects on the Lewis number are due to the diluent changing the mixture thermal conductiv-ity because the deficient reactant diffusivity does not account for dilution.
Dilution (%vol)
Exp
ansi
on
ratio
0 25 50 75 1000
2
4
6
8
10
12
14
16
18
20
H2 + 0.5O2 + %ArH2 + 0.5O2 + %CO2
H2 + 0.5O2 + %HeH2 + 0.5O2 + %N2
Figure 26 Expansion ratios versus dilution for hydrogen-oxygen mixtures.
Dilution (%vol)
Exp
ansi
onra
tio
0 25 50 75 1000
2
4
6
8
10
12
14
16
18
20
C2H4 + 3O2 + %ArC2H4 + 3O2 + %CO2
C2H4 + 3O2 + %HeC2H4 + 3O2 + %N2
Figure 27 Expansion ratios versus dilution for ethylene-oxygen mixtures.
Dilution (%vol)
Exp
ansi
onra
tio
0 25 50 75 1000
2
4
6
8
10
12
14
16
18
20
C3H8 + 5O2 + %ArC3H8 + 5O2 + %CO2
C3H8 + 5O2 + %HeC3H8 + 5O2 + %N2
Figure 28 Expansion ratios versus dilution for propane-oxygen mixtures.

Zeldovich number
The Zeldovich number (β) is defined by
where E is the effective activation energy, R is the mixture gas constant, Tu is the initial reactant (unburned) temperature, and Tb is the product (burned) temperature. It is a non-dimensional activation energy parameter which is scaled with the temperature rise through the flame. Consider an Arrhenius induction time expression scaled by the same temperature rise:
Taking the derivative of this expression with respect to the burned gas temperature and retaining the high-est order term gives:
Therefore, the Zeldovich number is indicative of the flame sensitivity to thermodynamic perturbation. Greater Zeldovich numbers correspond to greater reaction time variation for a given change in tempera-ture. This is a factor in both flame and detonation response to flow disturbances. The larger the Zeldovich number, the more unstable the coupling between chemistry and fluid dynamics. In the case of flames, instability is predicted to occur when β(Le - 1) < -α, where α is a function of the expansion ratio. This indi-cates that large values of β will result in the onset of flame instability for values of Le that are slightly less than one. In the present study, this is of particular concern for the lean hydrogen-oxygen-diluent systems. In general, we expect that β plays a role whenever there are significant perturbations in the flow that can cause the burned gas temperature to change due to stretching or straining motions in the flow.
Equivalence ratio
Lew
isnu
mbe
r
0 1 2 30
1
2
3
4
5
6
φH2 + 0.5O2
φC2H4 + 3O2
φC3H8 + 5O2
Figure 29 Lewis numbers versus equivalence ratio for fuel-oxygen mixtures.
Initial Pressure (kPa)
Lew
isnu
mbe
r
0 25 50 75 100 125 150 175 2000
0.25
0.5
0.75
1
1.25
1.5
1.75
2
H2 + 0.5O2
C2H4 + 3O2
C3H8 + 5O2
Figure 30 Lewis numbers versus initial pressure for fuel-oxygen mixtures.
βE Tb Tu–( )
RTb2--------------------------=
τ AE Tb Tu–( )
RTb2--------------------------
exp=
Tbddτ τβ–
Tb---------=

Flame temperatures were calculated using STANJAN adiabatic, equilibrium calculations. There are several methods for calculating effective flame activation energies for flames which are still being addressed. One calculation technique deduces activation energies from laminar burning velocity data.
Flame theories indicate that the flame speed is related to the activation energy through24
Logarithms of flame speeds taken from the literature were plotted versus the inverse flame temperature and a least squares linear fit gave an effective activation energy. This method is extremely limited for near-stoichiometric mixtures due to the maximum in flame speed near the stoichiometric condition. Differ-ent linear fits correspond to the lean and rich mixtures because of this maximum, resulting in large discon-
Dilution (%vol)
Lew
isnu
mbe
r
0 25 50 75 1000
0.25
0.5
0.75
1
1.25
H2 + 0.5O2 + %ArH2 + 0.5O2 + %CO2
H2 + 0.5O2 + %HeH2 + 0.5O2 + %N2
Figure 31 Lewis numbers versus dilution for hydrogen-oxygen mixtures.
Dilution (%vol)
Lew
isn
um
ber
0 25 50 75 1000
0.5
1
1.5
2
2.5
3C2H4 + 3O2 + %ArC2H4 + 3O2 + %CO2
C2H4 + 3O2 + %HeC2H4 + 3O2 + %N2
Figure 32 Lewis numbers versus dilution for ethylene-oxygen mixtures.
Dilution (%vol)
Lew
isnu
mbe
r
0 25 50 75 1000
1
2
3
4C3H8 + 5O2 + %ArC3H8 + 5O2 + %CO2
C3H8 + 5O2 + %HeC3H8 + 5O2 + %N2
Figure 33 Lewis numbers versus dilution for propane-oxygen mixtures.
SuE–
2RTb-------------
exp∼

tinuities in activation energy at the stoichiometric condition. In addition, flame speed data is not available for most of the diluted mixtures. For these reasons, activation energies were not obtained from burning velocities.
The technique used at present involves numerical calculation of the effective activation energy
with detailed reaction mechanisms.15 The reaction time at temperature T can be estimated as
Note that a more accurate equation would include the inverse dependence of reaction time on density. An effective activation energy is given by taking the ratio of this expression for two reaction times correspond-ing to two temperatures:
A constant-pressure explosion simulation with the Konnov detailed reaction mechanism14 is used to calcu-late the reaction times corresponding to two temperatures for each mixture of interest.
The question arises as to what the characteristic temperature of the flame reaction zone is, and how much to perturb this temperature for the reaction time simulations. The burned gas temperature is the only well-defined temperature for a flame, but is not necessarily indicative of the gas temperature in the pre-heat zone where the reactions begin. Activation energies were calculated for several mixtures in which the effects of characteristic temperature and temperature perturbation were considered.
A small temperature perturbation is desirable so that the calculated activation energy corresponds as well as possible to the characteristic temperature of interest (about which the perturbation is made). However, ±0.1% and ±1% temperature perturbations result in activation energy oscillations at tempera-tures near the burned gas temperature. In particular, the ±0.1% perturbation causes very large oscillations because the resulting change in reaction time is on the order of the computational numerical accuracy. Temperature perturbations of ±5% and ±10% resulted in smooth activation energy variations over the range of characteristic temperatures for all cases considered.
The calculated activation energies tend to increase with increasing characteristic temperature for the hydrogen and ethylene mixtures while decreasing for the propane mixture. Characteristic tempera-tures of 3076 K (stoichiometric hydrogen-oxygen), 3173 K (stoichiometric ethylene-oxygen), and 3093 K (stoichiometric propane-oxygen) correspond to the burned gas flame temperature for these mixtures. The activation energy values calculated for the burned gas flame temperature are within 50% of the values in the entire temperature range considered, and therefore will be used as well-characterized temperatures for calculation of Zeldovich number activation energies. This is reasonable given the highly approximate
nature of the calculation itself, inaccuracies associated with the reaction mechanism,15 and preliminary nature of this study.
The burned gas temperature is used and has been perturbed ±5% for the calculation of effective activation energies. Zeldovich numbers versus equivalence ratio for hydrogen, ethylene, and propane fuel-oxygen mixtures are presented in Fig. 34. The hydrogen and propane mixture Zeldovich numbers are noticeably less than those for ethylene mixtures over most of the equivalence ratio range. The exception lies on the rich side for which the Zeldovich numbers of the propane mixtures increase significantly whereas the hydrogen and ethylene Zeldovich numbers remain relatively constant.
τ AE
RT-------
exp=
ER---
τln 2 τ1ln–
1T2-----
1T1-----–
---------------------------=

Zeldovich numbers versus initial pressure for hydrogen, ethylene, and propane fuel-oxygen mix-tures are presented in Fig. 35. The Zeldovich numbers are relatively insensitive to changes in initial pres-sure. At these stoichiometric conditions, the hydrogen and propane mixture Zeldovich numbers are almost identical and the ethylene Zeldovich numbers are 70% greater on average.
Zeldovich numbers versus percent dilution with argon, carbon dioxide, helium, and nitrogen for hydrogen, ethylene, and propane mixtures are presented in Figs. 36, 37, and 38, respectively. The Zel-dovich numbers for all three fuels are not affected significantly by any of these diluents up to approximately the 50% dilution level. When the level of dilution is reached such that the Zeldovich number does change, it increases with increasing dilution for the hydrogen and propane mixtures while decreasing with increas-ing dilution for the ethylene mixtures. The carbon dioxide diluent has the most significant effect on the Zel-dovich number at relatively low dilution for all fuels. In terms of quantitative change in the Zeldovich number, all of the diluents have only a modest effect on the hydrogen and ethylene mixtures and a signifi-cant effect on the propane mixtures.
ANALYSIS OF DDT TIME SCALING
The basic idea behind our analysis of the DDT time can be obtained from Fig. 14. The time required for the acceleration and transition process is given by the excess transit time (tDDT - tCJ). Since the acceleration process is so much slower than the detonation onset process, we expect the excess tran-sit time to be dominated by the time required for flame propagation within the spiral. So we expect the excess transit time to be proportional to the laminar flame propagation time. In general, the results will be a function of the geometrical parameters of the Schelkin spiral and the parameters such as expansion ratio, Lewis number (Le), and Zeldovich number (β), governing the behavior of the flame acceleration pro-cess within the spiral. This suggests a correlation of the form
where the geometric characteristics (spiral wire thickness H, tube length L, spiral pitch P, tube diameter D), expansion ratio, Lewis number, and Zeldovich number are related to the time scales through F, a non-dimensional function which must be determined by analyzing experimental data. Since we only examined one geometric configuration, no information regarding this aspect of F was obtained in the present experi-
Equivalence ratio
Zel
do
vich
nu
mb
er
0 1 2 30
1
2
3
4
5
6
7
8
9
10φH2 + 0.5O2
φC2H4 + 3O2
φC3H8 + 5O2
Initial Pressure (kPa)
Zel
do
vich
nu
mb
er
0 50 100 150 2000
1
2
3
4
5
6
7
8
H2 + 0.5O2
C2H4 + 3O2
C3H8 + 5O2
Figure 34 Zeldovich numbers versus equivalence ratio for fuel-oxygen mixtures.
Figure 35 Zeldovich numbers versus initial pres-sure for fuel-oxygen mixtures.
tDDT tCJ– tlamFHD----
LD----
PD---- Le β
ρu
ρb-----,,, , ,
=

ments. Other correlations of the excess transit time were also examined and found to be less useful. For example, correlation with the detonation induction time was attempted, examining the parameter (tDDT -tCJ)/tZND as a function of fuel type, dilution and initial pressure. This type of correlation is commonly used
in correlating detonation behavior,25 but was unsuccessful in collapsing the present data because it is not capable of representing the flame acceleration process.
SCALING OF DDT TIMES
Non-dimensional excess time (tDDT - tCJ)/ tlam dependence on equivalence ratio, initial pressure and dilution is shown in Figs. 39 - 41. Note that for all of the mixtures and conditions studied, the non-dimensional excess time falls in a narrow range of between 0.06 and 0.09. Not all of the data presented in
Dilution (%vol)
Zel
do
vich
nu
mb
er
0 25 50 75 1000
1
2
3
4
5
6
7
8H2 + 0.5O2 + %ArH2 + 0.5O2 + %CO2
H2 + 0.5O2 + % HeH2 + 0.5O2 + %N2
Dilution (%vol)
Zel
dovi
chnu
mbe
r
0 25 50 75 1000
1
2
3
4
5
6
7
8
C2H4 + 3O2 + %ArC2H4 + 3O2 + %CO2
C2H4 + 3O2 + %HeC2H4 + 3O2 + %N2
Figure 36 Zeldovich numbers versus dilution for hydrogen-oxygen mixtures.
Figure 37 Zeldovich numbers versus dilution for ethylene-oxygen mixtures.
Figure 38 Zeldovich numbers versus dilution for propane-oxygen mixtures.
Dilution (%vol)
Zel
dovi
chnu
mbe
r
0 25 50 75 1000
1
2
3
4
5
6
7
8
9
10
11
12C3H8 + 5O2 + %ArC3H8 + 5O2 + %CO2
C3H8 + 5O2 + %HeC3H8 + 5O2 + %N2

Figs. 4 - 8 is analyzed here since flame speeds were not available for all mixtures. The modest range of variation indicates that our scaling ideas do capture the essential dependence of the DDT time on the characteristic idealized time scales.
CORRELATION OF DDT TIMES WITH FLAME PARAMETERS
There appear to be systematic variations of the non-dimensional excess time as shown in Figs. 39 - 41. We have attempted to correlate these variations with mixture properties by plotting this data as a function of the other non-dimensional properties. Two examples are shown in Figs. 42 and 43.
Equivalence ratio
(tD
DT-t
CJ)
/tla
m
0 0.5 1 1.5 20
0.025
0.05
0.075
0.1
φH2 + 0.5O2
φC2H4 + 3O2
φC3H8 + 5O2
Initial Pressure (kPa)
(tD
DT-t
CJ)
/tla
m
0 25 50 75 1000
0.025
0.05
0.075
0.1
H2 + 0.5O2
C2H4 + 3O2
C3H8 + 5O2
Dilution (%vol)
(tD
DT-t
CJ)
/tla
m
0 10 20 30 40 500
0.01
0.02
0.03
0.04
0.05
0.06
0.07
0.08
0.09
0.1
H2 + 0.5O2 + %CO2
H2 + 0.5O2 + %N2
Figure 39 DDT time parameter versus equiva-lence ratio for fuel-oxygen mixtures.
Figure 40 DDT time parameter versus initial pressure for fuel-oxygen mixtures.
Figure 41 DDT time parameter versus dilution for hydrogen mixtures.

Expansion ratio
Non-dimensional DDT time parameters are correlated against the expansion ratios for fuel-oxygen mixtures with varying stoichiometry, initial pressure, and diluent type and concentration in Fig. 42. The cor-relation data for a given fuel lies within a narrow vertical band because the expansion ratios are not varying significantly for these mixtures. Note that there are no correlation data corresponding to mixtures for which flame speed data is unavailable, even though DDT times were measured experimentally. Obtaining DDT time data for the hydrocarbon mixtures with varying equivalence ratio and flame speed data for the argon and helium-diluted fuel-oxygen mixtures will greatly extend the range of expansion ratios. The experimen-tally measured DDT time data have been significantly collapsed through non-dimensionalization such that all DDT time parameters are between 0.06 and 0.09.
Lewis and Zeldovich numbers
As discussed previously, the combination β(Le - 1) is expected to control the onset of cellular
instability in flames.18 Unstable flames are expected to accelerate faster than stable flames. In cases with Le > 1, the flames are expected to be stable but this parameter is still relevant to the flame response to flow perturbations.
Non-dimensional DDT time parameters are correlated against β(Le - 1) for fuel-oxygen mixtures with varying stoichiometry, initial pressure, and diluent type and concentration in Fig. 43. The correlation data for a given fuel lies within a narrow vertical band because this correlating parameter is not varying sig-nificantly for these mixtures. The exception is for the rich hydrogen data at very large values of β(Le - 1) because of the jump in Lewis number at rich conditions where oxygen becomes the deficient reactant. Just as for the expansion ratio correlations, there are no correlation data corresponding to mixtures for which flame speed data is unavailable, even though DDT times were measured experimentally. Obtaining DDT time data for the hydrocarbon mixtures with varying equivalence ratio and flame speed data for the argon and helium-diluted fuel-oxygen mixtures will greatly extend the range of the β(Le - 1) correlating parameter as well. The experimentally measured DDT time data have been significantly collapsed through non-dimensionalization such that all DDT time parameters are between 0.06 and 0.09.
Expansion ratio
(tD
DT-t
CJ)
/tla
m
0 5 10 15 200
0.01
0.02
0.03
0.04
0.05
0.06
0.07
0.08
0.09
0.1
φH2 + 0.5O2
φC2H4 + 3O2
φC3H8 + 5O2
H2 + 0.5O2 at P1
C2H4 + 3O2 at P1
C3H8 + 5O2 at P1
H2 + 0.5O2 + %CO2
H2 + 0.5O2 + %N2
β(Le-1)
(tD
DT-t
CJ)
/t lam
-5 0 5 10 150
0.01
0.02
0.03
0.04
0.05
0.06
0.07
0.08
0.09
0.1
φH2 + 0.5O2
φC2H4 + 3O2
φC3H8 + 5O2
H2 + 0.5O2 at P1
C2H4 + 3O2 at P1
C3H8 + 5O2 at P1
H2 + 0.5O2 + %CO2
H2 + 0.5O2 + %N2
Figure 42 DDT time parameter correlation with expansion ratio.
Figure 43 DDT time parameter correlation with β(Le - 1).
DISCUSSION OF TRENDS
The following sections provide discussion and cursory explanations for the experimental DDT time trends observed regarding fuel type, equivalence ratio, initial pressure, and diluent type and concentration. There is no clear positive or negative correlation between the Zeldovich number and DDT time, and there-fore the Zeldovich number is not used in the following analysis.
Fuel type
Hydrogen is generally considered to be more reactive than the hydrocarbon fuels. Greater flame speeds and detonation velocities are attributed to hydrogen than for ethylene and propane (Figs. 15, 21). However, expansion ratios are much lower for hydrogen than for ethylene and propane (Fig. 24) and the smallest Lewis numbers at the stoichiometric condition correspond to the hydrocarbon mixtures (Fig. 29). These factors combine in a subtle fashion so that the DDT times for all fuels are comparable for stoichio-metric fuel-oxygen mixtures. In order of increasing DDT time the fuels are ethylene, hydrogen, and pro-pane. A more comprehensive comparison will require further experiments with a wider range of mixture compositions. An interesting side effect is that the argon dilution DDT limit for ethylene mixtures is 10% greater than the dilution limit for hydrogen mixtures (Table 1).
Equivalence ratio
The energy release per unit mass is greatest for hydrogen-oxygen mixtures at the stoichiometric condition. This has the primary effect of causing the greatest temperatures and therefore greatest overall kinetic rates at the stoichiometric condition. The expansion ratios for hydrogen-oxygen mixtures are also maximum at the stoichiometric condition (Fig. 24). Therefore, it is expected that the hydrogen-oxygen DDT time data for varying stoichiometry would have a minimum at an equivalence ratio of one and monot-onously increasing DDT times to the lean and rich sides (Fig. 4). The Lewis number is difficult to include in this discussion because of the large discontinuity induced by the change in deficient reactant occurring at the stoichiometric condition.
Initial pressure
The DDT times for the stoichiometric fuel-oxygen mixtures decrease with increasing initial pres-sure for several reasons (Fig. 5). The primary reason is apparently that the reaction rates are dominated by binary collisions, causing the reaction time to scale inversely with pressure. A secondary effect is that temperatures, and therefore reaction rates, are greater for stoichiometric fuel-oxygen mixtures at higher pressures due to less dissociation of the primary products. This increases the overall kinetic rate, as does the fact that kinetic rates are typically proportional to pressure through the reactant concentrations. The expansion ratios (Fig. 25) and Lewis numbers (Fig. 30) are essentially independent of initial pressure.
Diluent type and concentration
The dilution of fuel-oxygen mixtures has primarily a thermal, rather than kinetic, effect.15,16 This results in reduced energy per unit mass of the mixture as diluent concentrations increase. Taking note of the varying molecular mass of the diluents, carbon dioxide decreases the energy per unit mass the most for a given percent volume dilution, followed by argon, nitrogen, and finally helium. A competing effect is that dilution also changes the mixture heat capacity and therefore peak combustion temperature, affecting the reaction rates. For the stoichiometric fuel-oxygen mixtures studied, carbon dioxide increases the mix-ture heat capacity, nitrogen has little effect, and argon and helium cause the heat capacity to decrease. Expansion ratios decrease for all of the diluents in the order of carbon dioxide, nitrogen, and argon/helium from most to least (Figs. 26 - 28), and dilution results in only modest Lewis number change except for the significant increase with helium (Figs. 31 - 33).

Carbon dioxide increases the DDT time the most and has the lowest transition limit because it decreases the energy content, increases the mixture heat capacity, and decreases the expansion ratio more so than all of the other diluents (Fig. 6, Table 1). All three of these effects work against the DDT pro-cess. Argon and nitrogen have similar DDT times for a given volumetric dilution due to offsetting effects (Figs. 6 - 8). Nitrogen-diluted mixtures have greater energy content, while argon-diluted mixtures have less heat capacity and greater expansion ratios. However, note that the nitrogen transition limit is signifi-cantly less than the argon limit, indicating that a property of the argon-diluted mixtures more than offsets the greater energy release of nitrogen-diluted mixtures in determining the transition limit (Table 1). The greater transition limit for argon-diluted mixtures compared to helium-diluted mixtures can be explained by the relatively high Lewis numbers resulting from helium dilution, which indicates that the mixture thermal conductivity is important in the DDT limit (Fig. 6, Table 1).
CONCLUSIONS
Experimentally determined deflagration-to-detonation transition (DDT) times and some transition limits have been reported. These results were obtained with a fixed initiator energy and geometry with a set of hydrogen, ethylene, and propane mixtures corresponding to a widely varying set of gasdynamic and chemical parameters. Stoichiometric fuel-oxygen proportions, increasing initial pressure, and minimum dilution result in the shortest DDT times. Carbon dioxide inhibits the DDT process most significantly, fol-lowed by nitrogen, helium, and finally argon.
The variability of DDT times was analyzed with the result that repeat experiments typically gener-ate a statistically normal distribution of reaction times for which the deviation from the mean may be signif-icant in pulse detonation engine ignition timing. Expansion ratios, Lewis numbers, and Zeldovich numbers have been calculated and compiled into a database for present and future use in analyzing DDT phenom-ena. Large expansion ratios and small Lewis numbers are conducive to minimizing DDT time. No special influence of the Zeldovich number has been identified in this study. Further work with a large range of val-ues will be required in order to isolate the role of this factor. These calculated values were also used to discuss and partially explain the DDT time and transition limit trends observed when varying fuel type, sto-ichiometry, initial pressure, and diluent.
Plotting the DDT time data in non-dimensional form by subtracting the detonation transit time and non-dimensionalizing by the laminar flame propagation time results in a significant collapse in dimensional data which ranges over almost an order of magnitude to the non-dimensional data which varies by less than 50%. Due to this data collapse, non-dimensional correlations of the DDT time parameter versus expansion ratios and β(Le - 1) are expected to be useful once data is obtained over a larger range of these correlating parameters.
The present study is part of a larger program of examining many different aspects of DDT and det-onation phenomena relevant to pulse detonation engines. Planned future work includes quantitative and qualitative (flow visualization) studies on initiation, for both simple hydrocarbons and storable liquid fuels. The results of the paper represent the first steps in attempting to correlate basic mixture properties with DDT behavior. Clearly a much larger data base covering a wider range of mixture compositions initiator geometries is necessary before predictive models of DDT can be developed.
ACKNOWLEDGEMENTS
Funding for this effort has been provided by the Office of Naval Research Multidisciplinary Univer-sity Research Initiative “Multidisciplinary Study of Pulse Detonation Engines” (grant 00014-99-1-0744, sub-contract 1686-ONR-0744), the National Defense Science and Engineering Graduate Fellowship Program, and the NASA Phase I Small Business Technology Transfer Program “Initiators for Pulse Detonation Engines” (NAS8-97291) collaboration with Advanced Projects Research, Inc (APRI). Thanks to Tom Sobota and Jim Sterling of APRI for their support of fundamental research on detonations at Caltech.
REFERENCES
1. Bussing T, Pappas G (1996) Pulse detonation engine theory and concepts. Developments in High Speed Vehicle Propulsion Systems, Progress in Astronautics and Aeronautics, 165:421-472.
2. Lynch ED, Edelman RB (1996) Analysis of pulse detonation wave engine. Developments in High Speed Vehicle Propulsion Systems, Progress in Astronautics and Aeronautics, 165:473-516.
3. Sterling J, Ghorbanian K, Humphrey J, Sobota T, Pratt D (1995) Numerical investigations of pulse det-onation wave engines. 31st Joint Propulsion Conference, AIAA paper 95-2479.
4. Strehlow RA (1984) Combustion fundamentals. McGraw-Hill. 302-337, 396-410.
5. Lee JHS (1977) Initiation of gaseous detonation. Annual Review of Physical Chemistry, 28:75-104
6. Lee JHS, Moen IO (1980) The mechanism of transition from deflagration to detonation in vapor cloud explosions. Progress in Energy and Combustion Science, 6:359-389.
7. Shepherd JE, Lee JHS (1992) On the transition from deflagration to detonation. Major Topics in Com-bustion, Springer-Verlag, 439-487.
8. Reynolds WC (1986) The element potential method for chemical equilibrium analysis: implementation in the interactive program STANJAN (3rd ed.). Mechanical Engineering Department, Stanford Univer-sity.
9. Murray SB, Lee JHS (1986) The influence of physical boundaries on gaseous detonation waves. Dynamics of Explosions, Progress in Astronautics and Aeronautics, 106:329-355.
10. Zeldovich IB, Kompaneets AS (1960) Theory of Detonation. Academic Press, 185-191.
11. Fickett W, Davis WC (1979) Detonation. University of California Press.
12. Kee R, Rupley F, Miller J (1989) Chemkin II: A fortran chemical kinetics package for the analysis of gas-phase chemical kinetics. Sandia National Laboratory Technical Report SAND89-8009.
13. Shampine LF, Watts HA (1979) DEPAC - Design of a user oriented package of ODE solvers. Sandia National Laboratory Technical Report SAND79-2374.
14. Konnov AA (1998) Detailed reaction mechanism for small hydrocarbons combustion. Release 0.4. http://homepages.vub.ac.be/~akonnov/
15. Schultz E, Shepherd J (1999) Validation of detailed reaction mechanisms for detonation simulation. Graduate Aeronautical Laboratories of the California Institute of Technology Technical Report FM99-5.
16. Shepherd JE (1986) Chemical kinetics of hydrogen-air-diluent detonations. Progress in Astronautics and Aeronautics, 106:263-293.
17. Dorofeev SB, Kuznetsov MS, Alekseev VI, Efimenko AA, Breitung W (1999) Evaluation of limits for effective flame acceleration in hydrogen mixtures. Russian Research Center Kurchatov Institute and Forschungszentrum Karlsruhe Germany Report IAE-6150/3 FZKA-6349.
18. Clavin P (1985) Dynamic behavior of premixed flame fronts in laminar and turbulent flows. Progress in Energy and Combustion Science, 11(1):1-59.

19. Fristrom RM (1995) Flame Structure and Processes. JHU/APL Series in Science and Engineering, Oxford University Press.
20. Zabetakis MG (1965) Flammability characteristics of combustible gases and vapors. Bulletin 627, Bureau of Mines.
21. Warnatz J (1981) Concentration, pressure, and temperature dependence of the flame velocity in hydrogen-oxygen-nitrous oxide mixtures. Combustion Science and Technology, 26:203-213.
22. Gaydon AG, Wolfhard HG (1979) Flames: Their Structure, Radiation, and Temperature. Chapman and Hall, 4th edition.
23. Lewis B, von Elbe G (1961) Combustion, Flames, and Explosions of Gases. Academic Press.
24. Glassman I (1996) Combustion. 3rd edition, Academic Press.
25. Lee JHS (1984) Dynamic parameters of gaseous detonations. Annual Review of Fluid Mechanics, 16:311-336.