Embed Size (px)
Citation preview

Investigation of Conditions for Activation of Rupture Disk in BWR
Containment Filtering System
Guillem Beltran Arroyos
Master of Science Thesis at Nuclear Safety Department
Supervisor: Pavel Kudinov
Stockholm, Sverige,2011
I
Abstract
Due to the Three Mile Island accident in 1979 the Swedish government took the
decision in 1986 to impose a pressure relief system for Swedish BWR’s which prevents
containment overpressure in case of LOCA. This pressure relief system consists of a
rupture disks in two different systems, non-filtered system 361 and filtered system 362.
During a steam line break it is not clear if an unjustified activation of rupture disk 361 or
362 could possibly occur. If significant amount of nitrogen will leak out from the
containment then, there is a risk of low pressure in the containment (e.g. due to
activation of containment spray) with leaking rupture disks, which might cause air inflow
to the containment and burning of hydrogen, so conditions of activation of rupture disk
must be studied.
The main objective of this master thesis is the investigation of conditions of activation
of rupture disk in BWR containment filtering system. In order to find out these
conditions specific software called GOTHIC has been used.
The methodology of this master thesis has been modeling different containments with
GOTHIC software; this thesis work will go from a simple GOTHIC model, that consist in
nine lumped control volumes connected by flow paths, until a more complex GOTHIC
model that consist in a combination of lumped and 3D control volumes, connected
among them by flow paths and 3D connectors.
A large LOCA in the upper part of the reactor vessel will be considerate, due to this
severe accident; conditions for the activation of the rupture disk will be complying. It
has to be mentioned that pressure in the lumped modeling will be lower than pressure
in the 3D volumes. Activation time for the lumped modeling will be 8,5 seconds after
the steam break for system 362 and activation time for 3D modeling will be 2,8
seconds for system 362 as well. In neither case 361 system will be activated.
Considering this is a nuclear safety study and accuracy must be a key point, for further
investigations it might be more than advisable using 3D control volumes instead of
lumped control volumes.
It has to be mentioned also that due to there is no experimental data, uncertainty
regarding to the results exist, and if a further safety analysis want to be done, sensitive
study of the parameters implemented on GOTHIC software should be performed in the
future.
Keywords: GOTHIC software, rupture disk, large LOCA.
II
Contents
Contents
1 Introduction ............................................................................................................ 1
1.1 Background .................................................................................................... 1
1.2 BWR Containment Structure ........................................................................... 3
1.3 Overview of BWR-LOCA scenarios ................................................................ 4
1.4 Transients and Accidents Involving a Loss of coolant ..................................... 5
1.4.1 Main recirculation line break .................................................................... 5
1.4.2 Main steam line break .............................................................................. 6
1.4.3 Small and medium breaks ....................................................................... 8
1.5 Goals and tasks ............................................................................................ 11
1.6 GOTHIC: Introduction ................................................................................... 12
2 Containment Modeling in GOTHIC....................................................................... 13
2.1 C0-D0-W0-Vessel GOTHIC modeling ........................................................... 15
2.2 C3D-D3D-W0-Vessel GOTHIC modeling ...................................................... 17
3 Comparison of the results obtained with different 0D and 3D models. ................. 20
3.1 Lumped and subdivided volumes .................................................................. 20
3.2 Comparing the simulation results .................................................................. 20
3.2.1 Pressure in the volumes ........................................................................ 20
3.2.2 Flow from the vessel and flow to the wetwell ......................................... 22
3.2.3 Nitrogen concentration ........................................................................... 24
3.2.4 Liquid level in the blowdown pipe ........................................................... 25
4 Hypothesis for the oscillations in the lumped model and sensitive study on the
effect on the junctions ................................................................................................. 26
5 Conclusions ......................................................................................................... 28
6 References .......................................................................................................... 29
7 Appendix A. C0-D0-W0-Vessel simulation results ................................................ 30
7.1.1 C0-D0-W0-Vessel simulation results ..................................................... 30
7.1.2 DE600K1 Simulation results .................................................................. 30
7.1.3 DE600K3 Simulation results .................................................................. 33
7.1.4 DE600K4 Simulation results .................................................................. 36

III
8 Appendix B. C3D-D3D-W0-Vessel simulation results........................................... 41
8.1.1 C3D-D3D-W0-Vessel simulation results ................................................ 41
8.1.2 DE600K1 Simulation results .................................................................. 41
8.1.3 DE600K3 Simulation results .................................................................. 49
8.1.4 DE600K4 Simulation results .................................................................. 58
9 Appendix C. C3D-D0-W0 GOTHIC model ........................................................... 67
Boundary conditions and input deck .................................................................... 69
Simulation results ................................................................................................ 70
Summary ............................................................................................................. 73
Finding out an explanation for small oscillations .................................................. 73
10 Appendix B. C3D-SBC3D-D0-W0 model .......................................................... 76
Simulation results ................................................................................................ 78
Summary ............................................................................................................. 81

IV
List of abbreviations
LOCA Loss Of Coolant Accident
C3D Cap 3D volume
C0 Cap lumped volume
D3D Drywell 3D volume
D0 Drywell lumped volume
SBC3D Space Below Cap 3D volume
W0 Wetwell lumped volume

V
Acknowledgments
I would like to gratefully thank to my supervisor Pavel Kudinov for all the help and
support during all my thesis work.
Also I would like thank to Walter Villanueva and Hua Li all the help and advices they
had given to me regarding GOTHIC software which was completely unknown to me
before I came to KTH. Thanks also to the entire Nuclear Power Safety department for
keeping always this good environment that is really well appreciated.
Last but not least I would like to thank to my parents, Francesc and Carme, and my
sister, Elisenda, for all the support during all the time, despite they are far away I have
always felt they are by my side, and also to all my friends in Barcelona, thank you guys,
you are the best!
My best wishes to all of you!
1
1 Introduction
1.1 Background
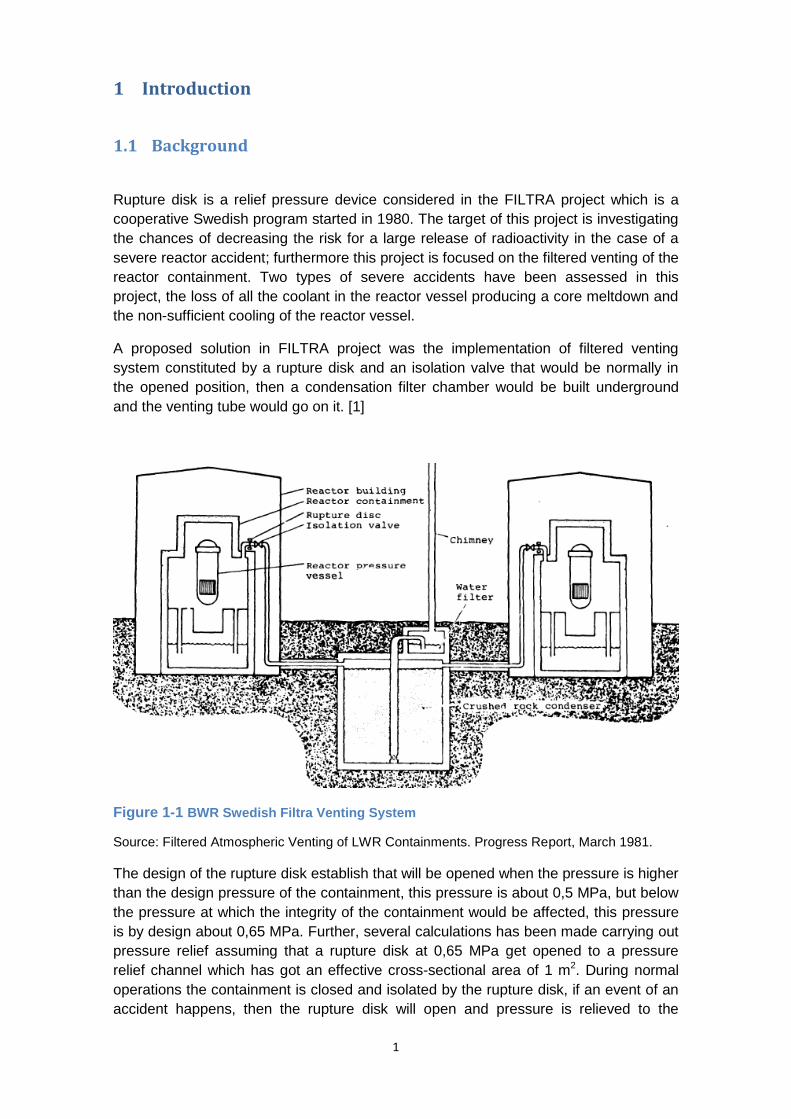
Rupture disk is a relief pressure device considered in the FILTRA project which is a
cooperative Swedish program started in 1980. The target of this project is investigating
the chances of decreasing the risk for a large release of radioactivity in the case of a
severe reactor accident; furthermore this project is focused on the filtered venting of the
reactor containment. Two types of severe accidents have been assessed in this
project, the loss of all the coolant in the reactor vessel producing a core meltdown and
the non-sufficient cooling of the reactor vessel.
A proposed solution in FILTRA project was the implementation of filtered venting
system constituted by a rupture disk and an isolation valve that would be normally in
the opened position, then a condensation filter chamber would be built underground
and the venting tube would go on it. [1]
Figure 1-1 BWR Swedish Filtra Venting System
Source: Filtered Atmospheric Venting of LWR Containments. Progress Report, March 1981.
The design of the rupture disk establish that will be opened when the pressure is higher
than the design pressure of the containment, this pressure is about 0,5 MPa, but below
the pressure at which the integrity of the containment would be affected, this pressure
is by design about 0,65 MPa. Further, several calculations has been made carrying out
pressure relief assuming that a rupture disk at 0,65 MPa get opened to a pressure
relief channel which has got an effective cross-sectional area of 1 m2. During normal
operations the containment is closed and isolated by the rupture disk, if an event of an
accident happens, then the rupture disk will open and pressure is relieved to the

2
condenser where steam is condensed, and then the condensate is kept at the bottom
of the condenser. The remaining incondensable gases go to a filter where iodine and
aerosols are filtered and removed.
Over the years many filtering and venting systems have been studied for being applied
in the containment, like gravel barriers and radioactive releases, those systems were
not implemented due to economic reasons.
3
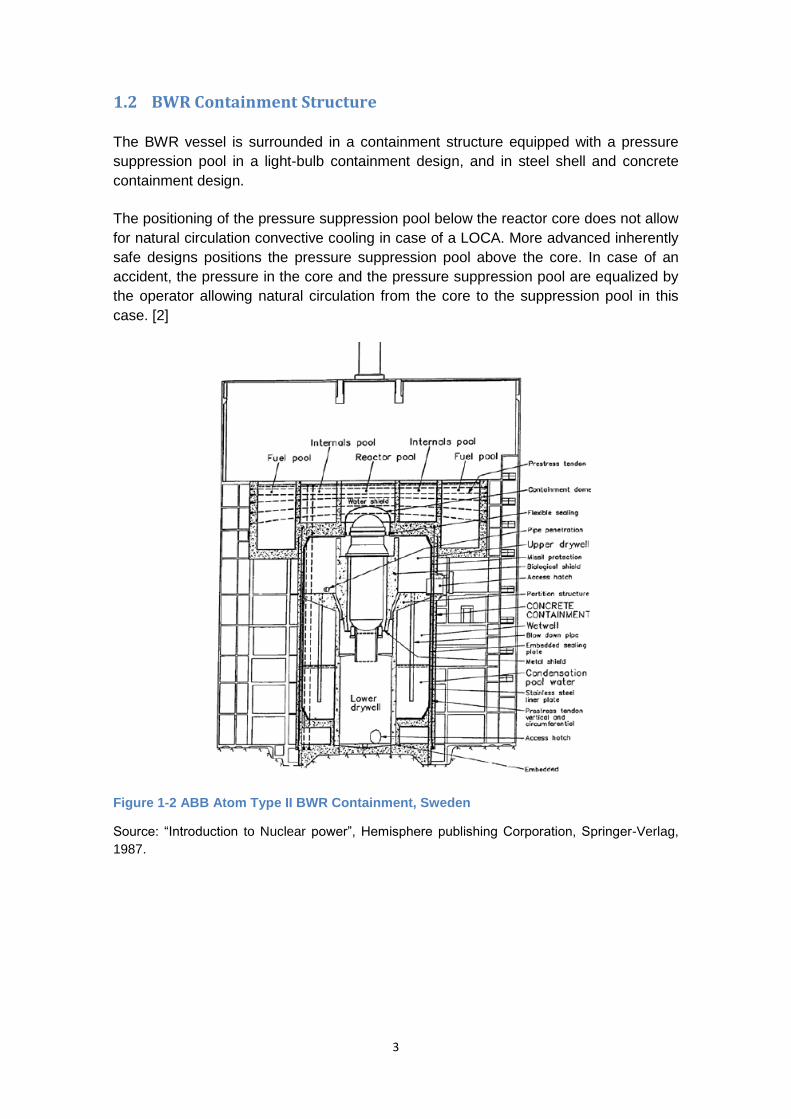
1.2 BWR Containment Structure
The BWR vessel is surrounded in a containment structure equipped with a pressure
suppression pool in a light-bulb containment design, and in steel shell and concrete
containment design.
The positioning of the pressure suppression pool below the reactor core does not allow
for natural circulation convective cooling in case of a LOCA. More advanced inherently
safe designs positions the pressure suppression pool above the core. In case of an
accident, the pressure in the core and the pressure suppression pool are equalized by
the operator allowing natural circulation from the core to the suppression pool in this
case. [2]
Figure 1-2 ABB Atom Type II BWR Containment, Sweden
Source: “Introduction to Nuclear power”, Hemisphere publishing Corporation, Springer-Verlag,
1987.
4
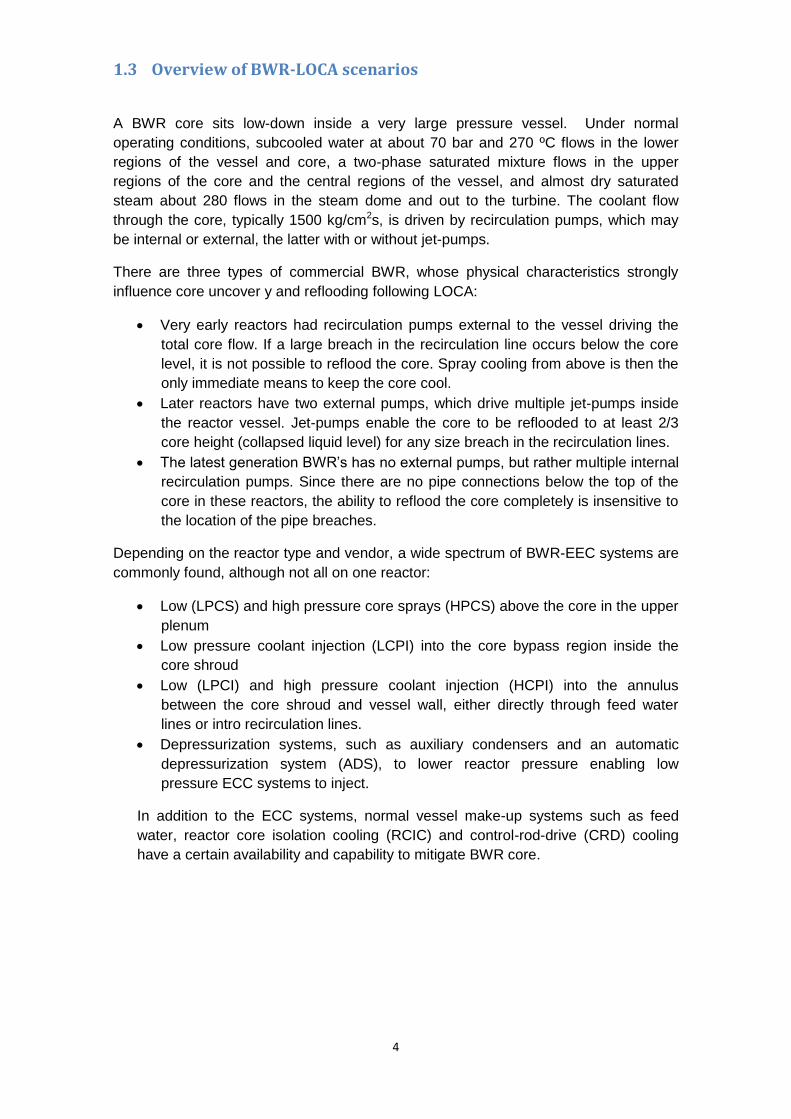
1.3 Overview of BWR-LOCA scenarios
A BWR core sits low-down inside a very large pressure vessel. Under normal
operating conditions, subcooled water at about 70 bar and 270 ºC flows in the lower
regions of the vessel and core, a two-phase saturated mixture flows in the upper
regions of the core and the central regions of the vessel, and almost dry saturated
steam about 280 flows in the steam dome and out to the turbine. The coolant flow
through the core, typically 1500 kg/cm2s, is driven by recirculation pumps, which may
be internal or external, the latter with or without jet-pumps.
There are three types of commercial BWR, whose physical characteristics strongly
influence core uncover y and reflooding following LOCA:
Very early reactors had recirculation pumps external to the vessel driving the
total core flow. If a large breach in the recirculation line occurs below the core
level, it is not possible to reflood the core. Spray cooling from above is then the
only immediate means to keep the core cool.
Later reactors have two external pumps, which drive multiple jet-pumps inside
the reactor vessel. Jet-pumps enable the core to be reflooded to at least 2/3
core height (collapsed liquid level) for any size breach in the recirculation lines.
The latest generation BWR’s has no external pumps, but rather multiple internal
recirculation pumps. Since there are no pipe connections below the top of the
core in these reactors, the ability to reflood the core completely is insensitive to
the location of the pipe breaches.
Depending on the reactor type and vendor, a wide spectrum of BWR-EEC systems are
commonly found, although not all on one reactor:
Low (LPCS) and high pressure core sprays (HPCS) above the core in the upper
plenum
Low pressure coolant injection (LCPI) into the core bypass region inside the
core shroud
Low (LPCI) and high pressure coolant injection (HCPI) into the annulus
between the core shroud and vessel wall, either directly through feed water
lines or intro recirculation lines.
Depressurization systems, such as auxiliary condensers and an automatic
depressurization system (ADS), to lower reactor pressure enabling low
pressure ECC systems to inject.
In addition to the ECC systems, normal vessel make-up systems such as feed
water, reactor core isolation cooling (RCIC) and control-rod-drive (CRD) cooling
have a certain availability and capability to mitigate BWR core.
5
1.4 Transients and Accidents Involving a Loss of coolant
BWR’s have a direct cycle primary system in which the continuous and very large of
loss of coolant from the reactor vessel through the steam lines during normal operation
is balanced by feed water. Any transient upsetting this balance, in particular a loss of
all feed water has a potential for core uncover within 30 minutes.
Risk studies show that transients, which are precursors to core uncover, have a far
greater probability of occurrence than have small or large breaches in the primary
systems.
Breaches in the primary system of all light water reactors create the potential for core
uncover. Whether uncover actually occurs or not depends on the breach size and
location, on available ECC or other make-up systems, and on the reactor type. On a
best-estimate basis, the following behavior is representative.
1.4.1 Main recirculation line break
In the case of reactors that have external pumps a design basic accident is a break in a
main recirculation line connected to the bottom of the reactor. In the case of reactors
provided by internal recirculation pumps, large break in the external recirculation loops
can’t be assumed due to those loops have been eliminated i. The outflow in case of
break is limited because the main recirculation pump and the control rod drive are
equipped with flow restrictors.
In the case of external recirculation pumps a Large LOCA is initiated by a double-
ended “guillotine”, the initial break flow is 20000 kg/s, and the break is located near the
nozzle in the bottom of the vessel. When this happens scram is automatically activated
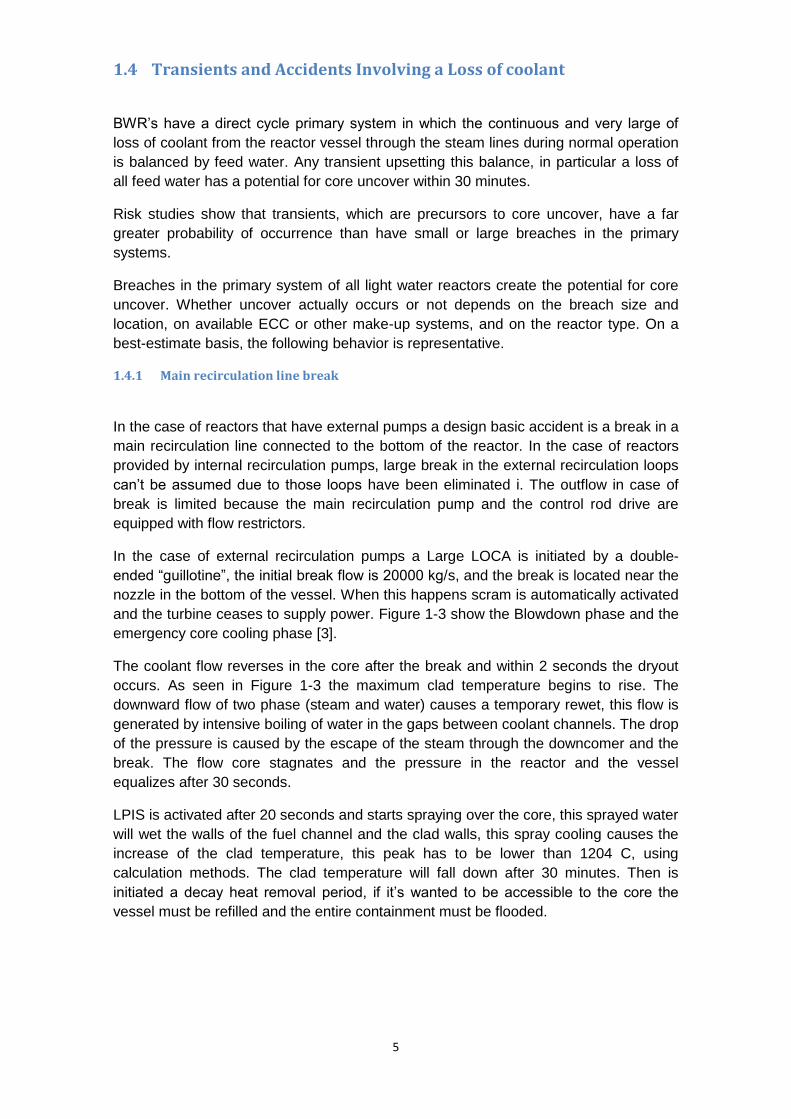
and the turbine ceases to supply power. Figure 1-3 show the Blowdown phase and the
emergency core cooling phase [3].
The coolant flow reverses in the core after the break and within 2 seconds the dryout
occurs. As seen in Figure 1-3 the maximum clad temperature begins to rise. The
downward flow of two phase (steam and water) causes a temporary rewet, this flow is
generated by intensive boiling of water in the gaps between coolant channels. The drop
of the pressure is caused by the escape of the steam through the downcomer and the
break. The flow core stagnates and the pressure in the reactor and the vessel
equalizes after 30 seconds.
LPIS is activated after 20 seconds and starts spraying over the core, this sprayed water
will wet the walls of the fuel channel and the clad walls, this spray cooling causes the
increase of the clad temperature, this peak has to be lower than 1204 C, using
calculation methods. The clad temperature will fall down after 30 minutes. Then is
initiated a decay heat removal period, if it’s wanted to be accessible to the core the
vessel must be refilled and the entire containment must be flooded.
6
Figure 1-3 Schematic diagrams of large LOCA in a BWR with external recirculation. From Handbook of Process Relations during Disturbances in Swedish BWR, AB-Asea Atom-ES Konsult AB, 1985
Due to the escaping water large reaction forces appear, water and gas will be forced to
go to the condensation pool due to the pressure; this will cause a swell in the
condensation pool, which results in large dynamic loads in the wetwell. When the break
occurs, pool water cooling is initiated, the cooling is caused by spraying the
compression chamber above the pool, and the spraying of the wetwell is initiated
manually. The steam condensation limits the pressure and temperature in the
containment atmosphere. After 30 minutes of the initial event, the drywell spray is
initiated manually.
1.4.2 Main steam line break
A large LOCA in BWR with internal recirculation pumps is represented by a guillotine in
a main steam line inside the reactor containment. The closure of the steam line
isolation valves and the reactor scram is caused by the increasing of the temperature
and the pressure due to the steam flow.
The pressure in the reactor vessels decreases very fast, due to that water swell and
reaches the steam outlet nozzles, after that the steam changes in to steam and water,
and then when the water level in the vessel goes down the break flow again changes
into steam flow. After this event and a few minutes, the blowdown phase ends and the
pressures in the containment and the vessel equalize. After 50 seconds of the break
7
occurs, the cooling of condensation pool and the spraying of the compression chamber
is automatically initiated, however, the spraying of the drywell is initiated automatically
after 30 minutes.
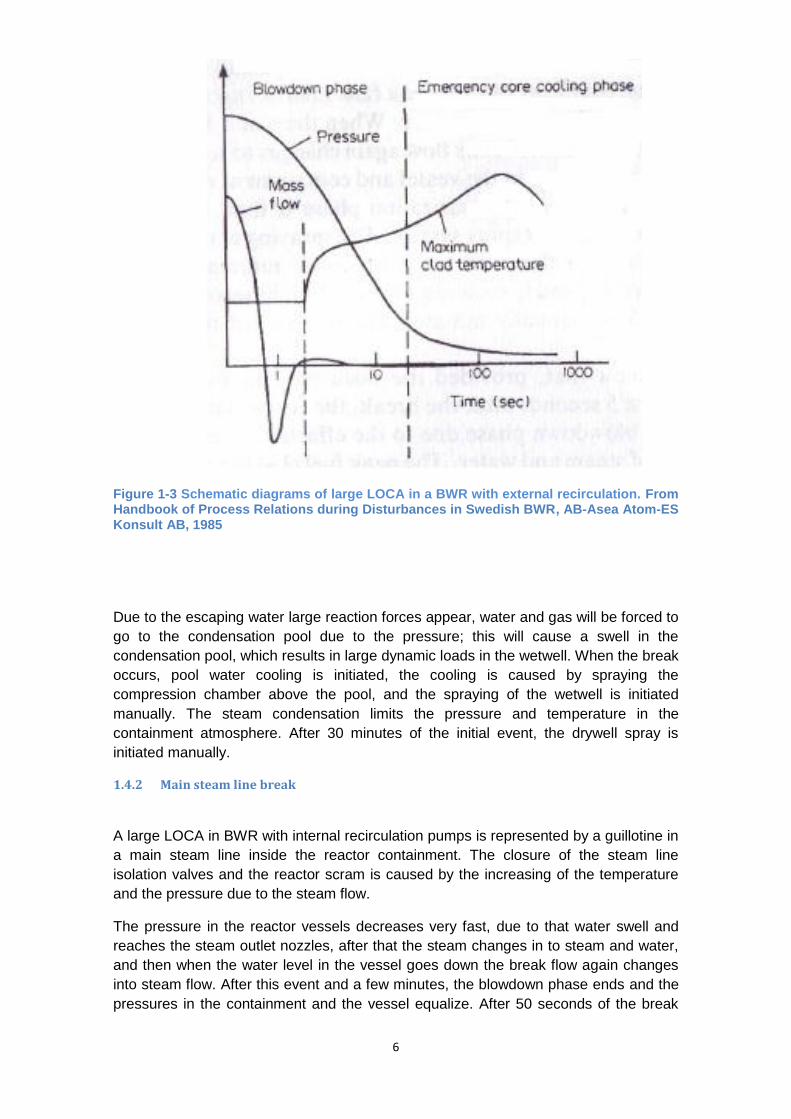
Figure 1-3 let us know the relative water level and the pressure in the reactor vessel.
[3]
Figure 1-4 Calculated water level and pressure in the reactor vessel after steam line breaks. From Handbook of Process Relations during Disturbances in Swedish BWR, AB-Asea Atom-ES Konsult AB, 1985

8
After the break, if the main recirculation pumps keep running for at least 5 seconds, the
core remains well cooled, due to the effective heat transfer during the blowdown phase.
Low pressure coolant injection system is activated when the pressure difference
between the wetwell compression chamber and the reactor vessel is 1,2 MPa.
The following formula provide us the rellative collapsed water level in the core:
Θ > 1 Core is covered by water
Θ < 1 Core is not covered by water, can be well cooled, since there may be a two-
phase level above the upper edge of the core
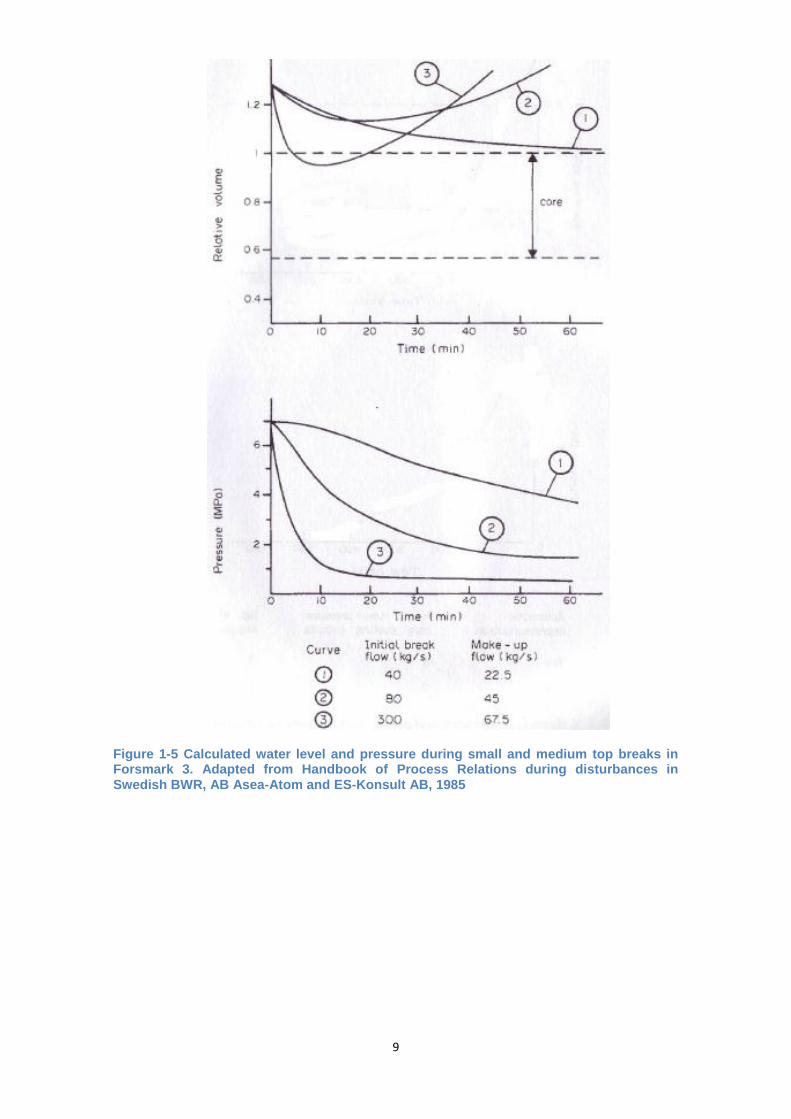
1.4.3 Small and medium breaks
When a small or medium break occurs, the temperature of the reactor containment
increases, due to this increase, isolation valves get closed, pressure relief valves are
opened and reactor scram is done.
In the hypothetical case of a small top break with a steam flow < 80 kg/s, auxiliary feed
water systems will keep the water level in the reactor vessel, each subsystem has got
the capacity of 22,5 kg/s, the reactor pressure and the break flow decrease due to the
auxiliary cold water and the escaping steam.
When the steam flow is <500 kg/s is called medium top break, after the break the
pressure of the reactor decreases very fast so the reactor coolant get swollen and then
the flow decreases in proportion to the drop in pressure. The automatic
depressurization gets started when the water level falls below the preset value, then
the LPIS will keep the core flooded. When the break is less than 300 kg/s, it’s enough
with the auxiliary feed water system to keep the core flooded.
When the liquid flow is <45 kg/s, it is called a small bottom break, and only the auxiliary
feed water system is necessary to ensure that the reactor vessel is flooded, but it has
to compensate for the loss of coolant caused by the steam generated due to the
residual heat.
When a top break happens, there’s a fast decrease of the reactor pressure and a slow
decrease of the water level in the vessel. A bottom break maintains the pressure and
leads to decrease the water level. When an intermediate level breaks occurs, at the
first time the level water falls down and the pressure is maintained, but when the
nozzles has been uncovered the pressure decreases.
To diagnose which kind of LOCA is happening in the reactor vessel, control room has
to look at how pressure and water level is behaving; the main problem is that the water
level can deviate from the real level, due to the recirculation pumps or the
depressurization. [3]
9
Figure 1-5 Calculated water level and pressure during small and medium top breaks in Forsmark 3. Adapted from Handbook of Process Relations during disturbances in Swedish BWR, AB Asea-Atom and ES-Konsult AB, 1985

10
Figure 1-6 Calculated water level and pressure after a postulated 80 cm2 bottom break in Forsmark 3.The maximum break flow is 500 kg/s. Adapted from Handbook of Process Relations during disturbances in Swedish BWR, AB Asea-Atom and ES-Konsult AB, 1985
11
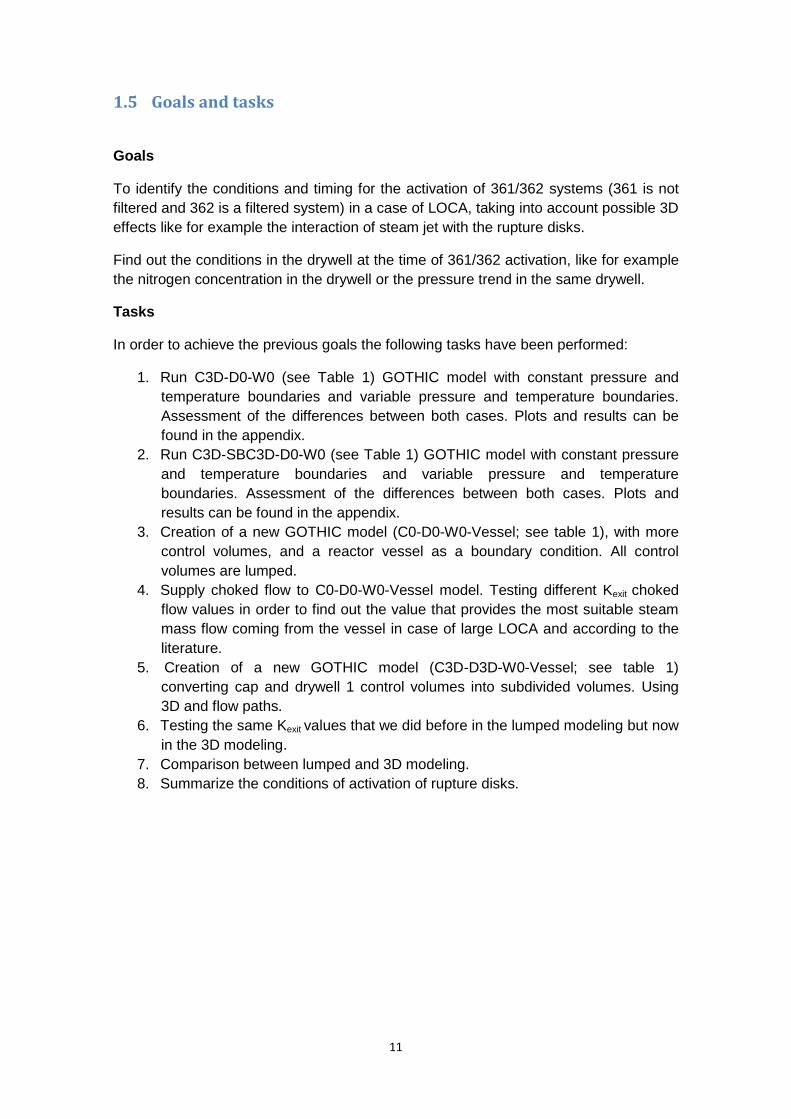
1.5 Goals and tasks
Goals
To identify the conditions and timing for the activation of 361/362 systems (361 is not
filtered and 362 is a filtered system) in a case of LOCA, taking into account possible 3D
effects like for example the interaction of steam jet with the rupture disks.
Find out the conditions in the drywell at the time of 361/362 activation, like for example
the nitrogen concentration in the drywell or the pressure trend in the same drywell.
Tasks
In order to achieve the previous goals the following tasks have been performed:
1. Run C3D-D0-W0 (see Table 1) GOTHIC model with constant pressure and
temperature boundaries and variable pressure and temperature boundaries.
Assessment of the differences between both cases. Plots and results can be
found in the appendix.
2. Run C3D-SBC3D-D0-W0 (see Table 1) GOTHIC model with constant pressure
and temperature boundaries and variable pressure and temperature
boundaries. Assessment of the differences between both cases. Plots and
results can be found in the appendix.
3. Creation of a new GOTHIC model (C0-D0-W0-Vessel; see table 1), with more
control volumes, and a reactor vessel as a boundary condition. All control
volumes are lumped.
4. Supply choked flow to C0-D0-W0-Vessel model. Testing different Kexit choked
flow values in order to find out the value that provides the most suitable steam
mass flow coming from the vessel in case of large LOCA and according to the
literature.
5. Creation of a new GOTHIC model (C3D-D3D-W0-Vessel; see table 1)
converting cap and drywell 1 control volumes into subdivided volumes. Using
3D and flow paths.
6. Testing the same Kexit values that we did before in the lumped modeling but now
in the 3D modeling.
7. Comparison between lumped and 3D modeling.
8. Summarize the conditions of activation of rupture disks.
12
1.6 GOTHIC: Introduction
GOTHIC thermal-hydraulics software provides to the user the capability of designing,
licensing, and operating the analysis of the containment in a nuclear Power Plant.
One can do a lot of things with GOTHIC Software, like determine pressure and
temperature in containment, qualification of the necessary equipment in that
containment, assessment of the failure of engineered safety features.
GOTHIC software includes three different programs:
GOTHIC_P – Preprocessor and Postprocessor
GOTHIC_S –Solver
GOTHIC_G – Graphics
GOTHIC software allows to the user performing a GOTHIC model with its driven
preprocessor and graphical tools, once the model is done the input file is written for the
GOTHIC_S. In the first step of modeling the user has to draw a schematic picture of
the model running GOTHIC_P. This GOTHIC_P allows to the user extracting outputs
from the analysis for display graphics time-dependent or in vector-contour graphs, the
user can choice what variables want to be plotted.
GOTHIC_S solves equations of energy, mass and momentum for the modeling done
with GOTHIC_P; this can be multi-phase or multi-component. This solver can treat the
momentum transport term in multi-dimensional models and the conservation equations
can be applied in three fields: Steam/gas mixture, continuous liquid and liquid droplet
fields. For this GOTHIC software the most important element for the model is the
control volume, this volume is used in order to be the model the space where the fluid
will be. This model has to be represented for at least one lumped volume. GOTHIC
solver allows to the user building models with lumped volumes (single node) or one-,
two- or three-dimensional or any combination of these with a single node. Volumes that
are not lumped will be considered as a subdivided volume.
GOTHIC_G allows to the user consulting the graphics file and extracting results from
this graphics and plots.
It is also important to remark that critical flow model will be used in some part of this
master thesis work. Critical flow model are for frictionless flow, using this flow the exit
loss is assumed to occur at the choke plane. In order to use this critical flow model exit
loss coefficient has to be supplied into the model, this coefficient is used to calculate an
effective discharge for the chocked flow. The discharge coefficient is calculated as:
)
And this coefficient it is used as a multiplier on the maximum discharge rate predicted
by the critical flow model. Kexit coefficient will be supplied for our last GOTHIC models
with different values (1, 3, and 4).
13
2 Containment Modeling in GOTHIC Assumptions
Taking into account that a safety analysis is being performed, we will start with a
simplified modeling for the containment and after that we will see if we need to go
further with the GOTHIC model, giving more complexity to the model in order to get
more realistic results which provide us value information of what is happening and why
does it happen.
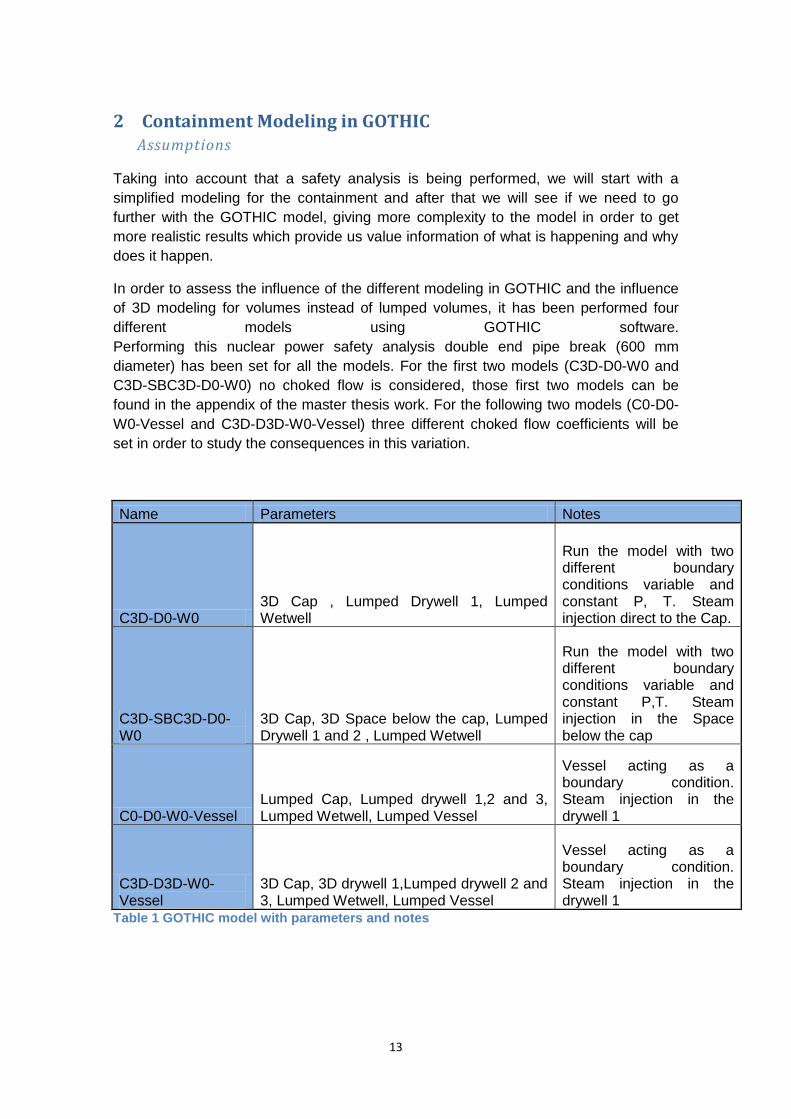
In order to assess the influence of the different modeling in GOTHIC and the influence
of 3D modeling for volumes instead of lumped volumes, it has been performed four
different models using GOTHIC software.
Performing this nuclear power safety analysis double end pipe break (600 mm
diameter) has been set for all the models. For the first two models (C3D-D0-W0 and
C3D-SBC3D-D0-W0) no choked flow is considered, those first two models can be
found in the appendix of the master thesis work. For the following two models (C0-D0-
W0-Vessel and C3D-D3D-W0-Vessel) three different choked flow coefficients will be
set in order to study the consequences in this variation.
Name Parameters Notes
C3D-D0-W0 3D Cap , Lumped Drywell 1, Lumped Wetwell
Run the model with two different boundary conditions variable and constant P, T. Steam injection direct to the Cap.
C3D-SBC3D-D0-W0
3D Cap, 3D Space below the cap, Lumped Drywell 1 and 2 , Lumped Wetwell
Run the model with two different boundary conditions variable and constant P,T. Steam injection in the Space below the cap
C0-D0-W0-Vessel Lumped Cap, Lumped drywell 1,2 and 3, Lumped Wetwell, Lumped Vessel
Vessel acting as a boundary condition. Steam injection in the drywell 1
C3D-D3D-W0-Vessel
3D Cap, 3D drywell 1,Lumped drywell 2 and 3, Lumped Wetwell, Lumped Vessel
Vessel acting as a boundary condition. Steam injection in the drywell 1
Table 1 GOTHIC model with parameters and notes
14
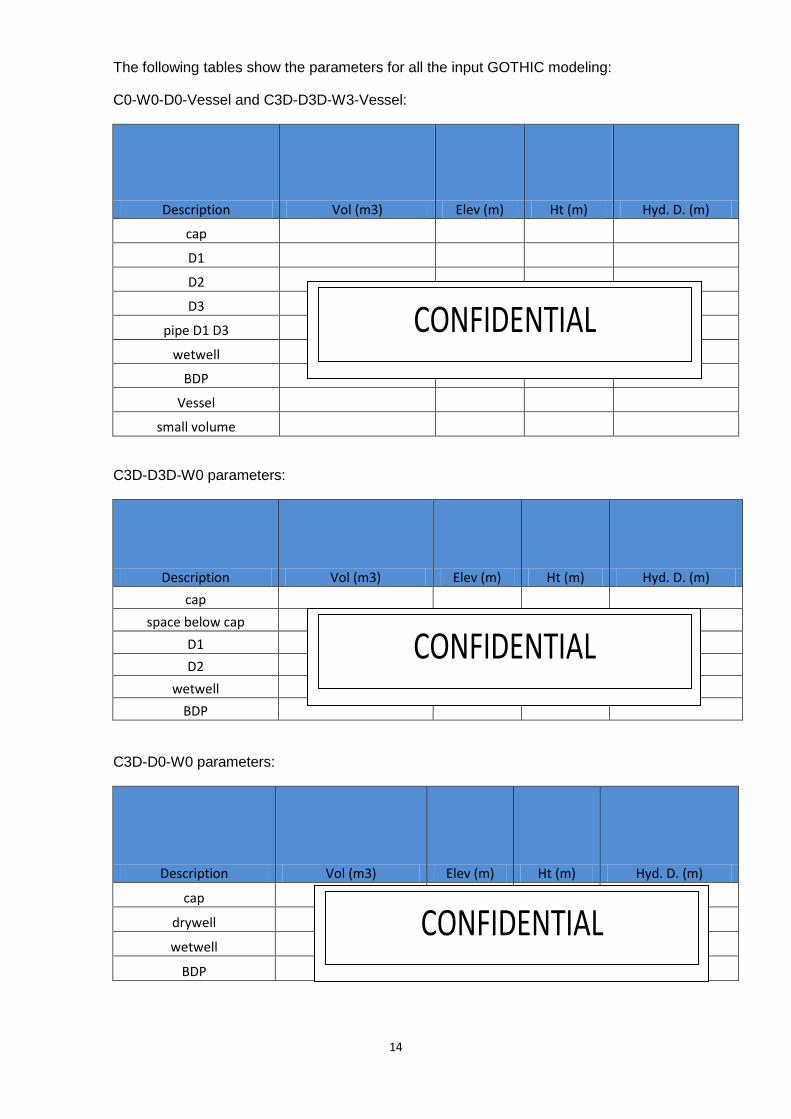
The following tables show the parameters for all the input GOTHIC modeling:
C0-W0-D0-Vessel and C3D-D3D-W3-Vessel:
Description Vol (m3) Elev (m) Ht (m) Hyd. D. (m)
cap D1 D2
D3 pipe D1 D3 wetwell BDP Vessel small volume
C3D-D3D-W0 parameters:
Description Vol (m3) Elev (m) Ht (m) Hyd. D. (m)
cap space below cap
D1 D2 wetwell BDP
C3D-D0-W0 parameters:
Description Vol (m3) Elev (m) Ht (m) Hyd. D. (m)
cap
drywell wetwell BDP
CONFIDENTIAL
CONFIDENTIAL
CONFIDENTIAL

15
2.1 C0-D0-W0-Vessel GOTHIC modeling
This is the third modeling for the Forsmark 1 containment. The first and the second
modeling can be found on the appendix. It is considered a Vessel as a lumped volume
in the model and as a Boundary condition as well, providing to the system a main
steam break line, the initial conditions for the vessel are: 70 bar pressure, 283 °C
temperature and a 10% of the total power, furthermore, 300 MW. This is the power
available after the scram.
It has been included also another drywell, this represents the gap between the vessel
and the upper drywell.
For the first case in that model all volumes are considered lumped, afterwards, the cap
and the upper drywell will be 3D volumes. [2]
Figure 2-1 C0-D0-W0-Vessel Sketch
16
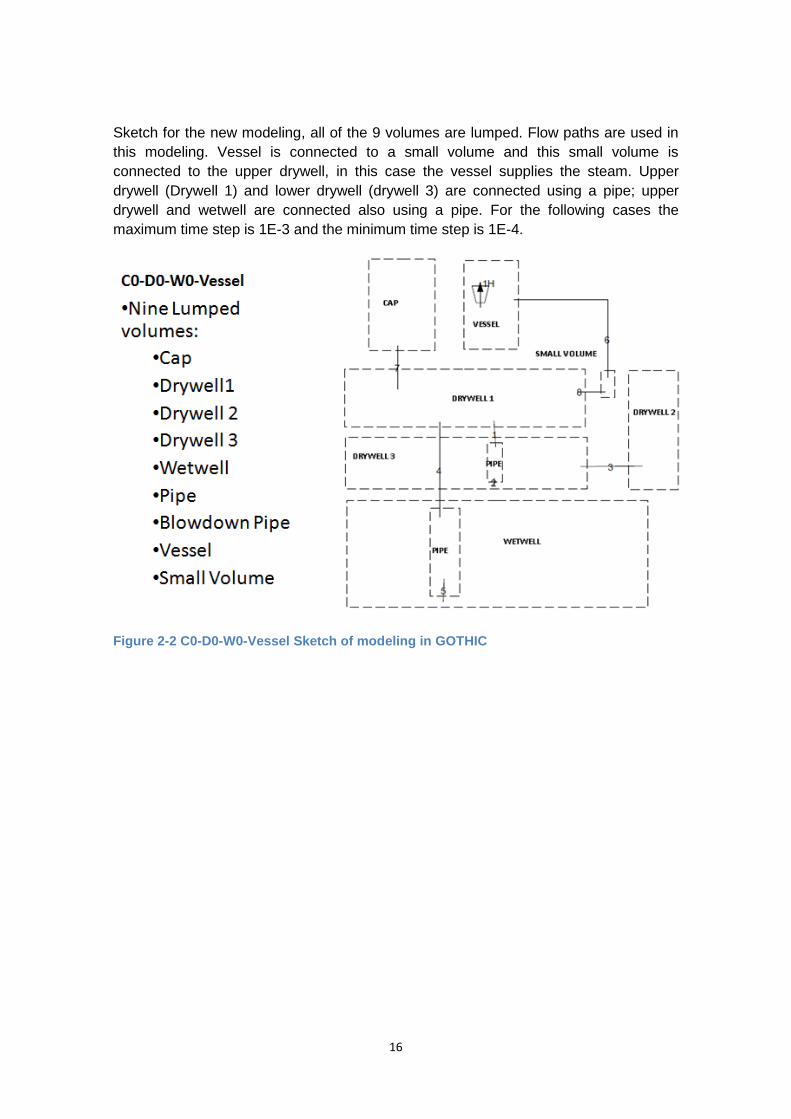
Sketch for the new modeling, all of the 9 volumes are lumped. Flow paths are used in
this modeling. Vessel is connected to a small volume and this small volume is
connected to the upper drywell, in this case the vessel supplies the steam. Upper
drywell (Drywell 1) and lower drywell (drywell 3) are connected using a pipe; upper
drywell and wetwell are connected also using a pipe. For the following cases the
maximum time step is 1E-3 and the minimum time step is 1E-4.
Figure 2-2 C0-D0-W0-Vessel Sketch of modeling in GOTHIC

17
2.2 C3D-D3D-W0-Vessel GOTHIC modeling
This is the fourth modeling for the Forsmark 1 containment. It is considered a Vessel as
a lumped volume in the model and as a Boundary condition as well, providing to the
system a main steam break line, the initial conditions for the vessel are: 70 bar
pressure, 283 °C temperature and a 10% of the total power, furthermore, 300 MW. This
is the residual heat power in the vessel. It has been included also another drywell, this
represents the gap between the vessel and the upper drywell. According to the pattern
that a safety analysis might follow, we began with a simple GOTHIC model of the
containment, and then giving more complexity in order go further with the reduction of
conservationism, for this specific case giving more complexity means introducing more
control volumes in our model, in order to approach to the real containment, on the other
hand, considering the upper drywell as a 3D instead of a lumped volume, so a
performing analysis of the gas distribution can be assessed and we assume the
simulations results we will obtain will be the more realistic values, those whom
approach more to the reality.[2]
Figure 2-3 C3D-D3D-D0-W0-Vessel Sketch
18
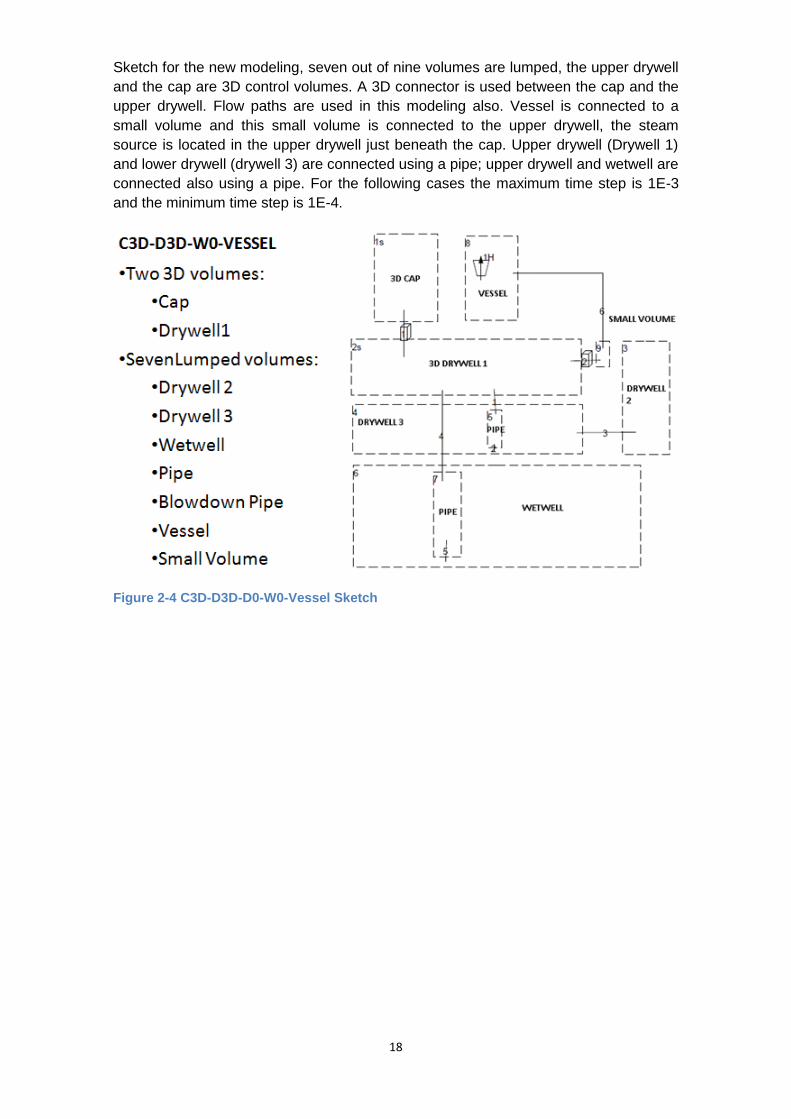
Sketch for the new modeling, seven out of nine volumes are lumped, the upper drywell
and the cap are 3D control volumes. A 3D connector is used between the cap and the
upper drywell. Flow paths are used in this modeling also. Vessel is connected to a
small volume and this small volume is connected to the upper drywell, the steam
source is located in the upper drywell just beneath the cap. Upper drywell (Drywell 1)
and lower drywell (drywell 3) are connected using a pipe; upper drywell and wetwell are
connected also using a pipe. For the following cases the maximum time step is 1E-3
and the minimum time step is 1E-4.
Figure 2-4 C3D-D3D-D0-W0-Vessel Sketch
19
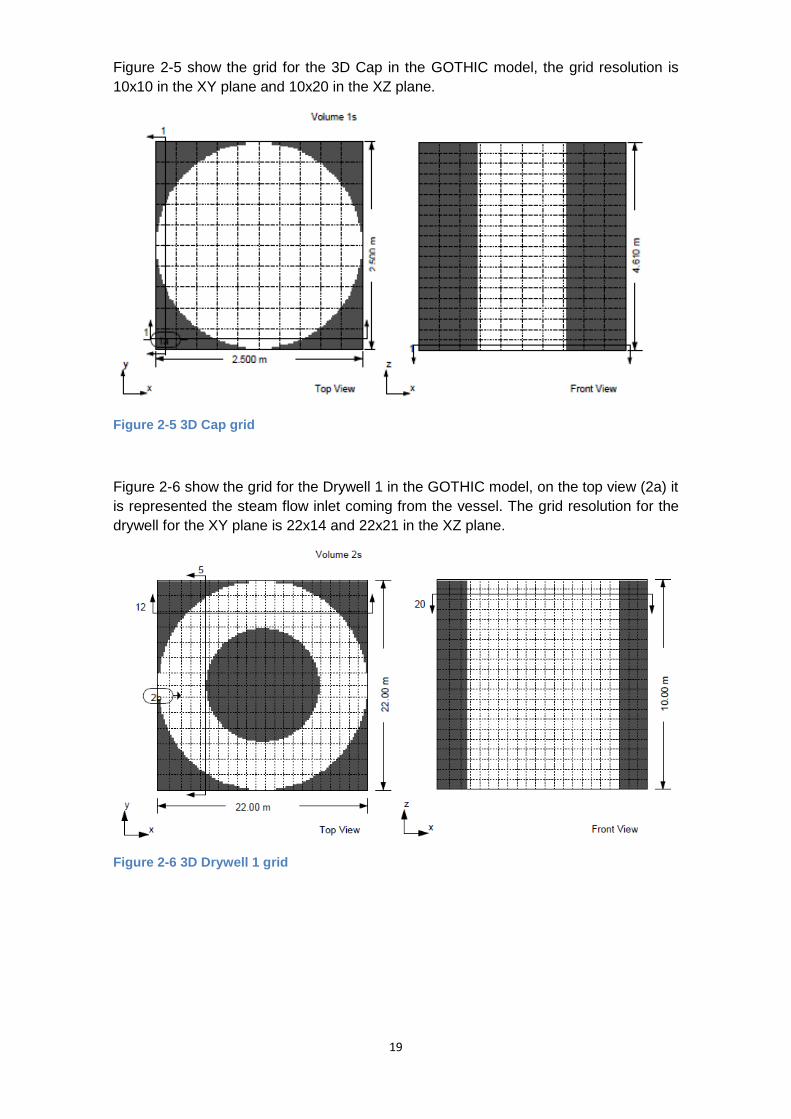
Figure 2-5 show the grid for the 3D Cap in the GOTHIC model, the grid resolution is
10x10 in the XY plane and 10x20 in the XZ plane.
Figure 2-5 3D Cap grid
Figure 2-6 show the grid for the Drywell 1 in the GOTHIC model, on the top view (2a) it
is represented the steam flow inlet coming from the vessel. The grid resolution for the
drywell for the XY plane is 22x14 and 22x21 in the XZ plane.
Figure 2-6 3D Drywell 1 grid

20
3 Comparison of the results obtained with different 0D and 3D
models.
3.1 Lumped and subdivided volumes
The main target of this work have been the study of the consequences of the
unintended activation of the rupture disk in the FILTRA system for the Swedish BWR
reactors, but meanwhile this safety analysis have been performed new questions have
emerged regarding to the reduction of conservationism and which would be the
optimistic path to follow in order to do a good safety report. During this thesis work we
have modeled the Forsmark I containment with lumped and 3D volumes, beginning
with a completely lumped model; C0-D0-W0-Vessel and then giving it more complexity
in order to approach more to the reality. This complexity implies transforming lumped
volumes in to 3D volumes, because a lumped volume is considered for the GOTHIC
software as a single node for which average values of the primary and secondary
variables are computed, and a 3D volume or subdivided volume is a volume modeled
by overlaying an orthogonal computational mesh on a volume, furthermore, all the
dependent parameters that define the thermal-hydraulic state are local values. Since
we are doing a nuclear safety study, accuracy and approaching to the reality is
something we have to concern about, that accuracy with the values of the properties
we are seeking are closely related with the type of volumes we are using for our
GOTHIC models, therefore this accuracy will be highly improved if we use subdivided
volumes instead of lumped volumes due to when we work with 3D volumes the
software solve the momentum equations for the computational grid, and when we work
with lumped volumes the momentum equation is solved only for the junctions, it does
not exist a flow field inside the volume due to this volume; as we said; it is considered
as a single node.
3.2 Comparing the simulation results
In order to see this differences between the same model but using different type of
volume (lumped or subdivided) we will proceed to compare the simulations results
obtained from C0-D0-W0-Vessel and C3D-D3D-W0-Vessel, which is considered the
most realistic case according to the plots and values obtained, the model which have a
double end guillotine with 600 mm of break diameter and Kexit coefficient=3
(DE600K3). More simulations results with different Kexit values can be found in the
appendix.
3.2.1 Pressure in the volumes
Figures below show the two different pressure trends in all the volumes except for the
cap. It is clear that both plots are quite different, in the 3D model pressure is quite
higher compared to the lumped model (more than 1 bar), and the trend is different as
well. Break location was selected closest possible to this cap, and the direction of the
jet was towards the cap, despite this pressures are practical the same, there is no
effect of this jet in activation of 361/362.

21
For the lumped model there are oscillations in the pressure and the wetwell pressure is
quite high, for the 3D there is no oscillation and the pressure in the wetwell is the
expected pressure. A possible explanation for this variation is how GOTHIC calculates
mass and energy transfer between liquid and vapor phase, for lumped volumes pool
regime is assumed but for 3D volumes flow regime map is used in order to calculate
this energy transfer.
This phenomena will significantly affect to the results, and therefore, to the conclusions.
So we can see in the following plots how for the lumped model, pressure in the cap
does not even reach 6 bar, and for the 3D modeling reaches 7 bar. Due to this higher
pressure in the 3D modeling activation time will be shorter. In 3D modeling activation
time for 362 is 2,8 sec. and in lumped modeling activation time is 8,5 sec. In either
case system 361 will be activated.
a) Lumped model b) 3D model
Figure 3-1 Pressure trend for all the volumes except the cap comparison
a) Lumped model b) 3D model
Figure 3-2 Pressure trend for the cap comparison

22
a) Lumped model b) 3D model
Figure 3-3 361/362 activation time comparison
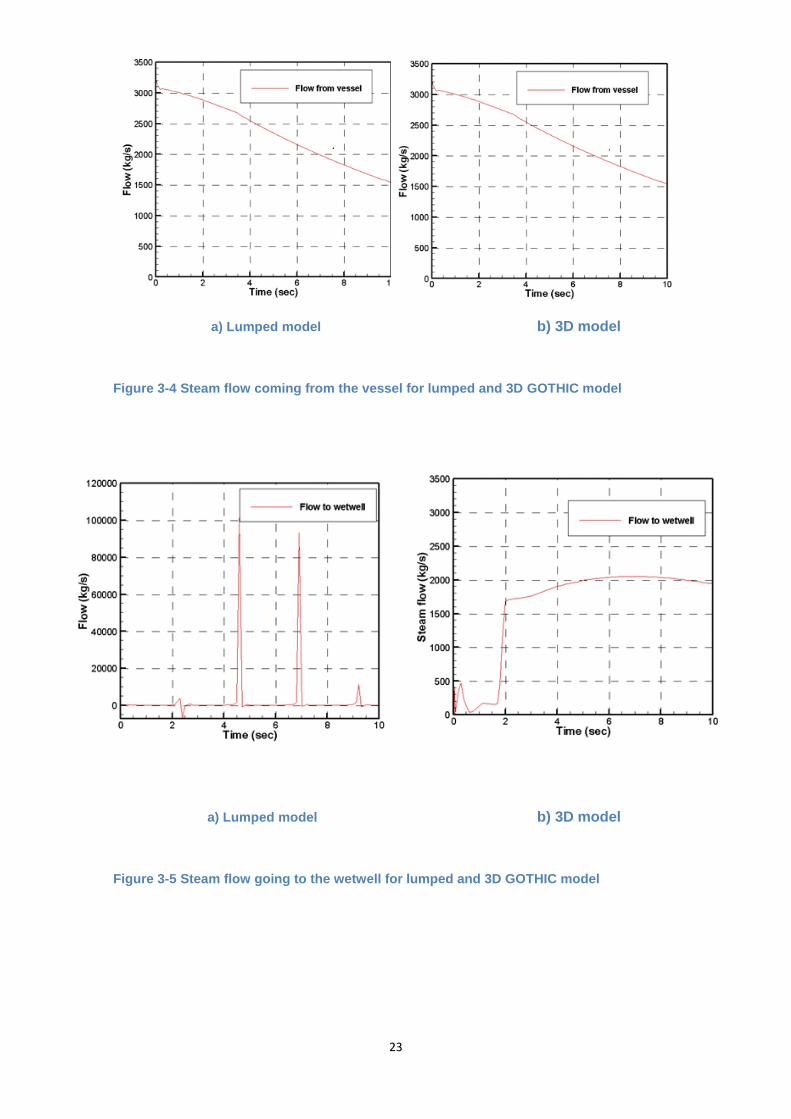
3.2.2 Flow from the vessel and flow to the wetwell
Figures below show the flow from the vessel to the upper drywell and flow to the
wetwell. No differences can be noticed in the steam mass flow coming from the vessel
and going to the upper drywell , both have same parameters for the vessel so steam
mass flow is identical.
Regarding to the steam mass flow going to the wetwell there is a really big difference
quantitatively and qualitatively. For the lumped model, flow steam reach 100.000 kg/s
and for the 3D model 2.000 kg/s, taking into account that the steam flow initial value is
3.200, 3D model give us a clue that is more reliable.
A possible explanation for this phenomenon is the upper drywell, for one model this
upper drywell is considered as a lumped volume, and for the other one is considered
as subdivided volume, so in the lumped model GOTHIC understands this drywell as a
single node, furthermore, the parameter values will be calculated based on average
values. So we can assume that values calculated with subdivided volumes are more
reliable.
If we want to understand why pressure shows oscillation when the drywell 1 is lumped
and does not show oscillation when it’s a subdivided volume we have to take a look the
flow plot below. In the lumped scenario we can see how the flow to the wetwell
oscillates during the time; this flow to the wetwell is what rules all the behavior in the
upper volumes, due to this steam flow oscillation below pressure oscillates as well.
23
a) Lumped model b) 3D model
Figure 3-4 Steam flow coming from the vessel for lumped and 3D GOTHIC model
a) Lumped model b) 3D model
Figure 3-5 Steam flow going to the wetwell for lumped and 3D GOTHIC model
24
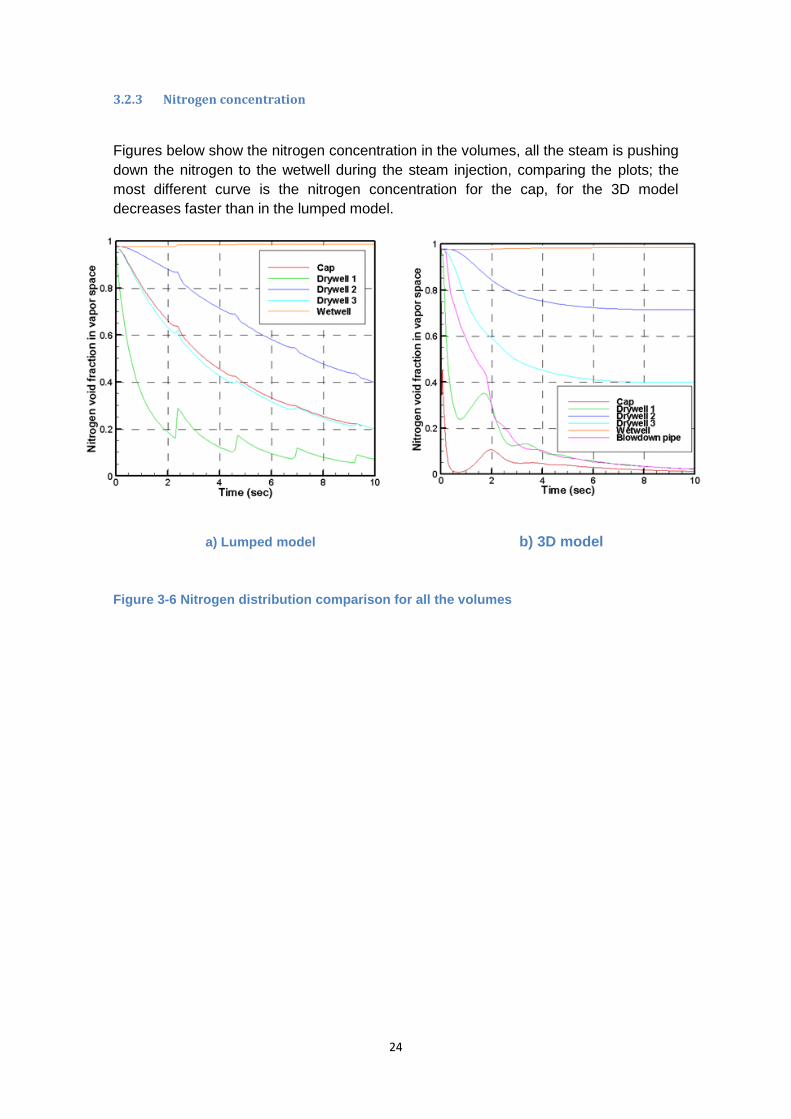
3.2.3 Nitrogen concentration
Figures below show the nitrogen concentration in the volumes, all the steam is pushing
down the nitrogen to the wetwell during the steam injection, comparing the plots; the
most different curve is the nitrogen concentration for the cap, for the 3D model
decreases faster than in the lumped model.
a) Lumped model b) 3D model
Figure 3-6 Nitrogen distribution comparison for all the volumes
25
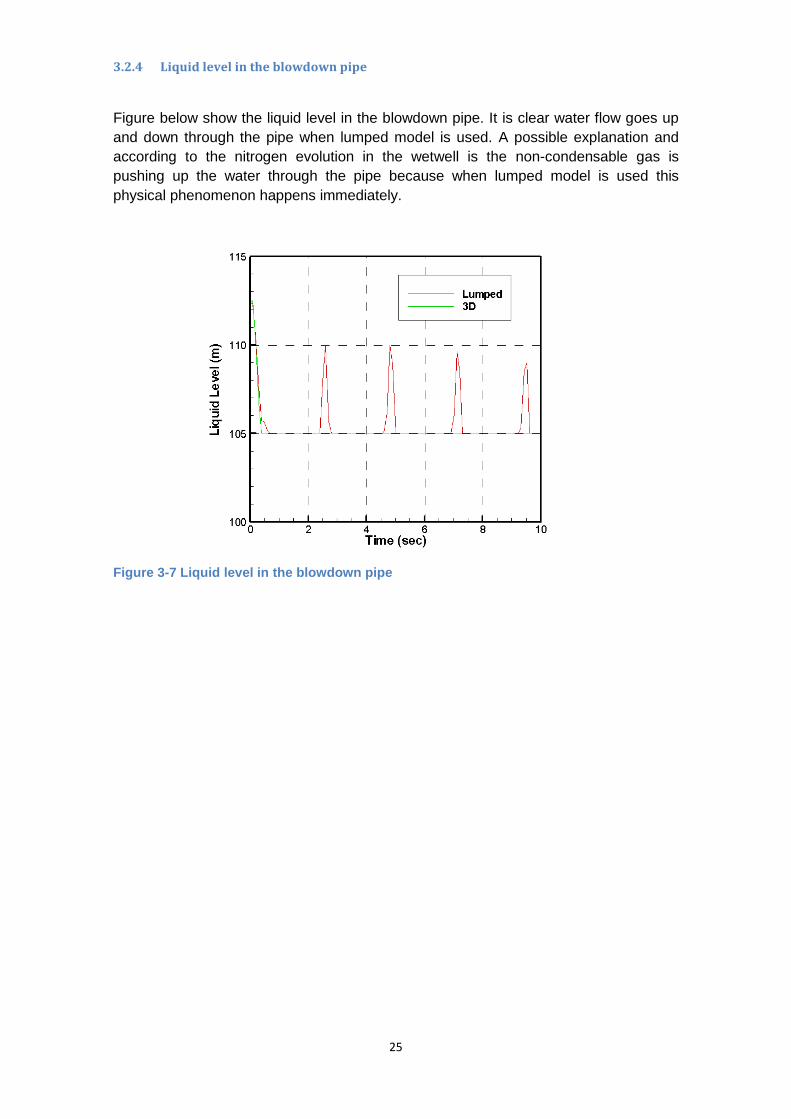
3.2.4 Liquid level in the blowdown pipe
Figure below show the liquid level in the blowdown pipe. It is clear water flow goes up
and down through the pipe when lumped model is used. A possible explanation and
according to the nitrogen evolution in the wetwell is the non-condensable gas is
pushing up the water through the pipe because when lumped model is used this
physical phenomenon happens immediately.
Figure 3-7 Liquid level in the blowdown pipe

26
4 Hypothesis for the oscillations in the lumped model and
sensitive study on the effect on the junctions
In order to understand this oscillations presented in the steam flow, and check the
reason why it happens, we want to rule out the idea of this oscillations are caused due
to steam injection is injected too fast in the drywell 1 because it is lumped and GOTHIC
software understand it as a single node. So drywell 1 has been split and inertia and
friction length has been added in to the flow path that connects both drywell. This
would provide some extra time and maybe reduce the oscillations in the blowdown
pipe.
Figure 4-1 Separated Drywell 1 sketch
Figure below show the steam flow to the wetwell for the lumped and split drywell 1 and
the 3D volume. As it can be assessed no big difference with the previous flow plot can
be appreciated. So we can rule out the hypothesis of adding time by splitting drywell 1.
Figure 4-2 Flow to the wetwell
27
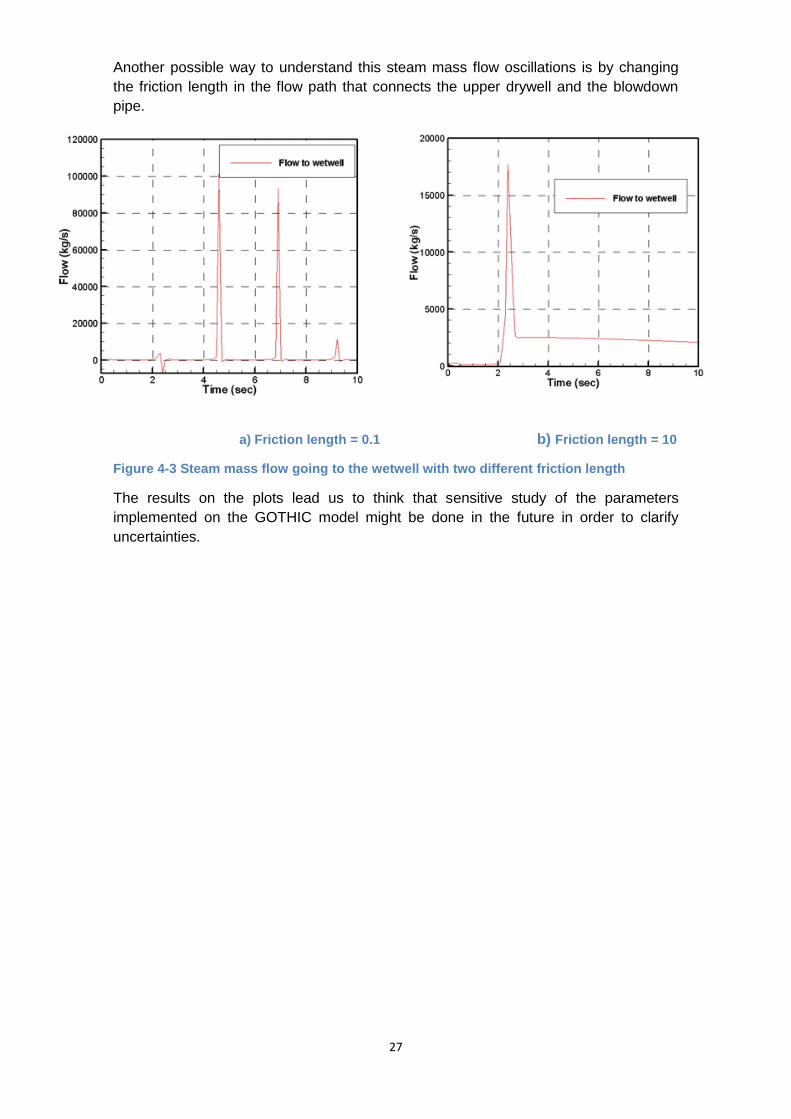
Another possible way to understand this steam mass flow oscillations is by changing
the friction length in the flow path that connects the upper drywell and the blowdown
pipe.
a) Friction length = 0.1 b) Friction length = 10
Figure 4-3 Steam mass flow going to the wetwell with two different friction length
The results on the plots lead us to think that sensitive study of the parameters
implemented on the GOTHIC model might be done in the future in order to clarify
uncertainties.
28
5 Conclusions
In case of large LOCA in BWR it has been proved that 362 filtered system is
activated, but depending on if GOTHIC modeling is 3D or lumped, activation time
for 362 filtered system can vary widely. Only for one extreme case in 3D modeling,
non-filtered 361 system gets activated. So we can conclude that given a large
LOCA in a BWR only 362 would be activated. No apparent influence in steam jet on
systems has been found.
Regarding the difference between the input modeling in GOTHIC, simulation results
in lumped and 3D modeling are not in good agreement with each other. In lumped
modeling key results such as pressure and steam flow show oscillations, in 3D
modeling it does not show oscillations. For more realistic modeling of nitrogen
concentration it is important to use 3D control volumes instead of lumped control
volumes.
Uncertainties in modeling (e.g. friction and inertia lengths in the junctions, position
of blowdown pipes in 3D modeling), and in scenario (e.g. position and size of the
break) can have significant influence on the results of analysis for activation of
361/362 systems.
Further studies should work on reducing uncertainties in modeling, by performing
an analytic study of parameter sensitivity used in the input modeling. It might be
interesting also the investigation of conditions of activation of rupture disk in case of
small and medium break LOCA with different positions of the break.

29
6 References
1. Filtered Atmospheric Venting of LWR Containments, Lars Högberg, Progress
Report, March 1981.
2. “Introduction to Nuclear power”, Springer-Verlag, Hemisphere publishing
Corporation, , 1987.
3. Handbook of Process Relations during Disturbances in Swedish BWR, AB-Asea
Atom-ES Konsult AB, 1985
4. GOTHIC 8.0 user manual Frank Rahn, Numerical Applications Inc, 2010.
30
7 Appendix A. C0-D0-W0-Vessel simulation results
7.1.1 C0-D0-W0-Vessel simulation results
In this chapter key results for all the different Kexit values will be shown, taking into
account Kexit=1,2,3. Due to the main target of this thesis work is the investigation of
conditions for activation of the rupture disk, and rupture disk gets activated due to the
pressure in the cap, pressure trend in the cap and activation time of 361 and 362
systems will be shown in the following figures, besides three tables summarize the
maximum values reached in the control volumes for all the transient time (100 sec).
7.1.2 DE600K1 Simulation results
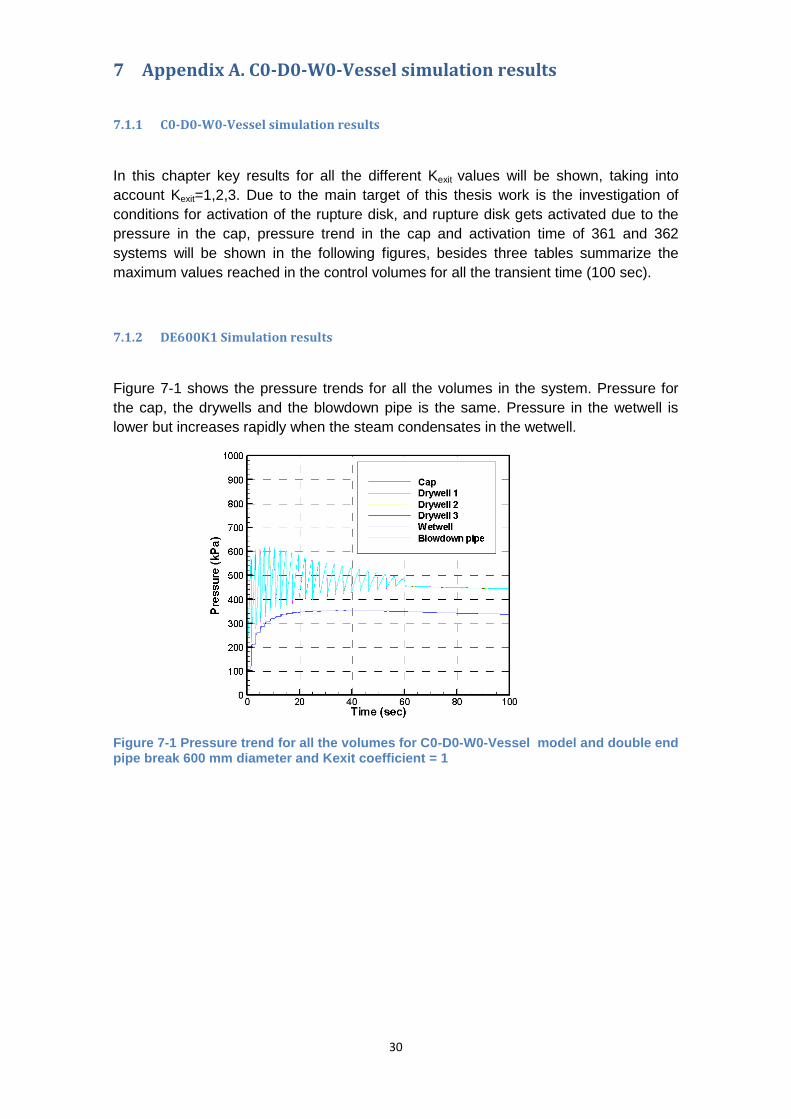
Figure 7-1 shows the pressure trends for all the volumes in the system. Pressure for
the cap, the drywells and the blowdown pipe is the same. Pressure in the wetwell is
lower but increases rapidly when the steam condensates in the wetwell.
Figure 7-1 Pressure trend for all the volumes for C0-D0-W0-Vessel model and double end pipe break 600 mm diameter and Kexit coefficient = 1

31
Figure 7-2 shows the pressure trend in the cap, at the begging pressure increases
quite fast to about 580 kPa and then starts oscillating with a slow pressure increasing.
Figure 7-2 Pressure trend for the cap for C0-D0-W0-Vessel model and double end pipe break 600 mm diameter and Kexit coefficient = 1
Figure 7-3 show the activation time for the systems 361/362, in this case 362 system is
activated at 1,5 seconds and 361 will never be activated.
Figure 7-3 Activation time for C0-D0-W0-Vessel model and double end pipe break 600 mm diameter and Kexit coefficient = 1
32
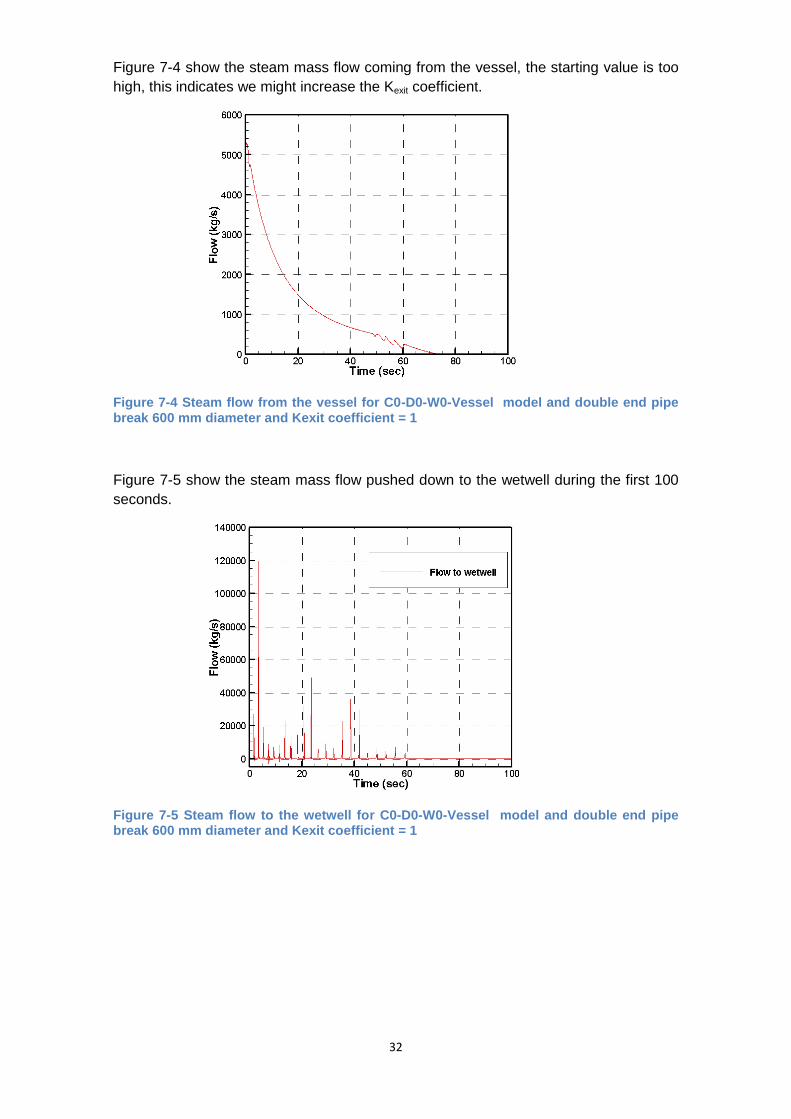
Figure 7-4 show the steam mass flow coming from the vessel, the starting value is too
high, this indicates we might increase the Kexit coefficient.
Figure 7-4 Steam flow from the vessel for C0-D0-W0-Vessel model and double end pipe break 600 mm diameter and Kexit coefficient = 1
Figure 7-5 show the steam mass flow pushed down to the wetwell during the first 100
seconds.
Figure 7-5 Steam flow to the wetwell for C0-D0-W0-Vessel model and double end pipe break 600 mm diameter and Kexit coefficient = 1
33
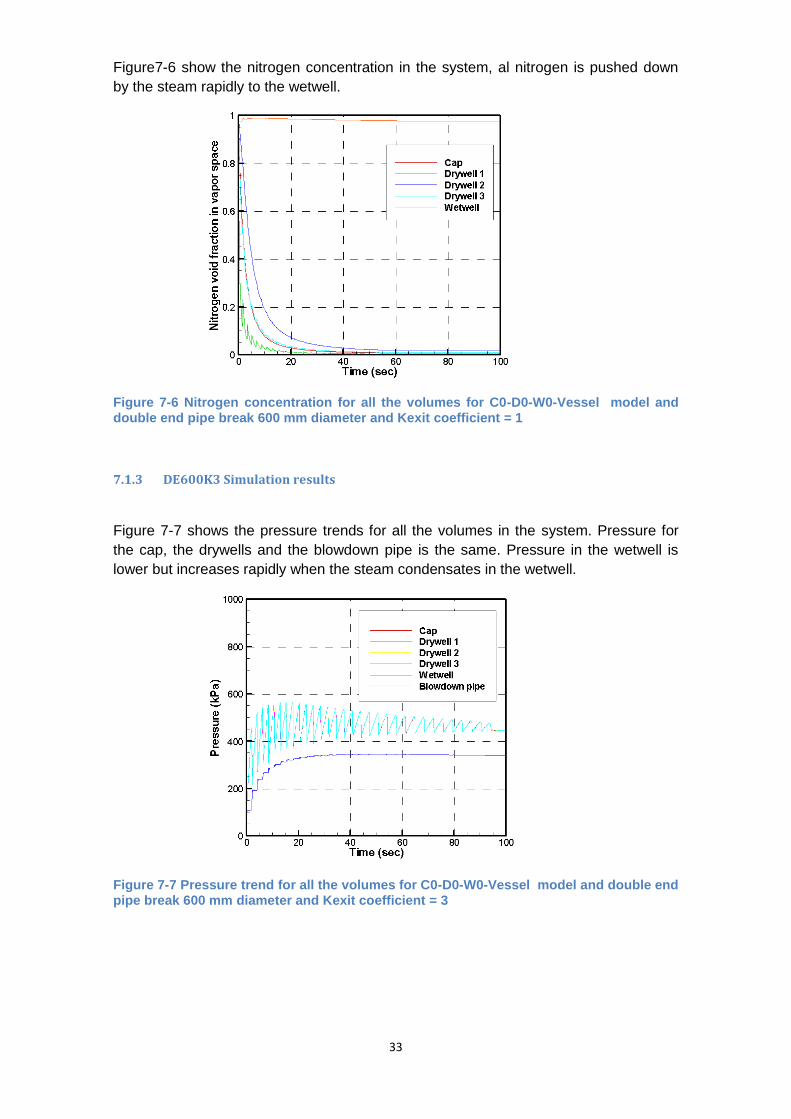
Figure7-6 show the nitrogen concentration in the system, al nitrogen is pushed down
by the steam rapidly to the wetwell.
Figure 7-6 Nitrogen concentration for all the volumes for C0-D0-W0-Vessel model and double end pipe break 600 mm diameter and Kexit coefficient = 1
7.1.3 DE600K3 Simulation results
Figure 7-7 shows the pressure trends for all the volumes in the system. Pressure for
the cap, the drywells and the blowdown pipe is the same. Pressure in the wetwell is
lower but increases rapidly when the steam condensates in the wetwell.
Figure 7-7 Pressure trend for all the volumes for C0-D0-W0-Vessel model and double end pipe break 600 mm diameter and Kexit coefficient = 3
34
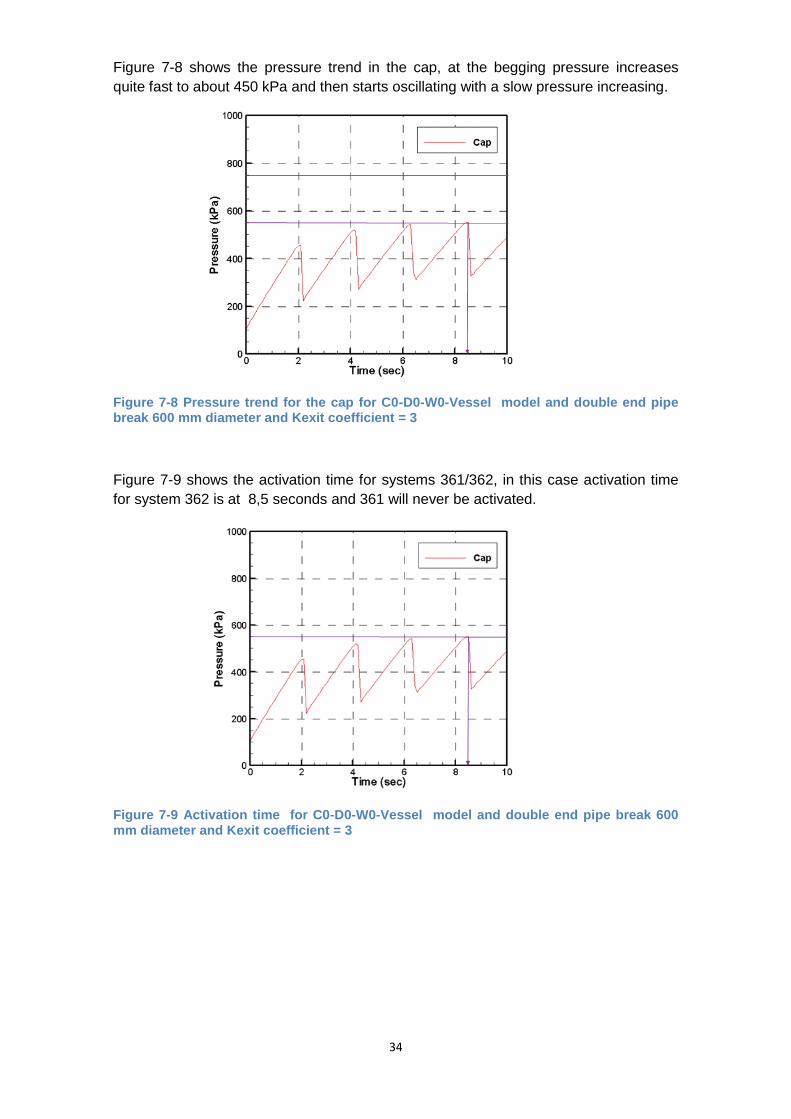
Figure 7-8 shows the pressure trend in the cap, at the begging pressure increases
quite fast to about 450 kPa and then starts oscillating with a slow pressure increasing.
Figure 7-8 Pressure trend for the cap for C0-D0-W0-Vessel model and double end pipe break 600 mm diameter and Kexit coefficient = 3
Figure 7-9 shows the activation time for systems 361/362, in this case activation time
for system 362 is at 8,5 seconds and 361 will never be activated.
Figure 7-9 Activation time for C0-D0-W0-Vessel model and double end pipe break 600 mm diameter and Kexit coefficient = 3

35
Figure 7-10 shows the steam mass flow that comes from the vessel, we can notice that
increasing the Kexit value decreases the total steam injected to the upper drywell. This
value approaches more to the reality according to the literature.
Figure 7-10 Steam flow from the vessel for C0-D0-W0-Vessel model and double end pipe break 600 mm diameter and Kexit coefficient = 3
Figure 7-11 shows the steam mass flow pushed to the wetwell during 100 seconds.
Figure 7-11 Steam flow to the wetwell for C0-D0-W0-Vessel model and double end pipe break 600 mm diameter and Kexit coefficient = 3
36
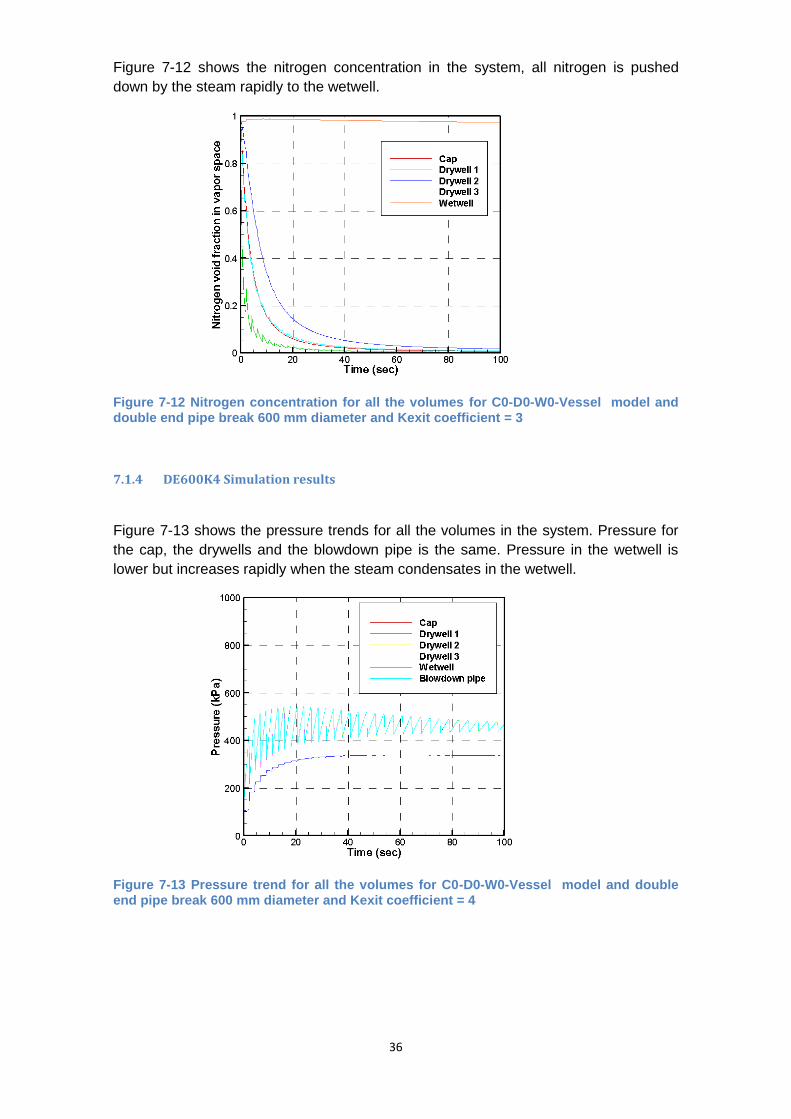
Figure 7-12 shows the nitrogen concentration in the system, all nitrogen is pushed
down by the steam rapidly to the wetwell.
Figure 7-12 Nitrogen concentration for all the volumes for C0-D0-W0-Vessel model and double end pipe break 600 mm diameter and Kexit coefficient = 3
7.1.4 DE600K4 Simulation results
Figure 7-13 shows the pressure trends for all the volumes in the system. Pressure for
the cap, the drywells and the blowdown pipe is the same. Pressure in the wetwell is
lower but increases rapidly when the steam condensates in the wetwell.
Figure 7-13 Pressure trend for all the volumes for C0-D0-W0-Vessel model and double end pipe break 600 mm diameter and Kexit coefficient = 4

37
Figure 7-14 shoes the pressure trend in the cap, at the begging pressure increases
quite fast to about 420 kPa and the starts oscillating increasing slowly.
Figure 7-14 Pressure trend for the cap for C0-D0-W0-Vessel model and double end pipe break 600 mm diameter and Kexit coefficient = 4
Figure 7-15 shows the activation time for the 361/362 systems, in that case both
systems will never be activated.
Figure 7-15 Activation time for C0-D0-W0-Vessel model and double end pipe break 600 mm diameter and Kexit coefficient = 4

38
Figure 7-16 shows the steam mass flow coming from the vessel, we can assume
having Kexit supplies to the model an accurate value for the steam mass flow, taking
into account we have a large LOCA in the main steam line.
Figure 7-16 Steam flow coming from the vessel for C0-D0-W0-Vessel model and double end pipe break 600 mm diameter and Kexit coefficient = 4
Figure 7-17 shows the steam mass flow pushed down to the wetwell.
Figure 7-17 Steam flow going to the wetwell for C0-D0-W0-Vessel model and double end pipe break 600 mm diameter and Kexit coefficient = 4
39
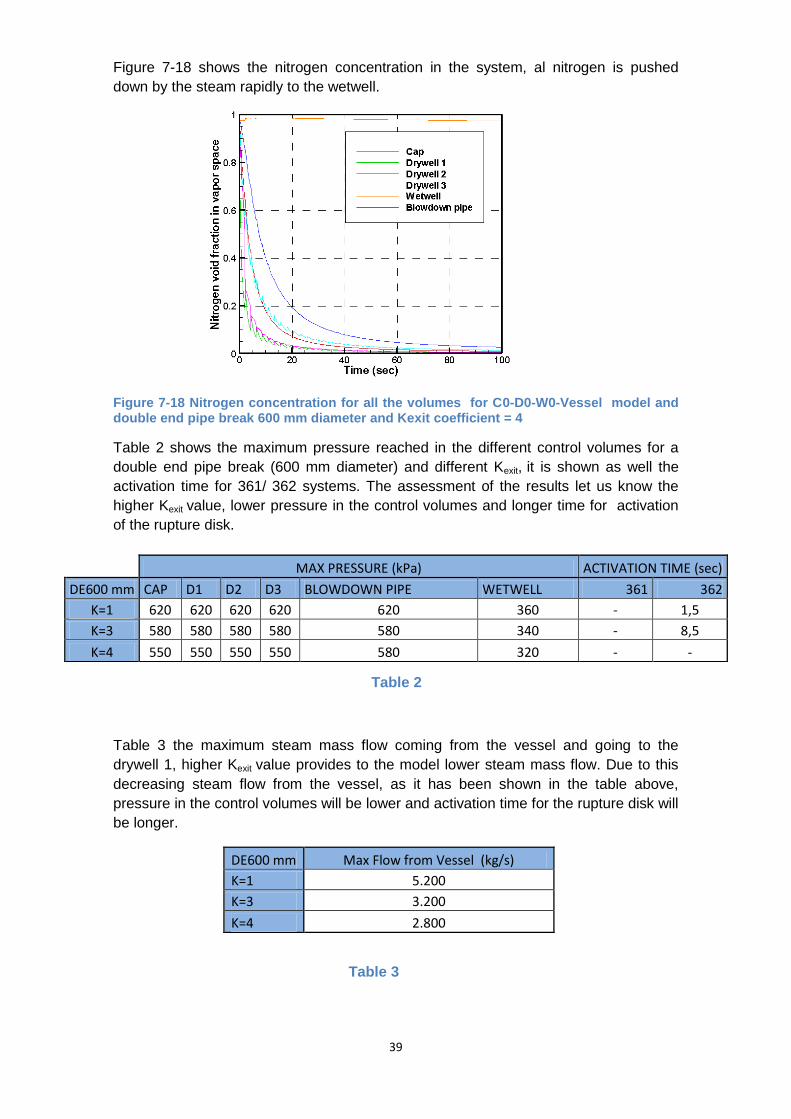
Figure 7-18 shows the nitrogen concentration in the system, al nitrogen is pushed
down by the steam rapidly to the wetwell.
Figure 7-18 Nitrogen concentration for all the volumes for C0-D0-W0-Vessel model and double end pipe break 600 mm diameter and Kexit coefficient = 4
Table 2 shows the maximum pressure reached in the different control volumes for a
double end pipe break (600 mm diameter) and different Kexit, it is shown as well the
activation time for 361/ 362 systems. The assessment of the results let us know the
higher Kexit value, lower pressure in the control volumes and longer time for activation
of the rupture disk.
Table 3 the maximum steam mass flow coming from the vessel and going to the
drywell 1, higher Kexit value provides to the model lower steam mass flow. Due to this
decreasing steam flow from the vessel, as it has been shown in the table above,
pressure in the control volumes will be lower and activation time for the rupture disk will
be longer.
DE600 mm Max Flow from Vessel (kg/s)
K=1 5.200
K=3 3.200
K=4 2.800
Table 3
MAX PRESSURE (kPa) ACTIVATION TIME (sec)
DE600 mm CAP D1 D2 D3 BLOWDOWN PIPE WETWELL 361 362
K=1 620 620 620 620 620 360 - 1,5
K=3 580 580 580 580 580 340 - 8,5
K=4 550 550 550 550 580 320 - -
Table 2

40
Table 4 show the maximum steam mass flow going to the wetwell. According to the
flow coming from the vessel when higher is the Kexit value lower is the steam flow to the
wetwell.
DE600 mm MAX FLOW TO WETWELL (kg/s)
K=1 120.000
K=3 102.000
K=4 100.000
Table 4
41
8 Appendix B. C3D-D3D-W0-Vessel simulation results
8.1.1 C3D-D3D-W0-Vessel simulation results
In this chapter key results for all the different Kexit values will be shown, taking into
account Kexit=1,2,3. Due to the main target of this thesis work is the investigation of
conditions for activation of the rupture disk, and rupture disk gets activated due to the
pressure in the cap, pressure trend in the cap and activation time of 361 and 362
systems will be shown in the following figures, besides three tables summarize the
maximum values reached in the control volumes for all the transient time (10 sec).
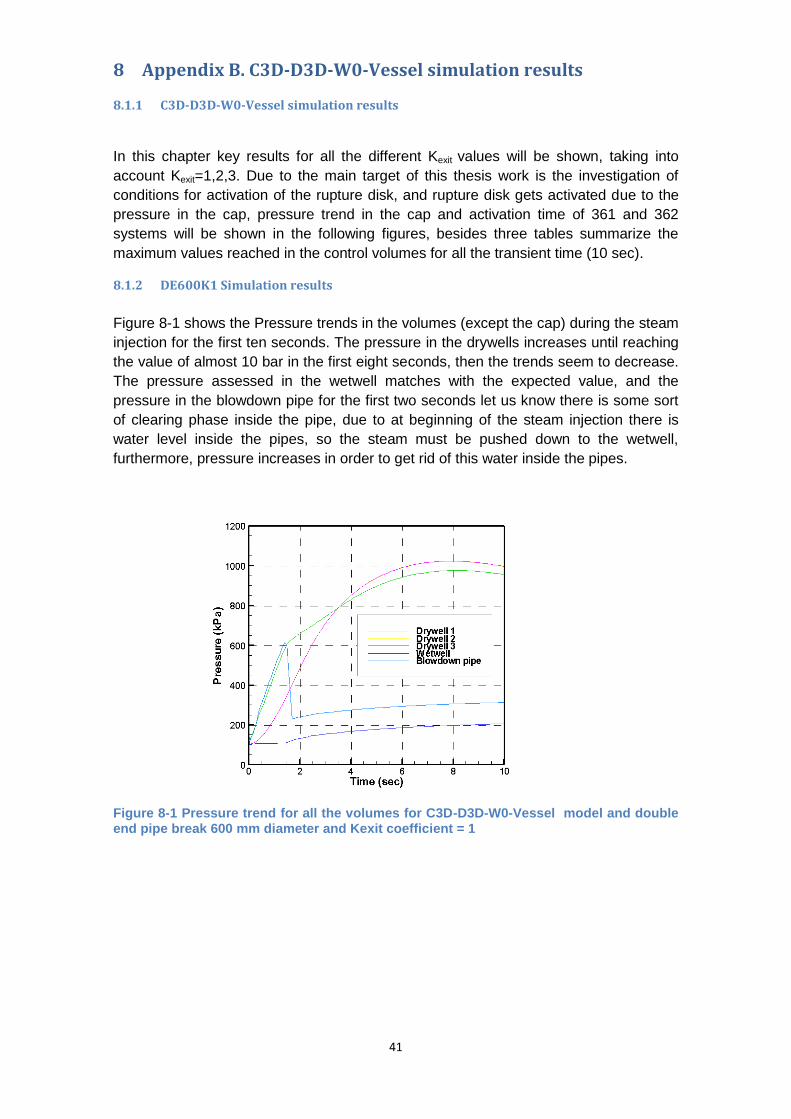
8.1.2 DE600K1 Simulation results
Figure 8-1 shows the Pressure trends in the volumes (except the cap) during the steam
injection for the first ten seconds. The pressure in the drywells increases until reaching
the value of almost 10 bar in the first eight seconds, then the trends seem to decrease.
The pressure assessed in the wetwell matches with the expected value, and the
pressure in the blowdown pipe for the first two seconds let us know there is some sort
of clearing phase inside the pipe, due to at beginning of the steam injection there is
water level inside the pipes, so the steam must be pushed down to the wetwell,
furthermore, pressure increases in order to get rid of this water inside the pipes.
Figure 8-1 Pressure trend for all the volumes for C3D-D3D-W0-Vessel model and double end pipe break 600 mm diameter and Kexit coefficient = 1
42
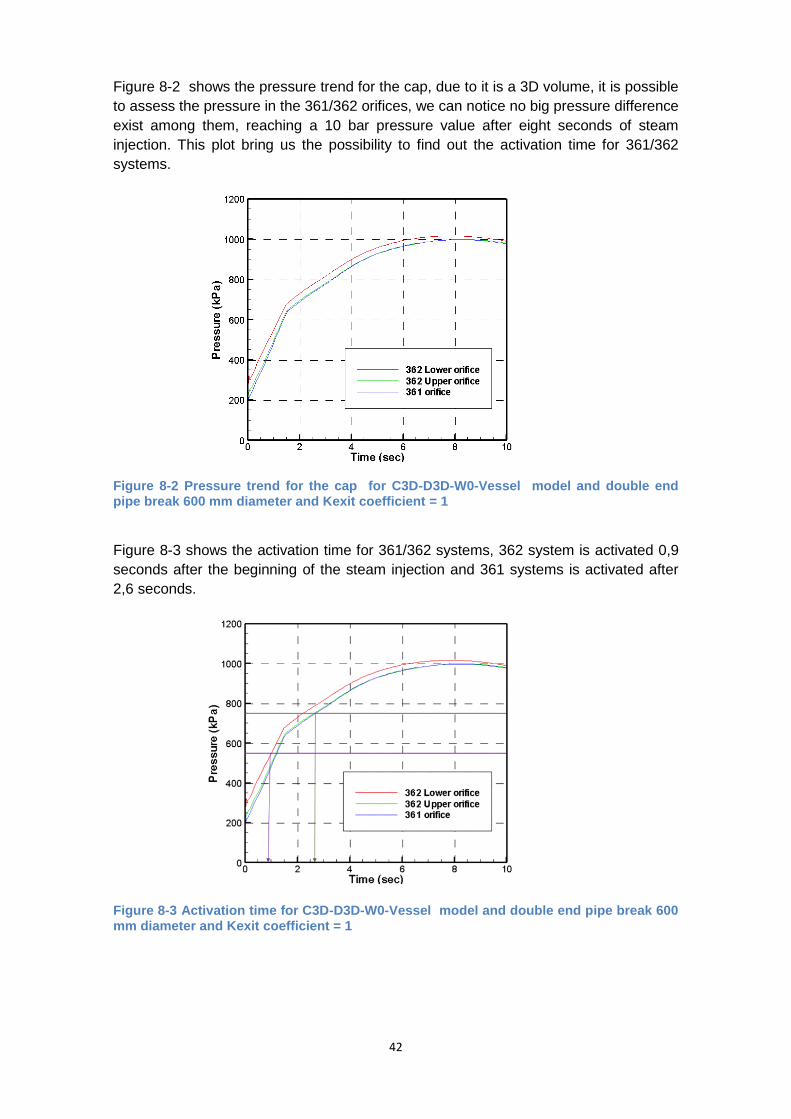
Figure 8-2 shows the pressure trend for the cap, due to it is a 3D volume, it is possible
to assess the pressure in the 361/362 orifices, we can notice no big pressure difference
exist among them, reaching a 10 bar pressure value after eight seconds of steam
injection. This plot bring us the possibility to find out the activation time for 361/362
systems.
Figure 8-2 Pressure trend for the cap for C3D-D3D-W0-Vessel model and double end pipe break 600 mm diameter and Kexit coefficient = 1
Figure 8-3 shows the activation time for 361/362 systems, 362 system is activated 0,9
seconds after the beginning of the steam injection and 361 systems is activated after
2,6 seconds.
Figure 8-3 Activation time for C3D-D3D-W0-Vessel model and double end pipe break 600 mm diameter and Kexit coefficient = 1
43
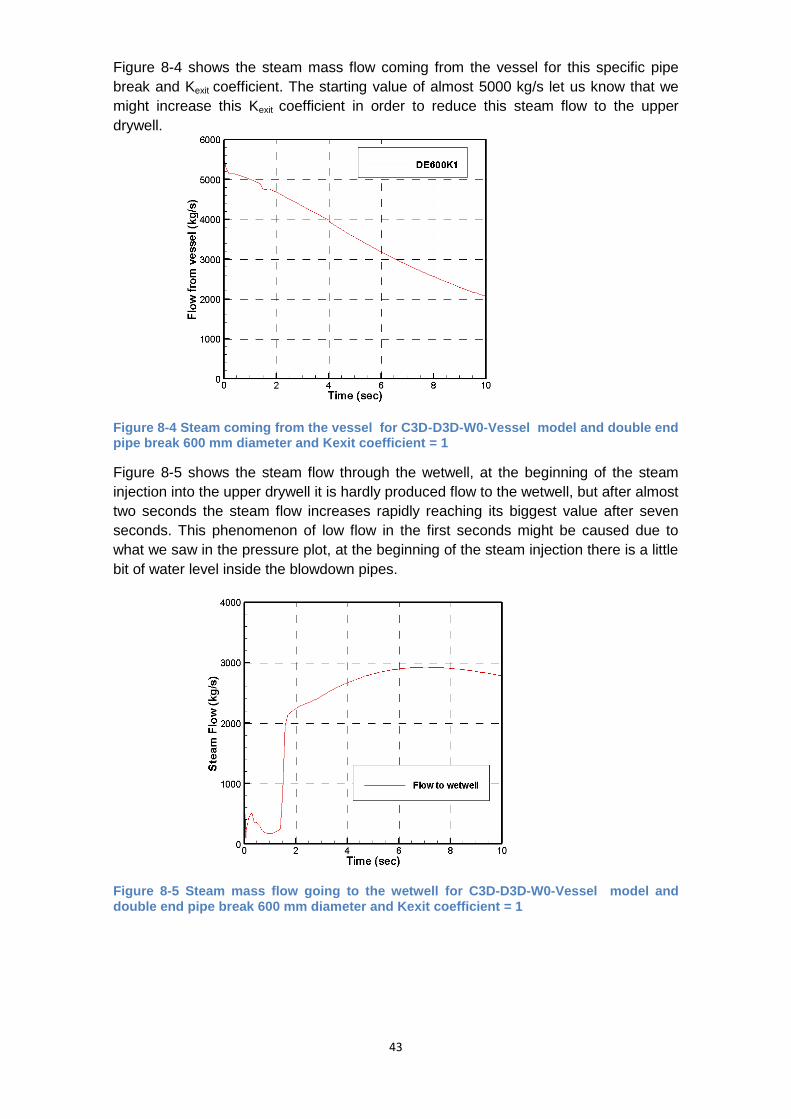
Figure 8-4 shows the steam mass flow coming from the vessel for this specific pipe
break and Kexit coefficient. The starting value of almost 5000 kg/s let us know that we
might increase this Kexit coefficient in order to reduce this steam flow to the upper
drywell.
Figure 8-4 Steam coming from the vessel for C3D-D3D-W0-Vessel model and double end pipe break 600 mm diameter and Kexit coefficient = 1
Figure 8-5 shows the steam flow through the wetwell, at the beginning of the steam
injection into the upper drywell it is hardly produced flow to the wetwell, but after almost
two seconds the steam flow increases rapidly reaching its biggest value after seven
seconds. This phenomenon of low flow in the first seconds might be caused due to
what we saw in the pressure plot, at the beginning of the steam injection there is a little
bit of water level inside the blowdown pipes.
Figure 8-5 Steam mass flow going to the wetwell for C3D-D3D-W0-Vessel model and double end pipe break 600 mm diameter and Kexit coefficient = 1

44
Figures below show the pressure distribution in the cap with XY plane in the center.
The steam injection is produced in the upper drywell, then this steam is pushed up to
the cap from the bottom of itself to the top part of the cap where the nitrogen and steam
is compressed, due to this the pressure increases as long as the high of the cap
increases as well, although the pressure difference is not very big. For every time
capture there are three different planes, each one correspond to each system 361/362
elevation. The pressures in the plots are in kPa.
Figure 8-6 Layout plane position for pressure distribution for C3D-D3D-W0-Vessel model in the cap for double end pipe break 600 mm diameter and Kexit=1

45
Figure 8-7 Pressure distribution for XY plane for model C3D-D3D-W0-Vessel double end break pipe 600 mm diameter with Kexit= 1 and t=0.01 sec
Figure 8-8 Pressure distribution for XY plane for model C3D-D3D-W0-Vessel double end break pipe 600 mm diameter with Kexit= 1 and t=0.05 sec
Figure 8-9 Pressure distribution for XY plane for model C3D-D3D-W0-Vessel double end break pipe 600 mm diameter with Kexit= 1 and t=0.5 sec

46
Figure 8-10 Pressure distribution for XY plane for model C3D-D3D-W0-Vessel double end break pipe 600 mm diameter with Kexit= 1 and t=1 sec
Figure 8-11 Pressure distribution for XY plane for model C3D-D3D-W0-Vessel double end break pipe 600 mm diameter with Kexit= 1 and t=5 sec
Figure 8-12 Pressure distribution for XY plane for model C3D-D3D-W0-Vessel double end break pipe 600 mm diameter with Kexit= 1 and t=10 sec
47
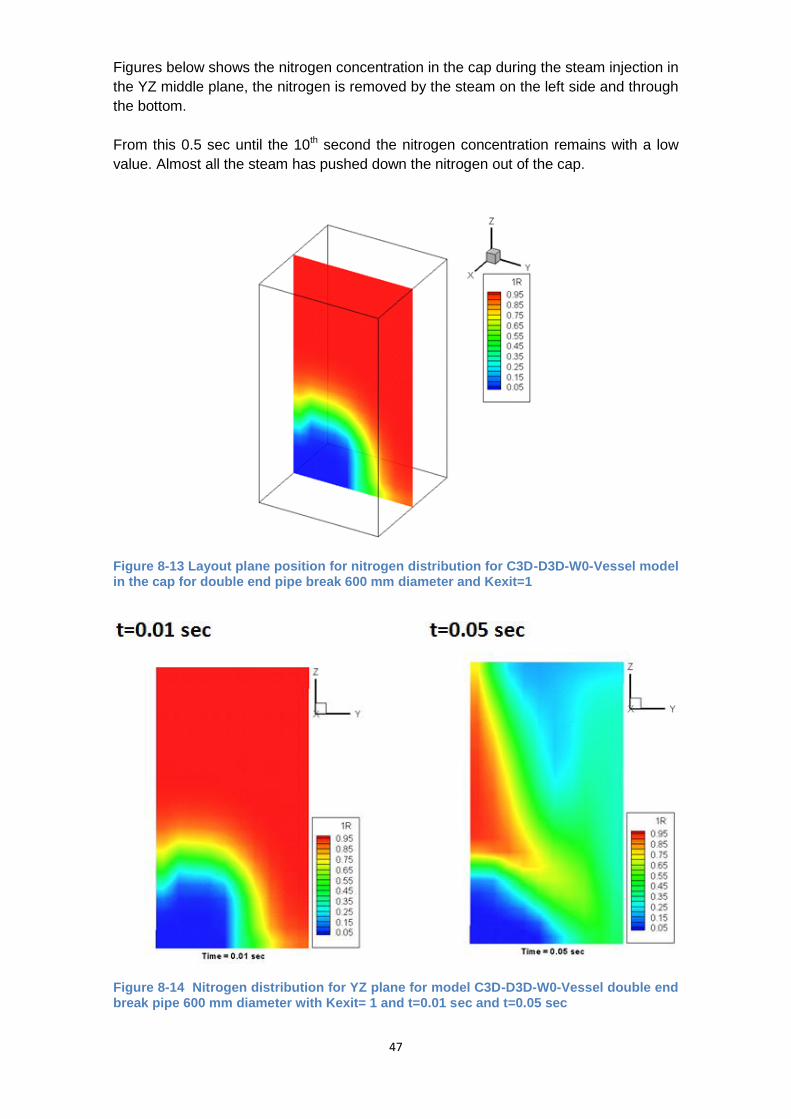
Figures below shows the nitrogen concentration in the cap during the steam injection in
the YZ middle plane, the nitrogen is removed by the steam on the left side and through
the bottom.
From this 0.5 sec until the 10th second the nitrogen concentration remains with a low
value. Almost all the steam has pushed down the nitrogen out of the cap.
Figure 8-13 Layout plane position for nitrogen distribution for C3D-D3D-W0-Vessel model in the cap for double end pipe break 600 mm diameter and Kexit=1
Figure 8-14 Nitrogen distribution for YZ plane for model C3D-D3D-W0-Vessel double end break pipe 600 mm diameter with Kexit= 1 and t=0.01 sec and t=0.05 sec

48
Figure 8-15 Nitrogen distribution for YZ plane for model C3D-D3D-W0-Vessel double end break pipe 600 mm diameter with Kexit= 1 and t=0.5 sec
49
8.1.3 DE600K3 Simulation results
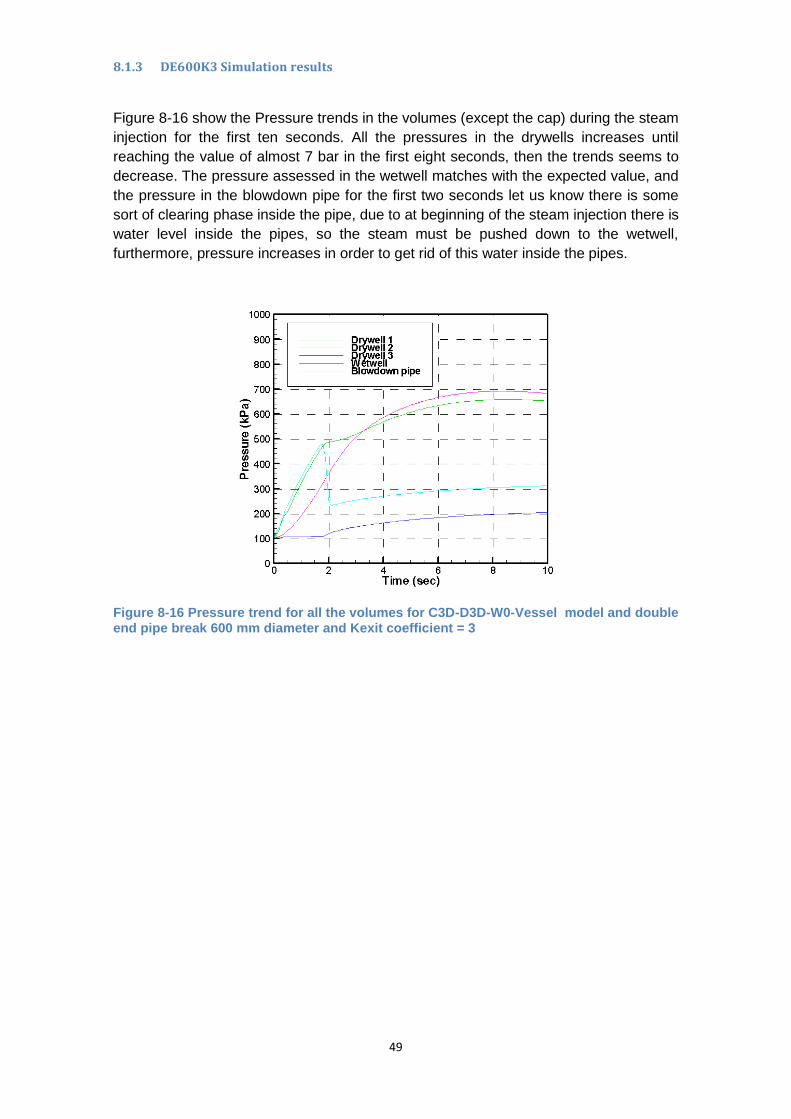
Figure 8-16 show the Pressure trends in the volumes (except the cap) during the steam
injection for the first ten seconds. All the pressures in the drywells increases until
reaching the value of almost 7 bar in the first eight seconds, then the trends seems to
decrease. The pressure assessed in the wetwell matches with the expected value, and
the pressure in the blowdown pipe for the first two seconds let us know there is some
sort of clearing phase inside the pipe, due to at beginning of the steam injection there is
water level inside the pipes, so the steam must be pushed down to the wetwell,
furthermore, pressure increases in order to get rid of this water inside the pipes.
Figure 8-16 Pressure trend for all the volumes for C3D-D3D-W0-Vessel model and double end pipe break 600 mm diameter and Kexit coefficient = 3
50
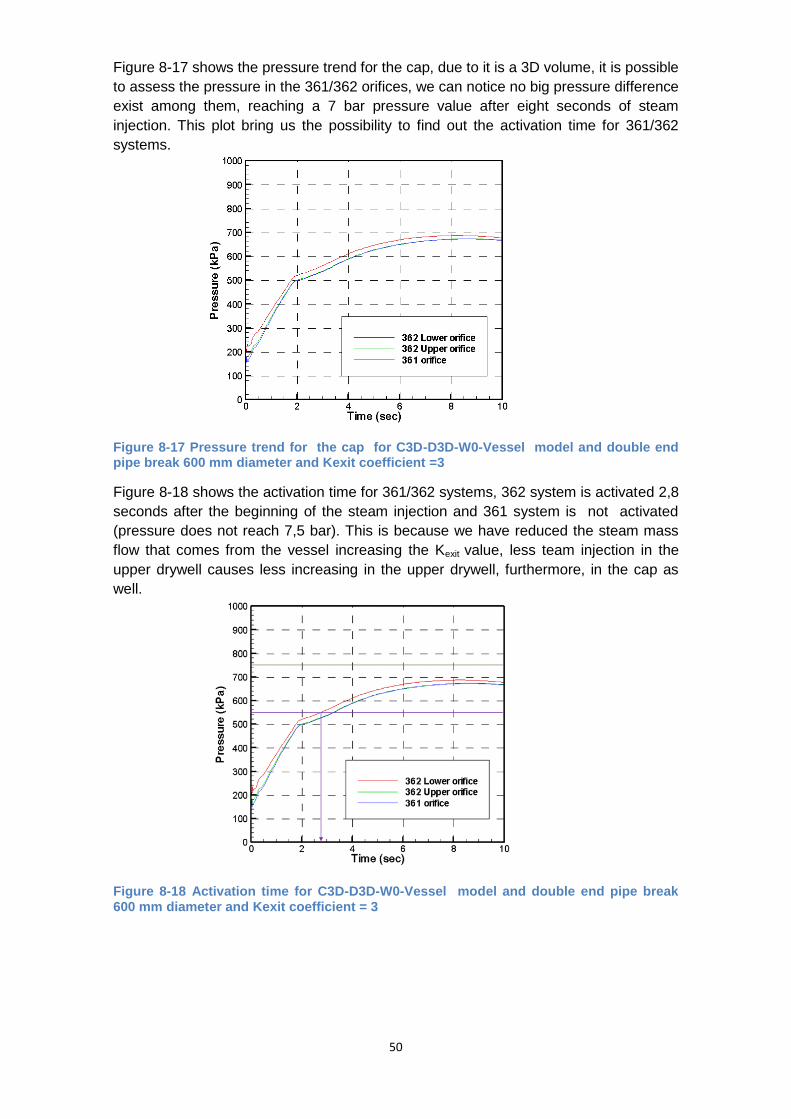
Figure 8-17 shows the pressure trend for the cap, due to it is a 3D volume, it is possible
to assess the pressure in the 361/362 orifices, we can notice no big pressure difference
exist among them, reaching a 7 bar pressure value after eight seconds of steam
injection. This plot bring us the possibility to find out the activation time for 361/362
systems.
Figure 8-17 Pressure trend for the cap for C3D-D3D-W0-Vessel model and double end pipe break 600 mm diameter and Kexit coefficient =3
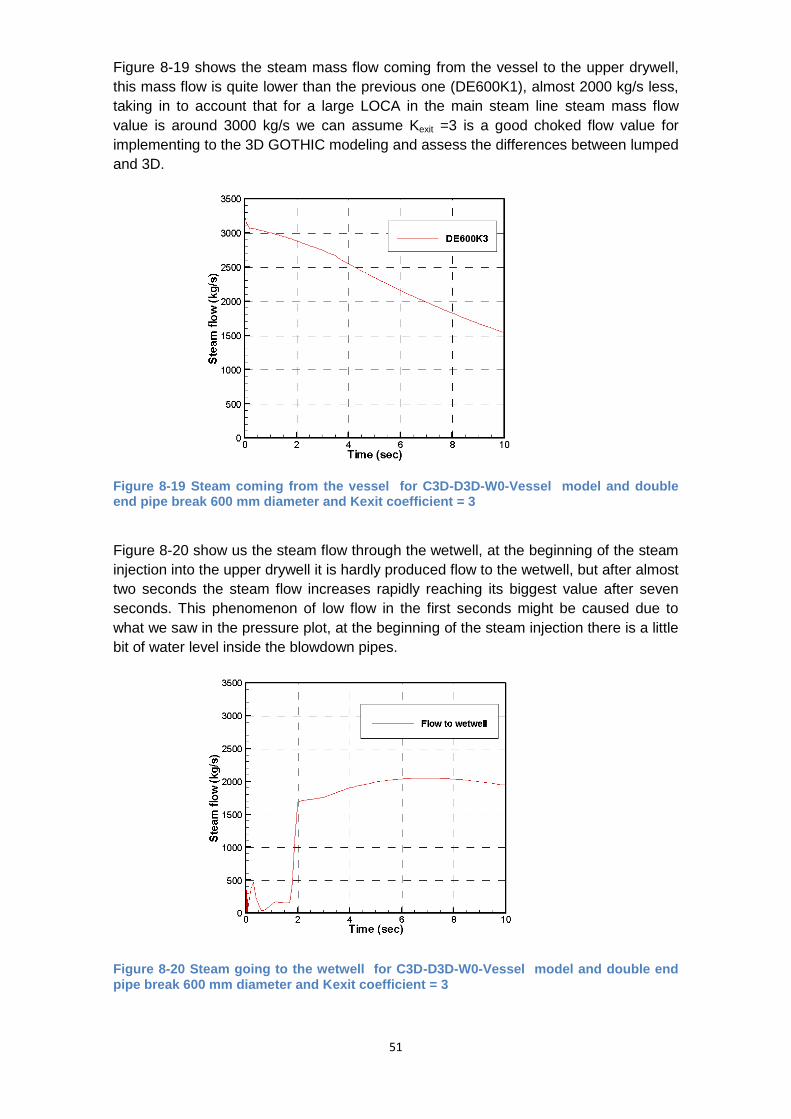
Figure 8-18 shows the activation time for 361/362 systems, 362 system is activated 2,8
seconds after the beginning of the steam injection and 361 system is not activated
(pressure does not reach 7,5 bar). This is because we have reduced the steam mass
flow that comes from the vessel increasing the Kexit value, less team injection in the
upper drywell causes less increasing in the upper drywell, furthermore, in the cap as
well.
Figure 8-18 Activation time for C3D-D3D-W0-Vessel model and double end pipe break 600 mm diameter and Kexit coefficient = 3
51
Figure 8-19 shows the steam mass flow coming from the vessel to the upper drywell,
this mass flow is quite lower than the previous one (DE600K1), almost 2000 kg/s less,
taking in to account that for a large LOCA in the main steam line steam mass flow
value is around 3000 kg/s we can assume Kexit =3 is a good choked flow value for
implementing to the 3D GOTHIC modeling and assess the differences between lumped
and 3D.
Figure 8-19 Steam coming from the vessel for C3D-D3D-W0-Vessel model and double end pipe break 600 mm diameter and Kexit coefficient = 3
Figure 8-20 show us the steam flow through the wetwell, at the beginning of the steam
injection into the upper drywell it is hardly produced flow to the wetwell, but after almost
two seconds the steam flow increases rapidly reaching its biggest value after seven
seconds. This phenomenon of low flow in the first seconds might be caused due to
what we saw in the pressure plot, at the beginning of the steam injection there is a little
bit of water level inside the blowdown pipes.
Figure 8-20 Steam going to the wetwell for C3D-D3D-W0-Vessel model and double end pipe break 600 mm diameter and Kexit coefficient = 3

52
Figure 8-21 shows the nitrogen concentration for all the volumes in the containment.
For the first two seconds there is an important decreasing of nitrogen in the volumes,
this nitrogen is pushed down to the wetwell in which this nitrogen concentration
increases slightly.
Figure 8-21 Nitrogen concentration for all the volumes for C3D-D3D-W0-Vessel model and double end pipe break 600 mm diameter and Kexit coefficient = 3
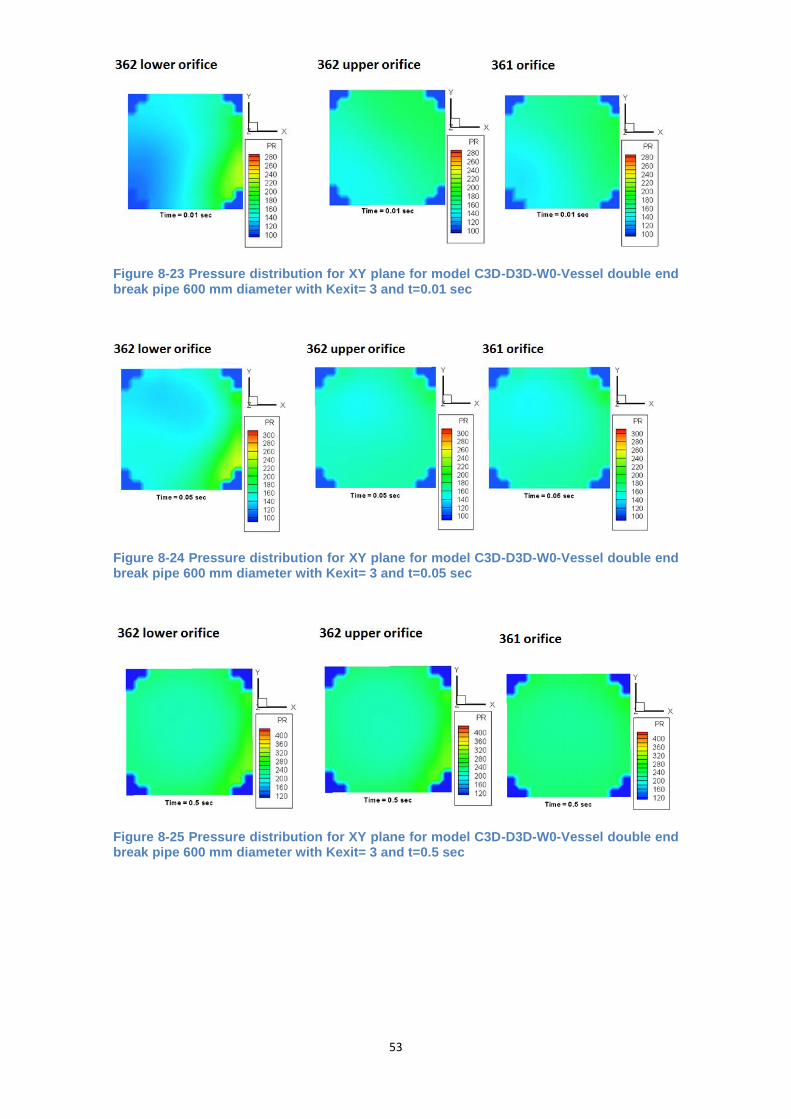
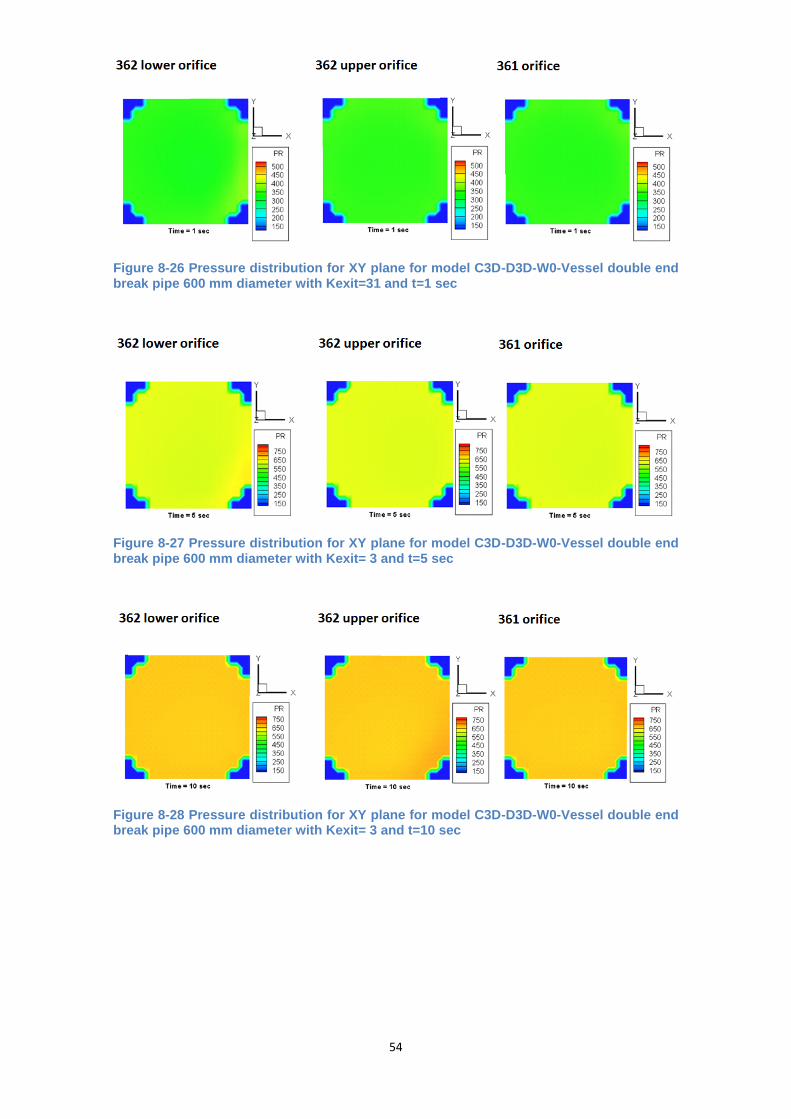
Figures below show the pressure distribution in the cap with XY plane in the center.
The steam injection is produced in the upper drywell, then this steam is pushed up to
the cap from the bottom of itself to the top part of the cap where the nitrogen and steam
is compressed, due to this the pressure increases as long as the high of the cap
increases as well, although the pressure difference is not very big. For every time
capture there are three different planes, each one correspond to each system 361/362
elevation. Pressures in the plots are in kPa.
Figure 8-22 Layout plane position for pressure distribution for C3D-D3D-W0-Vessel model in the cap for double end pipe break 600 mm diameter and Kexit=3
53
Figure 8-23 Pressure distribution for XY plane for model C3D-D3D-W0-Vessel double end break pipe 600 mm diameter with Kexit= 3 and t=0.01 sec
Figure 8-24 Pressure distribution for XY plane for model C3D-D3D-W0-Vessel double end break pipe 600 mm diameter with Kexit= 3 and t=0.05 sec
Figure 8-25 Pressure distribution for XY plane for model C3D-D3D-W0-Vessel double end break pipe 600 mm diameter with Kexit= 3 and t=0.5 sec
54
Figure 8-26 Pressure distribution for XY plane for model C3D-D3D-W0-Vessel double end break pipe 600 mm diameter with Kexit=31 and t=1 sec
Figure 8-27 Pressure distribution for XY plane for model C3D-D3D-W0-Vessel double end break pipe 600 mm diameter with Kexit= 3 and t=5 sec
Figure 8-28 Pressure distribution for XY plane for model C3D-D3D-W0-Vessel double end break pipe 600 mm diameter with Kexit= 3 and t=10 sec
55
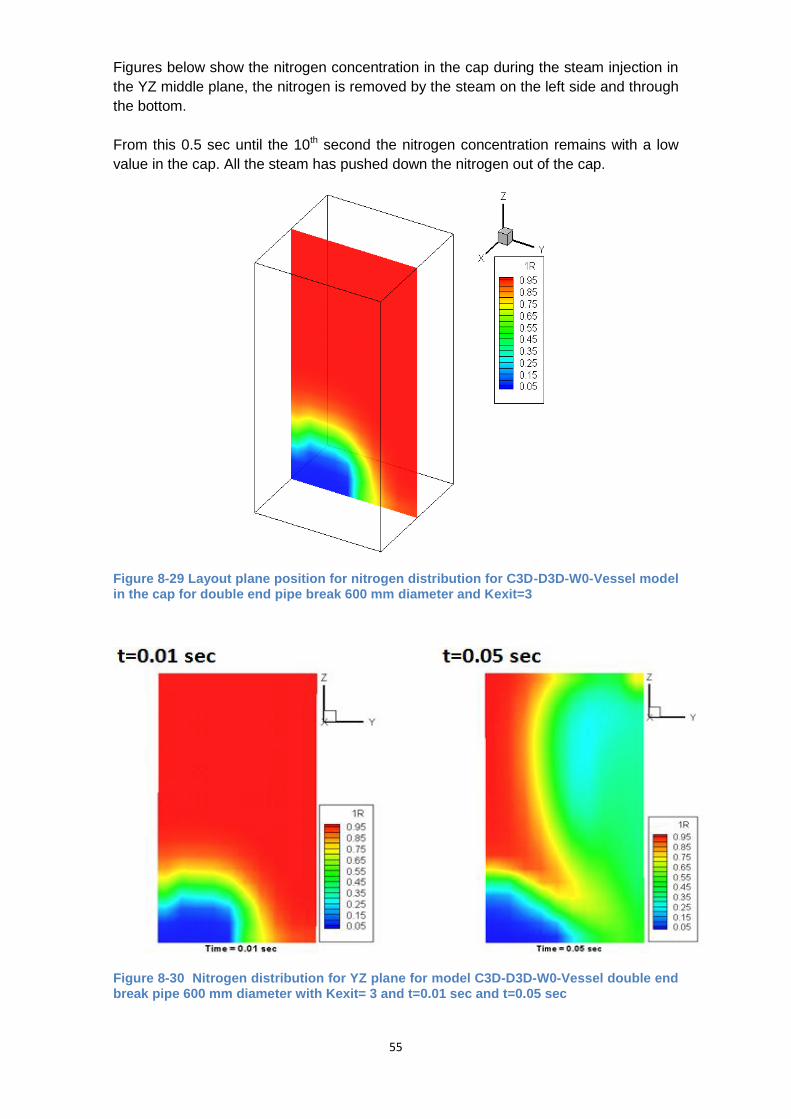
Figures below show the nitrogen concentration in the cap during the steam injection in
the YZ middle plane, the nitrogen is removed by the steam on the left side and through
the bottom.
From this 0.5 sec until the 10th second the nitrogen concentration remains with a low
value in the cap. All the steam has pushed down the nitrogen out of the cap.
Figure 8-29 Layout plane position for nitrogen distribution for C3D-D3D-W0-Vessel model in the cap for double end pipe break 600 mm diameter and Kexit=3
Figure 8-30 Nitrogen distribution for YZ plane for model C3D-D3D-W0-Vessel double end break pipe 600 mm diameter with Kexit= 3 and t=0.01 sec and t=0.05 sec

56
Figure 8-31 Nitrogen distribution for YZ plane for model C3D-D3D-W0-Vessel double end break pipe 600 mm diameter with Kexit= 3 and t=0.5 sec

57
Figures below show the evolution of nitrogen concentration in the upper drywell. For
the first 0.05 seconds the distribution of the concentration of nitrogen is quite
homogeneous, but when the steam is fulfilling the upper drywell, due to the position of
the pipes that connects this upper drywell with the other drywells located in the
containment this distribution is no longer homogeneous. For future studies and in order
to go further with this nuclear safety analysis, I suggest realizing a more detailed
distribution of the pipes located in the upper drywell, so the model will be more close to
the reality.
Figure 8-32 Nitrogen distribution for the drywell 1 C3D-D3D-WO-Vessel model double end pipe break 600 mm diameter Kexit=3 t=0.01 sec ; t=0.05 sec ; t=0.5 sec and t= 1sec
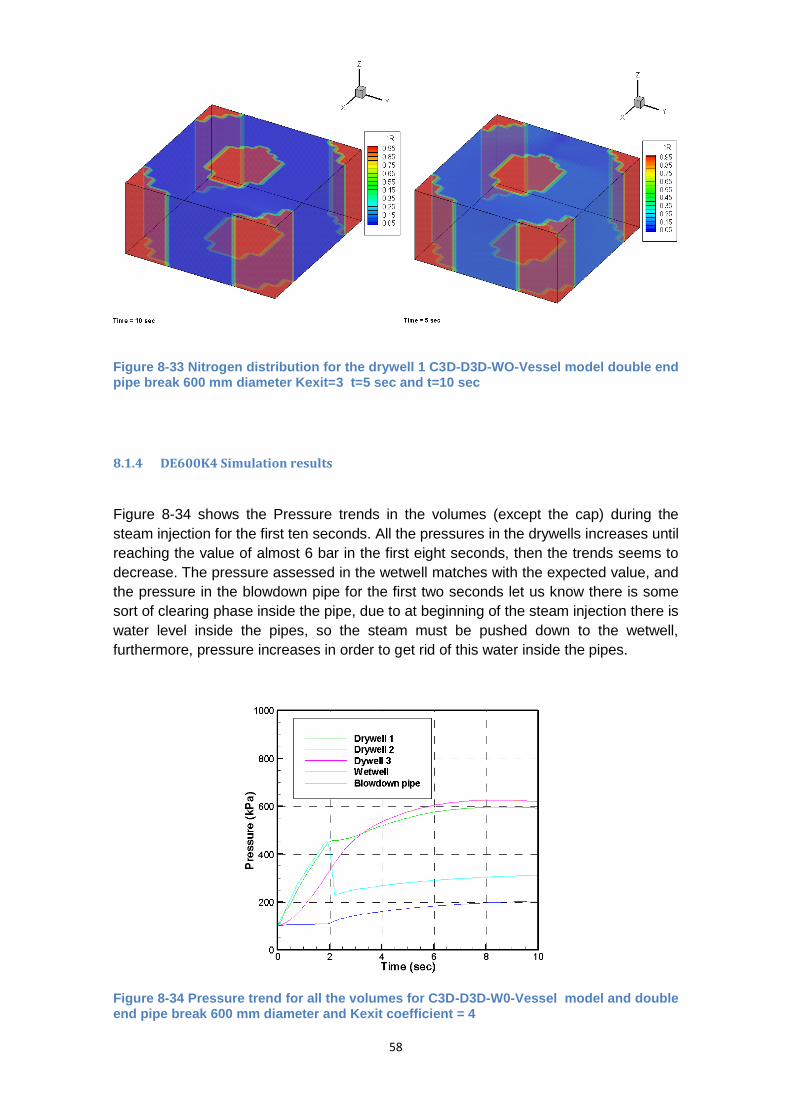
58
Figure 8-33 Nitrogen distribution for the drywell 1 C3D-D3D-WO-Vessel model double end pipe break 600 mm diameter Kexit=3 t=5 sec and t=10 sec
8.1.4 DE600K4 Simulation results
Figure 8-34 shows the Pressure trends in the volumes (except the cap) during the
steam injection for the first ten seconds. All the pressures in the drywells increases until
reaching the value of almost 6 bar in the first eight seconds, then the trends seems to
decrease. The pressure assessed in the wetwell matches with the expected value, and
the pressure in the blowdown pipe for the first two seconds let us know there is some
sort of clearing phase inside the pipe, due to at beginning of the steam injection there is
water level inside the pipes, so the steam must be pushed down to the wetwell,
furthermore, pressure increases in order to get rid of this water inside the pipes.
Figure 8-34 Pressure trend for all the volumes for C3D-D3D-W0-Vessel model and double end pipe break 600 mm diameter and Kexit coefficient = 4
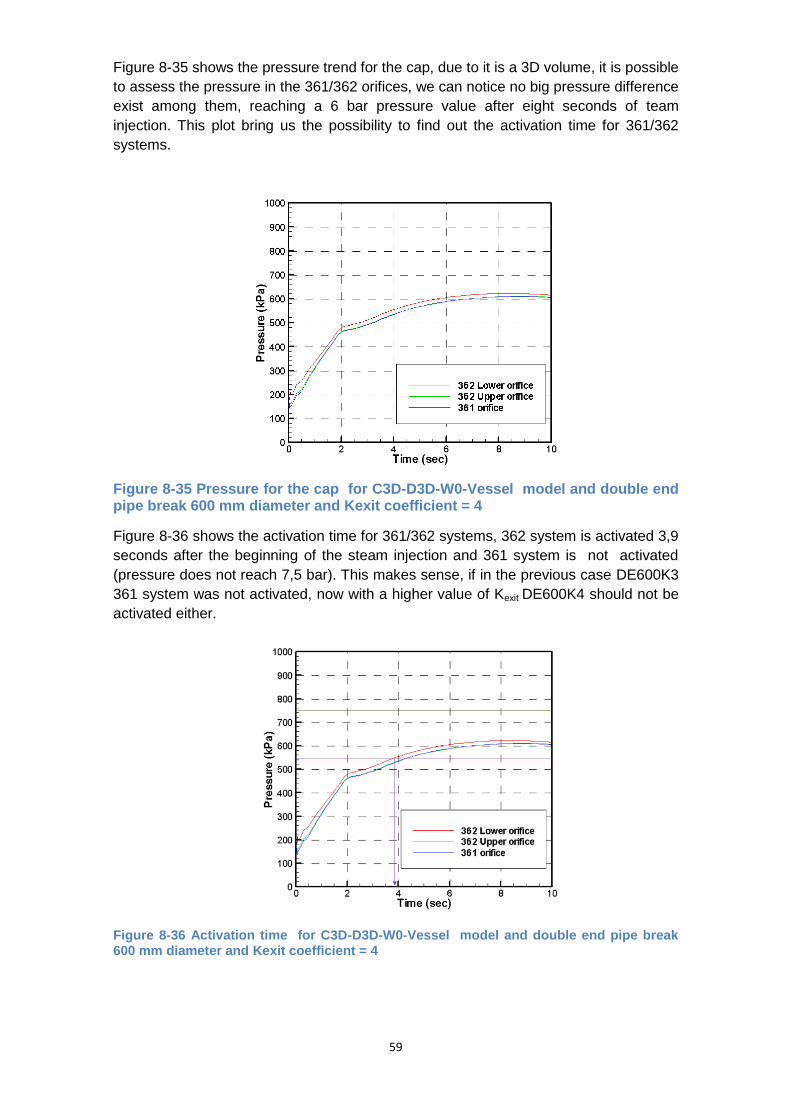
59
Figure 8-35 shows the pressure trend for the cap, due to it is a 3D volume, it is possible
to assess the pressure in the 361/362 orifices, we can notice no big pressure difference
exist among them, reaching a 6 bar pressure value after eight seconds of team
injection. This plot bring us the possibility to find out the activation time for 361/362
systems.
Figure 8-35 Pressure for the cap for C3D-D3D-W0-Vessel model and double end pipe break 600 mm diameter and Kexit coefficient = 4
Figure 8-36 shows the activation time for 361/362 systems, 362 system is activated 3,9
seconds after the beginning of the steam injection and 361 system is not activated
(pressure does not reach 7,5 bar). This makes sense, if in the previous case DE600K3
361 system was not activated, now with a higher value of Kexit DE600K4 should not be
activated either.
Figure 8-36 Activation time for C3D-D3D-W0-Vessel model and double end pipe break 600 mm diameter and Kexit coefficient = 4

60
Figure 8-37 shows the steam mass flow coming from the vessel to the upper drywell,
this mass flow is a little bit lower than the previous one (DE600K3).
Figure 8-37 Steam flow coming from the vessel C3D-D3D-W0-Vessel model and double end pipe break 600 mm diameter and Kexit coefficient = 4
Figure 8-38 shows the steam flow through the wetwell, at the beginning of the steam
injection into the upper drywell it is hardly produced flow to the wetwell, but after almost
two seconds the steam flow increases rapidly reaching its biggest value after seven
seconds. This phenomenon of low flow in the first seconds might be caused due to
what we saw in the pressure plot, at the beginning of the steam injection there is a little
bit of water level inside the blowdown pipes.
Figure 8-38 Steam flow going to the wetwell for C3D-D3D-W0-Vessel model and double
end pipe break 600 mm diameter and Kexit coefficient = 4
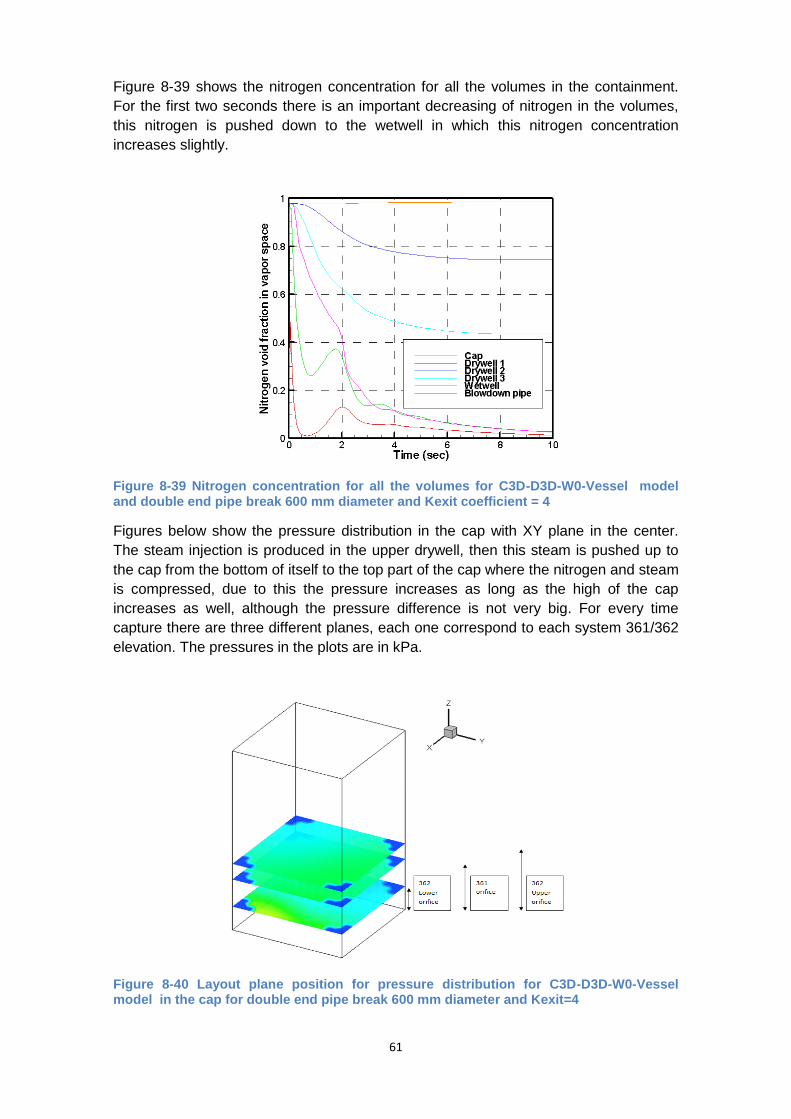
61
Figure 8-39 shows the nitrogen concentration for all the volumes in the containment.
For the first two seconds there is an important decreasing of nitrogen in the volumes,
this nitrogen is pushed down to the wetwell in which this nitrogen concentration
increases slightly.
Figure 8-39 Nitrogen concentration for all the volumes for C3D-D3D-W0-Vessel model and double end pipe break 600 mm diameter and Kexit coefficient = 4
Figures below show the pressure distribution in the cap with XY plane in the center.
The steam injection is produced in the upper drywell, then this steam is pushed up to
the cap from the bottom of itself to the top part of the cap where the nitrogen and steam
is compressed, due to this the pressure increases as long as the high of the cap
increases as well, although the pressure difference is not very big. For every time
capture there are three different planes, each one correspond to each system 361/362
elevation. The pressures in the plots are in kPa.
Figure 8-40 Layout plane position for pressure distribution for C3D-D3D-W0-Vessel model in the cap for double end pipe break 600 mm diameter and Kexit=4

62
Figure 8-41 Pressure distribution for XY plane for model C3D-D3D-W0-Vessel double end break pipe 600 mm diameter with Kexit= 4 and t=0.01 sec
Figure 8-42 Pressure distribution for XY plane for model C3D-D3D-W0-Vessel double end break pipe 600 mm diameter with Kexit= 4 and t=0.05 sec
Figure 8-43 Pressure distribution for XY plane for model C3D-D3D-W0-Vessel double end break pipe 600 mm diameter with Kexit= 4 and t=0.5 sec
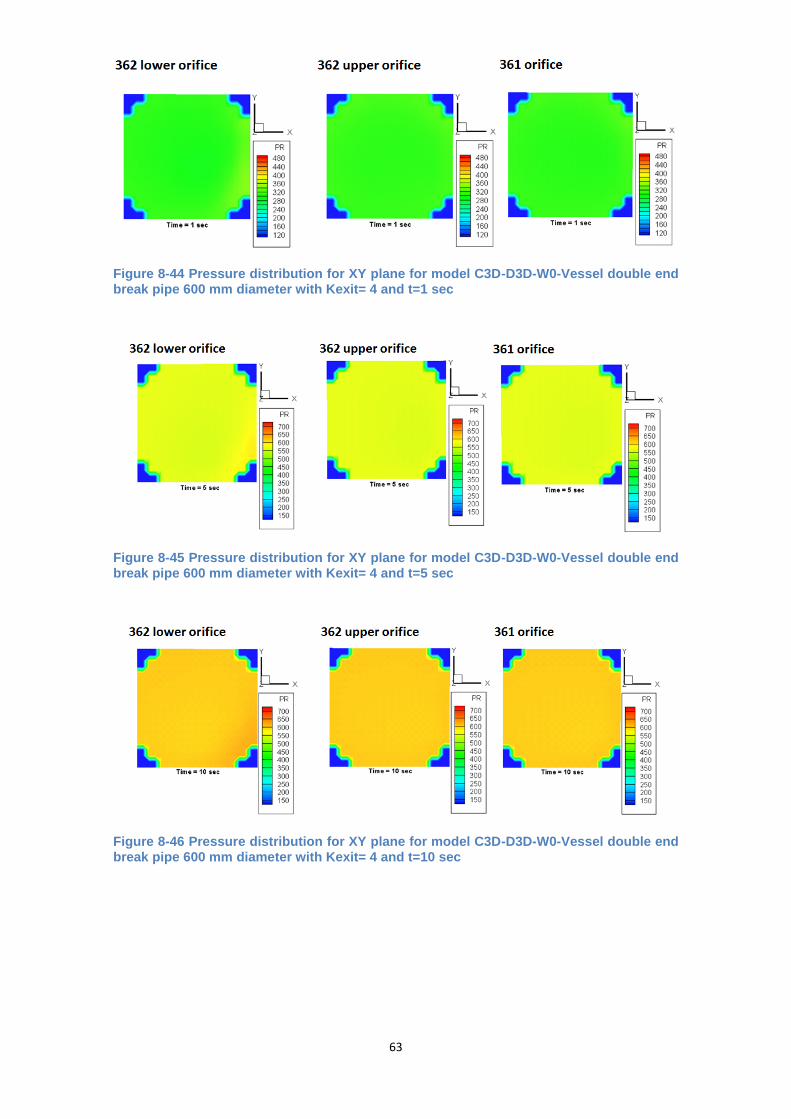
63
Figure 8-44 Pressure distribution for XY plane for model C3D-D3D-W0-Vessel double end break pipe 600 mm diameter with Kexit= 4 and t=1 sec
Figure 8-45 Pressure distribution for XY plane for model C3D-D3D-W0-Vessel double end break pipe 600 mm diameter with Kexit= 4 and t=5 sec
Figure 8-46 Pressure distribution for XY plane for model C3D-D3D-W0-Vessel double end break pipe 600 mm diameter with Kexit= 4 and t=10 sec

64
Figures below show the nitrogen concentration in the cap during the steam injection in
the YZ middle plane, the nitrogen is removed by the steam on the left side and through
the bottom.
From 0.5 sec until the 10th second the nitrogen concentration remains with a low value.
All the steam has pushed down the nitrogen out of the cap.
Figure 8-47 Layout plane position for nitrogen distribution for C3D-D3D-W0-Vessel model in the cap for double end pipe break 600 mm diameter and Kexit=4
Figure 8-48 Nitrogen distribution for YZ plane for model C3D-D3D-W0-Vessel double end break pipe 600 mm diameter with Kexit=4 and t=0.01 sec and t=0.05 sec

65
Figure 8-49 Nitrogen distribution for YZ plane for model C3D-D3D-W0-Vessel double end break pipe 600 mm diameter with Kexit=4 and t=0.5 sec
Table 5 shows the maximum pressure reached in the different control volumes for a
double end pipe break (600 mm diameter) and different Kexit; it is shown as well the
activation time for 361 and 362 systems. The assessment of the results let us know the
higher Kexit value, lower pressure in the control volumes and longer time for activation
of the rupture disk.
MAX PRESSURE (kPa) ACTIVATION TIME (sec)
DE600 mm CAP D1 D2 D3 BLOWDOWN PIPE WETWELL 361 362
K=1 1.010 960 960 1.010 605 200 2,6 0,9
K=3 690 660 660 690 480 200 - 2,8
K=4 625 600 600 625 450 200 - 3,9
Table 5
66
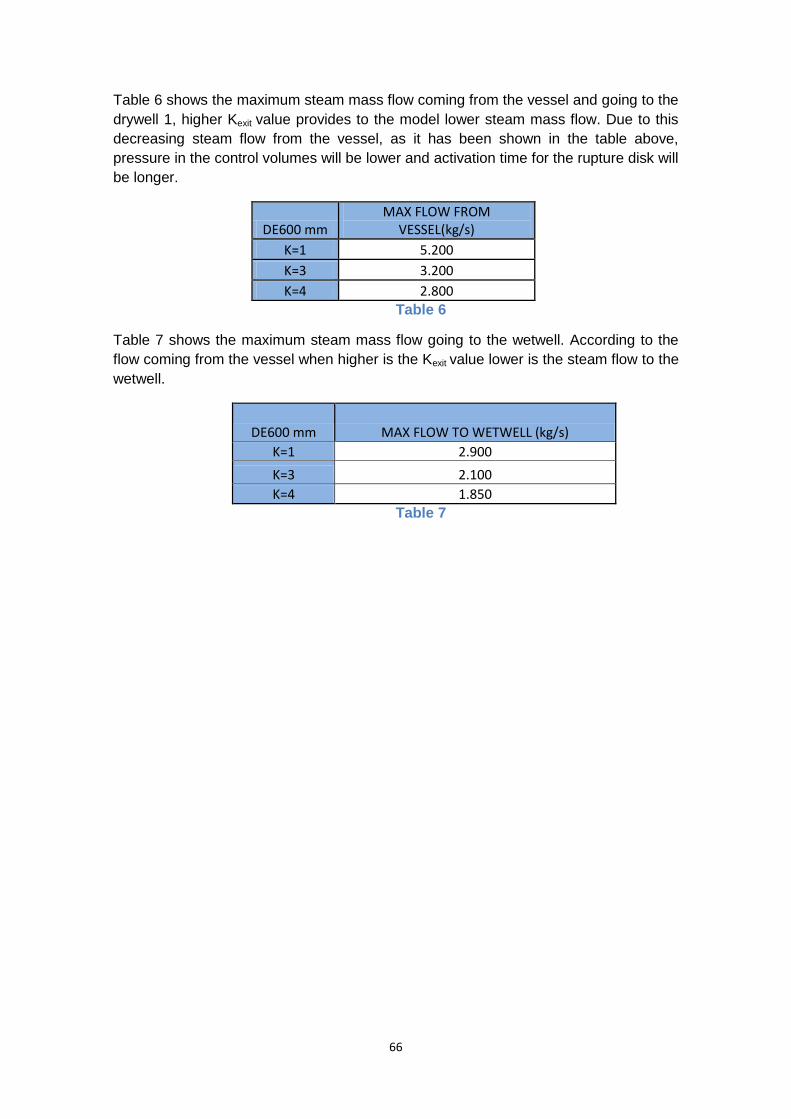
Table 6 shows the maximum steam mass flow coming from the vessel and going to the
drywell 1, higher Kexit value provides to the model lower steam mass flow. Due to this
decreasing steam flow from the vessel, as it has been shown in the table above,
pressure in the control volumes will be lower and activation time for the rupture disk will
be longer.
DE600 mm MAX FLOW FROM
VESSEL(kg/s)
K=1 5.200
K=3 3.200
K=4 2.800
Table 6
Table 7 shows the maximum steam mass flow going to the wetwell. According to the
flow coming from the vessel when higher is the Kexit value lower is the steam flow to the
wetwell.
DE600 mm MAX FLOW TO WETWELL (kg/s)
K=1 2.900
K=3 2.100
K=4 1.850
Table 7

67
9 Appendix C. C3D-D0-W0 GOTHIC model
This is the first modeling for the Forsmark 1 containment. This is the most simplified
version of the containment performed with GOTHIC, including 4 basic volumes. The
cap, which is a 3D volume, the upper drywell, the blowdown pipes which connects the
upper drywell with the wetwell, and the wetwell. All these volumes are considered
lumped volumes [2].
Figure 9-1 C3D-D0-W0 Sketch
68
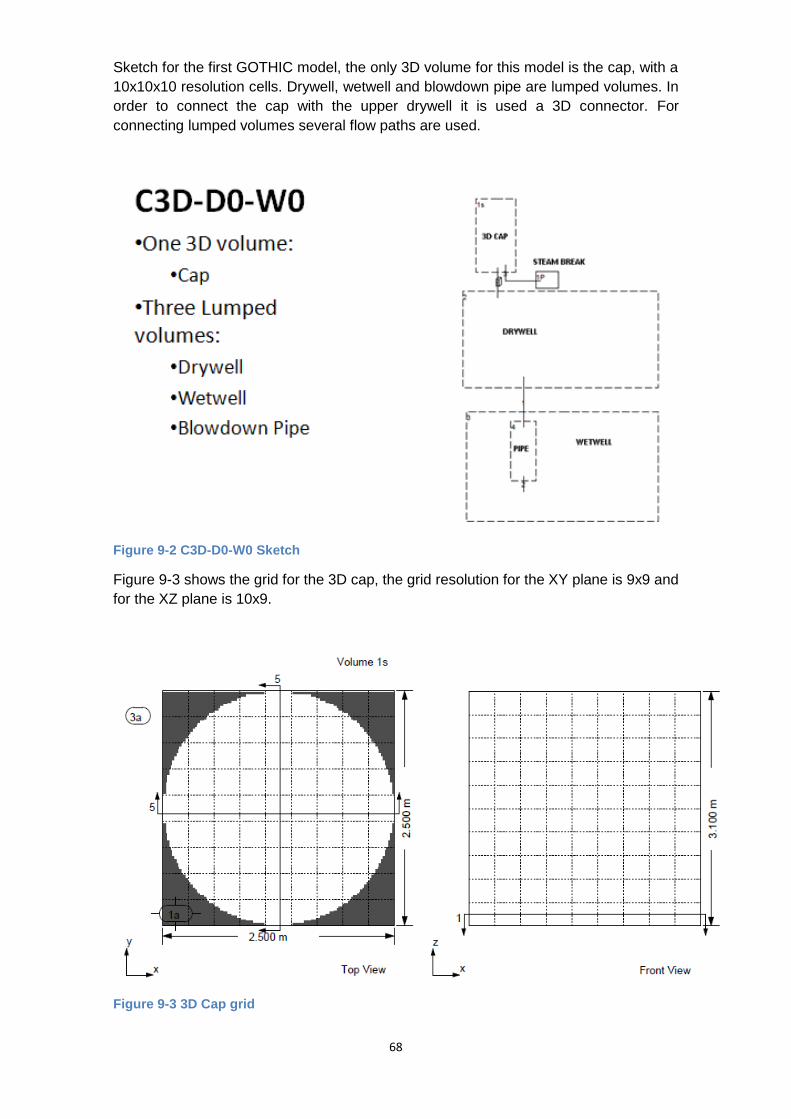
Sketch for the first GOTHIC model, the only 3D volume for this model is the cap, with a
10x10x10 resolution cells. Drywell, wetwell and blowdown pipe are lumped volumes. In
order to connect the cap with the upper drywell it is used a 3D connector. For
connecting lumped volumes several flow paths are used.
Figure 9-2 C3D-D0-W0 Sketch
Figure 9-3 shows the grid for the 3D cap, the grid resolution for the XY plane is 9x9 and
for the XZ plane is 10x9.
Figure 9-3 3D Cap grid
69
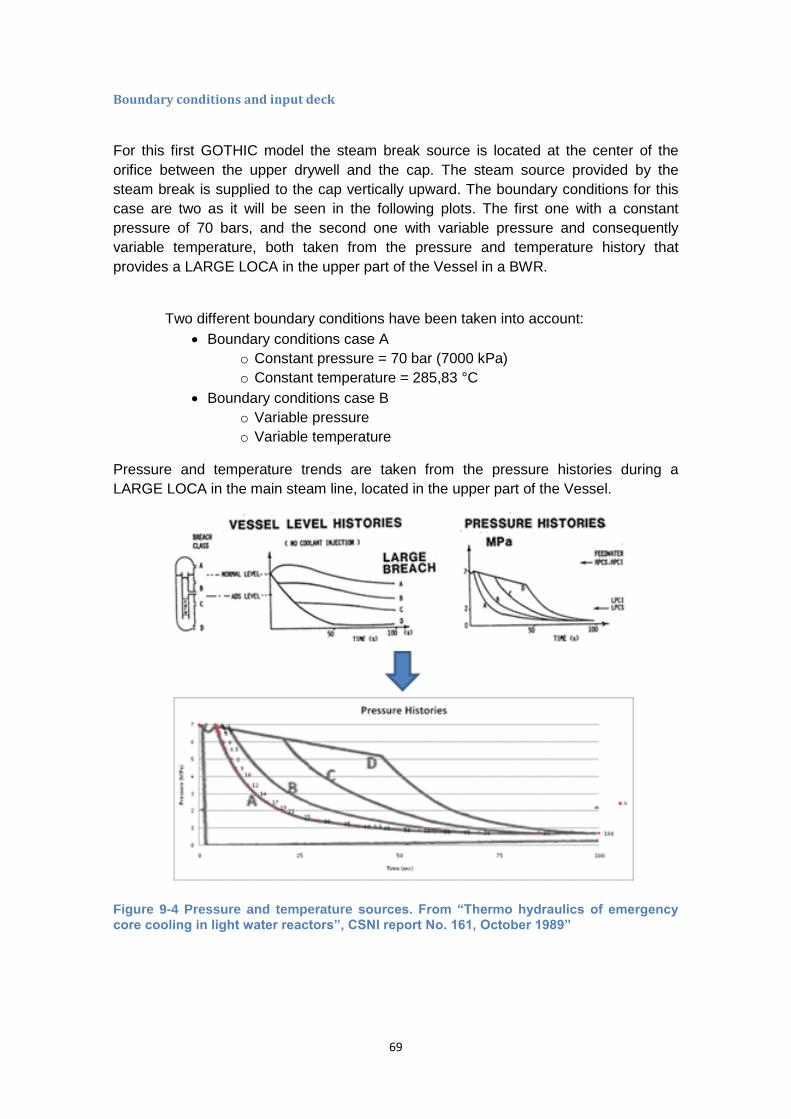
Boundary conditions and input deck
For this first GOTHIC model the steam break source is located at the center of the
orifice between the upper drywell and the cap. The steam source provided by the
steam break is supplied to the cap vertically upward. The boundary conditions for this
case are two as it will be seen in the following plots. The first one with a constant
pressure of 70 bars, and the second one with variable pressure and consequently
variable temperature, both taken from the pressure and temperature history that
provides a LARGE LOCA in the upper part of the Vessel in a BWR.
Two different boundary conditions have been taken into account:
Boundary conditions case A
o Constant pressure = 70 bar (7000 kPa)
o Constant temperature = 285,83 °C
Boundary conditions case B
o Variable pressure
o Variable temperature
Pressure and temperature trends are taken from the pressure histories during a
LARGE LOCA in the main steam line, located in the upper part of the Vessel.
Figure 9-4 Pressure and temperature sources. From “Thermo hydraulics of emergency core cooling in light water reactors”, CSNI report No. 161, October 1989”
70
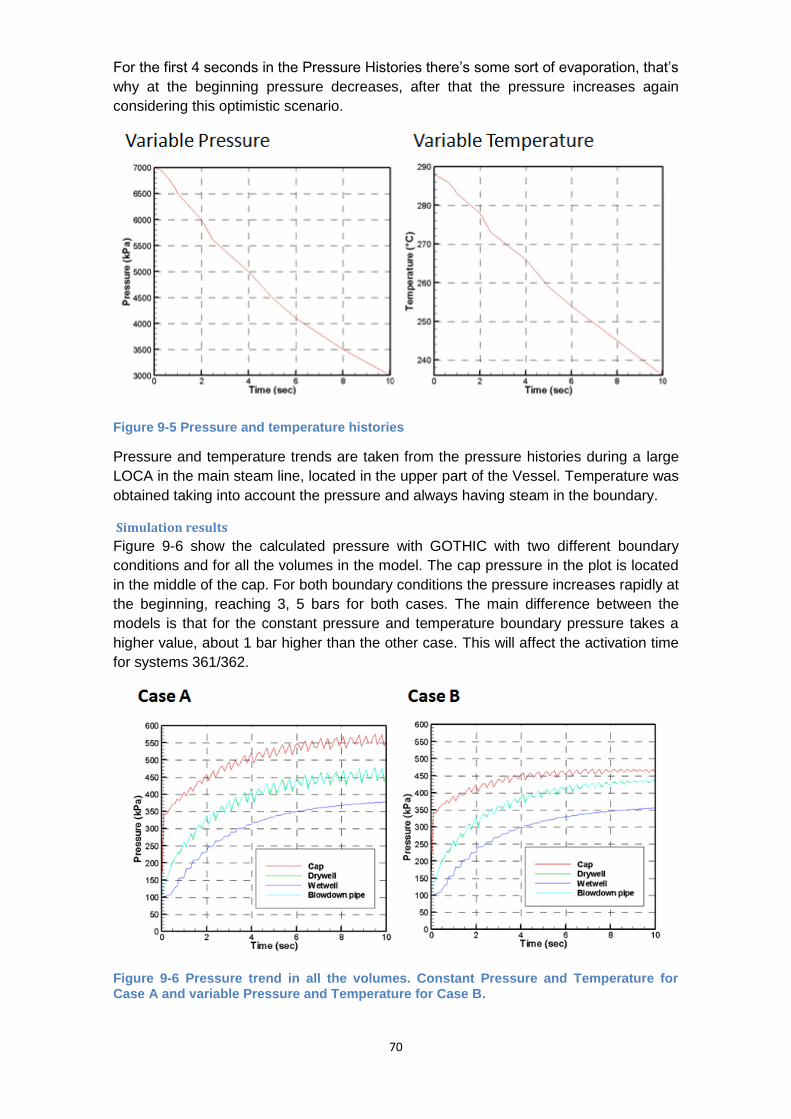
For the first 4 seconds in the Pressure Histories there’s some sort of evaporation, that’s
why at the beginning pressure decreases, after that the pressure increases again
considering this optimistic scenario.
Figure 9-5 Pressure and temperature histories
Pressure and temperature trends are taken from the pressure histories during a large
LOCA in the main steam line, located in the upper part of the Vessel. Temperature was
obtained taking into account the pressure and always having steam in the boundary.
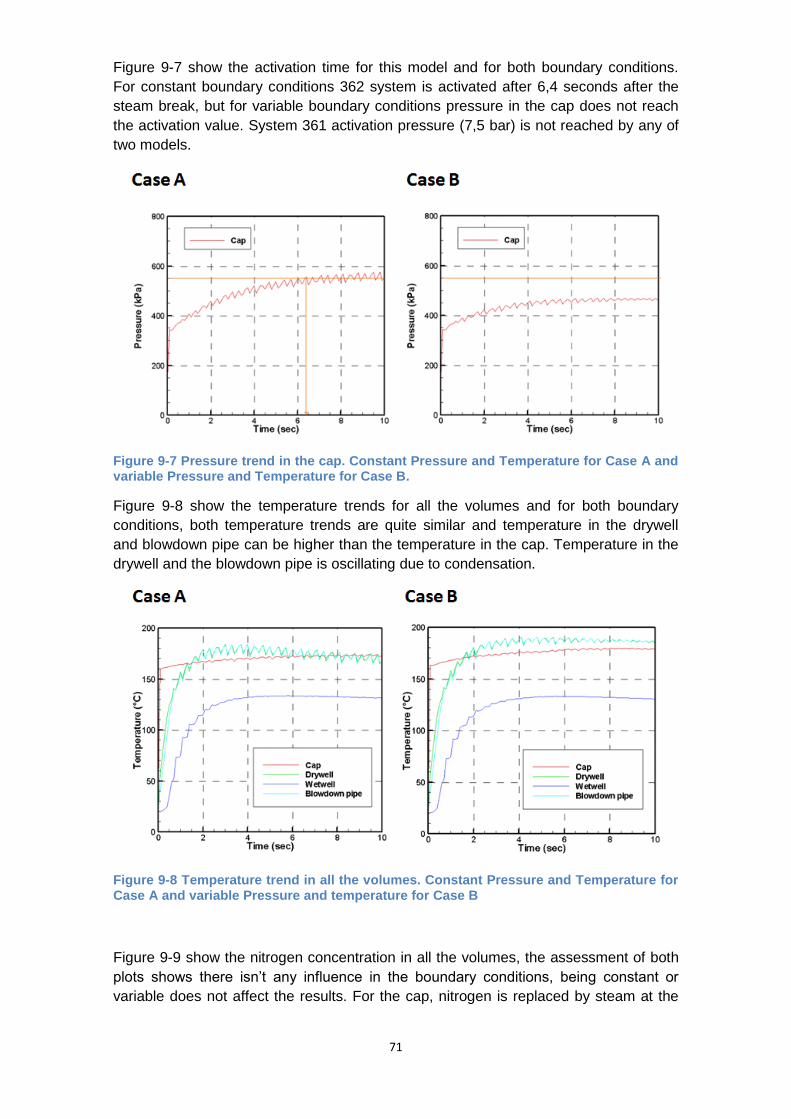
Simulation results
Figure 9-6 show the calculated pressure with GOTHIC with two different boundary
conditions and for all the volumes in the model. The cap pressure in the plot is located
in the middle of the cap. For both boundary conditions the pressure increases rapidly at
the beginning, reaching 3, 5 bars for both cases. The main difference between the
models is that for the constant pressure and temperature boundary pressure takes a
higher value, about 1 bar higher than the other case. This will affect the activation time
for systems 361/362.
Figure 9-6 Pressure trend in all the volumes. Constant Pressure and Temperature for Case A and variable Pressure and Temperature for Case B.
71
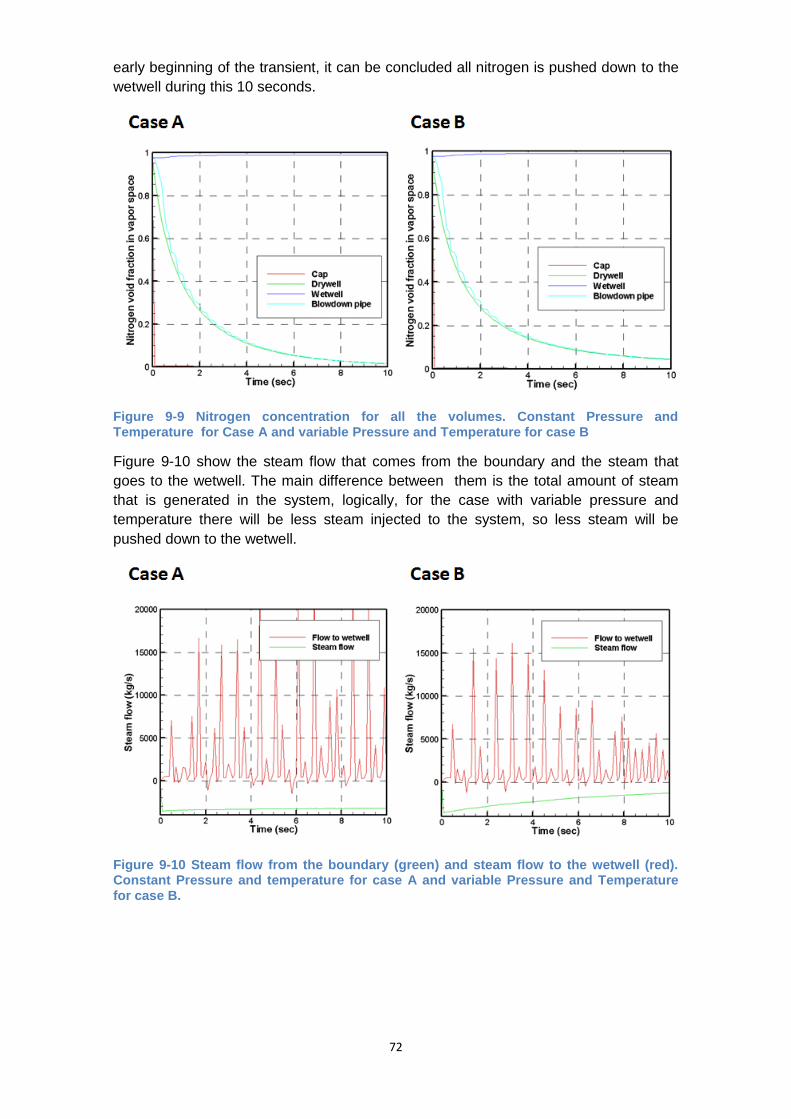
Figure 9-7 show the activation time for this model and for both boundary conditions.
For constant boundary conditions 362 system is activated after 6,4 seconds after the
steam break, but for variable boundary conditions pressure in the cap does not reach
the activation value. System 361 activation pressure (7,5 bar) is not reached by any of
two models.
Figure 9-7 Pressure trend in the cap. Constant Pressure and Temperature for Case A and variable Pressure and Temperature for Case B.
Figure 9-8 show the temperature trends for all the volumes and for both boundary
conditions, both temperature trends are quite similar and temperature in the drywell
and blowdown pipe can be higher than the temperature in the cap. Temperature in the
drywell and the blowdown pipe is oscillating due to condensation.
Figure 9-8 Temperature trend in all the volumes. Constant Pressure and Temperature for Case A and variable Pressure and temperature for Case B
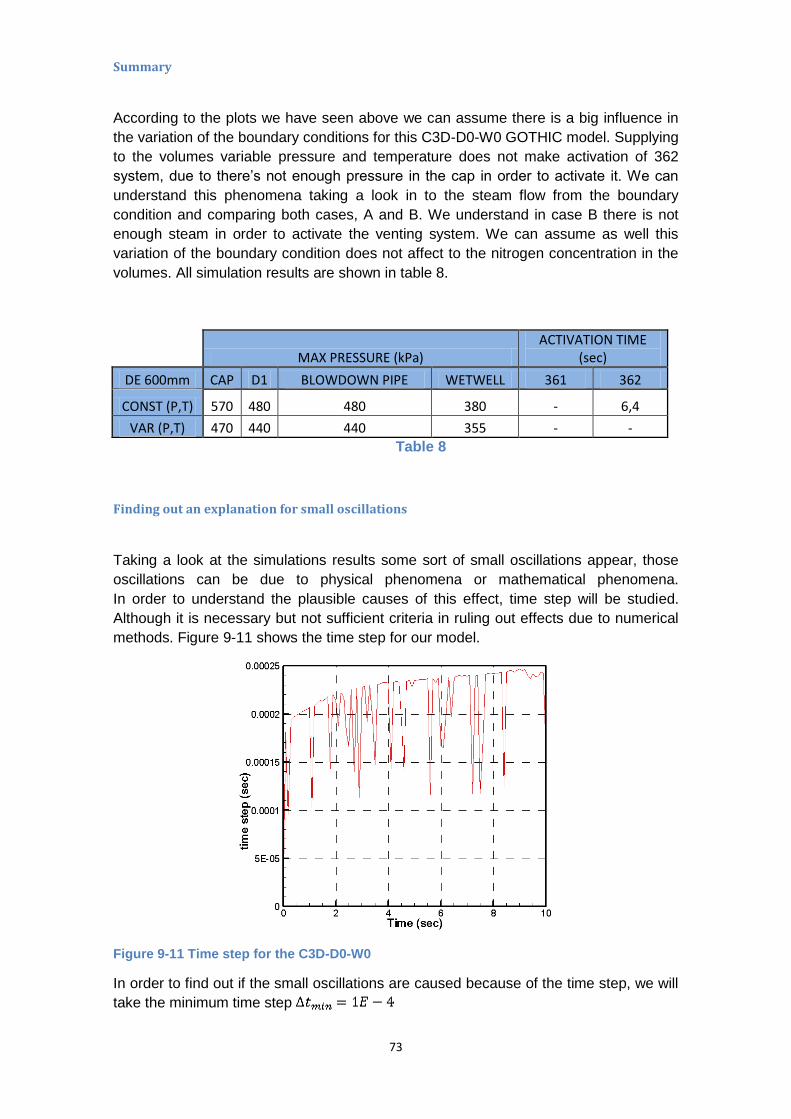
Figure 9-9 show the nitrogen concentration in all the volumes, the assessment of both
plots shows there isn’t any influence in the boundary conditions, being constant or
variable does not affect the results. For the cap, nitrogen is replaced by steam at the
72
early beginning of the transient, it can be concluded all nitrogen is pushed down to the
wetwell during this 10 seconds.
Figure 9-9 Nitrogen concentration for all the volumes. Constant Pressure and Temperature for Case A and variable Pressure and Temperature for case B
Figure 9-10 show the steam flow that comes from the boundary and the steam that
goes to the wetwell. The main difference between them is the total amount of steam
that is generated in the system, logically, for the case with variable pressure and
temperature there will be less steam injected to the system, so less steam will be
pushed down to the wetwell.
Figure 9-10 Steam flow from the boundary (green) and steam flow to the wetwell (red). Constant Pressure and temperature for case A and variable Pressure and Temperature for case B.
73
Summary
According to the plots we have seen above we can assume there is a big influence in
the variation of the boundary conditions for this C3D-D0-W0 GOTHIC model. Supplying
to the volumes variable pressure and temperature does not make activation of 362
system, due to there’s not enough pressure in the cap in order to activate it. We can
understand this phenomena taking a look in to the steam flow from the boundary
condition and comparing both cases, A and B. We understand in case B there is not
enough steam in order to activate the venting system. We can assume as well this
variation of the boundary condition does not affect to the nitrogen concentration in the
volumes. All simulation results are shown in table 8.
MAX PRESSURE (kPa)
ACTIVATION TIME (sec)
DE 600mm CAP D1 BLOWDOWN PIPE WETWELL 361 362
CONST (P,T) 570 480 480 380 - 6,4
VAR (P,T) 470 440 440 355 - -
Table 8
Finding out an explanation for small oscillations
Taking a look at the simulations results some sort of small oscillations appear, those
oscillations can be due to physical phenomena or mathematical phenomena.
In order to understand the plausible causes of this effect, time step will be studied.
Although it is necessary but not sufficient criteria in ruling out effects due to numerical
methods. Figure 9-11 shows the time step for our model.
Figure 9-11 Time step for the C3D-D0-W0
In order to find out if the small oscillations are caused because of the time step, we will
take the minimum time step
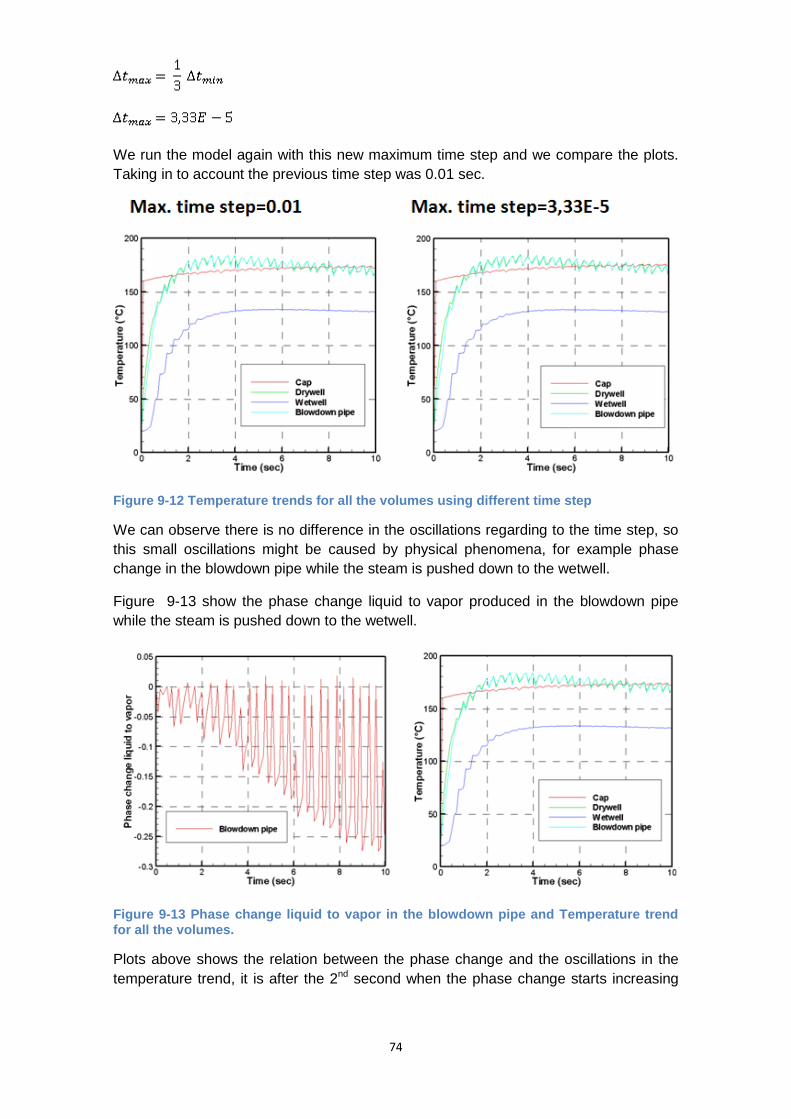
74
We run the model again with this new maximum time step and we compare the plots.
Taking in to account the previous time step was 0.01 sec.
Figure 9-12 Temperature trends for all the volumes using different time step
We can observe there is no difference in the oscillations regarding to the time step, so
this small oscillations might be caused by physical phenomena, for example phase
change in the blowdown pipe while the steam is pushed down to the wetwell.
Figure 9-13 show the phase change liquid to vapor produced in the blowdown pipe
while the steam is pushed down to the wetwell.
Figure 9-13 Phase change liquid to vapor in the blowdown pipe and Temperature trend for all the volumes.
Plots above shows the relation between the phase change and the oscillations in the
temperature trend, it is after the 2nd second when the phase change starts increasing

75
and the temperature stabilizes and stars oscillating. So we can assume those
oscillations might be caused due to the phase change in the blowdown pipe.
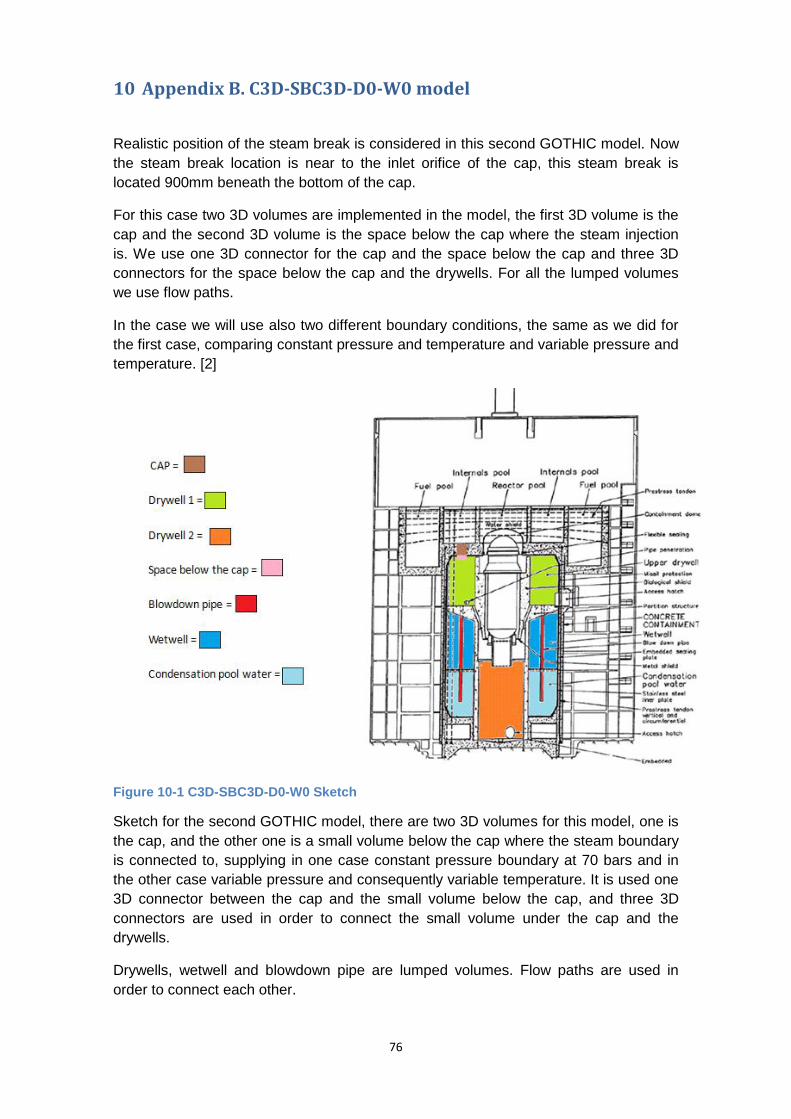
76
10 Appendix B. C3D-SBC3D-D0-W0 model
Realistic position of the steam break is considered in this second GOTHIC model. Now
the steam break location is near to the inlet orifice of the cap, this steam break is
located 900mm beneath the bottom of the cap.
For this case two 3D volumes are implemented in the model, the first 3D volume is the
cap and the second 3D volume is the space below the cap where the steam injection
is. We use one 3D connector for the cap and the space below the cap and three 3D
connectors for the space below the cap and the drywells. For all the lumped volumes
we use flow paths.
In the case we will use also two different boundary conditions, the same as we did for
the first case, comparing constant pressure and temperature and variable pressure and
temperature. [2]
Figure 10-1 C3D-SBC3D-D0-W0 Sketch
Sketch for the second GOTHIC model, there are two 3D volumes for this model, one is
the cap, and the other one is a small volume below the cap where the steam boundary
is connected to, supplying in one case constant pressure boundary at 70 bars and in
the other case variable pressure and consequently variable temperature. It is used one
3D connector between the cap and the small volume below the cap, and three 3D
connectors are used in order to connect the small volume under the cap and the
drywells.
Drywells, wetwell and blowdown pipe are lumped volumes. Flow paths are used in
order to connect each other.
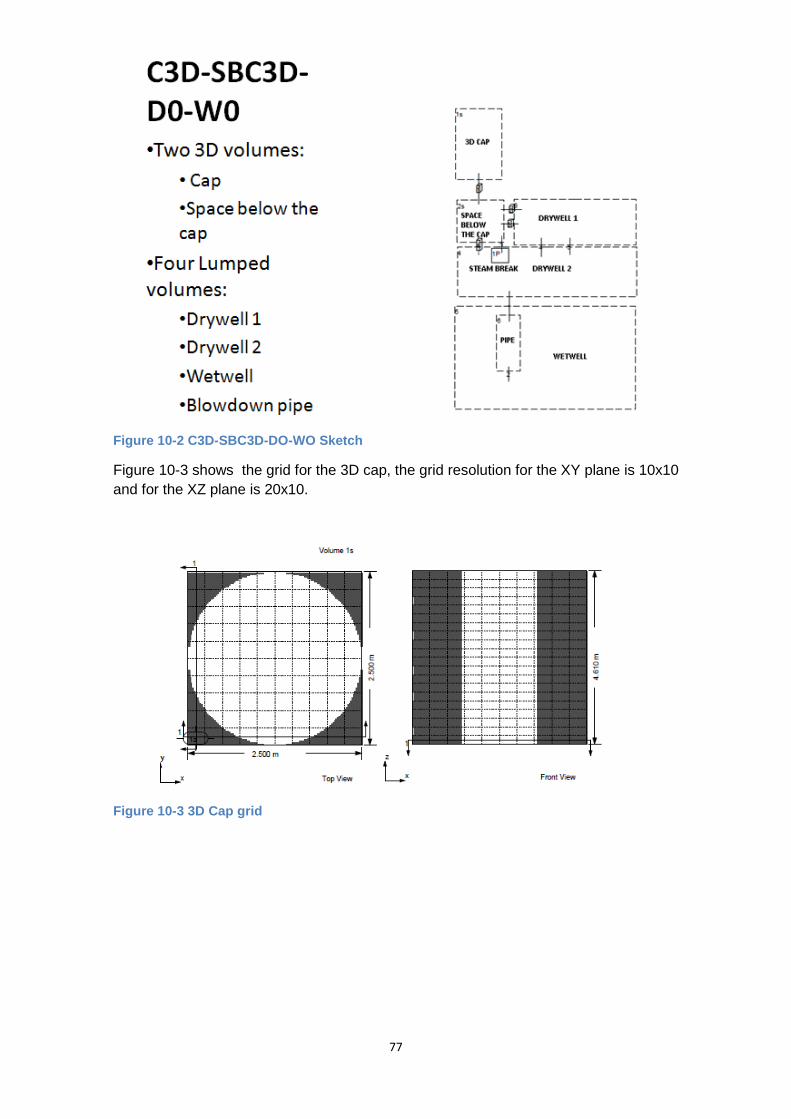
77
Figure 10-2 C3D-SBC3D-DO-WO Sketch
Figure 10-3 shows the grid for the 3D cap, the grid resolution for the XY plane is 10x10
and for the XZ plane is 20x10.
Figure 10-3 3D Cap grid
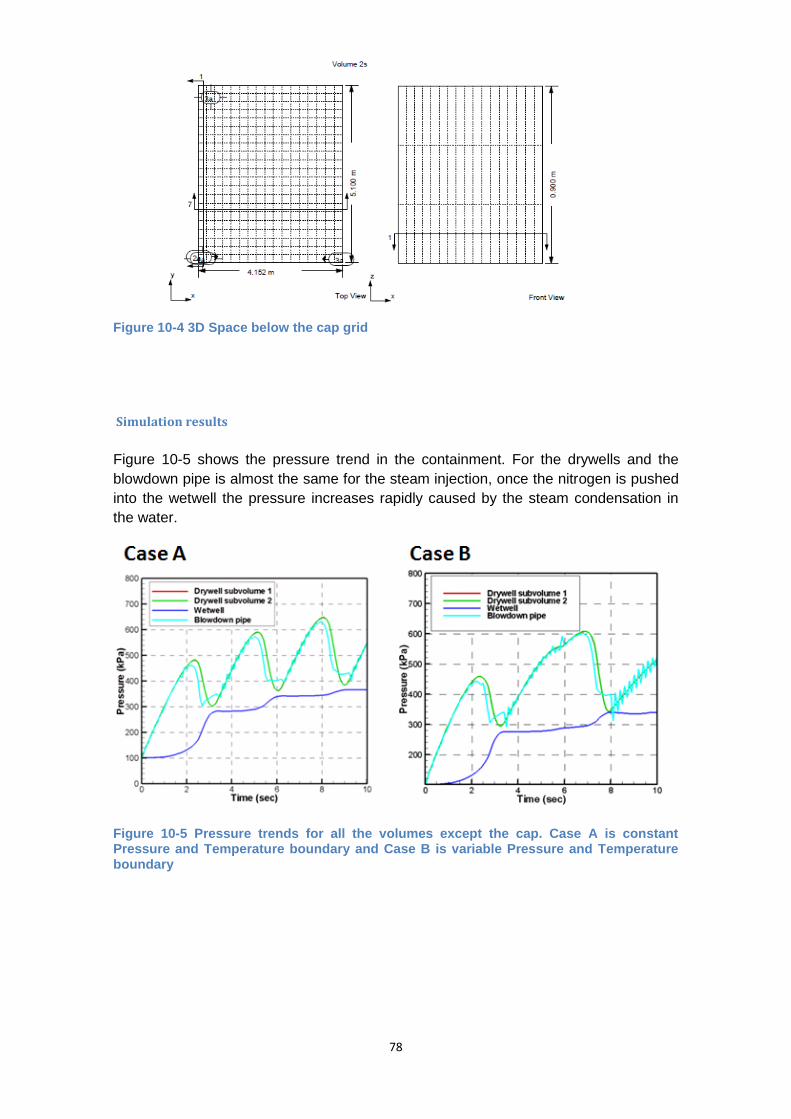
78
Figure 10-4 3D Space below the cap grid
Simulation results
Figure 10-5 shows the pressure trend in the containment. For the drywells and the
blowdown pipe is almost the same for the steam injection, once the nitrogen is pushed
into the wetwell the pressure increases rapidly caused by the steam condensation in
the water.
Figure 10-5 Pressure trends for all the volumes except the cap. Case A is constant Pressure and Temperature boundary and Case B is variable Pressure and Temperature boundary
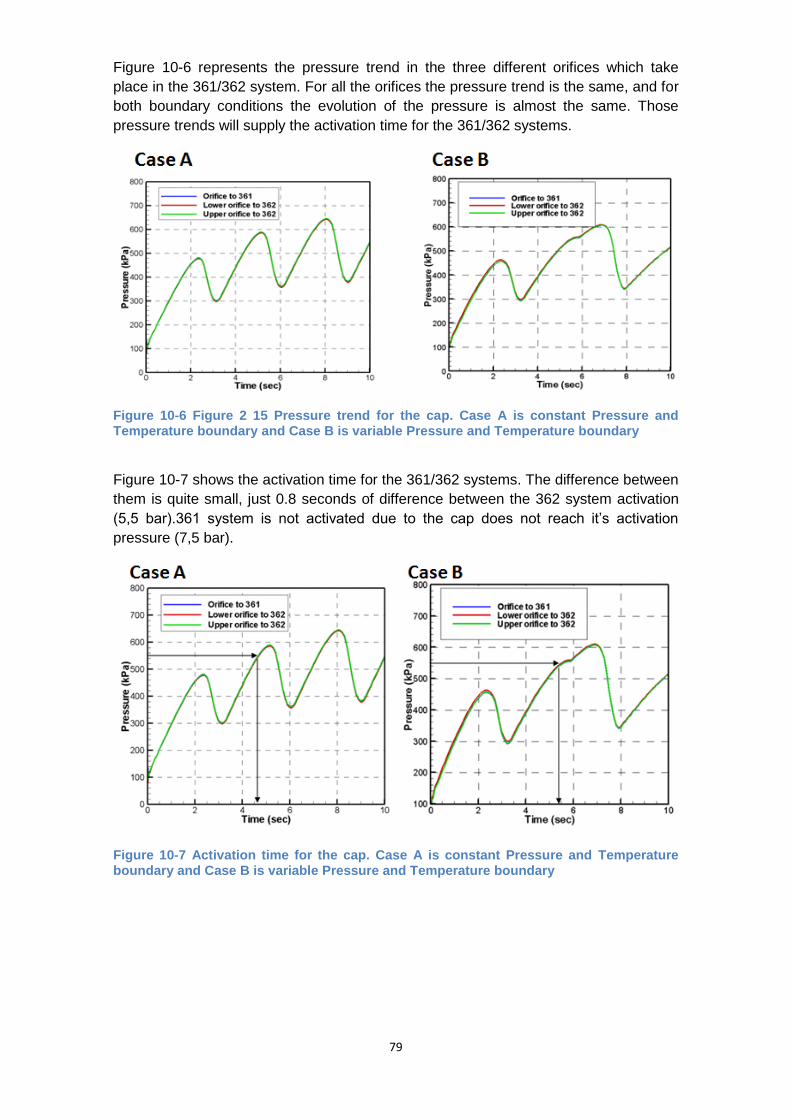
79
Figure 10-6 represents the pressure trend in the three different orifices which take
place in the 361/362 system. For all the orifices the pressure trend is the same, and for
both boundary conditions the evolution of the pressure is almost the same. Those
pressure trends will supply the activation time for the 361/362 systems.
Figure 10-6 Figure 2 15 Pressure trend for the cap. Case A is constant Pressure and Temperature boundary and Case B is variable Pressure and Temperature boundary
Figure 10-7 shows the activation time for the 361/362 systems. The difference between
them is quite small, just 0.8 seconds of difference between the 362 system activation
(5,5 bar).361 system is not activated due to the cap does not reach it’s activation
pressure (7,5 bar).
Figure 10-7 Activation time for the cap. Case A is constant Pressure and Temperature boundary and Case B is variable Pressure and Temperature boundary
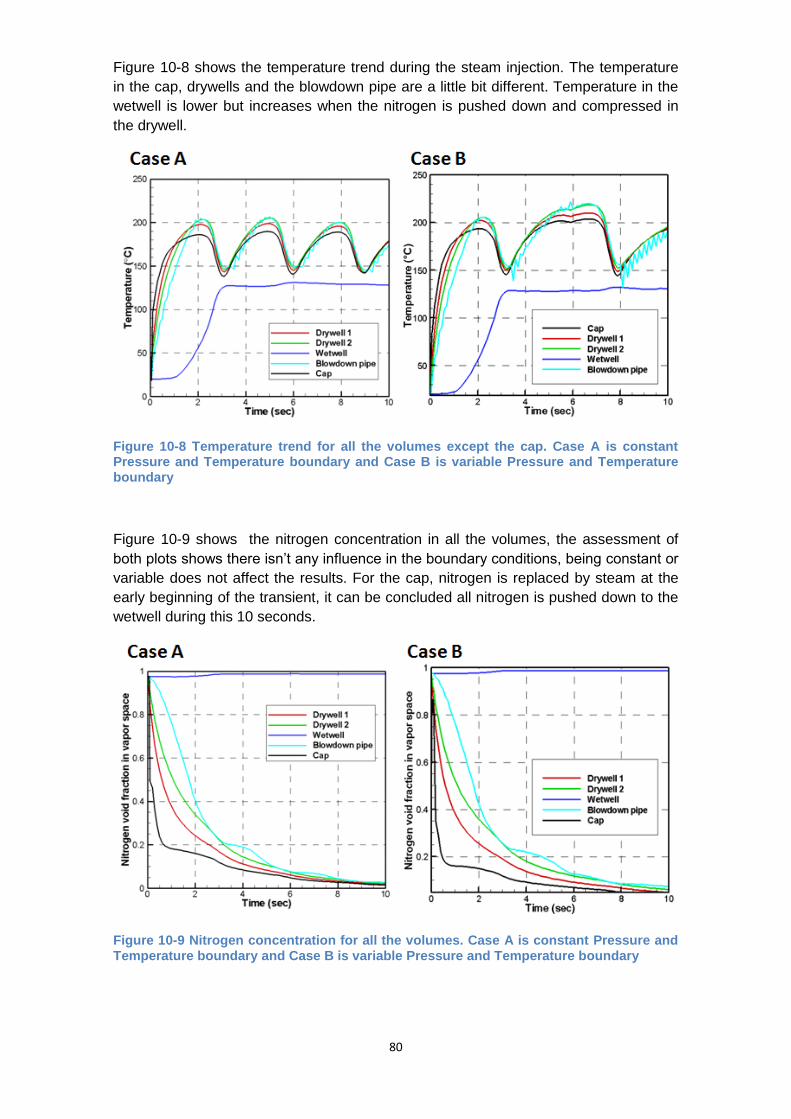
80
Figure 10-8 shows the temperature trend during the steam injection. The temperature
in the cap, drywells and the blowdown pipe are a little bit different. Temperature in the
wetwell is lower but increases when the nitrogen is pushed down and compressed in
the drywell.
Figure 10-8 Temperature trend for all the volumes except the cap. Case A is constant Pressure and Temperature boundary and Case B is variable Pressure and Temperature boundary
Figure 10-9 shows the nitrogen concentration in all the volumes, the assessment of
both plots shows there isn’t any influence in the boundary conditions, being constant or
variable does not affect the results. For the cap, nitrogen is replaced by steam at the
early beginning of the transient, it can be concluded all nitrogen is pushed down to the
wetwell during this 10 seconds.
Figure 10-9 Nitrogen concentration for all the volumes. Case A is constant Pressure and Temperature boundary and Case B is variable Pressure and Temperature boundary
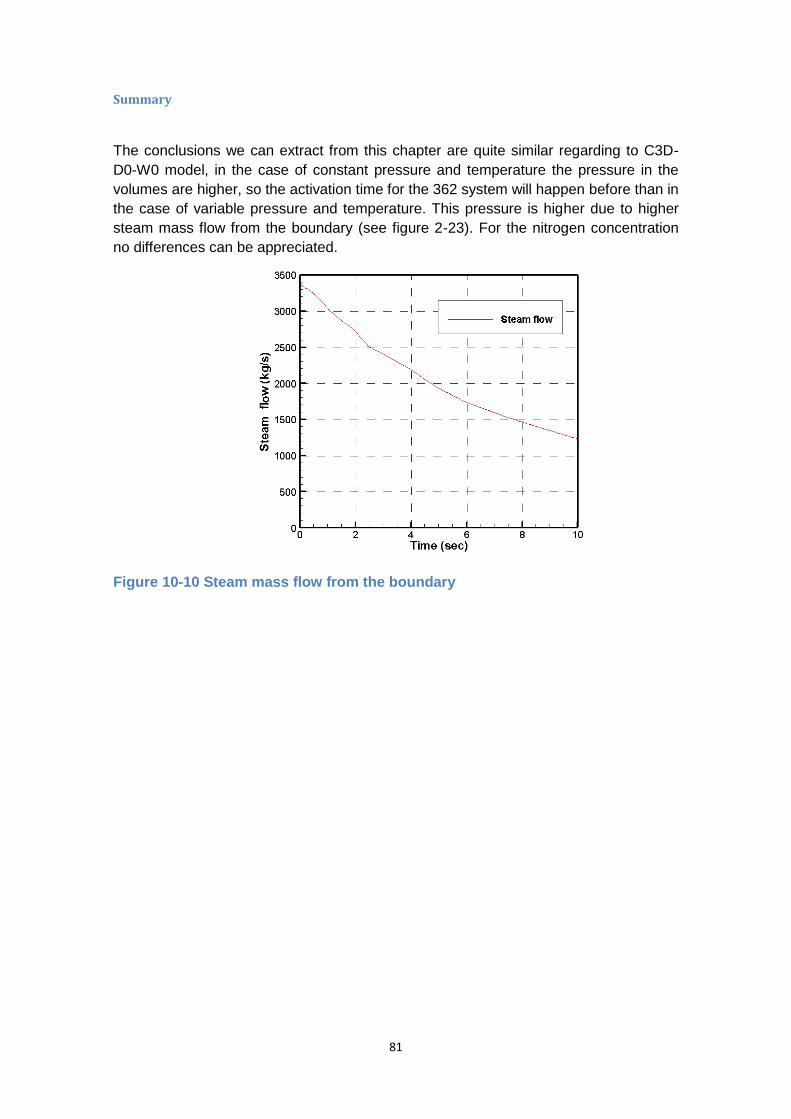
81
Summary
The conclusions we can extract from this chapter are quite similar regarding to C3D-
D0-W0 model, in the case of constant pressure and temperature the pressure in the
volumes are higher, so the activation time for the 362 system will happen before than in
the case of variable pressure and temperature. This pressure is higher due to higher
steam mass flow from the boundary (see figure 2-23). For the nitrogen concentration
no differences can be appreciated.
Figure 10-10 Steam mass flow from the boundary