Embed Size (px)
Citation preview

INVESTIGATION OF ACCULTURATION CHANGES IN FOOD INTAKEOF TAIWANESE STUDENTS ATTENDING THE UNIVERSITY OF
WISCONSIN-STOUT
by
Yi-Ping Lu
A Research Paper
Submitted in Partial Fulfillment of theRequirements for the
Master of Science DegreeWith a Major in
Food and Nutritional Sciences
Approved: 2 Semester Credits
___________________________Carol Seaborn, PhD, RD, CD
The Graduate CollegeUniversity of Wisconsin-Stout
February 2000

2
The Graduate CollegeUniversity of Wisconsin-Stout
Menomonie, WI 54751
ABSTRACT
Lu, Yi-PingWriter
Investigation of Acculturation Changes in Food Intake of Taiwanese Students Attending theUniversity of Wisconsin-Stout
Title
Food and Nutritional Sciences Carol Seaborn Feb. 2000 95Graduate major Research Advisor (Month/Year) (No. of Pages)
Turbian, Kate L. Manual for writers of Term Papers, Theses, and DissertationsName of Style Manual Used in this Study
Dietary acculturation is one of the many behavioral consequences of immigration. An
investigation of the food habit changes of Chinese persons living in Lincoln, Nebraska reported
that the longer the Chinese had lived in this country, the more changes in food habits they had
made (Yang and Fox 1979). Although there are several studies (Wenkam and Wolff 1970; Yang
and Fox 1979; Buell and Dunn 1965; Yano et al. 1978; Nomura et al. 1990; Lewis and Glaspy
1975) which have reported on changes in dietary patterns among different immigrant groups,
limited research data on dietary habits of Taiwanese students living in the United States are
available. The purpose of this study was to identify if there was a difference of dietary nutrient
intake before and after Taiwanese students came to the United States.
Fifteen Taiwanese students enrolled at the University of Wisconsin-Stout participated in this
study. The participants were interviewed two times. In the first interview, students completed the
food frequency questionnaire about their food intake since they came to the United States and the
one day 24-hour recall. In the second interview, the participants completed the same food
frequency questionnaire about their food intake in Taiwan before they came to the United States.

3
During both interview sessions, food pictures, measuring cups and spoons were used to collect the
dietary data.
The nutrient composition of the 24-hour recall and food frequency questionnaires were
analyzed by the Food Processor Plus program. Paired-samples t test was used to compare the
nutrient intakes and percentages of the RDA for the nutrients. One comparison using the t-test was
that of the nutrients calculated from the 24-hour recall in the United States to the nutrients
calculated from the food frequency questionnaire of food consumed in the United States. A second
t-test was used to compare the nutrients calculated from the food frequency questionnaire of foods
consumed in the United States to the values obtained from the food frequency questionnaire of
food consumed in Taiwan. The third comparison was of the nutrient intake calculated from the 24-
hour recall in the United States to the nutrient intake as calculated from the food frequency
questionnaire of food consumed in Taiwan.
This study observed that there were significant decreases in the intake in protein, thiamin,
vitamin B6, vitamin B12 and vitamin E of students attending the University of Wisconsin-Stout in
the United States. In the comparison of the United States food frequency questionnaire to the
Taiwan food frequency questionnaire, calories, carbohydrate, fat, cholesterol, vitamin A,
riboflavin, vitamin C, calcium, and iron did not show significant differences. Compared to the
percentage of the United States recommended dietary allowances; both vitamin E and calcium are
well below the RDA.
Our observations can help dietitians to understand the change in nutrient intake that occurs
in young Asians attending United States universities. The dietitian can use this information to plan
their nutrition education on how to improve the calcium intake of Asian students who experience

4
lactose-intolerance and have a low calcium intake as well as increasing vitamin E in the diet. This
information may assist the dietitian to provide nutrition counseling to their Asian clients.

5
ACKNOWLEGEMENTS
I was very appreciative of Professor Carol D. Seaborn for her consistent support and
professional guidance. I wish to thank my parents very much for their support which allowed me
to concentrate on my thesis. Additionally, I also thank all the Taiwanese students for their
participation in this project.
6
TABLE OF CONTENTS
ABSTRACT........................................................................................................................................ii
ACKNOWLEDGEMENTS ................................................................................................................v
TABLE OF CONTENTS ....................................................................................................................vi
LIST OF TABLES ..............................................................................................................................ix
LIST OF FIGURES.............................................................................................................................xi
CHAPTER ONE: INTRODUCTION .................................................................................................1
1. Statement of the Problem......................................................................................................4
2. Objectives of the Study .........................................................................................................4
CHAPTER TWO: REVIEW OF THE LITERATURE.......................................................................5
1. Nutritional Status of Chinese People (Taiwan) .....................................................................5
2. How Nutrition Status Changes as Cultures Migrate
----Migrant Epidemiological Studies ....................................................................................7
3. Studies on the Dietary Patterns of Chinese Immigrants........................................................9
4. Dietary Beliefs of Chinese ....................................................................................................10
5. The Health Risks Faced by Chinese Immigrants ..................................................................13
6. Chinese People Dietary Survey
----Which Nutrients Have Low Intakes.................................................................................14
7. Food Frequency Questionnaire .............................................................................................17
8. 24-Hour Recall......................................................................................................................20
9. Implications for Future Research ..........................................................................................21
CHAPTER THREE: RESEARCH DESIGN AND METHODOLOGY .............................................22
1. Human Subjects Consent Form.............................................................................................22

7
2. Description of the Sample.....................................................................................................22
3. Development of the Questionnaire........................................................................................22
a) 24-Hour Recall Form..............................................................................................23
b) The Method to Collect Data From the 24-Hour Recall Form.................................23
c) 24-Hour Recall Supplementary Questions..............................................................24
d) Food Frequency Questionnaire ...............................................................................25
4. Data Analysis ........................................................................................................................26
a) Food Intake Analysis ..............................................................................................26
b) Statistical Analysis..................................................................................................27
CHAPTER FOUR: RESULTS OF THE STUDY...............................................................................28
1. Background Information .......................................................................................................28
2. Characteristics of Subjects ....................................................................................................28
3. Comparison of Calories, Macronutrients and Cholesterol ....................................................31
4. Comparison of Vitamin A, Thiamin (B1), Riboflavin (B2), Vitamin B6
and Vitamin B12 ....................................................................................................................36
5. Comparison of Vitamin C, Vitamin E, Calcium and Iron.....................................................41
CHAPTER FIVE: DISCUSSION .......................................................................................................46
1. Nutrient Intake ......................................................................................................................46
A. Calories, Macronutrients and Cholesterol Intakes of Taiwanese Students............................46
B. Vitamin A, Thiamin (B1), Riboflavin (B2), Vitamin B6, and
Vitamin B12 Intakes of Taiwanese Students..........................................................................51
C. Vitamin C, Vitamin E, Calcium and Iron Intake of Taiwanese

8
Students ...................................................................................................................................57
2. Limitations of This Study......................................................................................................65
3. Applications/ Conclusions ....................................................................................................65
APPENDIX
A. Recommended Daily Nutrient Allowances in Taiwan..........................................................68
B. Human Research Subjects Consent Form .............................................................................70
C. Cover Letter ..........................................................................................................................72
D. 24-Hour Recall Form ............................................................................................................74
E. 24-Hour Recall Supplementary Questions ............................................................................76
F. Taiwan Food Frequency Questionnaire ................................................................................78
G. United States Food Frequency Questionnaire .......................................................................83
H. Recommended Dietary Allowances in the United States......................................................88
REFERENCE LIST.............................................................................................................................90

9
LIST OF TABLES
Table Page
1. Nutrient Content of Chinese Foods………………………………………………..15
2. Characteristics of Subjects…………………………………………………………30
3. Comparison of Calories, Macronutrients and Cholesterol Intake Calculated from the 24-Hour Recall in the United States and the Food Frequency Questionnaire of Food Consumed in the United States……………………………32
4. Comparison of Calories, Macronutrients and Cholesterol Calculated from the Food Frequency Questionnaire of Foods Consumed in the United States Compared to Values Obtained from the Food Frequency Questionnaire of Food Consumed in Taiwan………………………………………33
5. Comparison of Calories, Macronutrients and Cholesterol Intake Calculated from the 24-Hour Recall in the United States and the Food Frequency Questionnaire of Food Consumed in Taiwan……………………………………….35
6. Comparison of Vitamin A, Thiamin (B1), Riboflavin (B2), Vitamin B6 and Vitamin B12 Intake Calculated from the 24-Hour Recall in the United States and the Food Frequency Questionnaire of Food Consumed in the United States……………………………………………………………………….37
7. Comparison of Vitamin A, Thiamin (B1), Riboflavin (B2), Vitamin B6 and Vitamin B12 Calculated from the Food Frequency Questionnaire of Foods Consumed in the United States Compared to Values Obtained from the Food Frequency Questionnaire of Food Consumed in Taiwan…………..38
8. Comparison of Vitamin A, Thiamin (B1), Riboflavin (B2), Vitamin B6 and Vitamin B12 Intake Calculated from the 24-Hour Recall in the United States and the Food Frequency Questionnaire of Food Consumed in Taiwan……………………………………………………………………………...40
9. Comparison of Vitamin C, Vitamin E, Calcium and Iron Intake Calculated from the 24-Hour recall in the United States and the Food Frequency Questionnaire of Food Consumed in the United States……………………………42
10. Comparison of Vitamin C, Vitamin E, Calcium and Iron Calculated from the Food Frequency Questionnaire of Foods Consumed in the United States Compared to Values Obtained from the Food Frequency Questionnaire of Food Consumed in Taiwan………………………………………43
10
11. Comparison of Vitamin C, Vitamin E, Calcium and Iron Intake Calculated from the 24-Hour Recall in the United States and the Food Frequency Questionnaire of Food Consumed in Taiwan………………………………………45
12. A Summary of the Calories, Protein, Carbohydrate, Fat and Cholesterol Intake from the Taiwan Nutrition Survey, 24-Hour Recall in the United States, Taiwan Food Frequency Questionnaire (FFQ), and the United States Food Frequency Questionnaire………………………………….50
13. A Summary of the Vitamin A, Thiamin (B1), Riboflavin (B2) Intake from the Taiwan Nutrition Survey, 24-Hour Recall in the United States, Taiwan Food Frequency Questionnaire (FFQ), and the United States Food Frequency Questionnaire…………………………………………………….55
14. A Summary of the Vitamin C, Vitamin E, Calcium and Iron Intake fromthe Taiwan Nutrition Survey, 24-Hour Recall in the United States,
Taiwan Food Frequency Questionnaire (FFQ), and the United States Food Frequency Questionnaire……………………………………………..59

11
LIST OF FIGURES
Figure Page
1. A graphic display of the gender of the Taiwanese participants ............................. 29
2. Comparison of calories, protein, carbohydrate, fat, and cholesterol intakecalculated form the 24-hour recall in the United States, the United Statesfood frequency questionnaire, and the Taiwan food frequency questionnaire ................................. 47
3. Comparison of vitamin A, thiamin (B1), riboflavin (B2), vitamin B6,and vitamin B12 intake of the 24-hour recall in the United States, theUnited States food frequency questionnaire, and the Taiwan foodfrequency questionnaire. .................................................................................................................. 52
4. Comparison of vitamin C, vitamin E, calcium, and iron intake of the24-hour recall in the United States, the United States food frequencyquestionnaire, and the Taiwan food frequency questionnaire. ......................................................... 58
12
CHAPTER ONE
INTRODUCTION
Dietary acculturation is one of the many behavioral consequences of immigration. New
food use patterns develop through the rejection of traditional foods and acceptance of culturally
new foods. The impact of this process on health is related to the balance between nutritionally
sound and nutritional questionable food use changes (Pan et al. 1999).
Since the middle of the nineteenth century, Chinese people have been coming to the
United States and entering its institutions of higher learning to pursue academic degrees. While
they are learning a new language and adapting to different types of people, food is in a unique
position that both links the students with their mother culture and provides a chance for relaxation
and enjoyment (Yang and Fox 1979).
Studies of Japanese immigrant families in Hawaii illustrate dramatic changes of food
habits. From a predominantly high - carbohydrate, rice and plant food diet, the food pattern of the
Japanese immigrant families in Hawaii was changed to a “cosmopolitan” diet
consisting of high-protein and high fat foods. The socio-cultural forces which impacted the change
in dietary habits of these Japanese immigrants included the desire for higher social status;
disorganization of the traditional family, and released customary control over certain foods. The
most decisive factor is the changing attitude of the second generation toward Japanese foods and
traditions in general. The effect of this dietary change has been a reduction in death from beriberi,
increased longevity, and an increase in the stature of the Nisei. Unfortunately, the dental caries rate
and incidence of coronary heart disease has increased. It is evident that the immigrant Japanese
families have adopted western foods as they have adopted western ways, which appears to have
had some undesirable as well as desirable effects on health (Wenkam and Wolff 1970).

13
Among the environmental factors, dietary changes are considered to be one of the
components that might increase risk for cancer (He et al. 1996). The typical Asian diet can be
characterized as low fat, especially low in animal fat, and higher in fiber than a typical U.S.
western diet (Yu et al. 1991; Guldan et al. 1991). During the last 19-20 years, several Asian areas
have been undergoing industrialization and rapid economic change. Concurrent with this
industrialization is a westernization of the dietary pattern and increases in chronic diseases
associated with western diets (Lee et al. 1989; Kodama et al. 1991).
An investigation of the food habit changes of Chinese persons living in Lincoln,
Nebraska reported that, the longer the Chinese had lived in this country, the more changes in food
habits they had made. Especially when the people had an American food experience before
coming to the United States (Yang and Fox 1979). In this study, significant changes in the lunch
pattern were clearly observed. A traditional Chinese lunch features rice and several dishes of meat
and vegetables. A large proportion of the subjects reported eating an American lunch because they
often ate outside of the home at lunchtime. This study also indicated that American foods were
usually not accepted and eaten in their natural style. Rather, they were modified according to the
flavor and texture preferences of the Chinese and accepted as a new, "Chinese-like" food. The
authors indicated that besides incorporation of American foods into the diet and the decreased
consumption of Chinese foods, their study showed that a continuous process of food habit change
is occurring in this group of Chinese immigrants. The authors anticipated that the longer the
immigrants remained in the United States and the greater their exposure to American foods, the
more American food habits they adopted (Yang and Fox 1979).
Although there are several studies, which have reported on changes in dietary patterns
among different immigrant groups, limited research data on dietary habits of Taiwanese students

14
living in the United States are available. An understanding of dietary patterns of Taiwanese
students with cultural backgrounds that are different from their American counterparts is important
in the development of nutrition education programs for Taiwanese immigrants (Pan et al. 1999).
Also, it would be of value to compare the nutritional intake of those whose food habits do change
with those that retain the more traditional food habits.

15
1. Statement of the Problem
The purpose of this study is to identify the changes in food intake of
Taiwanese students at the University of Wisconsin-Stout compared to their food
intake before they came to United States. Nutrients, which will be investigated,
include calories, carbohydrate, fat, protein, vitamin A, thiamin, riboflavin, vitamin
C, calcium, and iron.
2. Objectives of the Study
1) Collect food intake data using the 24-Hour Recall and Food Frequency Questionnaires.
2) Identify changes in dietary habits of Taiwanese students as a result of living in
Wisconsin.
3) To analyze the dietary nutrient intake of Taiwanese students before and after immigration
to the United States.
It is anticipated that the findings of this study will help the Taiwanese student immigrants
know what kind of food they should increase or decrease to maintain their health status. Also, the
study will provide the dietetic professions more accurate information about the dietary changes
that occur as a result of the Taiwanese immigration for development of nutrition education
programs.
16
CHAPTER TWO
REVIEW OF THE LITERATURE
The role of immigration as a factor for changing food intake and altering the risk of
certain diseases and nutritional status of Chinese people has received limited attention. This
review will discuss the nutritional status of Chinese people in Taiwan, illustrate how nutrition
status changes as cultures move as reported in migrant epidemiological and food intake studies,
highlight dietary beliefs of Chinese, and will describe the nutritional status of people living in
China.
1. Nutritional status of Chinese people (Taiwan)
Assessing food patterns and nutrition profiles can obtain information to control chronic
diseases (Tian et al. 1995). Chinese adolescents have experienced an improvement of diet and
nutritional status. Overweight has emerged as a problem associated with young, high-income and
urban adolescents, but the prevalence of obesity (4%) is quite low compared with developed
countries. Chinese adolescents' energy and protein intakes were adequate compared with the
American RDA (Wang, Popkin and Zhai 1998).
Two surveys about the Chinese diet conducted during 1990, report that most of the
nutrient intakes are close or equal to their corresponding recommended daily allowances (Tian et
al. 1995; Chen and Gao 1993). Both the total energy intake (2203 kcal) and the proportions
contributed by protein, fat, and carbohydrate meet the current Chinese RDAs (Appendix A). The
intake of essential amino acids all exceeded the Chinese RDA, and their proportions were
generally consistent with the Chinese RDA recommended pattern. The dietary fat intake has been
increasing significantly in the Chinese diet, and the proportion of animal fat has reached 53% of
the total fat intake. The total saturated, total monounsaturated, total polyunsaturated fatty acid ratio

17
was 1.0: 1.5: 1.0, respectively. The intakes of thiamin and riboflavin were below the RDA. Retinol
intakes were low. Most of the retinol (equivalent) intakes were from carotenoids. The average
intake of total tocopherol was 89% of the RDA. The intakes of calcium, zinc, and potassium were
insufficient, and intakes of selenium and magnesium were a little low. The intakes of iron, copper,
manganese, sodium, and phosphorus were adequate. High sodium and low potassium intake is a
traditional problem in the Chinese diet.
Among the animal foods, pork remains the most common and least expensive form of
meat, contributing more than 90% of China's total meat production exceeding poultry and fish
(Kantha 1990). Another study reported that lunch was the most substantial meal of the day for
Chinese working women in Taiwan (Shimbo et al. 1997). When comparisons were made to the
recommended dietary allowance (RDA) for these Taiwanese women, the insufficiency ratios were
more than 50% for minerals (i.e., iron and calcium) and all vitamins (except for vitamin C).
Excess in the lipid energy ratio (> 30%) was observed in 60% of the working women. These data
illustrate that integrated nutrition intervention is needed to prevent insufficient intake of some
nutrients and control dietary risk factors such as high fat intake, which is related to chronic
diseases (Tian et al. 1995).
2. How Nutrition Status Changes as Cultures Migrate
----Migrant Epidemiological Studies
International migration studies show that the movement of population groups from one
society to another provides a special opportunity to evaluate change in risk factors among persons
sharing the same genetic and cultural background. Studies of Japanese immigrant families in
Hawaii stand out as illustrating a dramatic change of food habits. From a predominantly high-
carbohydrate, rice and plant food diet, the food pattern of the Japanese immigrant family in

18
Hawaii was changed to a "cosmopolitan" diet consisting of high-protein and high-fat foods. The
most conspicuous dietary change in these families was in the breakfast menu. The American
breakfast replaced the rice, soup, and pickled vegetable meal of the traditional Japanese. The
socio-cultural factors which impacted the changes in dietary habits included the desire for higher
social status; disorganization of the traditional family, and released customary control over certain
foods. The most decisive factor was the changing attitude of the second generation toward
Japanese foods and traditions in general. The effect of this change has been a reduction in death
from beriberi, increased longevity, and an increase in the stature of the Japanese. Unfortunately,
the dental caries rate and incidence of coronary heart disease has increased. Thus, the immigrant
Japanese have adopted western foods as they have adopted western ways, which appears to have
had some undesirable as well as desirable effects on health (Wenkam and Wolff 1970).
Studies of immigrants from Japan to the United States show that the risk of colon cancer,
which is extremely common in California, but rare in Japan, approaches that of white men in
California with migration (Buell and Dunn 1965). In contrast, the risk of stomach and liver cancer
is much higher in native Japanese than among whites in the United States as well as among
Japanese men who migrated to California. Risks of mortality from these two cancers among the
sons of Japanese immigrants are still lower (Yano et al. 1978). These findings strongly suggest
that the occurrence of these cancers is largely determined by environmental rather than by genetic
factors. Among the environmental factors, dietary changes are considered to be one of the
components that significantly increase the risk for cancer (Nomura et al. 1990).
A study conducted with college-educated Filipino women who had migrated from the
Philippines to Los Angeles within the past ten years indicated that the most significant change in
food habits was the addition of milk to the diet. Other changes included consumption of more

19
meat, fruits, fresh vegetables (as in salads), and juices; less starchy foods; and fewer snacks. Ease
of preparation of food, nutritional value of the foods, and the costs of the foods are the factors that
most influenced their food choices. These subjects ate three times more sweet snacks in the U.S.
than they did in the Philippines. This study illustrates that when Filipino women migrate to the
U.S., ethnic foods are modified but not abandoned. Changes of the food habits in the Filipino
women appear to be for the better, nutritionally (Lewis and Glaspy 1975).
3. Studies on the Dietary Patterns of Chinese Immigrants
The diet of the typical Asian can be characterized as low fat, especially
low in animal fat, and higher in fiber than a typical U.S. western diet (Yu et al.
1991, Guldan et al. 1991). During the last 19-20 years, several Asian areas have
been undergoing industrialization and rapid economic change. Concurrent with
this industrialization is a westernization of the dietary pattern (Lee et al. 1989,
Kodama et al. 1991).
Since the middle of the nineteenth century, Chinese people have been coming to the
United States and entering its institutions of higher learning to pursue academic degrees. While
they are learning a new language and adapting to different types of people, food is in a unique
position that both links them with their mother culture and provides a chance for total relaxation
and enjoyment. A study which investigated the changes in food habits of Chinese persons moving
to Lincoln, Nebraska reported that, the longer the Chinese had lived in this country, the more
changes in food habits they had made, especially when the people had American food experience
before coming to the United States. In this study, changes in the lunch pattern were clearly

20
observed. A traditional Chinese lunch features rice and several dishes of meat and vegetables. A
larger proportion of the subjects reporting eating an American lunch because they often ate outside
of the home for this meal. This study also indicated that American foods were usually not accepted
and eaten in their natural style by these immigrants. Rather, these foods were modified according
to the flavor and texture preferences of the Chinese and accepted as a new "Chinese-like" food.
Incorporation of the American foods into the diet and the decreased consumption of Chinese foods
show that a continuous process of changing food habits was going on in this group of Chinese.
The authors anticipated that the longer that the Chinese immigrants remained in the United States
and the greater their exposure to American foods, the more American food habits they will adopt
(Yang and Fox 1979).
Another study also found that Asian students changed their eating patterns after living in
the United States (Pan et al. 1999). They observed that most of the students skipped their
breakfast, increased frequency of consumption of salty and sweet snack items, and decreased the
frequency of consumption of vegetables, which could have undesirable long-term health effects on
the students. Significant increases were also noted in consumption of fats, sweets, dairy products,
and fruits. Significant decreases were noted in the consumption of meat/meat alternatives and
vegetables after immigrating to the United States. The authors hypothesized that possible
explanations for the dietary changes included an increase in the number of men preparing food,
limited time to prepare traditional dishes because of busy school schedules, financial constraints
because of the limited amount of money to spend on food, and increased availability of other
American-style foods.
4. Dietary Beliefs of Chinese
21
Many Chinese people living in the United States continue to observe diet and health
practices from their mother country. Chinese folk beliefs propose that elemental forces control the
universe and pervade all aspects of human endeavor (Chang 1974). Two opposing components,
the Yin and the Yang, regulate the universe. The Yin component includes female, darkness, cold,
and emptiness. An excess of Yin causes the person to be prone to infection, gastric problems and
to be unusually anxious. The Yang component encompasses male, light, warmth, and fullness.
Too many “Yangs” are believed to cause the person to become dehydrated, feverish and become
irritable and edgy. The common ginger root is considered a "hot" food to prevent and treat nausea
and dyspepsia. And the common "cold" food such as white turnips, seaweed and bean spouts must
be eaten in limited amounts. Appropriate herbal or root medicine is also given to help counter
many illnesses. Chinese medication is thus largely oral, consisting of a balanced diet of "hot" and
"cold" foods, and of herbs and roots for their "heating" and "cooling" effect (Chang 1974 and
Chan 1995). Some symbolic foods are given for medical reasons. For example, relatives may feed
a person who has heart disease soup that contains the heart of a pig. Western medicine would
perceive this as potentially dangerous because of its high cholesterol content, contraindicated in
such a condition (Chan 1995).
The dietary preference for an ordinary Chinese meal consists of cooked rice and sung,
which literally means "topping for rice". Sung may include seafood, meat or vegetable dishes.
Rice is the staple of the traditional diet. The older generation believes that rice is the only form of
real energy and vitality, asserting that a meal without rice just isn't a meal. Rice can be ground into
flour and made into noodles, cakes and other delicacies. Because of the history of unsanitary
conditions in China and Hong Kong, vegetables are very rarely taken raw. As a result, few
Chinese people eat vegetable salads. Vegetables are cooked, preferably on their own or mixed
22
with meat, or as an ingredient in a soup. Some older Chinese who have been used to having to boil
their drinking water for sanitary reasons often avoid cold water (Chan 1995).
The Chinese like all kinds of seafood and meats. This ranges from fish and chicken, to
sea cucumber, abalone and internal organs. Unlike the Japanese culture, raw meat of any source is
thought to cause ill health, and is avoided. All meal is cooked thoroughly before being eaten.
Many elderly Chinese people have not yet acquired a liking for the taste of cheesy and creamy
foods. Because many Asians are lactose intolerant, it might be expected that the elderly Chinese
exhibit a low frequency of consumption of milk (Chau et al. 1990).
It is common knowledge that the preparation of Chinese food requires the use of soy
sauce (Chang 1974). The main herbal flavorings, which the Chinese use, are star anise, coriander,
nutmeg, ginger, garlic, spring onions, and soybean ferments. Dried beans and nuts, salad and
preserved vegetables, fish and shellfish are commonly eaten. There are relatively few concentrated
sweets in the Chinese diet (Chan 1995).
Chinese people have a strong preference for home cooking. It is believed that drinking
the soup can clear the system and promote a speedy recovery, especially after surgery. Other
drinks include herbal teas made from dried flowers or grasses (such as chrysanthemum), which are
believed to have a "cooling" effect on the body (Chan 1995). For Chinese people, food forms the
foundation of their philosophy to life and is believed to give physical, social and spiritual benefits.
A good diet is regarded as essential for good health (McAllister and Farguhar 1992).
5. The Health Risks Faced by Chinese Immigrants
The epidemiological studies dealing with immigrant or indigenous populations in
transition implicate dietary change as one factor in the etiology of cardiovascular disease, obesity,
cancer and periodontal disease. Food pattern changes, especially those involving increased use of

23
processed foods, and high in refined sugars and fat have been implicated as risk factors for these
diseases in many groups. Processed and high fat foods often substitute for nutrient rich traditional
foods (Hrboticky and Krondl 1985). Environmental factors are important determinants of serum
lipid levels in Chinese (He et al. 1996).
Fang, Madhavan and Alderman (1996) reported that the New York Chinese had higher
death rates for nasopharyngeal cancer than either New York City whites or the Chinese in China.
Stomach and liver cancer death rates in New York Chinese fell between those in China and New
York City whites. Cancer rates in immigrant populations are frequently found to be intermediate
between the country of origin and the adopted country. However, the rates of esophagus, colon,
and rectum cancers were closer to those of New York City whites. This finding provides
additional support for the concept that many cancers originate with and can be modified by
environmental factors when cultures migrate (Stellman and Wang 1994).
The incidence of breast cancer varies widely among countries, with rates consistently
higher in western countries than in Asia. There are numerous studies which have demonstrated
that, when Chinese and other Asian women migrate to the United States, their risk of breast cancer
rises over several generations and approaches that in U.S. whites. Overall, Asian-American
women born in the West had a risk of breast cancer 60% higher than those born in the East. On the
basis of these international comparisons and migrant studies, modifiable exposures related to
lifestyle or environment are thought to play a major role in the etiology of breast cancer. The
specific causal factors, which are related to diet, need to be investigated. Exposure to western
lifestyles appears to have a substantial impact on breast cancer risk in Asian migrants to the United
States during their lifetime (Ziegler et al. 1993).

24
The western lifestyle (high caloric intake, physical inactivity, obesity, smoking, and
drinking) associated with the colorectal cancer has been investigated. Findings suggest that a high-
energy intake, large body mass, and physical inactivity independently increase risk of this disease
and that a nutritional imbalance, similar to the one involved in diabetes, may lead to colorectal
cancer (Le Marchand et al. 1997).
6. Chinese People Dietary Survey----Which Nutrients Have Low Intakes
The availability of various foods has increased thanks to rapid economic development in
China in recent years. The incidence of cardiovascular disease, cerebrovascular disease and
cancer, has also risen significantly. Mortality from cerebrovascular and cardiovascular diseases
and cancer accounted for 73% of total deaths in Tianjin in 1989. Tian et al (1995) found that this
population has low intakes of vitamin A, calcium, riboflavin, and zinc. Because of their high
intake of sodium, their sodium: potassium ratio was very high. Cholesterol intake was much
higher among the urban people. The study suggests that integrated nutrition intervention is needed
to prevent insufficient intake of some nutrients and control dietary risk factors related to chronic
diseases. The nutrient content of some common Chinese foods are presented in Table 1.
Table 1. Nutrient Content of Chinese Foods
Vitamin
Cal
orie
s
Pro
tein
Fat
Cal
cium
iron
Food items(the nutrient analysis isbased on the 100 g)
(Cal) (g) (g) (mg) (mg)A
(I.U.)B1
(mg)B2
(mg)C
(mg)
Bread/cereal/grain/starchesBrown rice 340 6.7 2.0 21 1.5 0 0.30 0.05 4.6
Chinese noodles 131 1.8 1.0 19 1.2 0 0.01 + 0.4Dasheen 75 1.5 0.2 34 1.0 0 0.08 0.04 8Gluten, fried 114 17.9 0.2 11 1.0 0 0.03 0.02 0.8Bread/cereal/grain/starchesSteamed bread 247 8.1 1.2 21 0.4 0 0.05 0.02 _

25
White rice 354 6.5 0.5 15 0.6 0 0.11 0.04 1.4Legumes/beans/seeds and nutsTofu 65 6.4 4.2 91 1.3 0 0.07 0.02 0Soybean, fresh 132 11.2 6.4 50 4.6 + 0.59 0.14 8Meat and poultry productsDumping(pork inside) 227 8.4 11.4 18 0.7 10.00 0.14 0.11 0.4Ham 524 19.0 49.0 21 3.1 0 0.31 0.13 0Liver(chicken, pork) 129 20.0 4.0 10 10.2 15000 0.4 2.7 11Meat ball 231 16.5 18.5 10 0.6 13.0 0.29 0.12 _Pig's blood, cooked 18 4.0 0.1 7 12.6 200 0.06 0.05 0Pig's feet 223 21.7 14.4 55 1.0 15.0 0.16 0.15 1.0Pig's intestine 68 10.4 2.5 6 1.5 _ 0.11 0.10 0Pork or fish dried andcrushed
352 53.6 10.4 53 10.5 _ 0.25 0.27 0
Pork fat 823 3.0 89.0 1 0.2 _ 0.19 0.04 0Pork sausage 359 36.6 18.7 28 3.9 _ 0.82 0.31 0Fish and marine productsKelp 91.6 0.2 5.3 146 0.6 180 0.02 0.01 2
Vitamin
Cal
orie
s
Pro
tein
Fat
Cal
cium
IronFood items
(the nutrient analysis isbased on the 100 g)
(Cal) (g) (g) (mg) (mg)A
(I.U.)B1
(mg)B2
(mg)C
(mg)
Fish and marine productsLaver dried 10.3 0.8 42.0 850 98.9 _ 0.34 0.38 _VegetablesGarland chrysanthemum 12 1.6 0.1 53 2.3 7500 0.05 0.08 14Lily flower, dried 254 8.5 2.5 340 14.0 7000 0.16 0.71 _Mushrooms, Chinese 129 15.2 1.7 125 9.0 0 0.56 2.11 0Mango 40 0.4 0.2 12 0.3 1320 0.03 0.03 21Carambola 22 0.2 0.4 3 0.7 650 0.03 0.02 39BeveragesJasmine tea, leaves 263 24.1 3.5 320 31.6 14000 0.07 0.79 85
Reference: http:// www.doh.gov.tw/org2/b3/database/ Tung et al. 1961. Composition of foods used in Taiwan. J Formosan Med Assoc. 60: 973-1005.
The Chinese foods, which were chosen for this study, were similar to those used in the
study by the Lee et al. 1992(I) and 1992(II). These researchers focused on foods predictive of the
intake of total calories, protein, fat, vitamin A, riboflavin, thiamin, vitamin C, and calcium. White

26
rice is the number one predictor food for caloric intake from a dietary intake in Taiwan, 1980-
1981. Rice is the most important staple food in Taiwan. Other foods like steamed foods and
Chinese pork sausages are also among the top ten major predictor foods for caloric intake.
Chicken leads the list of the major predictor foods for protein intake. Polished rice is the second
major protein intake from the list. Medium-fat pork and lean pork are the third- and fourth-ranked
foods. Pork, dried and crushed is included in the list of major predictor foods for protein intake.
Pork, medium-fat leads the list of the predictor foods for fat intake, pig feet, pork sausage, gluten
fried, pig intestine, lychees and soybean curd are all among the top 20 major predictor foods for
fat intake from a dietary survey in Taiwan (Lee et al. 1992).
Chicken liver is the top vitamin A predictor, although its contribution to the average
vitamin A intake was only 8.8%. Several vitamin A- or vitamin C- rich fruits (mangoes, papaya),
dark green vegetables (sweet potato leaves, Chin-Chian Bo-Tsai, mustard greens), green tea leaves
and other types of liver also appeared in the top 20. Enriched rice (brown rice) was the best
predictor food for vitamin B1, explaining 67% of the vitamin B1 variation, although its absolute
contribution to vitamin B1 intake is small (3.2%). Medium-fat pork (13.1%), lean pork (12.6%),
polished rice (23%) and pork sausage (2.3%) ranked the second to the fifth in contribution to
vitamin B1 intake. Approximately 92% of the B1 variation can be accounted for by these five
foods that correspond to only 54.2% of mean vitamin B1 intake. Enriched rice again topped the
vitamin B2 predictor list. Chicken liver, pork liver, dried Chinese mushrooms were the second to
fourth contributors. Fruits ranked at the top in predicting vitamin C intake. The first five foods
were guavas, oranges, papayas, lychees, and mangoes. Dried small fish and soybean curd are
among the top ten foods in predicting calcium intake (Lee et al. 1992).
7. Food Frequency Questionnaire

27
Food Frequency Questionnaires (FFQs) have become widely used, particularly in
epidemiologic research of chronic diseases, to characterize the dietary intakes of individual study
participants. Such questionnaires are appealing because they are designed to measure usual or
long-term intake, which is a more relevant determinant of chronic disease than are actual measures
of recent diet (Feskanich et al. 1993). There are numerous FFQs essentially consisting of two
parts: a list of foods or food groups and a set of response options indicating how often foods or
food groups are consumed during a specific time period. The list of foods may vary considerably,
from a brief list focusing on a specific nutrient to a list of several hundred foods designed to assess
the total diet. The frequency of response options may be general (e.g., "often," "sometimes,"
"never") or more elaborate and specific (e.g., number of servings per day, per week, per month).
Finally, the period of recall may vary, normally from one month to one year, and may be the
period preceding the completion of the questionnaire or at some distant time (Wright and Guthrie
1995).
Various food questionnaires are termed semiquantitative in that they ask respondents
questions about portion size. Some questionnaires ask respondents to describe a " typical" portion
size, the amount of a "medium" serving, or indicate whether their intake of a food are "small",
"medium", or "large", and others use pictures to illustrate different portion sizes (Wright and
Guthrie 1995).
FFQs are considered cost-effective tools for dietary data collection. They can be self-
administered; interviewer administered to individuals or by telephone, or administered using
computerized precoded questionnaires. There are concerns about the cognitive demands of FFQs,
which require both memory and use of mathematical computations. FFQs make demands on long-
term memory. Questionnaires that ask about portion sizes require more judgments on the part of
28
respondents. FFQs are useful in describing intake of foods that may be consumed periodically but
less able than food recalls or records to elicit information about intake of specific foods and
amounts (Wright and Guthrie 1995). Some under and over reporting may occur. Studies of women
indicated that the foods most often over reported were fruits and vegetables; meat and dairy
products were most often underreported (Feskanich et al. 1993).
A semiquantitative dietary history questionnaire detected associations between diet and
colorectal cancer among Chinese in China and in North America. In a subsequent study, a
modified version of this semiquantitative dietary history questionnaire was used with the Chinese
people in Taiwan and was concurrently validated for the study of the Chinese population. The
instrument, to be used in a face-to-face interview lasting not more than 30 minutes on average,
consists of a list of 84 food items. Portion size was asked only for food items frequently consumed
(more than once a week). To help respondents describe more precisely their usual portion size,
specially designed three-dimensional, actual-size food models representing the mixed dishes and
single food items were used during the interview. Major sources of error associated with the
semiquantitative dietary history questionnaire include recall, perceptions of usual portion size, and
possibly the restrictions imposed by a fixed list of food items. Multiple diet records over time are
often used for validating a food frequency questionnaire, because they are the least likely to
involve dependent errors. Therefore, the selection or design of a dietary standard reference
remains a challenge (Lee et al. 1994).
8. 24-Hour Recall
The twenty four-hour food recall obtains a more qualitative dietary assessment. When
subjects are instructed to provide good information, self-administrated recalls may be acceptable.
The 24-hour recall has become a favored way of obtaining dietary data. It requires only about 15

29
to 20 minutes of interview time. It is often taken at an unannounced time or with no prior
indication of the nature of the data to be requested. Time and place of food consumption may be
important factors to consider when developing nutrition care plans and designing therapeutic and
educational interventions. Questions about vitamin and mineral supplement use are sometimes
included in surveys but are seldom included in the computed data on vitamin and mineral intake. It
is often difficult to quantify supplement intake data because clients may not remember what they
use may use supplements irregularly, or because the actual nutrient content of supplements may be
uncertain. However, information about supplement use may be helpful in reviewing dietary
adequacy (Wright and Guthrie 1995).
Sometimes questionnaires are used to ask about the type of fat used in cooking meat, fish,
and vegetables, and the consumption of visible fat on meat and skin on chicken. Although
seasonal fruits and vegetables are not separated into "fresh in season", "canned", or "frozen"
categories, participants may be instructed to state the frequency of consuming fruits and
vegetables in season and not in season (Lee et al. 1994).
The 24-hour recall method is subject to criticism about accuracy. Some people may lack
the cognitive ability to recall foods eaten, some may have little awareness of what they eat, and
others may recall a "good" diet rather than what was actually eaten. Foods that are viewed as
unacceptable (e.g., alcohol, fats) may be selectively forgotten. It is important that a nutritionist be
well trained in conducting interviews and avoiding leading questions and verbal and nonverbal
cues that appear to be judgmental about the recalled diets. Various aids are used to help with
portion size estimation. These include measuring utensils, food models and pictures of foods or
utensils. Multiple days of recall can improve estimates of an individual's usual intake (Wright and
Guthrie 1995).

30
9. Implications for Future Research
A few studies have reported on changes in dietary patterns among
different immigrant groups (Pan et al. 1999). However, limited data on dietary
intake of Asian students living in the U.S are available. An understanding of food
intake of Asian students is important in the development of nutrition education
programs for these immigrants.

31
CHAPTER THREE
RESEARCH DESIGN AND METHODOLOGY
1. Human Subjects Consent Form
Methods and data collection instruments and consent forms used in this research study
were approved by the all University Institutional Review Board Subcommittee. The consent form
shown in Appendix B informs the subject that their participation is voluntary, that the data
collected will be held in the strictest confidence, and that the subject may withdraw at any time.
2. Description of the Sample
The subjects recruited for this study were Taiwanese students enrolled at the University
of Wisconsin-Stout. The list of the Taiwanese students was obtained from the Taiwanese Student
Association. Potential subjects from this list were contacted by phone to ascertain their willingness
to participate in the study. A total of twenty-three Taiwanese students expressed interest. The
cover letters, which explained the interview process, were then mailed to the potential subjects
(Appendix C). A face to face interview was then conducted to complete the data collection
instruments.
3. Development of the Questionnaire
One 24-Hour Recall Form, Supplementary Questions, which obtained information about
supplement use and fat consumed, and two Food Frequency Questionnaires were used in this
study.
a) 24-hour Recall Form:
The purpose of the 24-hour Recall Form (Appendix D) in this study was to evaluate the
accuracy of the United States food frequency questionnaire. The 24-hour recall form included

32
basic questions about food intake for the past 24 hours. The recall was obtained by face-to-face
interview. The subjects were asked to recall all food eaten the day before and to estimate
quantities in ordinary household measures or by shape or by dimensions. The 24-Hour Recall
Form which was developed and used was very similar to the "Dietary Intake Recall Form:
Beltsville Human Nutrition Research Center, USDA" (Frances and Thompson 1994).
b) The Method to Collect Data from the 24-Hour Recall Form:
Several strategies that are recommended for helping a client recall food intake were
utilized in this study. First, it is important that the interviewer be well trained in conducting
interviews and in avoiding leading questions as well as verbal and nonverbal cues that appear to be
judgmental about the recalled diets. The interviewer obtained training by utilizing a
videorecording, which the Oklahoma Cooperative Extension Service (Joyce and Williams 1998)
has made available. The video described appropriate interviewing skills for the diet interview. A
multiple-pass method was recommended to increase retrieval of memory. The client is first asked
to recall all foods eaten in the previous 24 hours but not necessarily to describe them or to give
amounts. The client may use memory guides such as time and place of eating. In the next pass, the
interviewer begins to ask more probing questions about the type of food and amount. In a final
pass, the interviewer will say, "Now I will read to you what I have written (recorded) about the
foods you ate and the amounts. Let me know if I have done so correctly."
Various aids can also be used to help with the portion size estimation. These aids include
measuring utensils, food models and pictures of foods or utensils (Wright and Guthrie 1995). The
interviewer/researcher choose measuring utensils and pictures of food published by the American
Dietetic Association for the visual aid of the American foods (Hess 1997). The portion size of

33
Taiwanese food came from "Diet by Calorie Method" (Chan et al. 1998), "Portion Photo of Food
Exchange Handbook" (Chan et al. 1994), and "Food & Cooking Data" (Hayawakari 1997).
c) 24-hour Recall Supplementary Questions:
Several questions were included in the "24-Hour Recall Supplementary Questions"
(Appendix E) in order to obtain additional information to supplement the actual food recall. One-
third to one-half of Americans consume vitamin and/or mineral supplements regularly. About 70
percent have taken multivitamin and mineral supplements. It is often difficult to quantify
supplement intake data because clients may not remember what they use, they may use
supplements irregularly, and the actual nutrient content of supplements may be uncertain.
However, information about supplement use may be helpful in reviewing dietary adequacy
(Wright and Guthrie 1995). In this study, supplement data was collected to investigate if the
Taiwanese students take vitamin supplements in the United States.
The 24-Hour Recall Supplementary Questions Form in this study was patterned after two
studies. One resource used was Nutrition Assessment (Wright and Guthrie 1995). The rest of the
questions were selected from "A semiquantitative dietary history questionnaire for Chinese
Americans" (Lee 1994).
Questions were utilized to discern the type of fat used in cooking meat, fish, and
vegetables, and whether the participant consumed visible fat on meat or the skin on chicken. These
data can help reconfirm the accuracy of the client reports of their dietary habits (Lee et al. 1994).
d) Food Frequency Questionnaire
The same Food Frequency Questionnaire but with different titles and
instructions was administered at two different times. One asked about the food
intake in the participants' home country before attending the University of

34
Wisconsin-Stout (Appendix F). The other asked about the food intake after
coming to the University of Wisconsin-Stout (Appendix G). The food frequency
list was developed to determine the average number of times each day, week or
month specific food items were consumed. Food items chosen for inclusion in the
food list represented foods investigated in other research articles (Feskanich et al.
1993; Lee et al. 1994; Lee et al. 1992(I); Lee et al. 1992(II); Hrboticky and
Krondl 1985). Food items chosen for the Food Frequency Questionnaire were
based on the most popular American food and Chinese food available in the
oriental store near the university or in the supermarkets within the study area.
Other food items that reflect the average intake in Taiwan were chosen from two
research articles (Lee et al (I); Lee et al (II), 1992) that indicated the most popular
food in each of the different nutrient food groups. For example, chicken or pork
liver were selected because they are the vitamin A rich foods commonly eaten in
Taiwan. Food items were categorized according to the food type such as sweets,
beverages, dairy, or meats (Tung et al. 1961). Nutrient values of Chinese foods
were obtained from Taiwanese or Japanese reference books "Department of
Health. The Executive Yuan" (From http://www.doh.gov.tw/org2/b3/database),
"Composition of foods used in Taiwan" (Tung et al. 1961), "Food and Cooking
Data" (Hayawakari 1997). These nutrient values were then input into the Food
Processor Plus software program for subsequent analysis.

35
4. Data Analysis
a) Food Intake Analysis
The food processor plus nutrition analysis program, version 5.0; based on the latest
USDA data plus over 800 additional scientific sources, was used to analyze the daily intake of
total energy, carbohydrate, protein, total fat, cholesterol, total vitamin A, thiamin, riboflavin,
vitamin B6, vitamin B12, vitamin C, vitamin E-tocopherol equivalents, calcium, and iron from
both the 24-hour recall and the two food frequencies.
The foods on the food frequency questionnaire represented a core of nutrients to
compare. Participants were asked the frequency of intakes and serving size for each of the foods
listed. The frequency referred to daily, weekly, monthly, or never. If a food item intake frequency
was seven times per week, it would be considered as the same intake frequency as once per day. If
a food intake frequency was once monthly, the daily intake frequency would be 1/30. The food
intake frequency data then was converted to estimate the specific daily nutrient intakes (Yang
1994).
b) Statistical Analysis
The Statistical Package for the Social Sciences (SPSS for Windows, release 4.1, 1993, SPSS,
Chicago III) was used for data analysis. Mean values were compared using paired-samples t tests.
A P value of .05 or less was considered statistically significant. Results were reported as mean +
standard deviation.

36
CHAPTER FOUR
RESULTS OF THE STUDY
1. Background Information
The purpose of this study was to identify the changes in the food intake of
Taiwanese students at the University of Wisconsin-Stout compared to their food
intake before they came to the United States. A total of twenty-three Taiwanese
students indicated their interest in the study and served as the primary sample.
Subjects were asked to complete one 24-hour recall and two food frequency
questionnaires. Nutrients, which were investigated, included calories, protein, fat,
vitamin A, thiamin, riboflavin, vitamin C, calcium and iron. The 24-hour recall
determined the food intake of the subjects for the 24-hours previous to their
interview. Two food frequency questionnaires were used. One food questionnaire
determined the frequency of the subjects’ food consumption the year before they
came to the United States. The second food frequency determined the frequency
of food consumption after the subjects came to the University of Wisconsin-Stout,
Menomonie WI.
2. Characteristics of Subjects
There were 15 people (65% of the primary sample) who participated in this study. Table
2 presents the characteristics of the sample. The average age was 25.2 years old (SD + 2.18) and
the subjects' ages ranged from 22 to 29 years old. The average weight was 114.3 lb. (SD + 18.30)

37
and the weight of the subjects ranged from 95 lb. to 165 lb. The average height of the participants
was 63.3 inches (SD + 0.25) and the height ranged from 61 inches to 69 inches. The activity level
of most of the subjects was sedentary (47%); five of the participants were lightly active (33%),
and three were moderately active (20%). The average body mass index was 20 (SD + 1.82) and
ranged from 16.8 to 24.4. Of the 15 participants, 13 were female (87%) and two were male (13%)
(see figure 1).
Figure 1. A graphic display of the gender of the Taiwanese participants
87%
13%
Male
Female

38
Table 2. Characteristics of Subjects
Characteristics N % Mean Std. Dev.Total 15 100.0Gender
Male 2 13.3Female 13 86.7
Age (yrs old) 25.20 2.18<25 9 60.0>25 6 40.0
Weight (lb.) 114.3 18.30<100 3 20.0
100~110 6 40.0111~120 3 20.0
>120 3 20.0Height (In.) 63.3 .25
61 3 20.062 3 20.063 6 40.064 1 6.769 2 13.3
ActivitySedentary 7 46.7
Lightly active 5 33.3Moderately active 3 20.0
Body mass index 20.0 1.8217.1~19.0 5 33.319.1~21.0 6 40.021.1~23.0 3 20.0
>23.1 1 6.7

39
3. Comparison of Calories, Macronutrients and Cholesterol
The comparison of calories, macronutrients and cholesterol between the
24-hour recall in the United States and the food frequency in the United States is
shown in Table 3. There were no significant differences in the calories,
macronutrients (protein, carbohydrate, and fat) and cholesterol between 24-hour
recall in the United States and the calculated values from the food frequency in
the United States. In addition, the comparison of these macronutrients expressed
as a percentage of the RDA or of the recommended, as is case for carbohydrate,
fat and cholesterol, showed no significant differences between the 24-hour recall
and the food frequency questionnaire of food consumed in the United States.
Table 4 depicts the comparison of calories, macronutrients and cholesterol
calculated from the food frequency questionnaire of foods consumed in the
United States to the values calculated from the food frequency questionnaire of
food consumed in Taiwan. The protein calculated from the Taiwan food frequency
questionnaire was significantly higher (P=0.002) compared to the protein
calculated from the United States food frequency questionnaire, 94g and 61g,
respectively. Similarly, the percentage of protein compared to the RDA was also
significantly higher (P=0.003) for the Taiwan food frequency questionnaire
compared to the United States food frequency questionnaire, 231% and 148%,
respectively. Cholesterol calculated from the Taiwan food frequency questionnaire
40
was not significantly different from the United States food frequency
questionnaire, 384 mg and 301 mg, respectively, but did show a strong

41
Table 3. Comparison of Calories, Macronutrients and Cholesterol Intake Calculated from the 24-Hour Recall in the United States and theFood Frequency Questionnaire of Food Consumed in the United States.
24 Hour recall United StatesNutrient Mean SD Mean SD T value Sig.
Calories (Kcal/day) 1716 618 1638 474 .352 .730% calories compare with RDA 96 43 87 24 .707 .491Protein(g/day) 74 25 61 19 1.606 .131% protein compare with RDA 183 65 148 45 1.733 .105Carbohydrate (g/day) 238 110 222 68 .455 .656% carbohydrate compare with recommended 92 52 81 21 .844 .413Fat (g/day) 52 22 56 23 -.377 .712% fat compare with recommended 87 42 89 37 -.121 .905Cholesterol (mg/day) 301 168 301 139 .014 .989% cholesterol compare with recommended 101 56 100 46 .018 .986


43
Table 4. Comparison of Calories, Macronutrients and Cholesterol Calculated from the Food Frequency Questionnaire of Foods Consumedin the United States Compared to Values Obtained from the Food Frequency Questionnaire of Food Consumed in Taiwan.
United States TaiwanNutrient Mean SD Mean SD T value Sig.
Calories (Kcal/day) 1638 474 1907 661 -1.416 .179% calories compare with RDA 87 24 102 30 -1.662 .119Protein(g/day) 61 19 94 36 -3.857 .002∗% protein compare with RDA 148 45 231 101 -3.524 .003∗Carbohydrate (g/day) 222 68 243 86 -.683 .505% carbohydrate compare with recommended 81 21 89 25 -.856 .406Fat (g/day) 56 23 63 27 -1.131 .277% fat compare with recommended 89 37 100 39 -1.158 .266Cholesterol (mg/day) 301 139 384 149 -1.970 .069% cholesterol compare with recommended 100 46 128 50 -1.973 .069
∗ Values are considered significantly different at P< 0.05

44
tendency (P=0.069) to have significant difference. Compared to the recommended, the percentage of
cholesterol from the Taiwan food frequency questionnaire also showed a strong tendency (P=0.069) to be
greater than the percentage calculated from the United States food frequency questionnaire, 128% and
100%, respectively. The calculated intake and percent of the recommended of calories, carbohydrate and
fat as reflected in the Taiwan food frequency questionnaire was not significantly different from that
calculated from the United States food frequency questionnaire.
A comparison of calories, macronutrients and cholesterol intake calculated from
the 24-hour recall in the United States and the food frequency questionnaire of foods
consumed in Taiwan is presented in Table 5. Similar to the comparison of the 24-hour
recall to the Taiwan food frequency questionnaire, there were no significant differences in
the percentage of recommended or calculated values for calories, carbohydrate, fat, and
cholesterol. The grams of protein (94 g) calculated from the Taiwan food frequency
questionnaire showed a weak tendency (P=0.132) to be higher than the 24-hour recall (74
g). This trend was also evident when protein was expressed as a percentage of the RDA,
231% and 183%, respectively, for the Taiwan food frequency questionnaire and the 24-
hour recall.

45
Table 5. Comparison of Calories, Macronutrients and Cholesterol Intake Calculated from the 24-Hour Recall in the United States and theFood Frequency Questionnaire of Food Consumed in Taiwan.
24 Hour recall TaiwanNutrient Mean SD Mean SD T value Sig.
Calories (Kcal/day) 1716 618 1907 661 -.698 .497% calories compare with RDA 96 43 102 30 -.438 .668Protein(g/day) 74 25 94 36 -1.600 .132% protein compare with RDA 183 65 231 101 -1.566 .140Carbohydrate (g/day) 238 110 243 86 -.118 .908% carbohydrate compare with recommended 92 52 89 25 .217 .832Fat (g/day) 52 22 63 27 -1.013 .328% fat compare with recommended 87 42 100 39 -.836 .417Cholesterol (mg/day) 301 168 384 149 -1.235 .237% cholesterol compare with recommended 101 56 128 50 -1.233 .238

46
4. Comparison of Vitamin A, Thiamin (B1), Riboflavin (B2), Vitamin B6 and Vitamin
B12
Table 6 compares vitamin A and the vitamin B complex (thiamin, riboflavin,
vitamin B6, and vitamin B12) calculated from the 24-hour recall in the United States to
the food frequency questionnaire in the United States. Vitamin A was the only vitamin
which was significantly different (P=0.015) in this comparison, 594 RE and 981 RE,
respectively. Similarly, the percent RDA of the 24-hour recall was significantly lower
(P=0.017) for the United States food frequency questionnaire, 74% and 119%,
respectively.
The comparisons of vitamin A and the B complex vitamins from the food frequency questionnaire
of food consumed in the United States to the food frequency questionnaire of foods consumed in Taiwan
are presented in Table 7. Thiamin intake (1.72 mg) from the Taiwan food frequency questionnaire was
significantly higher (P=0.006) than the thiamin intake (1.20 mg) calculated from the United States food
frequency questionnaire. Similarly, vitamin B6 (1.83 mg) calculated from the Taiwan food frequency
questionnaire was significantly higher (P=0.017) than the vitamin B6 (1.3 mg) calculated from the United
States food frequency questionnaire. And the vitamin B12 (6.74 mcg) calculated from the Taiwan food
frequency questionnaire was also significantly higher (P=0.001) compared to the vitamin B12 (3.34 mcg)
calculated from the United States food frequency questionnaire. The percentage of the RDA for thiamin,
vitamin B6, and vitamin B12 on the United States food frequency questionnaire (118%,

47
Table 6. Comparison of Vitamin A, Thiamin (B1), Riboflavin (B2), Vitamin B6 and Vitamin B12 Intake Calculated from the 24-HourRecall in the United States and the Food Frequency Questionnaire of Food Consumed in the United States.
24 Hour recall United StatesNutrient Mean SD Mean SD T value Sig.
Vitamin A (RE/day) 594 500 981 735 -2.780 .015∗% Vitamin A compare with RDA 74 63 119 92 -2.709 .017∗Thiamin (B1) (mg/day) 1.27 .59 1.20 .42 .505 .621% Thiamin-B1 compare with RDA 129 66 118 42 .764 .458Riboflavin (B2) (mg/day) 1.33 .38 1.37 .45 -.264 .795% riboflavin-B2 compare with RDA 112 38 113 38 -.059 .954Vitamin B6 (mg/day) 1.54 .86 1.30 .48 1.091 .294Vitamin B6 compare with RDA 95 55 79 31 1.124 .280Vitamin B12 (mcg/day) 2.92 1.87 3.33 1.41 -.868 .400Vitamin B12 compare with RDA 146 94 167 71 -.870 .399
∗ Values are considered significantly different at P< 0.05

48
Table 7. Comparison of Vitamin A, Thiamin (B1), Riboflavin (B2), Vitamin B6 and Vitamin B12 Calculated from the Food FrequencyQuestionnaire of Foods Consumed in the United States Compared to Values Obtained from the Food Frequency Questionnaire of FoodConsumed in Taiwan.
United States TaiwanNutrient Mean SD Mean SD T value Sig.
Vitamin A (RE/day) 981 735 1050 606 -.362 .723% Vitamin A compare with RDA 119 92 127 69 -.320 .754Thiamin (B1) (mg/day) 1.20 .42 1.72 .69 -3.209 .006∗% Thiamin B1 compare with RDA 118 42 169 57 -3.451 .004∗Riboflavin (B2) (mg/day) 1.37 .45 1.51 .76 -.798 .438% Riboflavin B2 compare with RDA 113 38 123 56 -.751 .465Vitamin B6 (mg/day) 1.30 .48 1.83 .82 -2.721 .017∗% Vitamin B6 compare with RDA 79 31 111 48 -2.794 .014∗Vitamin B12 (mcg/day) 3.34 1.41 6.74 2.72 -5.190 .001∗% Vitamin B12 compare with RDA 167 71 337 136 -5.199 .001∗
∗ Values are considered significantly different at P< 0.05

49
79%, and 167%, respectively) was also significantly lower than these values calculated from the Taiwan
food frequency questionnaire (169%, 111%, and 337%, respectively). However, the calculated amounts and
percentage of RDA for vitamin A and riboflavin were not significantly different in this comparison.
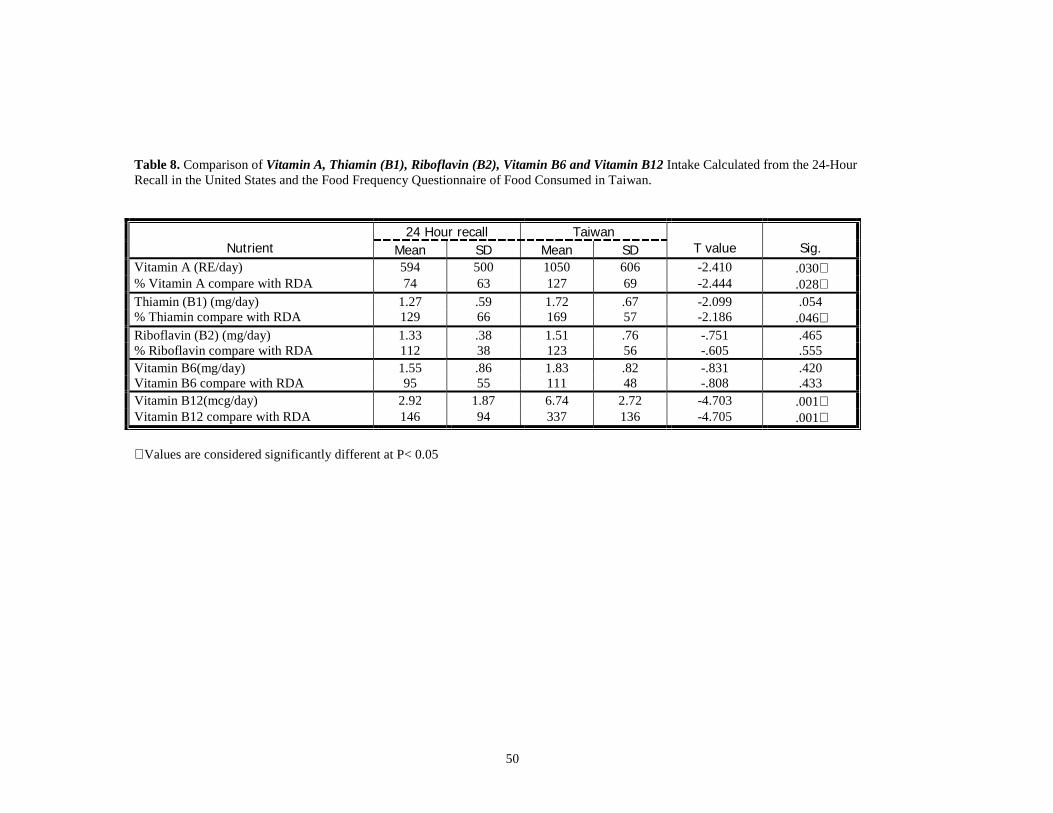
The comparison of vitamin A and the vitamin B complex calculated from the 24-hour recall in the
United States and the Taiwan food frequency questionnaire is presented in Table 8. Vitamin A intake (594
RE) from the 24-hour recall was significantly lower (P=0.03) than the vitamin A intake (1050 RE)
calculated from the Taiwan food frequency questionnaire. Thiamin intake (1.72 mg) calculated from the
Taiwan food frequency questionnaire showed a very strong tendency (P=0.054) to be significantly higher
than the thiamin intake (1.27 mg) calculated from the United States food frequency questionnaire. Vitamin
B12 intake (6.74 mcg) calculated from the Taiwan food frequency questionnaire was significantly higher
(P=0.001) than the 24-hour recall (2.92 mcg). The percentage of the RDA for vitamin A, thiamin, and
vitamin B12 calculated from the Taiwan food frequency questionnaire (127%, 169%, and 337%,
respectively) was significantly higher (P=0.028, 0.046, and 0.001, respectively) compared to the 24-hour
recall (74%, 129%, and 146%, respectively). There was no significant difference in this comparison for the
amount of riboflavin and vitamin B6 consumed or a significant difference in the percentage of the RDA for
these two nutrients.
50
Table 8. Comparison of Vitamin A, Thiamin (B1), Riboflavin (B2), Vitamin B6 and Vitamin B12 Intake Calculated from the 24-HourRecall in the United States and the Food Frequency Questionnaire of Food Consumed in Taiwan.
24 Hour recall TaiwanNutrient Mean SD Mean SD T value Sig.
Vitamin A (RE/day) 594 500 1050 606 -2.410 .030∗% Vitamin A compare with RDA 74 63 127 69 -2.444 .028∗Thiamin (B1) (mg/day) 1.27 .59 1.72 .67 -2.099 .054% Thiamin compare with RDA 129 66 169 57 -2.186 .046∗Riboflavin (B2) (mg/day) 1.33 .38 1.51 .76 -.751 .465% Riboflavin compare with RDA 112 38 123 56 -.605 .555Vitamin B6(mg/day) 1.55 .86 1.83 .82 -.831 .420Vitamin B6 compare with RDA 95 55 111 48 -.808 .433Vitamin B12(mcg/day) 2.92 1.87 6.74 2.72 -4.703 .001∗Vitamin B12 compare with RDA 146 94 337 136 -4.705 .001∗
∗ Values are considered significantly different at P< 0.05

51
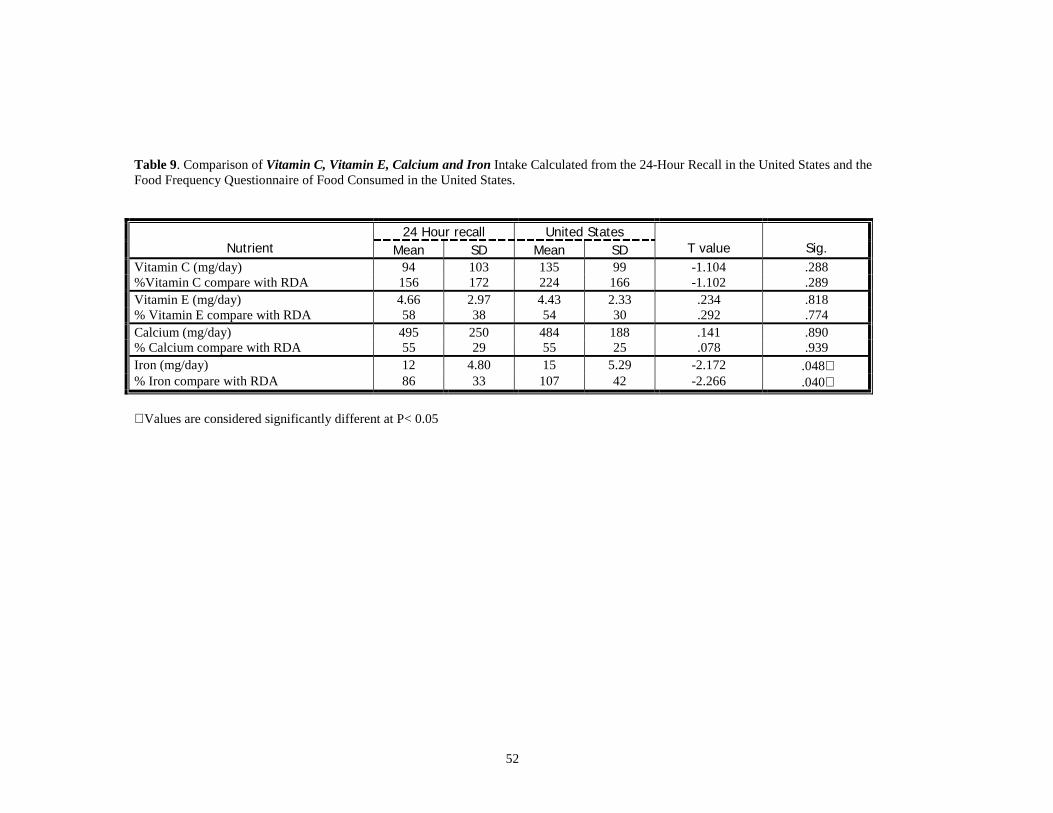
5. Comparison of Vitamin C, Vitamin E, Calcium and Iron
The comparisons of vitamin C, vitamin E, calcium and iron calculated from the 24-hour recall in
the United States and the food frequency questionnaire in the United States are shown in the Table 9. Iron
intake (15 mg) calculated from the United States food frequency questionnaire was significantly higher
(P=0.048) than the iron (12 mg) calculated from the 24-hour recall in the United States. Similarly, when
iron was expressed as a percentage of the RDA, the United States food frequency questionnaire indicated a
significantly higher percentage (P=0.04) than the 24-hour recall, 107% and 86%, respectively. Vitamin C,
vitamin E and calcium showed no difference when the 24-hour recall in the United States was compared to
the United States food frequency questionnaire either in intake or when expressed as a percentage of the
RDA.
The Vitamin C, vitamin E, calcium and iron data calculated from the United States food frequency
questionnaire is compared to the data calculated from the Taiwan food frequency questionnaire in Table 10.
Vitamin E intake (6.91 mg) calculated from the Taiwan food frequency questionnaire was significantly
higher (P=0.013) than the vitamin E (4.43 mg) calculated from the United States food frequency
questionnaire. Similarly, the percentage of the RDA for vitamin E was also significantly higher (P=0.011)
when the Taiwan food frequency questionnaire was compared to the United States food frequency
questionnaire, 83% and 54%, respectively. In the comparison of the United States food frequency
questionnaire to the Taiwan food frequency questionnaire, there were no significant differences in vitamin
C or calcium. Iron
52
Table 9. Comparison of Vitamin C, Vitamin E, Calcium and Iron Intake Calculated from the 24-Hour Recall in the United States and theFood Frequency Questionnaire of Food Consumed in the United States.
24 Hour recall United StatesNutrient Mean SD Mean SD T value Sig.
Vitamin C (mg/day) 94 103 135 99 -1.104 .288%Vitamin C compare with RDA 156 172 224 166 -1.102 .289Vitamin E (mg/day) 4.66 2.97 4.43 2.33 .234 .818% Vitamin E compare with RDA 58 38 54 30 .292 .774Calcium (mg/day) 495 250 484 188 .141 .890% Calcium compare with RDA 55 29 55 25 .078 .939Iron (mg/day) 12 4.80 15 5.29 -2.172 .048∗% Iron compare with RDA 86 33 107 42 -2.266 .040∗
∗ Values are considered significantly different at P< 0.05

53
Table 10. Comparison of Vitamin C, Vitamin E, Calcium and Iron Calculated from the Food Frequency Questionnaire of Foods Consumedin the United States Compared to Values Obtained from the Food Frequency Questionnaire of Food Consumed in Taiwan.
United States TaiwanNutrient Mean SD Mean SD T value Sig.
Vitamin C (mg/day) 135 99 164 104 -1.383 .188%Vitamin C compare with RDA 224 166 274 173 -1.381 .189Vitamin E (mg/day) 4.43 2.33 6.91 2.99 -2.826 .013∗% Vitamin E compare with RDA 54 30 83 33 -2.906 .011∗Calcium (mg/day) 484 188 580 354 -1.043 .315% Calcium compare with RDA 55 25 67 48 -1.099 .290Iron (mg/day) 15 5.29 18 7.00 -1.526 .146% Iron compare with RDA 107 42 128 59 -1.356 .197
∗ Values are considered significantly different at P< 0.05
54
showed a weak tendency to be higher (P=0.146) as calculated from the Taiwan food frequency
questionnaire than the amount calculated from the United States food frequency questionnaire, 18 mg and
15 mg, respectively.
Table 11 compares the intakes of vitamin C, vitamin E, calcium and iron of the 24-hour recall in
the United States to the food frequency questionnaire in Taiwan. Iron intake (18 mg) calculated from the
Taiwan food frequency questionnaire was significantly higher (P=0.028) than the iron (12 mg) calculated
from the 24-hour recall. Calcium and vitamin C showed no significant difference in this comparison,
although vitamin C intake tended to be higher (P=0.097) from the Taiwan food frequency questionnaire
compared to the 24-hour recall (164 mg and 94 mg, respectively). Vitamin E intake also tended to be higher
(P=0.098) as calculated by the Taiwan food frequency questionnaire compared to the 24- hour recall, 6.91
mg and 4.66 mg. Similarly, when expressed as a percentage of the RDA, both vitamin C and vitamin E
determined from the Taiwan food frequency questionnaire also showed a tendency for significance when
compared to the 24-hour recall (P=0.097 and P=0.10, respectively). The percentage of the RDA as
calculated from the Taiwan food frequency questionnaire for vitamin C and vitamin E was 247% and 83%,
respectively, whereas the percentage calculated from the 24-hour recall was 156% and 58%, respectively.

55
Table 11. Comparison of Vitamin C, Vitamin E, Calcium and Iron Intake Calculated from the 24-Hour Recall in the United States and theFood Frequency Questionnaire of Food Consumed in Taiwan.
24 Hour recall TaiwanNutrient Mean SD Mean SD T value Sig.
Vitamin C (mg/day) 94 103 164 104 -1.782 .097%Vitamin C compare with RDA 156 172 274 173 -1.779 .097Vitamin E (mg/day) 4.66 2.97 6.91 2.99 -1.771 .098% Vitamin E compare with RDA 58 38 83 33 -1.763 .100Calcium (mg/day) 495 250 580 354 -.756 .462% Calcium compare with RDA 55 29 67 48 -.873 .397Iron (mg/day) 12 4.80 18 7.00 -2.809 .014∗% Iron compare with RDA 86 33 128 59 -2.442 .028∗
∗ Values are considered significantly different at P< 0.05

56
CHAPTER FIVE
DISCUSSION
1. Nutrient Intake
A. Calories, Macronutrients and Cholesterol Intake of Taiwanese Students
The comparison of calories and protein expressed as percentage of the RDA as well as cholesterol,
fat and carbohydrate expressed as percentage of the recommended is shown in Figure 2. The percentage of
the RDA of protein calculated from the Taiwan food frequency questionnaire was significantly higher
(P=0.003) compared to the protein calculated from the United States food frequency questionnaire. And the
percentage of the RDA of protein calculated from the 24-hour recall shows no significant difference
compared to that obtained from the United States food frequency questionnaire. The similarity of the 24-
hour recall to the United States food frequency questionnaire demonstrates that the calculated protein from
the United States food frequency questionnaire does reflect actual protein intake. However, the 24-hour
recall compared to the Taiwan food frequency questionnaire did not show this significant difference, which
may be due to the large standard deviation (183% + 65% and 231% + 101%, respectively). There were no
significant differences in the percentage of RDA for calories or percentage of the recommended for
carbohydrate, fat and cholesterol when comparisons were made among the 24-hour recall, the United States
food frequency questionnaire and the Taiwan food frequency questionnaire.
The calculated values from the Taiwan food frequency questionnaire indicated

57
aaa
ab
a aa
a
b
a
a
aa
a
a
0
50
100
150
200
250
Calories Protein Carbohydrate Fat Cholesterol
Nu
trie
nt
Per
cen
tag
e o
f R
DA
/Rec
om
men
ded
24-hour recall in USA
In USA
In Taiwan
Figure 2. Comparison of calories, protein, carbohydrate, fat, and cholesterol intake calculated from the 24-hour recall in the United States, the UnitedStates food frequency questionnaire, and the Taiwan food frequency questionnaire.Within a nutrient group, values with different letters are significantly different at P < 0.05; values for calories and protein represent the percentage mean of theRDA, whereas, values for carbohydrate, fat and cholesterol represent the percentage of recommended intake.

58
1907 calories, 243 g of carbohydrate, 94 g protein, 63 g of fat and 384 mg cholesterol. A study of Chinese
working women by Shimbo et al. (1997) found participants consumed 1973 calories, 269 carbohydrate, 69
g protein, 73 g of fat and a range of intake of 179 to 248 mg of cholesterol. Fish and shellfish contributed
11% of the protein intake of these Chinese working women. Shellfish is a significant contributor of
cholesterol to the diet and is reflected in the 384 mg cholesterol found in the Taiwan food frequency
questionnaire in our study.
The present study found no significant difference in consumption of carbohydrate, fat, cholesterol
and calories in contrast to the study by Pan et al. (1999). These authors found a significant increase in
consumption of fats, sweets and dairy products in students attending a United States university who were
born in China, Taiwan, Hong Kong, Japan or Korea. However, they found a significant decrease in meat,
meat alternatives and vegetables when the students came to the United States. This finding mimics the
lower protein intake found with the United States food frequency questionnaire in our study.
In the Chinese Total Diet Study by Chen and Gao (1993), the average protein intake was 64 g and
the fat intake was 51.2 g or 21.2 % of the total energy consumed. In our study, the Taiwan food frequency
questionnaire indicated 94 g of protein and 63 g of fat or 30% of total energy. This illustrates that these
Taiwanese students consume more protein in Taiwan and once in the United States consume a diet that
more closely parallels the Chinese diet as far as protein (61 g) is concerned. However, the intake of 56 g of
fat remained the same. Caloric intake of the Taiwanese students was lower than the RDA, the fat expressed
as a percentage of the total calories was 31%. This is a value very close to the recommended intake of fat,
which is 30% of total calories.
Data extracted from the nutrition survey conducted by the Taiwan Department of Health is
presented in Table 12. Calories, fat, carbohydrate, protein and cholesterol intake of males and females aged
20-24 and 25-34, is presented along with our data from the Taiwan food frequency questionnaire, United
States food frequency questionnaire and the 24-hour recall. The intake of calories and carbohydrate
reported by the Taiwan nutrition survey is very similar to our data collected by the United States food

59
frequency questionnaire, the 24-hour recall, and the Taiwan food frequency questionnaire. One notable
difference is that the protein intake of the Taiwan food frequency questionnaire represents a greater
percentage of total calories than that reflected in the United States food frequency questionnaire or the
Taiwan nutrition survey. It should be mentioned that fat expressed as total percentage of calories ranged
from 29% to 38% in the Taiwan nutrition survey, whereas, the Taiwan food frequency questionnaire,
United States food frequency questionnaire and 24-hour recall ranged from 27% to 31% which is very
close to the recommended. This may indicate that these Taiwanese students are at less risk of heart disease
from excess fat consumption as a result of living in the United States. In contrast, cholesterol intake of
females as reported by the Taiwan nutrition survey is considerably lower than that found with our
instruments. However, the cholesterol intake from the United States food frequency questionnaire and the
24-hour recall did not exceed the recommended.

60
Table 12. A summary of the Calories, Protein, Carbohydrate, Fat and Cholesterol Intake from the Taiwan Nutrition Survey, 24-Hour Recall in the UnitedStates, Taiwan Food Frequency Questionnaire (FFQ) and the United States Food Frequency Questionnaire.
Calories Protein Carbohydrate Fat Cholesterol
age No. Mean + SD(Kcal/day)
%RDA5Mean +
SD (g/day) % RDA5 %Cal.Mean +
SD (g/day)%Cal.
Mean + SD(g/day)
%Cal.Mean + SD
(g/day)%Recom-mended
20-24 149 2267 + 1350 103% 89 + 70 137% 16% 306 + 173 55% 71 + 63 29% 383 + 271 96%Male
25-34 400 2412 + 1586 115% 88 + 47 135% 15% 279 + 128 48% 97 + 138 37% 405 + 318 101%
20-24 142 1495 + 938 83% 52 + 30 95% 14% 180 + 106 48% 64 + 64 38% 282 + 320 71%
1993-1996Taiwan
NutritionSurvey1 Female
25-34 383 1514 + 658 89% 62 + 34 112% 16% 190 + 96 50% 58 + 44 34% 308 + 485 71%
Data from TaiwanFFQ2
25.20+2.18
15 1907 + 661 102% 94 + 36 231% 19% 243 + 86 51% 63 + 27 30% 384 + 149 128%
Data from UnitedStates FFQ3
25.20+2.18
15 1638 + 474 87% 61 + 19 148% 15% 222 + 68 54% 56 + 23 31% 301 + 139 100%
Data from 24-hourrecall in the USA4
25.20+2.18
15 1716 + 168 96 74 + 25 183 17% 238 + 110 55% 52 + 22 27% 301 + 168 101%
1. The "1993-1996 Taiwan Nutrition Survey" was from the Department of Health. The Executive Yuan, Taiwan. The Republic of China. Http:// www.doh.gov.tw/org2/b3/nutrition/1-1-1.html2. "Data from Taiwan FFQ (Food Frequency Questionnaire)" was extracted from our study (Table 4).3. "Data from United States FFQ" was extracted from our study (Table 3).4. "Data from 24-hour recall in the United States" was extracted from our study (Table 3).5. The % RDA in 1993-1996 Taiwan Nutrition Survey was compare to the Recommended Daily Nutrient Allowances (RDA), 1993 (see Appendix A) in Taiwan. The % RDA in Data from Taiwan FFQ, Data from United States FFQ, and Data from 24-hour recall in the USA was compared to the Recommended Dietary Allowances (RDA), 1989 (see Appendix H) in the United States.

61
The study by Lee et al. (1992) investigated the foods predictive of nutrient intake in the Taiwanese
diet. The author reported that chicken, polished rice, and pork are the major protein sources. Although
Taiwanese students can buy pork and chicken in the United States grocery stores and can obtain rice in the
oriental stores, the time required to study topics not in their native language may not allow them to cook by
themselves, thus decreasing the intake of those foods. The students' life styles may promote consumption of
American-style foods that are available and convenient.
B. Vitamin A, Thiamin (B1), Riboflavin (B2), Vitamin B6, and Vitamin B12 Intake of Taiwanese
Students
Figure 3 indicates that thiamin (B1) expressed as a percentage of the RDA calculated from the
Taiwan food frequency questionnaire (169%) was significantly higher (P=0.004) than that calculated from
both the United States food frequency questionnaire (118%) and the 24-hour recall (129%) conducted in
the United States. As the United States food frequency questionnaire closely mirrors the typical 24-hour
food intake, this may be evidence that these two instruments provide similar results. The comparison of
thiamin (B1) intake between the 24-hour recall in the United States and the Taiwan food frequency
questionnaire showed strong tendency for significant difference (P=0.054) which provides additional
evidence that the thiamin intake in Taiwan is greater than the thiamin intake in the United States. Vitamin
B12 expressed as a percentage of the RDA showed similar results. The United States food frequency
questionnaire and the 24-hour recall in the United States also indicated a much lower

62
a
aba
a
a
a
b
ab a
b
aa
b
b
0
50
100
150
200
250
300
350
400
Vitamin A Thiamin-B1 Riboflavin-B2 Vitamin B6 Vitamin B12
nu
trie
nt
per
cen
tag
e o
f R
DA
24-hour recall in USA
In USA
In Taiwan
Figure 3. Comparison of vitamin A, thiamin (B1), riboflavin (B2), vitamin B6, and vitamin B12 intake of the 24-hour recall in theUnited States, the United States food frequency questionnaire, and the Taiwan food frequency questionnaire.
Within a nutrient group, values with different letters are significantly different at P < 0.05; values represent the mean percentage of the Recommended DietaryAllowances.

63
percentage of the RDA for vitamin B12 (167% and 146%, respectively) in the United
States than that in Taiwan (337%).
The percentage of Vitamin B6 calculated from the Taiwan food frequency questionnaire (111%)
was significantly higher (P=0.014) compared to the United States food frequency questionnaire (79%).
However, the 24-hour recall was not significantly different from either the United States or Taiwan food
frequency questionnaires. The vitamin B6 data closely parallels the protein data (figure 2), which also
found a significant difference when the percentage of protein of the United States food frequency
questionnaire was compared to the Taiwan food frequency questionnaire. However, there were no
significant differences found between the 24-hour recall and the United States or the Taiwan food
frequency questionnaire. This indicates vitamin B6 intake closely parallels protein consumption.
A study by Lee et al. (1992) reported that enriched rice was the best predictor food for vitamin B1
intake. However, its absolute contribution to vitamin B1 intake is small (3.2%). Medium-fat pork (13.1%),
lean pork (12.6%) polished rice (23 %) and pork sausage (2.3%) ranked as the second to the fifth
contributors to vitamin B1 intake. The top 20 list of major vitamin B1 predictor foods also included a
variety of other foods such as protein-rich food (chicken, eggs, meat ball, pork liver), fruits (oranges,
bananas), and vegetables (Chinese cabbage, carrots). Thus, pork is a significant contributor of vitamin B1
to the Taiwanese diet. Pork processing in the United States is different from the processing in Taiwan and
results in a product that has a less preferred taste. The lower pork and protein intake on the United States
food frequency questionnaire appeared to contribute to the lower vitamin B1 when the United States food
frequency questionnaire and 24-hour recall was compared to the Taiwan food frequency questionnaire. The
24-hour data in the case of vitamin B1 is consistent with the United States food frequency questionnaire.
Few studies have been conducted since 1990 on the impact of migration on nutrient intake; more
recent studies have concentrated on dietary food patterns rather than nutrient intake, especially vitamin A
and the B complex vitamins. The study in China by Chen and Gao (1993) reported that the intakes of
thiamin and riboflavin were below the RDA, retinol intake was also low in the Beijing area. Another study

64
by Tian et al. (1995) in the Tiamjin area of China also indicated low intakes of vitamin A as well as
riboflavin. However, the most recent Nutrition Survey by the Department of Health in Taiwan (1993-1996)
(see Table 13) showed the intakes of vitamin A, thiamin (B1), and riboflavin (B2) were above the RDA for
Taiwanese, age 20 to 34. This may indicate that the study data of the Chinese population which come from
the Mainland China area does not represent the nutrient intake of Chinese people from Taiwan.
Data extracted from the nutrition survey conducted by the Taiwan Department of Health on the
Vitamin A and vitamin B complex intake of males and females aged 20-24 and 25-34 and from our United
States food frequency questionnaire, Taiwan food frequency questionnaire and the 24-hour recall are
presented in Table 13. The data on riboflavin from the Taiwan nutrition survey are very similar to our data
from the Taiwan

65
Table 13. A Summary of the Vitamin A, Thiamin (B1), Riboflavin (B2) Intake from the Taiwan Nutrition Survey, 24-Hour Recall in the United States, TaiwanFood Frequency Questionnaire (FFQ), and the United States Food Frequency Questionnaire.
Vitamin A Thiamin (B1) Riboflavin (B2) Vitamin B6 Vitamin B12
Age No. Mean + SD(RE/day)
%RDA5 Mean + SD(RE/day)
% RDA5 Mean + SD(mg/day)
% RDA5 Mean + SD(mg/day)
% RDA5 Mean + SD(mg/day)
% RDA5
20-24 149 1010 + 1856 101% 1.47 + 1.44 134% 1.33 + 1.17 111%Male
25-34 400 1569 + 2392 157% 1.39 + 0.98 126% 1.41 + 1.42 118%
20-24 142 1194 + 1741 142% 0.86 + 0.66 96% 0.89 + 0.68 89%
1993-1996Taiwan
NutritionSurvey1 Female
25-34 383 1365 + 2172 162% 0.96 + 0.75 107% 1.17 + 1.21 130%
No investigation No investigation
Data from TaiwanFFQ2
25.20 +2.18
15 1050 + 606 127% 1.72 + 0.69 169% 1.51 + 0.76 123% 1.83 + 0.82 111% 6.74 + 2.72 337%
Data from UnitedStates FFQ3
25.20 +2.18
15 981 + 735 119% 1.20 + 0.42 118% 1.37 + 0.45 113% 1.30 + 0.48 79% 3.34 + 1.41 167%
Data from 24-hourrecall in the USA4
25.20 +2.18
15 594 + 500 74% 1.27 + 0.59 129% 1.33 + 0.38 112% 1.54 + 0.86 95% 2.92 + 1.87 146%
6. The "1993-1996 Taiwan Nutrition Survey" was from the Department of Health. The Executive Yuan, Taiwan. The Republic of China. Http:// www.doh.gov.tw/org2/b3/nutrition/1-1-1.html7. "Data from Taiwan FFQ (Food Frequency Questionnaire)" was extracted from our study (Table 4).8. "Data from United States FFQ" was extracted from our study (Table 3).9. "Data from 24-hour recall in the United States" was extracted from our study (Table 3).10. The % RDA in 1993-1996 Taiwan Nutrition Survey was compare to the Recommended Daily Nutrient Allowances (RDA), 1993 (see Appendix A) in Taiwan. The % RDA in Data from Taiwan FFQ, Data from United States FFQ, and Data from 24-hour recall in the USA was compared to the Recommended Dietary Allowances (RDA), 1989 (see Appendix H) in the United States.

66
food frequency questionnaire, United States food frequency questionnaire and the 24-hour recall. In all
cases, riboflavin exceeded the 100% of the RDA with the exception of Taiwanese females, 20 to 24 years
of age, as reported by Taiwan nutrition survey. Thiamin intake from our Taiwan food frequency
questionnaire was shown to be significantly higher (P=0.006) than that calculated from the United States
food frequency questionnaire and showed a strong tendency (P=0.054) to be higher than the 24-hour recall.
Thiamin intake calculated from our Taiwan food frequency questionnaire appears to be higher than that
reported for females in the Taiwan nutrition survey of 1996. However, all data represented on Table 13
meets the RDA for thiamin with the exception of women 20 to 24 years of age as reported by the Taiwan
nutrition survey. Vitamin A intake from the Taiwan nutrition survey, Taiwan food frequency questionnaire,
and the United States food frequency questionnaire exceeds the RDA. However, the percentage of vitamin
A intake as reflected by the 24-hour recall is significantly lower than the percentages of vitamin A
calculated from the Taiwan food frequency questionnaire and the United States food frequency
questionnaire. The finding that the 24-hour recall did not meet the RDA may reflect the dietary pattern of
consuming a variety of fresh vitamin A-rich foods when they are in season or of acceptable quality.

67
C. Vitamin C, Vitamin E, Calcium and Iron Intake of Taiwanese Studies
According to the comparison in Tables 9 to 11 (see figure 4), vitamin E expressed as a
percentage of the RDA was significantly lower (P < 0.05) as calculated from the United States food
frequency questionnaire (54%) compared to the Taiwan food frequency questionnaire (83%). However,
vitamin E intake as calculated from the 24-hour food recall (58%) was not significantly different from
the United States or the Taiwan food frequency questionnaires. The percentage of the RDA calculated
from the Taiwan and United States food frequency questionnaires for vitamin C, calcium and iron was
not significantly different. However, the 24-hour food recall percentage of the RDA for iron (86%) was
significantly different from the percentage of RDA of iron calculated from the Taiwan food frequency
questionnaire (128%) and the United States food frequency questionnaire (107%) (P=0.028 and
P=0.040, respectively). The percentages of RDA of calcium and vitamin C were not significantly
different when comparisons were made of the 24-hour recall, Taiwan food frequency questionnaire, and
the United States food frequency questionnaire.
Data of vitamin C, vitamin E, calcium and iron extracted from the nutrition survey conducted
by the Taiwan Department Health is presented in Table 14. The vitamin C intake represented as a
percentage of the RDA from the Taiwan nutrition survey, Taiwan food frequency questionnaire, and the
United States food frequency questionnaire were very similar. However, the intake of vitamin C in each
comparison

68
a
aab
a
b
ab
a
b
aa
a
0
50
100
150
200
250
300
Vitam in C Vitam in E Calcium Iron
Nutrient Percentage of
24-hour recall in USA
In USA
In Taiwan
Figure 4. Comparison of vitamin C, vitamin E, calcium, and iron intake of the 24-hour recall in the United States, the United Statesfood frequency questionnaire, and the Taiwan food frequency questionnaire.
Within a nutrient group, values with different letters are significantly different at P < 0.05; values represent mean percentage of Recommended DietaryAllowances.

69
Table 14. A Summary of the Vitamin C, Vitamin E, Calcium and Iron Intake from the Taiwan Nutrition Survey, 24-Hour Recall in the United States, TaiwanFood Frequency Questionnaire (FFQ), and the United States Food Frequency Questionnaire.
Vitamin C Vitamin E Calcium Iron
Age No. Mean + SD(mg/day)
%RDA5 Mean + SD(mg/day)
% RDA5 Mean + SD(mg/day)
%RDA5 Mean + SD(mg/day)
%RDA5
20-24 149 175 + 244 292% 7.10 + 7.27 59% 453 + 382 57% 16.05 + 18.25 107%Male
25-34 400 163 + 219 272% 7.92 + 6.03 66% 513 + 504 86% 15.44 + 12.26 154%
20-24 142 144 + 162 240% 6.43 + 4.74 64% 349 + 271 50% 9.7 + 7.2 65%
1993-1996Taiwan
NutritionSurvey1 Female
25-34 383 179 + 295 298% 6.98 + 5.86 70% 457 + 454 76% 11.21 + 6.8 75%
Data from TaiwanFFQ2 25.20 + 2.18 15 164 + 104 274% 6.91 + 2.99 83% 580 + 354 67% 18 + 7.0 128%
Data from UnitedStates FFQ3 25.20 + 2.18 15 135 + 99 224% 4.43 + 2.33 54% 484 + 188 55% 15 + 5.29 107%
Data from 24-hourrecall in the USA4 25.20 + 2.18 15 94 + 103 156% 4.66 + 2.97 58% 495 + 250 55% 12 + 4.80 86%
11. The "1993-1996 Taiwan Nutrition Survey" was from the Department of Health. The Executive Yuan, Taiwan. The Republic of China. Http:// www.doh.gov.tw/org2/b3/nutrition/1-1-1.html12. "Data from Taiwan FFQ (Food Frequency Questionnaire)" was extracted from our study (Table 4).13. "Data from United States FFQ" was extracted from our study (Table 3).14. "Data from 24-hour recall in the United States" was extracted from our study (Table 3).15. The % RDA in 1993-1996 Taiwan Nutrition Survey was compare to the Recommended Daily Nutrient Allowances (RDA), 1993 (see Appendix A) in Taiwan. The % RDA in Data from Taiwan FFQ, Data from United States FFQ, and Data from 24-hour recall in the USA was compared to the Recommended Dietary Allowances (RDA), 1989 (see Appendix H) in the United States.

70
with the exception of the 24-hour recall was more than twice the RDA. The percentage of the RDA of
vitamin C calculated from the 24-hour recall (156%) showed a tendency (P=0.097) to be lower than the
Taiwan food frequency questionnaire although at 156% was still well above the recommended. The
intake of vitamin E calculated from the United States food frequency questionnaire is significantly
lower than the vitamin E intake calculated from the Taiwan food frequency questionnaire. As presented
in Table 14, the intake of both vitamin E and calcium were below the RDA for each data comparison
presented, including the Taiwan nutrition survey, Taiwan food frequency questionnaire, United States
food frequency questionnaire and the 24-hour recall intake in the United States.
Fruits ranked at the top in predicting vitamin C intake (Lee et al. 1992) in Taiwan. The first
five foods were guavas, oranges, papayas, lychees and mangoes. The study by Pan et al. (1999) reported
that the fruit intake was significantly increased after the Asian students moved to the United States. Our
study showed no significant difference between the vitamin C intake calculated from the Taiwan food
frequency questionnaire and the United States food frequency questionnaire. Fruit availability would
differ to some extent in Taiwan and in the United States, depending on the climate, transportation, and
economic situation. The study by Pan et al. (1999), which indicated an increased consumption of fruits
by Asian students, was conducted in Florida where a variety of citrus fruits are grown and are readily
available. In Wisconsin, citrus fruits are seasonally of better quality in certain months. Also, cold juice
consumption is not tolerated as well in the colder climate. Seasonality of the fruit and the cold weather
when the 24-hour recall was taken may have decreased the amount of fruit and thus lowered but not
significantly so, the reported amounts of vitamin C consumed on the 24-hour recall.
The percentage of the RDA for vitamin E from the Taiwan nutrition survey (average 64%),
Taiwan food frequency questionnaire (83%), United States food frequency questionnaire (54%) and 24-
hour recall was extremely low (Table 14). The study conducted by Shimbo et al. (1997) in Taiwan also
reported the insufficient intake of vitamin E compared to the recommended dietary allowances in
Chinese working women. A study by Meydani (1999) found that various antioxidant supplements

71
including vitamin E started in early life might promote longevity. Vitamin E can modulate
immune/endothelial cells interaction, thus reducing the risk of cardiovascular disease (CVD). Thus,
antioxidants such as vitamin E from food sources or supplements appear to be promising for successful
aging by improving immune function, and reducing the risk of several age-associated chronic diseases,
such as CVD. Supplementation of the diets of the Asian students with vitamin E may be warranted.
Although the percentages of the RDA for Taiwan and United States food frequency
questionnaires for calcium intake were not significantly different, the intake was very low. Calcium
consumption of Asian individuals may be a risk factor for osteoporosis. The percentages of the RDA in
the 1993-1996 Taiwan nutrition survey were as follows: male 20 to 24 years old, 57%; male 25 to 34
years old, 86%; female 20 to 24 yeas old, 50%; and female 25-34 years old, 76%. For each age group in
the Taiwan nutrition survey, calcium intake was below the recommended. In our study, the calculated
percentage of the RDA for calcium from the Taiwan food frequency questionnaire (67%), the
percentage of the RDA for calcium calculated from the United States food frequency questionnaire
(55%), and the percentage of RDA for calcium as reported in the 24-hour recall in the United States
(55%), were well below the RDA.
Studies conducted in Hong Kong (Lau and Cooper 1993, Lau and Cooper 1996) indicated that
the incidence rate of hip fracture in Asia has increased 3-fold since 1966. It has been projected that 50%
of all hip fractures in the world will occur in Asia by the next century. The bone mineral density (BMD)
of Asian populations is comparable to that of whites after adjusting for height and weight. Physical
inactivity, a low dietary calcium intake, and falls have been found to be major risk factors for hip
fractures in Asia. Another study on the determinants of bone mass in young Chinese women aged 21-40
in Hong Kong (Ho et al. 1994) also showed a very low calcium intake (448 mg/day, Standard
deviation=219). A study conducted by the National Taiwan University Hospital in 1992 reported that
the prevalence of vertebral fractures was 18% for women and 12% for men older than 65 year in the
major cities of Taiwan (Tsai 1997). Hip and vertebral fractures are both associated with lower BMD

72
values. The risk factors for low BMD in Taiwan include a lighter body weight and aging in both sexes,
and menopause for women. Tsai (1997) also found that in Taipei City, daily calcium intake is relatively
lower (mean intake SD; 640 + 240 mg). There was a significant association between a higher daily
calcium intake and a higher BMD/lower bone turnover rate for women. Favorable calcium intake may
be beneficial for Taiwanese, especially women, with habitual low dietary calcium intake.
The RDA for iron in Taiwan is lower than the United States RDA. Even through the RDA for
iron is lower than the United States, the Taiwan nutrition survey indicated that iron intake expressed as
a percentage of the RDA was low for Taiwanese females. However, Taiwanese males achieved the
RDA. Our study showed no significant difference in the percentage of the RDA for iron between the
United States and the Taiwan food frequency questionnaire and also showed that the Taiwanese female
students achieved the RDA. However, the 24-hour recall in which the percentage of RDA is low as well
as the low iron intake of Taiwanese females found by the Taiwan nutrition survey leaves some doubt as
to the adequacy of iron intake for the Taiwanese female students.
A survey of iron status of school children and adolescents was carried out in Taiwan. Iron
deficiency was defined as ferritin levels < 12 mg/L. For teenage subjects (aged 13 to 19.9 years), the
rate of iron deficiency in males was 1.22% in Pingtung and 0% in Taichung, and that in females was
9.38% in Pingtung and 26.4% in Taichung. The anemia rate in males was 3.66% in Pingtung and 3.45%
in Taichung, and that in females was 8.33% in Pingtung and 5.75% in Taichung. In both areas, iron
deficiency was more prevalent in teenage females than in teenage males. Iron deficiency is not the
major underlying cause of anemia, and iron deficiency anemia is relatively rare (<2%) in Taiwan.
Teenage girls are identified as the group at risk of iron deficiency and anemia (Shaw 1996). Another
survey from the Taiwan Department of Health identified that 93.3% of Taiwanese females over age 14
achieved the Taiwan iron RDA. The percentage of iron insufficiency of Taiwan females (> 14 yrs) was
11.7, and the iron sufficiency was 88.3% (from http://www.doh.gov.tw/org2/b3/nutrition/3-5.html).
73
Thus, it appears that iron deficiency is more characteristic of teenage girls rather than women aged 22 to
28 that made up our study sample.
Another recent study (Root et al. 1999) determined the iron status among premenopausal and
recently postmenopausal Chinese women (aged 32 to 66 years old) in rural China. The authors reported
that total iron intake was relatively high (15-29 mg/day) compared to developed countries. Overall
levels of iron deficiency anemia were relatively low in these generally iron-stressed women. There was
no clear statistical relationship between iron intake and physiological iron status. Dietary animal protein
was significantly positively correlated (r=0.15, P=0.009) with plasma ferritin. Intakes of potential
inhibitors of iron absorption, such as tea, even in very high amounts, were not correlated to iron status.
Iron nutriture in these areas of rural China seemed more related to physiological, than to dietary factors.
These studies do not reflect iron deficiency in Taiwan females, age 20 to 34. However, iron
insufficiency may be present in pregnancy or menses or other kinds of physical stress.
2. Limitations of This Study
The limitations of this study include the omission of questions to analyze the effect of length of
stay at the University of Wisconsin-Stout and in the United States upon weight change and food intake.
Also, Taiwanese students frequently travel back to their country for two or three months in the summer
or one month in the winter time, which may cause confusion in recalling food intake for the food
frequency questionnaires. Furthermore, the use of the food frequency questionnaire may be a problem
especially for students who have stayed in the United States for over one or two years without returning
to Taiwan. They may have forgotten their dietary pattern in Taiwan.
Vitamin supplement usage was not easy to determine because most of the participants take
supplements randomly or infrequently. Cooking oil usage greatly influences the fat intake. Most of the
students did not prepare foods in Taiwan so they have limited knowledge of the amounts and kind of
oils they used. In the United States, knowledge of restaurant preparation of food is also limited. This
may affect the amount of reported fat as well as the vitamin E intake, which is abundant in plant oil.

74
3. Applications/Conclusions
The investigation of acculturation changes in food intake of Taiwanese students attending the
University of Wisconsin-Stout observed that there were significant decreases in the intake of protein,
thiamin, vitamin B6, vitamin B12 and vitamin E of students attending the University of Wisconsin-
Stout in the United States. In the comparison of the United States food frequency questionnaire to the
Taiwan food frequency questionnaire, calories, carbohydrate, fat, cholesterol, vitamin A, riboflavin,
vitamin C, calcium, and iron intake did not have significant differences. Compared to the percentage of
the United States recommended dietary allowances, both vitamin E and calcium are well below the
RDA. As no large increases in fat, or cholesterol were found, the risk for heart disease from these
factors was not increased. However, the decreased intake found in the United States for vitamin B6
known to cause increases in homocysteine, a risk factor for heart disease as well as the decrease in
vitamin E, which is protective of lipid oxidation and subsequent artery damage is a cause for concern
(Meydani 1999). Additionally, the low calcium intake found in our study (Ho et al. 1994, Lau and
Cooper 1993, Lau and Cooper 1996, Tsai 1997) is associated with hypertension, a risk factor for heart
disease and the high incidence of osteoporosis. Low intakes of these nutrients should become a starting
point for dietitians in designing nutrition intervention for the Asian immigrants.
Our observations can help dietitians to understand the change in nutrient intake that occurs in
young Asians attending the United States universities. The dietitian can use this information to plan
strategies for their nutrition education to improve the calcium intake of Asian students who experience
lactose-intolerance and have low calcium intakes. It is suggested that future studies concentrate on these
nutrients (vitamin B6, vitamin E and calcium) and their relationship to chronic diseases. This
information may help the dietitian provide nutrition counseling to their Asian clients.

75
APPENDIX-A
RECOMMENDED DAILY NUTRIENT ALLOWANCES IN TAIWAN

76
Recommended Daily Nutrient Allowances in TaiwanRevised by 1993
20~24 years old 25~29 years oldMale Female Male Female
Height (cm) 170 158 170 158Weight (Kg) 62 52 62 52
Calories (Kcal)
∗∗∗∗ S: 2200L: 2450M: 2850H: 3300
S: 1800L: 2000M: 2350H: 2650
S: 2100L: 2350M: 2750H: 3100
S: 1700L: 1900M: 2200H: 2500
Protein (g) 65 55 65 55
Vitamin A (µµµµg R.E.) 600 500 600 500
(I.U.) 5000 4200 5000 4200
Vitamin E (mg αααα-T.E.) 12 10 12 10
Vitamin C (mg) 60 60 60 60
Thiamin-B1 (mg)
S: 1.1L: 1.2M: 1.4H: 1.7
S: 0.9L: 1.0M: 1.2H: 1.3
S: 1.1L: 1.2M: 1.4H: 1.6
S: 0.9L: 1.0M: 1.1H: 1.3
Riboflavin-B2 (mg)
S: 1.2L: 1.3M: 1.6H: 1.8
S: 1.0L: 1.1M: 1.3H: 1.5
S: 1.2L: 1.3M: 1.5H: 1.7
S: 0.9L: 1.0M: 1.2H: 1.4
Vitamin B6 (mg) 1.6 1.4 1.6 1.4
Vitamin B12 (µµµµg) 2.0 2.0 2.0 2.0
Calcium (mg) 800 700 600 600Iron (mg) 10 15 10 15
∗ S, L, M, H means Activity levels:S: Sedentary; L: lightly active; M: Moderate active; H: Heavy active* Source: Department of Health, the Executive Yuan, Taiwan. http:// www.doh.gov.tw/org2/b3/

77
APPENDIX-B
HUMAN RESEARCH SUBJECTS CONSENT FORM

78
Human Research Subjects Consent Form
I understand that by returning this questionnaire, I am giving my informed consent as a participating
volunteer in this study. I understand the nature of the study and agree that any potential risks are
exceedingly small. I also understand the potential benefits that might be realized from the successful
completion of this study. I am aware that the information is being sought in a specific manner so that no
identifiers are needed and so that confidentiality is guaranteed. I realize that I have the right to refuse to
participate and that my right to withdraw from participation at any time during the study will be
respected with no coercion or prejudice.
NOTE: Questions or concerns about participation in the research or subsequent complains should be
addressed first to the researcher or research advisor and second to Dr. Ted Knous, Chair, UW-Stout
Institutional Review Board for the Protection of Human Subjects in Research, 11 HH, UW-Stout,
Menomonie, WI, 54751, phone (715) 232-1126

79
APPENDIX-C
COVER LETTER

80
-----------This is a Nutrition Survey----------Date:
Name and address:
Dear _______:What should you eat to maintain your health status? --- Nutrition andhealth is currently a hot topic.
We would like to find out the difference of dietary nutrient intakebefore and after Taiwanese students come to the United States. Youranswers to this survey will be used to provide the dieteticprofessions more accurate information about the Taiwanese immigrationfor nutrition education.
The survey includes one 24 – Hour Recall Form, SupplementaryQuestions and two Food Frequency Questionnaires. You will beinterviewed two times. In the first interview, you will complete theFood Frequency Questionnaire about the food intake since you came tothe United States, and the 24 – Hour Recall form and SupplementaryQuestions. In the second interview, you will be asked to complete theFood Frequency Questionnaire about the food intake before you came tothe United States.
Your answers are confidential. You need not put your name on thequestionnaire. You may receive a summary of the results by writing “Result Requested” on the end of the questionnaire. We would be mosthappy to answer any questions you might have. You may email to me atthe below address or call (715) 235-8027.
Thank you for your assistance.
Sincerely,
Yiping LuDepartment of Food Science and NutritionUniversity of Wisconsin – [email protected]
APPENDIX-D
24-HOUR RECALL FORM

81
Name: Date of recall: Note: use a separate line for each food item
Time Place For each food or beverages listed in thecolumn. How much did you eat or drink?
Did your food have saltadded?
Number of units
Am
Pm
hr min
hom
e
away identify
Foodand
Beverages
oz g TB
Tsp
cup
othe
r
Size ofDescriptionOf other
Complete description
Yes
(y)
No(
N)
duri
ngco
okin
g
At
the
tabl
e
unkn
own

82
APPENDIX-E
24-HOUR RECALL SUPPLEMENTARY QUESTIONS
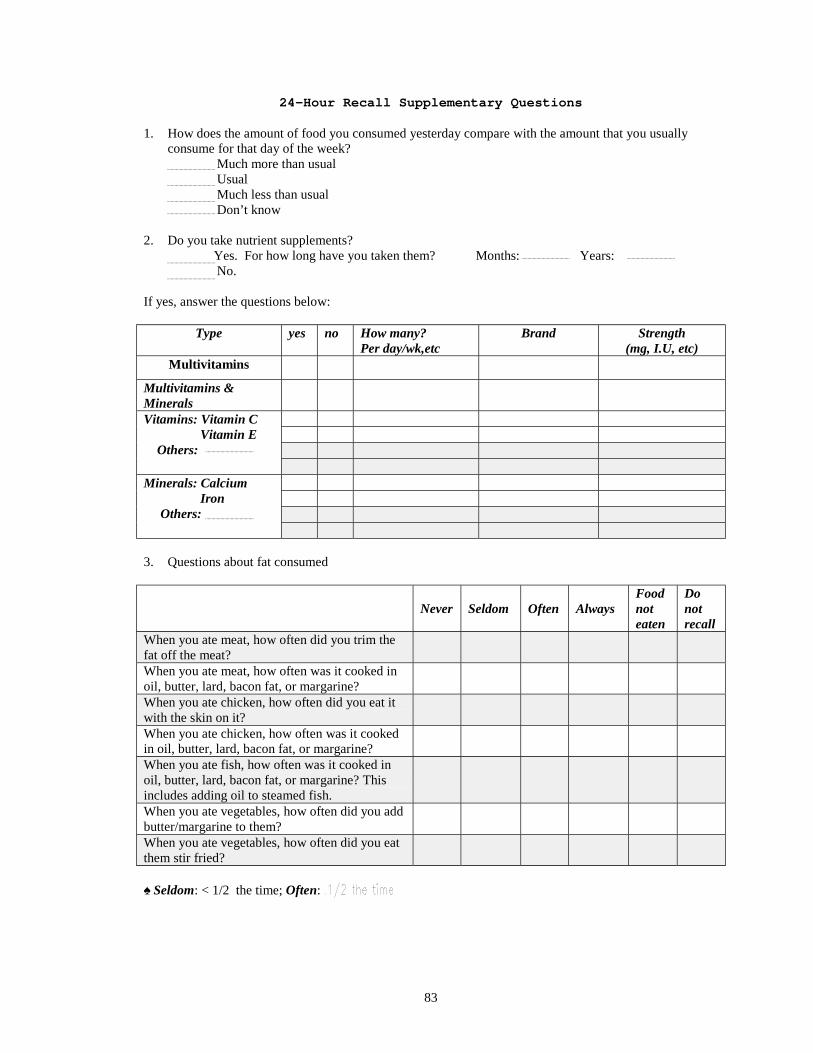
83
24-Hour Recall Supplementary Questions
1. How does the amount of food you consumed yesterday compare with the amount that you usuallyconsume for that day of the week?
Much more than usual Usual Much less than usual Don’t know
2. Do you take nutrient supplements? Yes. For how long have you taken them? Months: Years: No.
If yes, answer the questions below:
Type yes no How many?Per day/wk,etc
Brand Strength(mg, I.U, etc)
Multivitamins
Multivitamins &MineralsVitamins: Vitamin C Vitamin E Others:
Minerals: Calcium Iron Others:
3. Questions about fat consumed
Never Seldom Often AlwaysFoodnoteaten
Donotrecall
When you ate meat, how often did you trim thefat off the meat?When you ate meat, how often was it cooked inoil, butter, lard, bacon fat, or margarine?When you ate chicken, how often did you eat itwith the skin on it?When you ate chicken, how often was it cookedin oil, butter, lard, bacon fat, or margarine?When you ate fish, how often was it cooked inoil, butter, lard, bacon fat, or margarine? Thisincludes adding oil to steamed fish.When you ate vegetables, how often did you addbutter/margarine to them?When you ate vegetables, how often did you eatthem stir fried?
♠ Seldom: < 1/2 the time; Often:

84
APPENDIX-F
TAIWAN FOOD FREQUENCY QUESTIONNAIRE

85
Food Frequency Questionnaire
Code#: Date:
Please indicate how much and how often you have eaten the following foods before attending to the U.S. When answering think aboutyour usual diet over the past months. Please considers the serving size and marks how many servings you eat under the column" howoften".For example, if you have 2 cups (16 fluid oz) of milk at one meal and 1 time per day, mark "2" at the "Column 1"under"Times/day".
How often?Food list ServingSize
neverTimes/ month Times/week Times/day
0 1 2 3 1 2 3 4 5 6 1 2 3 4+
Dairy product
Cottage cheese, ricotta 1/2cupCream cheese 1TbOther cheese – Cheddar, Swiss 1sliceCream (whipping cream) 1TIce cream, frozen yogurt 1cupMilk (skim/ 1%/ 2%/ whole, choc.) 8flozSherbet (fruit flavors, Land O'Lakes,orange), ice milk
1/2cup
Shake(chocolate/peach/strawberry/vanilla)
1shake
Sundae (hot fudge/strawberry) 1sundaeYogurt (non/ low/ whole fat) 1cup
Bread/cereal/grain/starches
Brown-rice �� 1/2cupBread dressing 1/2cupCereal; Granola or other grains 1 cupCold breakfast cereal 11/4cupCooked cereals (oatmeal, etc.) 1/2cupChinese noodles;Include wheat flour string ��
1 Bowl
Dasheen (Taro) �� ½Dark bread, wheat flour bread 1sliceDinner rolls or buns, white bread 1English muffins, bagel, rolls 1/2mediumGluten, fried � � 20gMuffin, biscuits, or corn bread 1smallNoodles (Pasta/ Spaghetti w/o sauce) 1/2cupNachos 1servingPancakes, waffles 1,4"diamete
rPizza 1mediumSteamed bread �� 1mediumWhite rice �� 1/2Bowl
Legumes/ beans /seeds and nutsBeans, such as baked beans, pintos,kidney beans or chili, lima beans
1/2 cup
Green beans, peas, snow peas and others 1/2cup

86
How often?Food list ServingSize
neverTimes/month Times/week
Times/day
0 1 2 3 1 2 3 4 5 6 1 2 3 4+
Legumes/ beans /seeds and nutsPeanut, peanut butter 1oz, 2TbSoybean curd (tofu)(soft/ dried/ fried/ fermented)
1/2cup
Soybean, fresh without pod �� 1cupSoybean milk �� 1 cup
Meat and poultry products
Beef 2-3ozCroissandwich (cheese/egg/sausage) 1Chicken or turkey w or w/o skin 2-3ozChicken eggs 1largeFast food burger (large/junior)( Fish/ Chicken/ Pork/ Beef)
1
Ham/ Chinese ham 1sliceHot dogs w or w/o bun 2Lamb (mutton) 3.5ozLiver (chicken, pork, beef) 3.5ozLuncheon meat (bologna, etc.) 1sliceMeat balls, Swedish 2-3ozMeat loaf 4ozPig’s blood, cooked 3.5ozPig’s feet 1ozPig’s large intestine 3.5ozPork or fish dried and crushed 1TbPork(fat-trimmed loin, shoulder andbutt)
1oz
Pork ribs, lean 3.5ozPork fat ��� 3.5ozPork medium fat (Bacon, etc.) 3.5ozPork sausage (Chinese/ USA) 1link
Fish and marine products
Cuttle fish; squid 3ozDark meat fish(salmon, mackerel, swordfish) 3ozKelp �� 3.5oz
Laver dried �� 3.5ozLobster 3ozOther fish without dark meat fish 3ozSardines 2Shellfish (clam/ crab, oyster, etc.) 9small/3ozShrimp or (small/ dried) 3oz, 10gSmall fishes (steamed/ dried) ��� 10g

87
How often?Food list ServingSize
neverTimes/month Times/week
Times/day
0 1 2 3 1 2 3 4 5 6 1 2 3 4+
Vegetables
Asparagus (cooked/ canned/ frozen) 6spearsBroccoli (USA/ Chinese) 3.5ozCabbage (coleslaw/ pe-tsai/ sauerkrant) 1cupCarrots 1/2cupCelery 4-in stickCorn 1/2cupCucumber, zucchini,Summer/winter squash
1/2cup
Dark leaf greens; (spinach/ kale/Mustard green/green potato leaves)
3.5oz
Garland chrysanthemum ��� 3.5ozGreen pepper/ pepper paste 1/2cup/ 1TLettuce 1cupLily flower, dried �� 3.5ozMushrooms (USA/ Chinese) 1/2cupOnions, green onion, scallions 3.5ozParsley 1/4cupPotato (baked, boiled/ mashed/ fried/ French fries/ hash brown); w gravy
1or 1cup/10 pieces
Pumpkin ,sweet potato, yam (mashed) 1/2cupTomatoes (raw/ sauce) 1,1cupVegetable juice (tomato juice, etc.) 1bottle
Oils/FatButter; Margarine; Mayonnaise 1TLard – refined ( pork fat ) �� 1TPlant oil (olive, palm, peanut , soybean) 1TSesame oil 1TVegetable oil (safflower, sunflower, corn) 1T
FruitApple( raw/ juice, cider/ sauce) 1,4floz,1/2cupApricot, peaches, plums 3mediumAvocado 1mediumBanana 1mediumCitrus (oranges, tangerines, grapefruit) 1Carambola �� 1mediumGuava ��� ½Lemon 1mediumLitchi ( lychee) 5Mango, Papaya 1mediumMelons (watermelon, Honeydew, Cantaloupe)
1slice,1cup
Mixed fruit (cnd) 1/2cupOrange juice or others: ___________ 4flozPear (raw, cnd, light syrup) 1medium

88
How often?Food list ServingSize
neverTimes/month Times/week
Times/day
0 1 2 3 1 2 3 4 5 6 1 2 3 4+
Fruit
Pineapple 1cupStrawberries, cherries, blueberries 1/2cup
BeveragesBeer 12flozBlack tea, leaves 1tea bagCarbonated beverage (cola / diet) 12flozCoffee w or w/o creamer; sugar 8flozGreen / jasmine tea, leaves 1cupWine (red/white); liquid 3.5floz
Sweets, baked goods
Brownies or dessert bars 1largeCake, cheese cake, coffee cake 1sliceCandy/ candy bar 1.5ozChocolate, sweet 1.45ozCookies, (chocolate chip, etc) 1cupPie 1sliceSweet roll, doughnuts, pastry 1roll
MiscellaneousInstant noodles (brand:__________) 1 packageOnion rings 7ringsSauce (barbecue/honey dipping/ ranchdipping/ sweet & sour dipping/ tartardipping); Tomato katchup; Mustard
1Tb
Salad dressing (blue cheese/ French/Italian/ ranch/ thousand island)
1Tb
Taco (Burrito, Fajita) 1TacoTortilla chips, popcorn, crackers 1ozJams, jellies, syrup, honey 1Tb

89
APPENDIX-G
UNITED STATES FOOD FREQUENCY QUESTIONNAIRE

Food Frequency Questionnaire
Code#: Date:
Please indicate how much and how often you have eaten the following foods after coming to the U.S. When answering think about yourusual diet over the past months. Please considers the serving size and marks how many servings you eat under the column" how often".Forexample, if you have 2 cups (16 fluid oz) of milk at one meal and 1 time per day, mark "2" at the "Column 1" under"Times/day".
How often?Food list ServingSize
neverTimes/month Times/week Times/day
0 1 2 3 1 2 3 4 5 6 1 2 3 4+
Dairy product
Cottage cheese, ricotta 1/2cupCream cheese 1TbOther cheese – Cheddar, Swiss 1sliceCream (whipping cream) 1TIce cream, frozen yogurt 1cupMilk (skim/ 1%/ 2%/ whole, choc.) 8flozSherbet (fruit flavors, Land O'Lakes,orange), ice milk
1/2cup
Shake(chocolate/peach/strawberry/vanilla)
1shake
Sundae (hot fudge/strawberry) 1sundaeYogurt (non/ low/ whole fat) 1cup
Bread/cereal/grain/starches
Brown-rice �� 1/2cupBread dressing 1/2cupCereal; Granola or other grains 1 cupCold breakfast cereal 11/4cupCooked cereals (oatmeal, etc.) 1/2cupChinese noodles;Include wheat flour string ��
1 Bowl
Dasheen (Taro) �� ½Dark bread, wheat flour bread 1sliceDinner rolls or buns, white bread 1English muffins, bagel, rolls 1/2mediumGluten, fried � � 20gMuffin, biscuits, or corn bread 1smallNoodles (Pasta/ Spaghetti w/o sauce) 1/2cupNachos 1servingPancakes, waffles 1,4"diameterPizza 1mediumSteamed bread �� 1mediumWhite rice �� 1/2Bowl
Legumes/ beans /seeds and nutsBeans, such as baked beans, pintos,kidney beans or chili, lima beans
1/2 cup
Green beans, peas, snow peas and others 1/2cup

How often?Food list ServingSize
neverTimes/month Times/week
Times/day
0 1 2 3 1 2 3 4 5 6 1 2 3 4+
Legumes/ beans /seeds and nutsPeanut, peanut butter 1oz, 2TbSoybean curd (tofu)(soft/ dried/ fried/ fermented)
1/2cup
Soybean, fresh without pod �� 1cupSoybean milk �� 1 cup
Meat and poultry products
Beef 2-3ozCroissandwich (cheese/egg/sausage) 1Chicken or turkey w or w/o skin 2-3ozChicken eggs 1largeFast food burger (large/junior)( Fish/ Chicken/ Pork/ Beef)
1
Ham/ Chinese ham 1sliceHot dogs w or w/o bun 2Lamb (mutton) 3.5ozLiver (chicken, pork, beef) 3.5ozLuncheon meat (bologna, etc.) 1sliceMeat balls, Swedish 2-3ozMeat loaf 4ozPig’s blood, cooked 3.5ozPig’s feet 1ozPig’s large intestine 3.5ozPork or fish dried and crushed 1TbPork(fat-trimmed loin, shoulder andbutt)
1oz
Pork ribs, lean 3.5ozPork fat ��� 3.5ozPork medium fat (Bacon, etc.) 3.5ozPork sausage (Chinese/ USA) 1link
Fish and marine products
Cuttle fish; squid 3ozDark meat fish(salmon, mackerel, swordfish) 3ozKelp �� 3.5oz
Laver dried �� 3.5ozLobster 3ozOther fish without dark meat fish 3ozSardines 2Shellfish (clam/ crab, oyster, etc.) 9small/3ozShrimp or (small/ dried) 3oz, 10gSmall fishes (steamed/ dried) ��� 10g

How often?Food list ServingSize
neverTimes/month Times/week
Times/day
0 1 2 3 1 2 3 4 5 6 1 2 3 4+
Vegetables
Asparagus (cooked/ canned/ frozen) 6spearsBroccoli (USA/ Chinese) 3.5ozCabbage (coleslaw/ pe-tsai/ sauerkrant) 1cupCarrots 1/2cupCelery 4-in stickCorn 1/2cupCucumber, zucchini,Summer/winter squash
1/2cup
Dark leaf greens; (spinach/ kale/Mustard green/green potato leaves)
3.5oz
Garland chrysanthemum ��� 3.5ozGreen pepper/ pepper paste 1/2cup/ 1TLettuce 1cupLily flower, dried �� 3.5ozMushrooms (USA/ Chinese) 1/2cupOnions, green onion, scallions 3.5ozParsley 1/4cupPotato (baked, boiled/ mashed/ fried/ French fries/ hash brown); w gravy
1or 1cup/10 pieces
Pumpkin ,sweet potato, yam (mashed) 1/2cupTomatoes (raw/ sauce) 1,1cupVegetable juice (tomato juice, etc.) 1bottle
Oils/FatButter; Margarine; Mayonnaise 1TLard – refined ( pork fat ) �� 1TPlant oil (olive, palm, peanut , soybean) 1TSesame oil 1TVegetable oil (safflower, sunflower, corn) 1T
FruitApple( raw/ juice, cider/ sauce) 1,4floz,1/2cupApricot, peaches, plums 3mediumAvocado 1mediumBanana 1mediumCitrus (oranges, tangerines, grapefruit) 1Carambola �� 1mediumGuava ��� ½Lemon 1mediumLitchi ( lychee) 5Mango, Papaya 1mediumMelons (watermelon, Honeydew, Cantaloupe)
1slice,1cup
Mixed fruit (cnd) 1/2cupOrange juice or others: ___________ 4flozPear (raw, cnd, light syrup) 1medium

How often?Food list ServingSize
neverTimes/month Times/week
Times/day
0 1 2 3 1 2 3 4 5 6 1 2 3 4+
Fruit
Pineapple 1cupStrawberries, cherries, blueberries 1/2cup
BeveragesBeer 12flozBlack tea, leaves 1tea bagCarbonated beverage (cola / diet) 12flozCoffee w or w/o creamer; sugar 8flozGreen / jasmine tea, leaves 1cupWine (red/white); liquid 3.5floz
Sweets, baked goods
Brownies or dessert bars 1largeCake, cheese cake, coffee cake 1sliceCandy/ candy bar 1.5ozChocolate, sweet 1.45ozCookies, (chocolate chip, etc) 1cupPie 1sliceSweet roll, doughnuts, pastry 1roll
MiscellaneousInstant noodles (brand:__________) 1 packageOnion rings 7ringsSauce (barbecue/honey dipping/ ranchdipping/ sweet & sour dipping/ tartardipping); Tomato katchup; Mustard
1Tb
Salad dressing (blue cheese/ French/Italian/ ranch/ thousand island)
1Tb
Taco (Burrito, Fajita) 1TacoTortilla chips, popcorn, crackers 1ozJams, jellies, syrup, honey 1Tb

APPENDIX-H
RECOMMENDED DIETARY ALLOWANCES IN THE UNITED STATES

Recommended Dietary Allowances1 in the United StatesRevised by 1989
19~24 years old 25~50 years oldmale Female male Female
(kg) 72 58 79 63Weight2
(lb) 160 128 174 138(cm) 177 164 176 163
Height2
(in) 70 65 70 64Average energy allowances3
(Kcal)2900 2200 2900 2200
Protein (g) 58 46 63 50
Vitamin A (µµµµg RE) 1000 800 1000 800
Vitamin E (mg αααα-TE) 10 8 10 8
Vitamin C (mg) 60 60 60 60Thiamin (mg) 1.5 1.1 1.5 1.1Riboflavin (mg) 1.7 1.3 1.7 1.3Vitamin B6 (mg) 2.0 1.6 2.0 1.6
Vitamin B12 (µµµµg) 2.0 2.0 2.0 2.0
Calcium (mg) 1200 1200 800 800Iron (mg) 10 15 10 15
1. The allowances, expressed as average daily intakes over time, are intended to provide for individualvariations among most normal persons as they live in the United States under usual environmentalstresses. Diets should be based on a variety of common foods in order to provide other nutrients forwhich human requirements have been less well defined.
2. Weights and heights of Reference Adults are actual medians for the U.S. population of the designatedage, as reported by NHANES II.
3. In the range of light to moderate actively, the coefficient of variation is + 20%.4. Source: National Research Council. 1989. Recommended Dietary Allowances. Washington, D.C:
National Academy Press.

REFERENCE LIST
Buell P, Dunn JE. 1965. Cancer mortality among Japanese Issei and Nisei of California. Cancer 18:656.
Chan CM, Lee CL, Mai SY, Yan SH. 1998. Diet by Calorie Method. Center for Nutrition in the Hospital ofTaipei Medical College.
Chan PL, Lai CY, Wang SL, Seow YI. 1994. Portion Photo of Food Exchange Handbook. Center forNutrition in the Hospital of Taipei Medical College.
Chan JY, 1995. Dietary beliefs of Chinese patients. Nurs Stand. 9(27):30-34.
Chang B, 1974. Some dietary beliefs in Chinese folk culture. J Am Diet Assoc. 65(4): 436-8.
Chau P, Lee H, Tseng R, Downs NJ. 1990. Dietary habits, health beliefs, and food practices of elderlyChinese women. J Am Diet Assoc. 90(4):579-580.
Chen J, Gao J. 1993. The Chinese total diet study in 1990. Part II. Nutrients. J AOAC Int. 76(6):1206-13.
Department of Health. The Executive Yuan, Taiwan. Composition of Foods Used in Taiwan.Http://www.doh.gov.tw/org2/b3/database.
Department of Health. The Executive Yuan, Taiwan. Recommended Daily Nutrient Allowances in Taiwan.Http://www.doh.gov.tw/org2/b3/.
Department of Health. The Executive Yuan, Taiwan. 1993-1996 Taiwan Nutrition Survey.Http://www.doh.gov.tw/org2/b3/nutrition/1-1-1.
Fang J, Madhavan S, Alderman MH. 1996. Cancer mortality of Chinese in New York City 1988-1992. Int JEpidemiol. 25(5):907-12.
Feskanich D, Rimm EB, Giovannucci EL, Colditz GA, Stampfer MJ, Litin LB, Willett WC. 1993.Reproducibility and validity of food intake measurements from a semiquantitative foodfrequency questionnaire. J Am Diet Assoc. 93(7):790-796.
Frances E, Thompson, TB. 1994. Dietary assessment resource manual. American Institute of Nutrition. J.Nutr. 124:2245s-2317s.
Guldan GS, Zhang YP, Li ZQ, Hou YH, Long F, Pu LY, Huang JS. 1991. Designing appropriate nutritioneducation for the Chinese: the urban and rural nutrition situation in Sichuan. J Trop Pediatr.37(4):159-65.
Hayawakari E. 1997. Food and Cooking Data. Women’s Nutrition College, Tokyo, Japan.
He J, Klag MJ, Wu Z, Qian MC, Chen JY, Mo PS, He QO, Whelton PK. 1996. Effect of migration andrelated environmental changes on serum lipid levels in southwestern Chinese men. Am JEpidemiol. 144(9):839-48.

Hess MA. 1997. Portion Photos of Popular Foods. Chicago, III.: American Dietetic Association and theCenter for Nutrition Education, University of Wisconsin-Stout.
Ho SC, Leung PC, Swaminathan R, Chan C, Chan SS, Fan YK, Lindsay R. 1994. Determinants of bonemass in Chinese women aged 21-40 years. II. Pattern of dietary calcium intake and associationwith bone mineral density. Osteoporos Int. 4(3):167-75.
Hrboticky N, Krondl M, 1985. Dietary acculturation process of Chinese adolescent immigrants. Nutr Res.5(11):1185-1197.
Joyce EH, Williams GS. 1998. The 24-hour Food Recall. An Essential Tool in Nutrition Education(videorecording). Cooperative Extension Service. Oklahoma State University. Stillwater, OK.
Kantha SS. 1990. Nutrition and health in China, 1949 to 1989. Prog Food Nutr Sci. 14(2-3):93-137.
Kodama M, Kodama T, Miura S, Yoshida M. 1991. Nutrition and breast cancer risk in Japan. AnticancerRes. 11(2):745-754.
Lau EM, Cooper C. 1993. Epidemiology and prevention of osteoporosis in urbanized Asian populations.Osteoporos Int. 3 Suppl 1:23-6.
Lau EM, Cooper C. 1996. The epidemiology of osteoporosis. The oriental perspective in a world context.Clin Orthop. 323:65-74.
Le Marchand L, Wilken LR, Kolonel LN, Hankin JH, Lyn LC. 1997. Associations of sedentary lifestyle,obesity, smoking, alcohol use, and diabetes with the risk of colorectal cancer. Cancer Res.57(21):4787-94.
Lee HP, Gourley L, Duffy SW, Esteve J, Lee J, Day NE. 1989. Colorectal cancer and diet in an Asianpopulation: a case-control study among Singapore Chinese. Int J Cancer. 15; 43(6):1007-16.
Lee MM, Lee F, Ladenla SW, Miike R. 1994. A semiquantitative dietary history questionnaire for ChineseAmericans. Ann Epidemiol. 4(3):188-197.
Lee MM, Pan WH, Yu SL, Huang PC, 1992. Foods predictive of nutrient intake in Chinese diet in Taiwan:I. Total calories, protein, fat and fatty acids. Int J Epidemiol. 21(5):992-928.
Lee MM, Pan WH, Yu SL, Huang PC, 1992. Foods predictive of nutrient intake in Chinese diet in Taiwan:II. vitamin A, vitamin B1, vitamin B2, vitamin C and calcium. Int J Epidemiol. 21(5):929-934.
Lewis JS, Glaspy MF, 1975. Food habits and nutrient intakes of Filipino women in Los Angeles. J Am DietAssoc. 67(2):122-125.
McAllister G, Farguhar M. 1992. Health beliefs: a cultural division. J Adv Nurs. 17(12): 1447-1454.
Meydani M. 1999. Dietary antioxidants modulation of aging and immune-endothelial cell interation. MechAging Dev. 111(2-3):123-32.

National Research Council. 1989. Recommended Dietary Allowances. Washington, D.C: NationalAcademy Press.
Nomura A, Grove JS, Stemmermann GN, Severson RK. 1990. A prospective study of stomach cancer andits relation to diet, cigarettes, and alcohol consumption. Cancer Res. 50(3):627-631.
Pan YL, Dixon Z, Himburg S, Huffman F, 1999. Asian students change their eating patterns after living inthe United States. J Am Diet Assoc. 99(1):54-7.
Root MM, Hu J, Stephenson LS, Parker RS, Campbell TC. 1999. Iron status of middle-aged women in fivecountries of rural China. Eur J Clin Nutr. 53(3):199-206.
Shaw NS. 1996. Iron deficiency and anemia in school children and adolescents. J Formos Med Assoc.Sep;95(9):692-8.
Shimbo S, Moon CS, Zhang Zw, Watanabe T, Guo YL, Ma WC,Nakatsuka H, Peng CJ, Ikeda M. 1997.Nutrition evaluation of Chinese working women in the city of Tainan, Taiwan. Tohoku J ExpMed. 181(3):339-52.
Stellman SD, Wang QS. 1994. Cancer mortality in Chinese immigrants to New York City. Comparisonwith Chinese in Tianjin and with United States-born whites. Cancer. 74(4):1270-5
Tian HG, Nan Y, Hu G. Dong QN, Yang XL, Pietinen P, Nissinen A. 1995. Dietary survey in a Chinesepopulation. Eur J Clin Nutr. 49(1):26-32.
Tsai KS. 1997. Osteoporotic fracture rate, bone mineral density, and bone metabolism in Taiwan. J FormosMed Assoc. 96(10):802-5.
Tung TC, Huang PC, Li HC, Chen HL, 1961. Composition of foods used in Taiwan. J Formosan MedAssoc. 60(11):973-1005.
Wang Y, Popkin B, Zhai F. 1998. The nutritional status and dietary pattern of Chinese adolescents, 1991and 1993. Eur J Clin Nutr. 52(12):908-16.
Wenkam NS, Wolff RJ. 1970. A half century of changing food habits among Japanese in Hawaii. J AmDiet Assoc. 57(1):29-32.
Wright HS, Guthrie HA, 1995. Dietary Intake Methods. Nutrition Assessment: A Comprehensive Guide forPlanning Intervention. Gaithersburg, MD: Aspen publishers. 165-183.
Yang GI, Fox HM, 1979. Food habit changes of Chinese persons living in Lincoln, Nebraska. J Am DietAssoc. 75(4):420-4.
Yang W. Dietary Fat and Fiber Changes among Asian Immigrants [thesis]. 1994. Reno, Nev: University ofNevada.
Yano K, Rhoads GG, Kagan A, Tillotson J. 1978. Dietary intake and the risk of coronary heart disease inJapanese men living in Hawaii. Am J Clin Nutr. 31(7):1270-1279.

Yu H, Harris RE, Gao YT, Gao R, Wynder EL. 1991. Comparative epidemiology of cancers of the colon,rectum, prostate and breast in Shanghai, China versus the United States. Int J Epidemiol.20(1):76-81.
Ziegler RG, Hoover RN, Pike MC, Hildesheim A, Nomura AM, West DW, Wu-Williams AH, Kolonel LN,Horn-Ross PL, Rosenthal JF. 1993. Migration patterns and breast cancer risk in Asian Americanwomen. J Natl Cancer Inst. 17(85):1819-1827.