Embed Size (px)
Citation preview

Leveraging Agricultural Systems to Improve Nutrition SecurityInvestigation of 10 supply chains and entry points for nutrition

Content1 The state of undernutrition in agricultural supply chains2 Prioritizing 10 supply chains for nutrition interventions 3 Key players in priority commodity chains4 Possible nutrition interventions in agricultural systems5 Call to action
Leveraging Agricultural Systems to Improve Nutrition SecurityInvestigation of 10 supply chains and entry points for nutrition
The state of undernutrition in agricultural supply chainsUndernutrition – a lack of essential micronutrients in diets which im-pedes physical and cognitive development and productivity even when su� cient calories are consumed (hidden hunger) – is a signifi cant global problem. Extensive research has shown severe levels of under-nutrition in the main agricultural producing areas in Africa and Asia, yet levels of awareness remain low.
Agricultural supply chains are a� ected by undernutrition in several ways, which may lead to direct losses in productivity and resources from:
> Reduced labour output and physical productivity due to illness, fatigue or other health related problems;
> Reduced cognitive development and educational performance due to stunting or chronic malnutrition in early life;
> Losses in household resources from increased health care costs.
In recent years global attention has focused increasingly on sustaina-bility programs and certifi cation standards for the production of cash and food crops. These structures usually address productivity, labor conditions, environmentally sustainable production methods and human rights with a view to contributing to economic development more broadly. The promotion of Good Agricultural Practices is at the core of such programs, but nutrition is rarely addressed.
Yet, the paybacks of nutrition investments are high as governments seek to reduce the burden of high health care expenditures. By inves-ting in nutrition, industry can benefi t from a) a more productive work-force, b) improved physical and mental development for future genera-tions and c) more resilient and supportive communities. Consumers, farmers and workers have a shared interest in a global system which is sustainable and equitable; poor nutrition undermines both these goals.
2 3

GAIN’s nutrition secure supply chain program will integrate nutrition interventions into production systems without competing with the current crop production. The program delivers improved nutritional status for farming families by working within a combination of existing complementary farmer training and community development programs to drive nutrition-sensitive sourcing strategies. Combining good agri-cultural practices and good nutritional practices, working with orga-nized farmer groups as part of existing corporate sourcing programs, is impactful, cost-e� cient and o� ers a powerful model which can be replicated across a range of supply chains.
For production regions where undernutrition is a major challenge (fi gure 2) and several agricultural commodities are produced in over-lapping production areas, companies have an opportunity to combine their e� orts and activities on nutrition (see map 1, 2 and 3).
GAIN reviewed 21 of the largest global commodity supply chains 1, ultimately prioritizing 10 which are particularly well-suites for nutrition-sensitive interventions (fi gure 1).
Key elements of analysis were:1 High level of undernutrition in the main producing countries 2
2 Structure of the supply chain (multinational sourcing, consolidated production)
3 Level of export vs level of domestic consumption (prioritizing domestic consumption of nutritious foods and export of cash crops to leverage global consumerism)
4 Strength and organization of ongoing sustainability initiatives (to be leveraged)
Within these 10 prioritized supply chains, the nutrition-sensitive inter-ventions could potentially reach over 400 million smallholder farmers.
Prioritizing 10 supply chains for nutrition interventions
% of world market Smallholders vs. Plantations Export / Domestic
Cash crops
CocoaIvory Coast (34%) Indonesia (15%)Ghana (15%)
90 10
Co� eeVietnam (15%) Indonesia (7%) Ethiopia (4%)
70 30 30
CottonIndia (23%) Pakistan (9%) Predominantly
smallholders
TeaIndia (21%) Kenya (8%) Sri Lanka (7%)
40 60 60
Staple crops
Palm oilIndonesia (45%) Malaysia (40%) 70 30 30
RiceIndia (22%) Indonesia (9%) Bangladesh (7%)
Predominantly smallholders
Nutritious food crops
Banana
India (28%) Philippines (9%) Indonesia (6%)
From smallholder
to large plantations
Cashew
Vietnam (29%) Nigeria (20%) India (16%) Ivory Coast (9%)
Predominantly smallholders
Mango
India (39%) Indonesia (5%) From smallholder
to large plantations
Pineapple
Thailand (12%) Philippines (10%) Indonesia (7%) India (6%)
Predominantly plantations
consumption
Figure 1: Selected 10 supply chains particularly well-suited for nutrition interventions 3
4 5
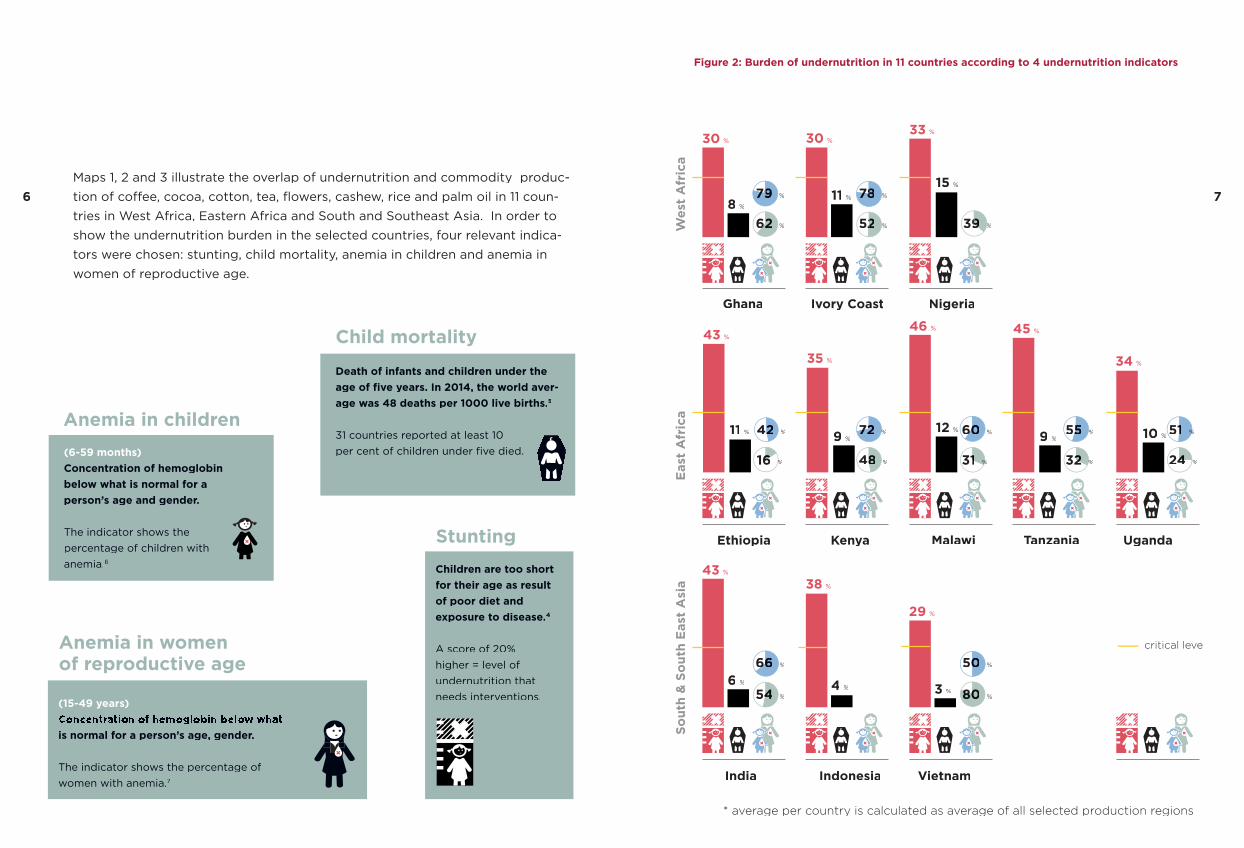
Child mortality
Death of infants and children under the age of fi ve years. In 2014, the world aver-age was 48 deaths per 1000 live births.5
31 countries reported at least 10 per cent of children under fi ve died.
Anemia in women of reproductive age
(15-49 years)Concentration of hemoglobin below what is normal for a person’s age, gender.
The indicator shows the percentage of women with anemia.7
Children are too short for their age as result of poor diet and exposure to disease.4
A score of 20% higher = level of undernutrition that needs interventions.
Stunting
Anemia in children(6-59 months)Concentration of hemoglobin below what is normal for a person’s age and gender.
The indicator shows the percentage of children with anemia.6
Wes
t A
fric
aSo
uth
& S
out
h E
ast
Asi
a
Figure 2: Burden of undernutrition in 11 countries according to 4 undernutrition indicators
* average per country is calculated as average of all selected production regions
Ivory Coast NigeriaGhana
Ethiopia Malawi Tanzania UgandaKenya
India Indonesia Vietnam
Eas
t A
fric
a
30 %
8 %
797979 %
626262 %
30 %
11 % 787878 %
525252 %
33 %
15 %
39393939 %%
43 %
11 % 424242 %
16161616 %%%
35 %
9 %727272 %%
484848 %
46 %
12 % 606060 %
313131 %%%%%
45 %
9 %555555 %%
323232 %%
34 %
10 % 515151 %%%
242424 %
43 %
6 %
666666 %
545454 %
38 %
4 %
29 %
3 %
505050 %
808080 %
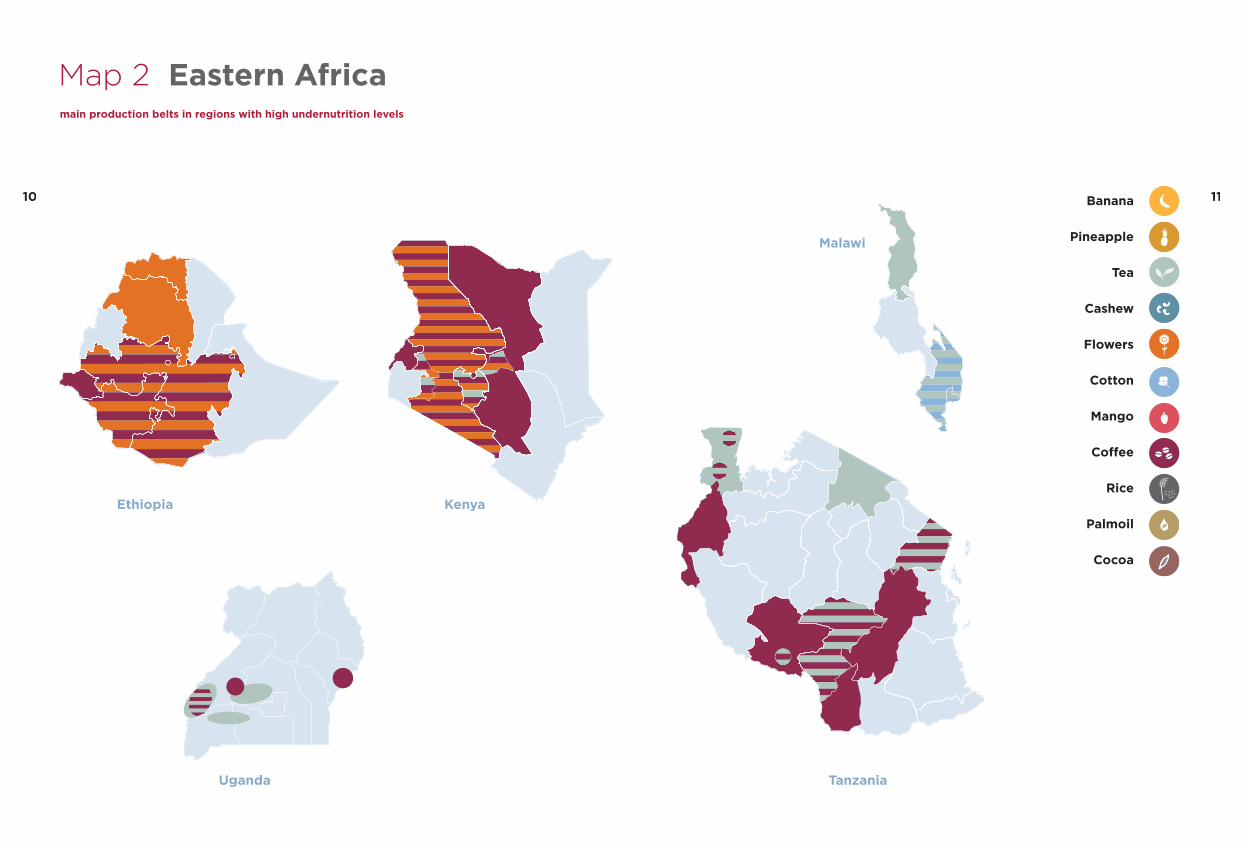
Maps 1, 2 and 3 illustrate the overlap of undernutrition and commodity produc-tion of co� ee, cocoa, cotton, tea, fl owers, cashew, rice and palm oil in 11 coun-tries in West Africa, Eastern Africa and South and Southeast Asia. In order to show the undernutrition burden in the selected countries, four relevant indica-tors were chosen: stunting, child mortality, anemia in children and anemia in women of reproductive age.
critical levelcritical level
6 7
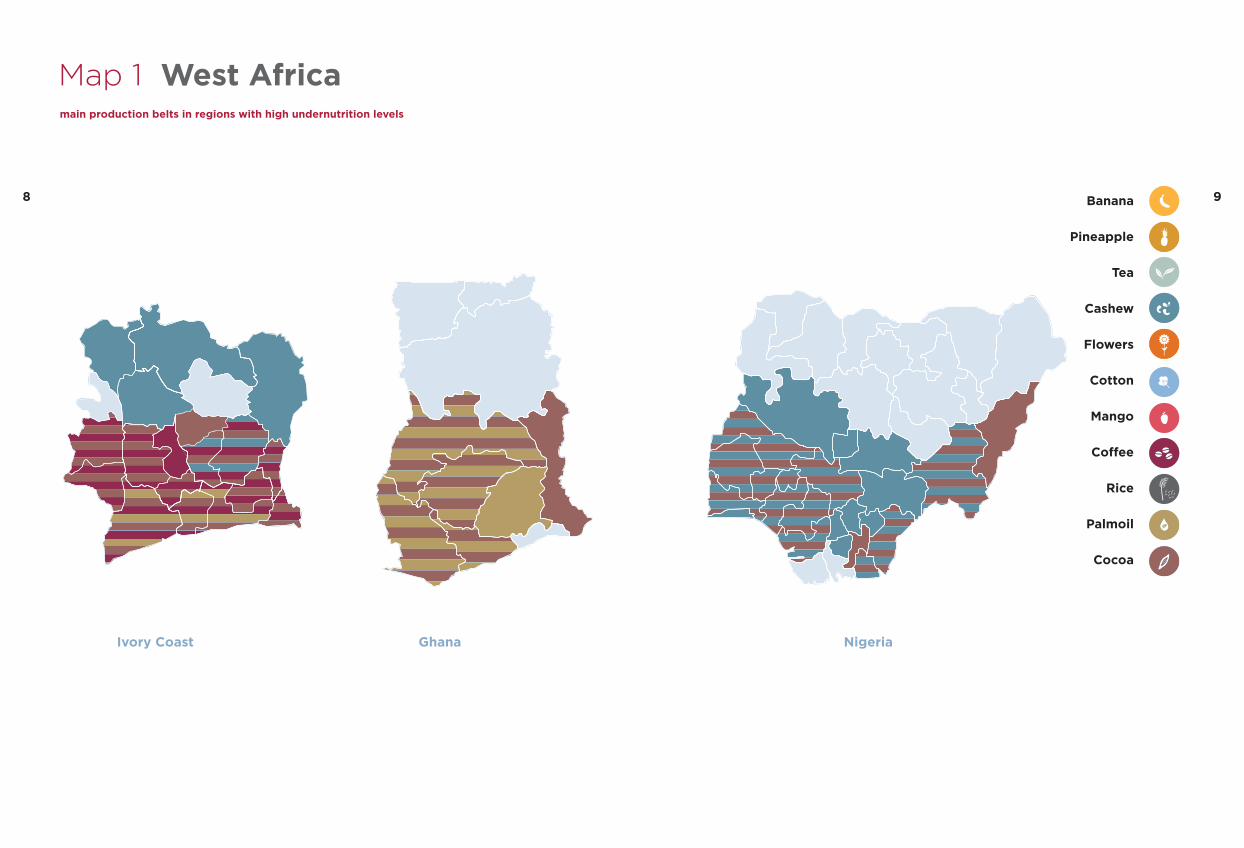
Map 1 West Africamain production belts in regions with high undernutrition levels
Ghana NigeriaIvory Coast
Banana
Pineapple
Tea
Cashew
Flowers
Cotton
Mango
Co�ee
Rice
Palmoil
Cocoa
8 9
KenyaEthiopia
Uganda Tanzania
Malawi
Banana
Pineapple
Tea
Cashew
Flowers
Cotton
Mango
Co�ee
Rice
Palmoil
Cocoa
Map 2 Eastern Africamain production belts in regions with high undernutrition levels
10 11

India Vietnam
Banana
Pineapple
Tea
Cashew
Flowers
Cotton
Mango
Co�ee
Rice
Palmoil
Cocoa
Map 3 South & South East Asiamain production belts in regions with high undernutrition levels
12 13

Indonesia
Banana
Pineapple
Tea
Cashew
Flowers
Cotton
Mango
Co�ee
Rice
Palmoil
Cocoa
14 15
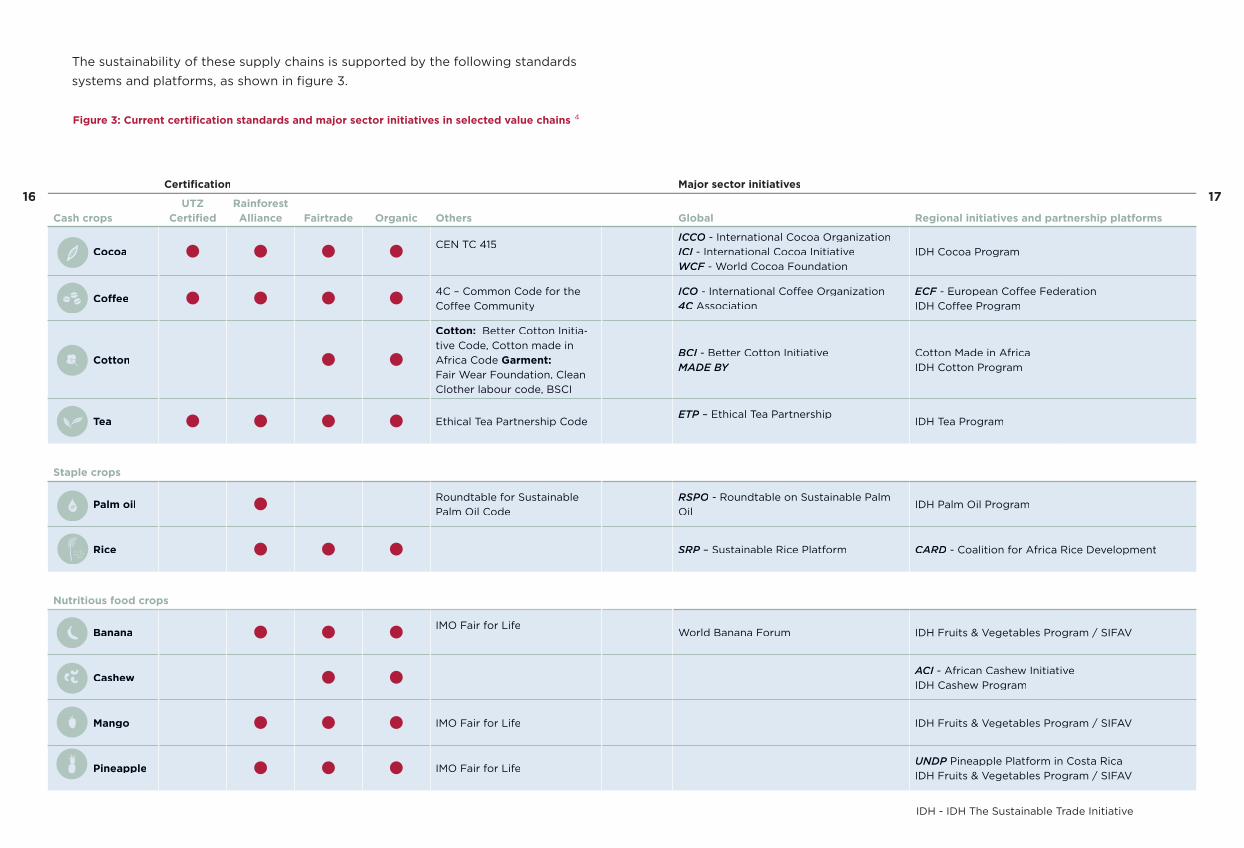
Figure 3: Current certifi cation standards and major sector initiatives in selected value chains 4
Certifi cation Major sector initiatives
Cash cropsUTZ
Certifi edRainforest Alliance Fairtrade Organic Others Global Regional initiatives and partnership platforms
CocoaCEN TC 415
ICCO - International Cocoa OrganizationICI - International Cocoa InitiativeWCF - World Cocoa FoundationWCF - World Cocoa FoundationWCF
IDH Cocoa Program
Co� ee4C – Common Code for the Co� ee Community
ICO - International Co� ee Organization4C Association
ECF - European Co� ee FederationIDH Co� ee Program
Cotton
Cotton: Better Cotton Initia-tive Code, Cotton made in Africa Code Garment: Fair Wear Foundation, Clean Clother labour code, BSCI
BCI - Better Cotton InitiativeBCI - Better Cotton InitiativeBCIMADE BY
Cotton Made in Africa IDH Cotton Program
Tea Ethical Tea Partnership CodeETP – Ethical Tea Partnership
IDH Tea Program
Staple crops
Palm oilRoundtable for Sustainable Palm Oil Code
RSPO - Roundtable on Sustainable Palm Oil
IDH Palm Oil Program
Rice SRP – Sustainable Rice PlatformSRP – Sustainable Rice PlatformSRP CARD - Coalition for Africa Rice Development
Nutritious food crops
BananaIMO Fair for Life
World Banana Forum IDH Fruits & Vegetables Program / SIFAV
CashewACI - African Cashew InitiativeACI - African Cashew InitiativeACIIDH Cashew Program
Mango IMO Fair for Life IDH Fruits & Vegetables Program / SIFAV
Pineapple IMO Fair for LifeUNDP Pineapple Platform in Costa RicaUNDP Pineapple Platform in Costa RicaUNDPIDH Fruits & Vegetables Program / SIFAV
The sustainability of these supply chains is supported by the following standards systems and platforms, as shown in fi gure 3.
IDH - IDH The Sustainable Trade Initiative
16 17

Key players in priority commodity chainsMany global traders and multinational food companies are involved in multiple commodities and are therefore well-placed to integrate nutrition programs across a range of di� erent supply chains they operate, creating substantial economies of scale in program replication (fi gure 4). The information is based on public sources and is not complete due to a lack of transparency in commodity markets.
Figure 4: Main traders and brand-owners in selected 10 supply chains
Cash crops Staple crops
Co� ee Palmoil
Tea Rice10
Cocoa
Cotton9
Main trader
Main trader/brand ownerMain trader/brand ownerMain trader/brand ownerMain trader/brand owner
Main brand-ownersMain brand-owners
processed mangos
Nutritious food crops
Banana
Cashew11
Mango12
Pineapple13
18 19
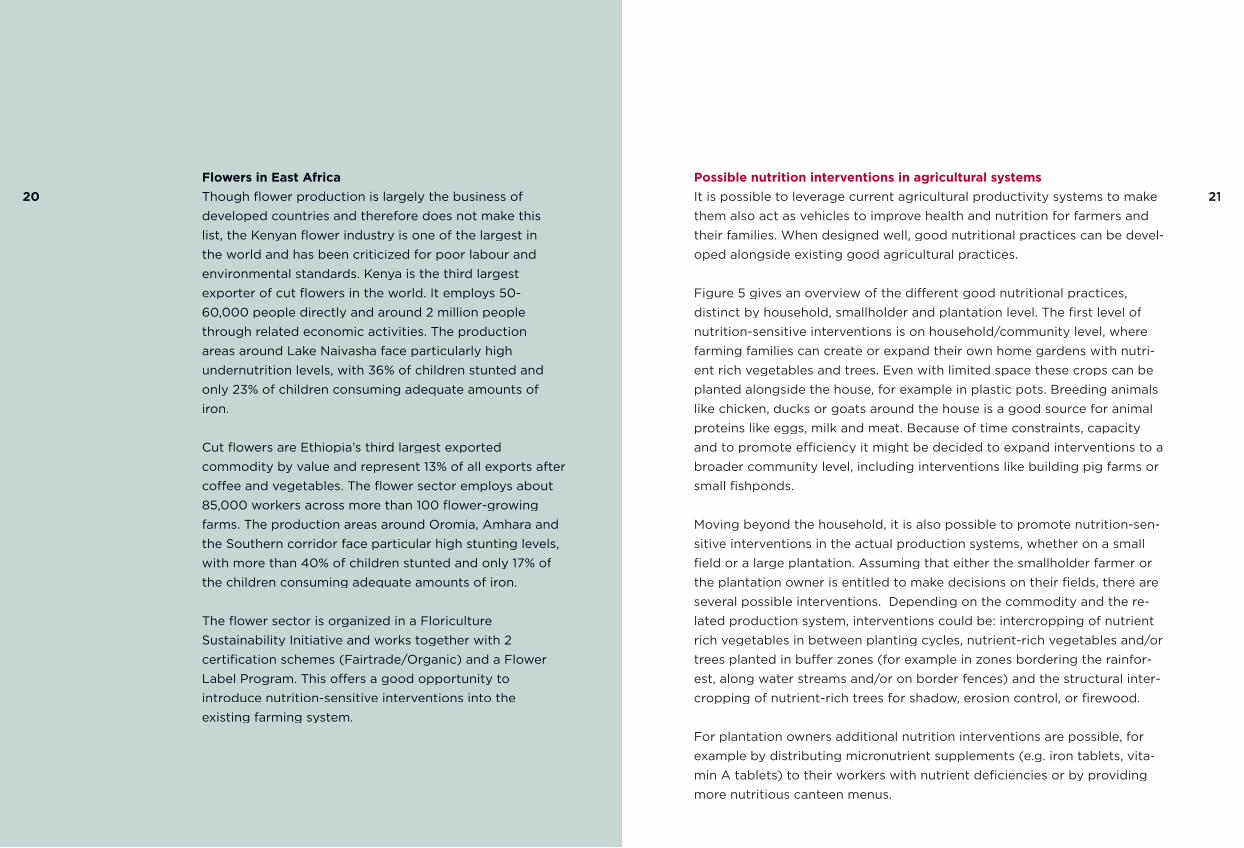
Possible nutrition interventions in agricultural systemsIt is possible to leverage current agricultural productivity systems to make them also act as vehicles to improve health and nutrition for farmers and their families. When designed well, good nutritional practices can be devel-oped alongside existing good agricultural practices.
Figure 5 gives an overview of the di� erent good nutritional practices, distinct by household, smallholder and plantation level. The fi rst level of nutrition-sensitive interventions is on household/community level, where farming families can create or expand their own home gardens with nutri-ent rich vegetables and trees. Even with limited space these crops can be planted alongside the house, for example in plastic pots. Breeding animals like chicken, ducks or goats around the house is a good source for animal proteins like eggs, milk and meat. Because of time constraints, capacity and to promote e� ciency it might be decided to expand interventions to a broader community level, including interventions like building pig farms or small fi shponds.
Moving beyond the household, it is also possible to promote nutrition-sen-sitive interventions in the actual production systems, whether on a small fi eld or a large plantation. Assuming that either the smallholder farmer or the plantation owner is entitled to make decisions on their fi elds, there are several possible interventions. Depending on the commodity and the re-lated production system, interventions could be: intercropping of nutrient rich vegetables in between planting cycles, nutrient-rich vegetables and/or trees planted in bu� er zones (for example in zones bordering the rainfor-est, along water streams and/or on border fences) and the structural inter-cropping of nutrient-rich trees for shadow, erosion control, or fi rewood.
For plantation owners additional nutrition interventions are possible, for example by distributing micronutrient supplements (e.g. iron tablets, vita-min A tablets) to their workers with nutrient defi ciencies or by providing more nutritious canteen menus.
Flowers in East AfricaThough fl ower production is largely the business of developed countries and therefore does not make this list, the Kenyan fl ower industry is one of the largest in the world and has been criticized for poor labour and environmental standards. Kenya is the third largest exporter of cut fl owers in the world. It employs 50- 60,000 people directly and around 2 million people through related economic activities. The production areas around Lake Naivasha face particularly high undernutrition levels, with 36% of children stunted and only 23% of children consuming adequate amounts of iron.
Cut fl owers are Ethiopia’s third largest exported commodity by value and represent 13% of all exports after co� ee and vegetables. The fl ower sector employs about 85,000 workers across more than 100 fl ower-growing farms. The production areas around Oromia, Amhara and the Southern corridor face particular high stunting levels, with more than 40% of children stunted and only 17% of the children consuming adequate amounts of iron.
The fl ower sector is organized in a Floriculture Sustainability Initiative and works together with 2 certifi cation schemes (Fairtrade/Organic) and a Flower Label Program. This o� ers a good opportunity to introduce nutrition-sensitive interventions into the existing farming system.
20 21

Call to action Undernutrition is not limited to the agricultural sector, but with existing programs that reach deep into farming communities, and a clear and ongoing commitment to sustainability, the agricultural sector is ideally placed to integrate the proposed nutrition interventions at scale.
Poor nutrition for farming families undermines private sector goals on productivity, quality, future supply and ethical behaviour. Therefore the primary source of investment of the proposed nutrition-sensitive interventions should come from companies wanting to strengthen their agricultural supply chains.
The 10 prioritized supply chains are particularly well-suited for nutrition interventions because of the strong infrastructure already in place, and with global consumers increasingly demanding ethically sourced pro-ducts there is added incentive to invest in these commodity systems. By building the models which bring these sectors closer together, generating the evidence base on the link between nutrition, health and productivity, and by sharing the learning and best practice for replica-tion and scaling up, it is possible to create dramatic and sustainable impact on the lives of farming families. We call on others, and espe-cially companies sourcing from these systems, to invest in scaling up nutrition programming. The cost of these programs is relatively small, and the impact, both for workers and the workforces of tomorrow, is tremendous. Join us.
GAIN’s upcoming program paper will further describe the nutrition landscape and recommendations for nutrition secure supply chains. For more detailed program information, please contact:Mieke van Reenen: [email protected]ärbel Weiligmann: [email protected]
Figure 5: Nutrition-sensitive interventions according to di� erent levels
Household /community> Home/kitchen garden with
nutrient rich vegetables and/or trees (in the soil or in plastic pots)
> Animal husbandry of chicken, ducks, goats, small fi shponds
Smallholder farm & plantation> Intercropping of nutrient rich
vegetables in the beginning of planting crops
> Bu� er zones, borders with nutrient rich vegetables and/
or trees (on fences, along water streams, bordering rainforest)
> Structural intercropping of nutrient rich trees for shadow / erosion control / fi rewood
22 23
Footnotes1 21 commodities were selected according to production volume and size of
global trade for 3 di� erent segments: cash crops, food crops and nutritious
food crops; investigation done by Fair & Sustainable http://www.fairandsus-
tainable.nl/
2 > 30% of global production, undernutrition data per country available via:
Demographic and Health Surveys (DHS), World Health Organization (WHO),
Welthunger Index, etc
3 FAO: http://faostat.fao.org/ and sector analysis
4 WHO : http://www.who.int/ceh/indicators/0_4stunting.pdf
5 UNICEF(2014) State of the world’s children
6 From severe to mild degrees: haemoglobin <70.0 g/L until 100.0-109.0 g/L.
http://www.who.int/vmnis/indicators/haemoglobin.pdf
7 From mild until severe degrees: for non pregnant women haemoglobin <80
g/L until 110.0-119.0g/l and for pregnant women haemoglobin <70.0 g/L until
100.0-109.0 g/L. http://www.who.int/vmnis/indicators/haemoglobin.pdf
8 Data collection done by F&S http://www.fairandsustainable.nl/
9 Cotton is di� erentiated into two supply chains: cotton raw material and
textile production. Traders are for cotton production and brand owners for
textiles.
10 Number 2 commodity in the world, but least globally traded one; only 5–7 %
of global rice production is traded
11 The cashew market is scattered in medium size nut companies.
Here only the biggest users of cashews are taken into account
12 The mango supply chain is di� erentiated into two routes: the fresh mango
trade and the processed mangos trade for fruit juices. Here processed man-
gos are considered as inputs for fruit juices of major beverage companies
13 Fresh and processed pineapples
References
Eastern Africa:
Ethiopia: Central Statistical Agency (Ethiopia) and
ICF International (2012) Ethiopia demographic and
health survey 2011. Addis Ababa, Ethiopia and Cal-
verton, Maryland, USA: Central Statistical Agency
and ICF International.
Kenya: Kenya National Bureau of Statistics (KNBS)
and ICF Macro (2010) Kenya demographic and
health survey 2008-09, Calverton, Maryland: KNBS
and ICF Macro.
Malawi: National Statistical O� ce (NSO) and ICF
Macro (2011) Malawi demographic and health survey
2010. Zomba, Malawi, and Calverton, Maryland,
USA: NSO and ICF Macro.
Tanzania: National Bureau of Statistics (NBS) (Tan-
zania) and ICF Macro (2011) Tanzania demographic
and health survey 2010. Dar es Salaam, Tanzania:
NBS and ICF Macro.
Uganda: Uganda Bureau of Statistics (UBOS) and
ICF International Inc. (2012) Uganda demographic
and health survey 2011. Kampala, Uganda: UBOS
and Calverton, Maryland: ICF International Inc.
West Africa:
Ghana: Ghana Statistical Service (GSS), Ghana
Health Service (GHS), and ICF Macro (2009)
Ghanademographic and health survey 2008. Accra,
Ghana: GSS, GHS, and ICF Macro.
Ivory Coast: Institut National de la Statistique (INS)
et ICF International(2012) Enquête démogrphique
et de santé et à indicateurs multiples de Côte
d’Ivoire 2011-2012. Calverton, Maryland, USA: INS et
ICF International.
Nigeria: National Population Commission (NPC)
[Nigeria] and ICF Macro (2009) Nigeria demo-
graphic and health survey 2008. Abuja, Nigeria:
NPC and ICF Macro.
South and Southeast Asia:
India: International Institute for Population
Sciences (IIPS) and Macro International (2007)
National family health survey (NFHS-3), 2005-
06, India: Volume I; Mumbai: IIPS.
Indonesia: Statistics Indonesia (Badan Pusat
Statistik – BPS), National Population and Family
Planning Board (BKKBN), Kementerian Kes-
ehatan (Kemenkes – MOH)and ICF International
(2013) Indonesia demographic and health
survey 2012. Jakarta, Indonesia: BPS, BKKBN,
Kemenkes, and ICF International.
WFP (2009) A food security and vulnerability
atlas of Indonesia. Dewan Ketahanan Pangan,
Departemen Pertanian RI and WFP.
Vietnam: Committee for Population, Family
and Children (Vietnam} and ORC Macro (2003)
Vietnam demographic and health survey 2002.
Calverton, Maryland, USA: Committee for Popu-
lation, Family and Children and ORC Macro.
Unicef (2010) Vietnam general nutrition survey.
2009-2010.
Ninh NX, Khan NC, Vinh ND and Khoi HH and
National Institute of Nutrition (NIN) (2003)
Successful micronutrient programs: micronutri-
ent defi ciency control strategies in Vietnam.
Hanoi, Vietnam.
Undernutrition data are collected from the following sources:24 25

Colophon © 2014, Leveraging Agricultural Systems to Improve Nutrition Security Global Alliance for Improved Nutrition (GAIN)
Citation: Freeman, M., Van Reenen, M., Weiligmann, B. (2014): Leveraging Agricultural Systems to Improve Nutrition Security, Global Alliance for Improved Nutrition (GAIN)
Design and graphs www.tegenwind.eu
Contact
For more detailed program information, please contact:
Global Alliance for Improved Nutrition (GAIN)Netherlands o� ceSpaklerweg 141096 BA Amsterdam
Bärbel WeiligmannSpecial Advisor for Global Value [email protected]+31 6 42 25 96 24
Mieke van ReenenAssociate Global Value [email protected]+31 6 25 59 55 05
26 27

Global Alliance for Improved Nutrition GAIN
Driven by a vision of a world without malnutrition, GAIN was created in 2002 at a Special Session of the U.N. General Assembly on Children. GAIN supports public-private partnerships to increase access to the missing nutrients in diets necessary for people, communities and economies to be stronger and healthier. With a current daily reach of over 811 million people in more than 30 countries, GAIN’s goal is to improve the lives of one billion people by 2015 within the most vulnerable populations around the world through access to sustain-able nutrition solutions.
Please visit us at www.gainhealth.org, follow us on Twitter @GAINalliance and like us on Facebook at www.facebook.com/GAINalliance.