Embed Size (px)
Citation preview

1
Investigation into the Saturn V velocity and its ability to place the stated payload into lunar orbit
S. G. Pokrovsky, Ph.D Candidate of Technical Sciences
General Director of scientific-manufacturing enterprise Project-D-MSK
Abstract
A frame-by-frame examination of the motion picture film footage of the first stage separation of the Apollo 11 Saturn V rocket was made. The velocity achieved at the separation point was found to be significantly (800-1100m/s) lower than that required to satisfy the stated flight plan. This finding implies that the declared payload needed for a return lunar mission could not have been propelled to the Moon.
Introduction
Doubts about the veracity of the Apollo lunar missions arose immediately after the 1968-72 flights. To a large extent this was due to the release of a considerable amount of photographic stills and film/video material by NASA. Detailed analysis of the material led some to conclude that the imagery was not taken on the surface of the Moon, but the sheer volume of material involved is so great that it is technically impossible to come to a definitive conclusion regarding the reality of the Apollo missions by analysis of the photographic material alone.
Consequently it was decided to study the underlying rocket engineering.
Suspicions of the authenticity of the flights on engineering grounds are based on the fact that the NASA contractors progressed from producing very weak rocket engines (NASA first launched heavyweight satellites of 3-4 tons into LEO in 1964) to record-breaking engines capable of powering a manned lunar mission, in a suspiciously short timeframe. But following the termination of the "Race to the Moon," the development of these record-breaking engines came to an end and the technology has not been used since. This fact is the reason for this study. If the characteristics of the engines were not as stated by NASA, then this lack of capability would have affected the trajectory characteristics of the Saturn V booster and the Apollo craft. In the body of the photographic, film/video documentation, there are recordings of these rocket launches. And among this material there are films of the flight near the staging point (SP) of the first stage, with the Saturn V booster retro-rockets firing, looking like an explosion [1]. This booster film footage provided ideal material for the verification of the declared rocket performance of the Saturn V.
Verification Process
The Saturn V booster recordings provide a means of verification of the performance capabilities. First stage separation occurred at the height of 65-67 km at 2360 m/s speed in the rotating Earth frame or 2750 m/s in the absolute frame [2]. Four liquid-fuel F-1 engines cut off, staging occurs, and eight first stage retro-rockets ignite, each with a 39-ton force. The retro-rocket firing time is 0.66 seconds. S-IC retro-rockets plume thrusts onward.

2
At a point 0.20 secs before staging the eight second stage ullage-rockets fire. Then the liquid hydrogen second stage J-2 engines start signal is given. 2.40 secs after staging, the second stage J-2 engines are in steady-state operation.
Below is an extract from the Earth’s atmosphere parameters table at the SP, (taken from [3]).
Table 1. Earth’s atmosphere parameters at an altitude of 30‐75 km.
Temperature, degrees
Mean free path of molecules,
mm Altitude,
km C K
Pressure, kg/m2
Density, kg/m3
Speed of sound, m/s
NAKA Grimminger 30 ‐55.0 218.0 120.1 1864 . 10‐5 296.0 0.0047 0.006 35 ‐33.0 240.0 56.48 795 . 10‐5 310.6 0.011 0.014 40 +3.7 276.7 29.35 358 . 10‐5 333.5 0.024 0.03 45 +40.3 313.3 16.56 178 . 10‐5 354.9 0.05 0.07 50 +87.0 350.0 9.970 96 . 10‐5 375.1 0.09 0.11 55 +87.0 350.0 6.167 59 ∙ 10‐5 375.1 0.15 0.18 60 +87.0 350.0 3.820 36.6 . 10‐5 375.1 0.24 0.29 65 +46.4 319.4 2.315 24.3 10‐5 358.3 0.36 0.46 70 +15.9 288.9 1.335 15.5 . 10‐5 340.7 0.56 0.68 75 ‐14.7 258.3 0.725 9.4 ∙ 10‐5 322.2 0.92 1.06
The SP is located in the uppermost part of the mesosphere. This is a zone of higher air temperature and consequently faster speed of sound. Air density here is low, approximately 0.01-0.02% of sea level value, but not insignificant. The mean free path of molecules is about 0.5mm. Therefore all laws of gas dynamics apply to large objects such as a rocket 100m long with a diameter of 10m.
Examination of the film footage
The clip [1] is real time motion picture film shot during the Apollo 11 flight of the Saturn V booster. The clip length according to the playback timer is 30 secs. It contains 726 frames which correspond to the standard shooting rate of 24 frames per second.
Image 1a. Rocket flight before the first stage engines cut off.
Image 1b. Rocket flight four frames after cutting off the first stage engines. Second stage ullage‐rockets have been ignited.
3
The film clip starts with frames of the moving rocket with engines firing (just under 7 secs –165 frames). In accordance with the S-5 operation [2], one of the five liquid rocket engines (LRE) F-1 has been already cut off; for the last seconds before staging the flight is performed on four engines. On viewing the clip frames, however, there is no sense that the glowing torch was generated by peripheral engines stretching beyond the rocket dimensions. Most likely, contrary to the description, only one LRE appears to be working – the central one. But this likelihood was not presumed in the study.
Before staging, the command to cut off peripheral LREs is given. The footage clearly shows that the broad stream of exhaust from the engines reduces sharply.
After a further 14 frames second stage ullage rocket ignition occurs.
With further onward rocket movement the first-stage retro-rockets fire. The short (0.66 sec) release of considerable energy and a significant amount of combustion products (about 1 ton) gives the impression of an explosion at the moment of separation. The air blast propagates in the atmosphere, followed by expansion at substantially supersonic speed in the radial to the trajectory of a clearly-visible cloud of solid propellant fuel combustion products. Expansion of the explosion cloud relative to the flight direction causes the cloud to conceal the rocket completely from view.
Image 2a. Frame just before the visible "explosion" cloud growth associated with the firing of retro‐rockets (frame 188).
Image 2b. The beginning of "explosion" cloud formation (frame 189).
Image 2c. Shock front and the cloud of solid propellant products are catching up with rocket head (frame 192).
Image 2d. Retro‐rockets firing is complete. Smoke cloud is lagging behind (frame 213).

4
Just over two seconds following the end of the retro-rocket firing sequence the work of the second stage engines was determined. This is visible due to the increased brightness of the parabolic trace (decorated shock) in front of the separated first stage.
Image 3a. A bright glow is observed in the gap between the stages, indicating that the second stage engines have ignited (frame 266).
Image 3b. The gap between the stages is increasing. The compression shock begins to loose brightness.
Image 3c. The gap grows larger. The second stage engines exhaust plume is visible in the gap between the stages.
Image 3d. The distance between the stages is now significant. The first stage plume brightness abruptly diminishes – this is 13 secs after the retro‐rockets have fired.
There is a gradual lag between the first stage and the second stage.
An immediate explanation of the physical process was required, in particular, with regard to the increase and subsequent diminishing of the first stage plume.
Firing the solid retro-rockets (the "explosion") causes a sharp deceleration of the first stage and outflow of residual fuel in empty tanks from the turbo-pump assembly and/or from the combustion chamber injectors. Residual fuel in the almost empty tank is in the form of a spray. After the impulse, throwing back from the pipelines, the spray appears to re-occupy the entire tank and to pass through the not-fully-sealed channels back to the injectors.
On ignition, the second stage engine exhaust hits the flat head of the first stage, causing a similar effect on the stage, decelerating and throwing first stage residual fuel forward (Images 3a, 3b). It should be noted, however, that a significant torch behind the first stage is clearly observable while the second stage engines jet (in Image 3) is still clearly visible. Negative acceleration created by the second stage engines’ gas pressure head is not enough to push the residual fuel to

5
the forward part of the first stage tanks. But when the first stage has moved approximately 150-180 meters from the second stage, collapse of the previously "moved apart" air again causes the effect of the first stage braking.
Rigorous calculation could demonstrate the actual thrust of the second stage engines. But this is beyond the scope of this study.
Speed measurement based on the exhaust plume lag
An aerosol cloud is still present in the air after the retro-rocket firing sequence, which creates lag. Image 4 shows 16 consecutive frames. It spans the period from the first two frames in which the cloud is positively developing through to the moment when the cloud is leaving the camera’s field of view.
Image 4. Lagging aerosol clouds of solid fuel retro‐rocket residues after completion of the firing sequence – frame numbers 210‐225. The frame numbers are in rows from left to right, second row starts with frame 214, the third from frame 218 etc.

6
Obviously, while the cloud is developing and outrunning the rocket nose cone, it is moving at a speed not less than the speed of the rocket itself. Later it is slowing down to hang in still air. At the same time the velocity of the cloud lag from the rocket is increasing. The asymptotic limit of this growth is the speed of the rocket itself.
Measurement of the distance between the leading edge of the cloud and the rocket nose cone was made. The distance was correlated to the length of the head part visible in the image frames, which were taken as 57.5m. The total length of the rocket is 110m (43 pixels), the first stage is 42.5m, and the length of the so-called “needle” on the rocket nose cone is 10m, which is relatively thin and obviously not visible. The speed was calculated based on the standard filming rate of 24 frames per second (fps). The results of these measurements and estimates of the speeds of the cloud moving away are summarized in Table 2 and shown on the graph Figure 1. Table 2. Speed of the aerosol cloud front moving away from the solid fuel retro‐rocket exhaust.
Frame No. Cloud front gap (pixels)
Cloud front gap (m)
Speed of the aerosol cloud front moving away (m/s)
210 ‐ ‐ ‐ 211 ‐10 ‐23 0 212 ‐7.6 ‐18 120 213 1.7 4 528 214 15.2 35 744 215 31.6 73 912 216 49.6 115 1008 217 71 164 1176 218 90.4 209 1080 219 114 263 1296 220 137 316 1272 221 159 367 1224 222 183.4 424 1368 223 207 478 1296 224 230 531 1272
Figure 1. The speed of the aerosol cloud front moving away (m/s) by frames.
This chart shows the average curve and the asymptote V = 1300 m/s.
7
The speed of the cloud lag asymptotically increases to 1300 m/s, which is 1100 m/s below NASA’s specified rocket velocity at SP.
It is quite clear that there are no physical reasons for the aerosol cloud to asymptotically brake until reaching the essentially supersonic speed of 1100 m/s relative to undisturbed air. The cloud expansion in the direction of the rocket flight with velocity not exceeding the speed of its radial expansion can be accepted. For example, by frame 219 the radial velocity of the cloud expansion is 150-220 m/s and continues to decline.
Thus, on the assumption that the film was shot at 24 fps, the speed calculated from the lag of the aerosol cloud is V = 1300-1520 m/s. Obviously, the range should be extended to the value of the asymptotic speed measurement error, not exceeding 100 m/s:
V = 1200-1600 m/s
Motion picture frame rate
In these measurements the frame rate of 24 fps was used. But even though it corresponds to the number of frames in the film sequence, we cannot exclude the possibility that the film record was edited. The lack of speed of the rocket against the upper estimated limit requires an explanation. To account for the lack of the rocket speed, the camera frame rate would have to have been 36 fps. The firing time of the retro-rockets
In accordance with the rocket description the solid fuel retro-rockets’ firing lasts for 0.66 secs in the film sequence. Clear signs of the firing of the retro-rockets appear on the 189th frame. And it was already clear that the motors were not firing in frame 211. Total frames: 210-188 = 22 frames.
If the camera was shooting at 24 fps, then 0.66 secs corresponds to 16 frames. However, the time of the last portion of gas moving to the leading edge of the "blast" cloud should be taken into consideration. Given the measurement data from the exhaust plume lag, as well as the cloud front radius of at least 50m, it must be assumed that that the last portion of gas crossed 130m to the most remote point from the engines on the last frame, fixing the positive development of the "blast" cloud.
The relative velocity of gas at the nozzle exit in nominal mode is about 2000 m/s. The final speed at the cloud front is zero. The average is 1000 m/s. The distance of 130m is traversed for 0.13s ~ 3 frames. But solid fuel engines have a bell curve of pressure in the combustion chamber over time. By completion of the solid engines’ operating sequence the pressure drops substantially. Accordingly, the velocity of gas at the nozzle exit decreases. And the average relative (relative to the rocket) velocity of the solid propellant products to the front of the cloud is likely to be lower, about 500 m/s. From the frame-by-frame analysis, the retro-rockets’ firing time looks right, and tallies with the assumed shooting rate of 24 fps, especially when taking into consideration the last portion of the gas travel delay of a quarter of a second to the front of the cloud.

8
A framing rate of 36 fps – the minimum needed to interpret the results of the cloud’s lagging speed to correspond with NASA’s published rocket velocity – is in sharp contrast with the frame-by-frame record of the retro-rocket’s actual performance. In the event, only two-thirds would correspond to 24 frames – six to ten additional frames would need to be added for the last portion of gas to approach the front of the cloud.
Time gap between main engines switching off and ullage-rockets firing
In full accordance with the shooting speed of 24 fps, the observed commencement of the main engines’ exhaust plume resizing ocurrs at frame 165, and separates from the apparent beginning of the ullage-rockets firing (frame 180) at 14-15 frames = 0.6 sec.
Aerosol cloud turbulence
The aerosol cloud (Image 4) which had a flat front in radial direction, begins to change its shape into a curl at frame 216. This is actually possible when the speed is less than the speed of sound. Provided that the shooting speed is 24 fps, the speed of radial expansion of the cloud between frames 215 and 216 is estimated to be at 330 m/s – at, or slightly less than, the speed of sound at separation altitude.
This physical marker is very accurate. Even increasing the shooting speed to 27 fps would result in a supersonic mode (at SP conditions) in which case the turbulence of the cloud would be unreal, as turbulence cannot form under such conditions. Therefore there can be no question of a shooting speed of 36fps, the minimum necessary to substantiate the NASA’s claimed rocket velocity. It was noted that this marker works exactly on the same frames that determine the rocket speed – i.e. the possible “editing” explanation was no longer tenable.
Speed measurement based on the oblique shock wave angle
In addition to the measurements that require knowledge of the film shooting speed, the supersonic motion allows the use of speed markers, which is quite independent of the shooting speed. The movement of objects at supersonic speeds causes the formation of surfaces with abrupt changes of gas medium characteristics. At relatively low speeds in the range of 1-2 times the speed of sound (M = 1-2) such a surface is called a Mach cone.
Image 5 below is a snapshot of a flying projectile (from the first photos taken by Ernst Mach).
Image 5. A projectile flying at supersonic speed. The trailing "whiskers" are air shocks acquiring a cone shape at a certain distance from the body. A normal shock wave is visible at the front of the blunt head.

9
The surfaces of substantial changes in air parameters are not usually visible. But in some cases –appropriate lighting or in the presence of shock decorating particles – they can become noticeable. In the case of the Saturn V shock waves they are decorated or ornamented with aerosol particles emitted with the gas resudues of the retro-rockets. The so-called "normal shock" forms in front of a surface with a poor aerodynamic shape. If an object is sharpened, then at speeds of M> 2 an "oblique shock" is formed around it. Oblique shock wave theory of a stream around a wedge is well developed. Figure 2 shows a schematic diagram of the angles and velocities from the classic textbook by Loitsiansky [5]. Airflow encounters a wedge at a speed of V1 directed along the axis 0x. A wedge with an angle of θ, called a corner angle, deflects streamlines. Perpendicular to the diagram the surface of discontinuous property changes is formed along the line 0С – an oblique shock, forming an angle β with the axis 0х.
Equations relating the angles θ and β with a Mach number in the incident upstream flow М1 can be obtained. The results of solving these equations are presented in the form of charts.
Figure 2. Angles and velocity components in the incident upstream deflected by a wedge forming an oblique shock [5].
The flight of a rocket with a nose cone is quite similar to the example of a wedge. The corner angle corresponds to half of a nose cone angle. In the specific case of the Saturn V we can simply measure the cone angle in the photograph (Image 6).

10
Image 6. Measurement of Apollo to Saturn V booster adapter angle. The linear dimensions measured in pixels are presented in the photo: the rocket height with its needle (110m) and the second stage tank diameter (10.1m). A good (within 5%) match of the vertical and horizontal dimensions ratio shows that the angle of the cone adapter is not distorted in this photograph.
The angle of the oblique shock occurring in the flight at staging can be measured in a photograph taken from an aircraft and published in the book Full Moon [4]. Using this photo, it is possible to determine how distorted the adapter angle is, due to the fact that the angle of vision of the rocket is not absolutely straight, there is some distortion but it is insignificant.
Image 7. The nose cone angle and full oblique shock angle in the Apollo 11 flight at the first stage separation point. From [4].
Accounting for distortions in the range of 10-15% this gives half the angle of an oblique shock wave of not less than 22.5 degrees. Far more significant distortions associated with three-dimensional rocket motion appear in the film sequence. By comparison between the apparent rocket length and its diameter, as seen in the footage, a value for the tangent distortion of 0.65-0.75 was obtained.

11
a) 192nd frame b) 207th frame c) 213th frame d) 214th frame
Image 8(a‐d). The Saturn V oblique shock wave angles near the first stage separation point in the film footage. The tangent’s distortion factor is 0.65‐0.75.
Nevertheless, as can bee seen, the shock angles repeat a few times. Accounting for the distortion factor leads to the same range of cone half-opening angles of 23-26 degrees. The chart below from [5] clearly shows that at such angles β the upstream Mach number is within 3-4M.
Figure 3. Chart of oblique shock angle dependence on the corner angle of upstream deflection. The labels of oblique shock angles of 23 and 26 degrees are shown to the left of the ordinate axis. Lines extending these two labels indicate that upstream velocity is in the range of 3‐4M.
For a more precise Mach number calculation of the rocket chart [6] was used. Applying the chart, a range of Mach 3.1-3.85 is obtained and the speed range is 1100-1350 m/s. (The speed of sound at the SP was approx 350m/s). It is possible that staging actually occurred at a lower height. The speed of sound in the mesosphere does not change significantly between the heights of 40-65 km. At an altitude of 50-60 km the speed of sound (see Table 1) is at maximum and equals 375 m/s, hence the range of acceptable craft speeds increases by about 100m/sec. Therefore:
V =1100-1450 m/s

12
Figure 4. Evaluation of Mach number for Saturn V upstream air, using the chart [6]. The oblique shock angles of 22.5 and 26 degrees are found in the gap between two parts of the chart. The range of Mach numbers obtained for the rocket streamlining at oblique shock angle β= 22.5о ‐26о and corner angle θ= 9.5о is shown below. The velocity range was 3.1‐3.85 M, which at SP height corresponds to 1100‐1350 m/s. If the SP was located slightly lower than the declared height (about 60 km), the speed assessment allows for up to 1450 m/s.
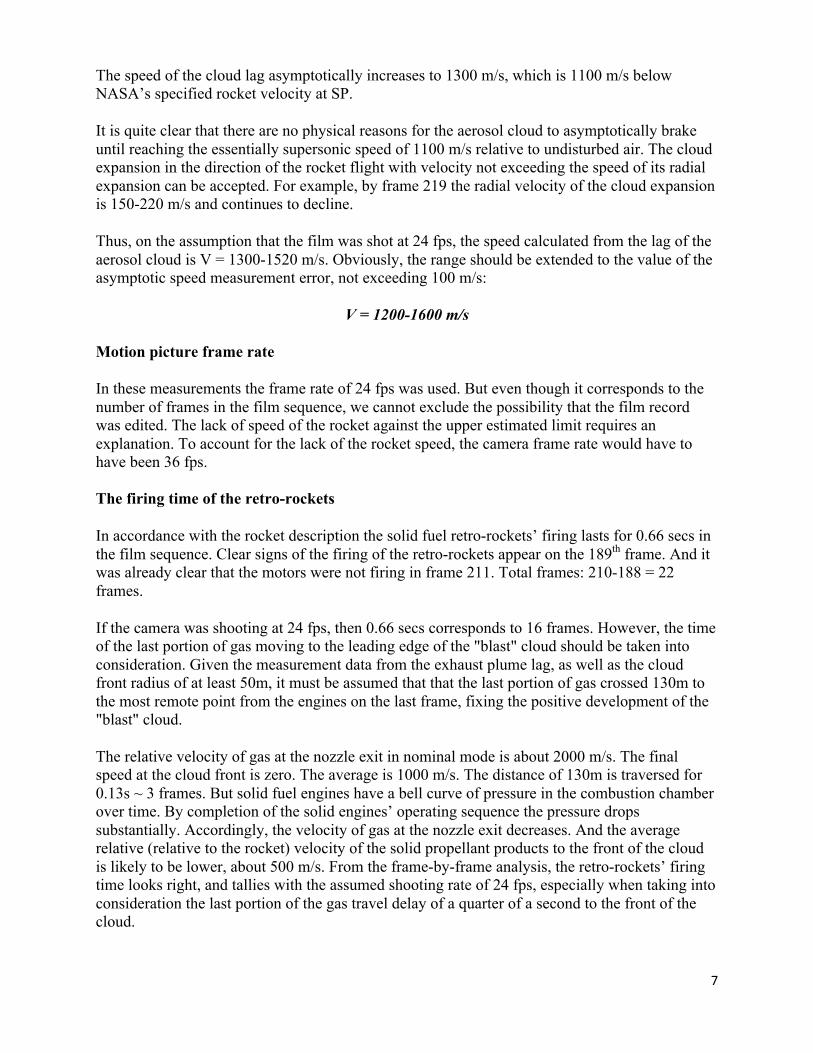
It should be noted that errors in the determination of the shock angle do not significantly affect the increase in upstream velocity. If the shock angle was 21.5 degrees, then the estimate of the Mach number would have grown only to Mach 4. In order to get to the speed of Mach 7 (2.4 km/s), as clearly seen on the chart in Figure 3, the oblique shock angle would need be about 18 degrees. Image 9 shows the interferogram of an oblique shock on a wedge with the same corner angle as the Saturn-Apollo nose cone, and at the same Mach number as stated by NASA. The angle of the interferogram strictly equals the angle determined from the charts and has nothing to do with the shock angles in the images (frames) of the rocket flight footage.
13
Image 9. Interferogram of air streaming around the wedge with a corner angle of 10 degrees at Mach numbers in the range of 7‐9 (in the source text). [7] The right interferogram is a replica of the left one, which has angle lines drawn to determine their values. The oblique shock angle is 18 degrees.
Speed estimate based on energy balance
The appearance and sustained movement of a broad aerosol cloud along with the rocket enabled a speed estimation based on energy balance. The motion of the cloud at supersonic speed through undisturbed air automatically calls for fulfillment of certain requirements for such a movement. To allow for particles being present at the nose cone moving at supersonic speed at the time the retro-rockets are fired, all air molecules, which are on the path of the front cloud (and the shock wave carrying the cloud particles) must be in this shock wave, and must be accelerated by it to a speed of the shock wave itself. i.e. up to a speed not less than the speed of the rocket; sequentially, layer by layer. Air molecules, being involved in the movement at first approximation of a plane shock wave, concede their place in the front to new molecules, and slowly lag behind the shock thermalizing. Thermal-motion energy of the trailing molecules is spent on radiation and maintaining the radial expansion of the smoke cloud. The radiation of the aerosol cloud in the front of a shockwave is significant at high speeds. In the most general form the inequality of energy balance appears as:
Without compromising the strict inequality, the heat air energy in the form Mair сv ×T(M) can be placed on the left-hand side. On the right-hand side the enthalpy of gases can be ignored, since it has been largely taken into account in the kinetic energy. In the expansion part of the nozzle the linear velocity of the exhaust gas increases for solid-propellant engines from about 900m/s to 2000m/s, just by using the enthalpy. Moreover, a typical initial temperature of the gases in the combustion chambers of solid propellant engines has a value of 1600-1700 K, which is lower than behind the front of the cloud at the declared NASA rocket velocity of 7M (2600 K). Cooled down at the nozzle, solid fuel products are colder than the air shock front virtually up to the

14
rocket velocity (and the front of the cloud) Mach 4.5-5 (1100-1300 K). i.e. if the rocket is slower than 4.5-5M then solid fuel products become hotter than the air shock front, and vice-versa.
Note: The temperature in the combustion chamber is 1600-1700К. This temperature corresponds to the speed of sound of combustion gases, which is the longitudinal flow velocity of the gases in the nozzle throat. This is the gas velocity in the reference frame of the rocket, i.e. the velocity relative to the rocket. After passing through the throat gases continue to accelerate in the expansion part of the nozzle. However, their temperature decreases.
The front of the smoke cloud travels at the speed of the entire system (rocket plus smoke cloud) in the reference frame of still air. At the direct shock wave, upcoming air is heated significantly. In this case the normal shock of pressure (the shock wave) is the front of the smoke cloud. At high rocket speed, after crossing the normal shock, the air is much hotter than the solid fuel products at the nozzle exit. And only at low rocket velocity is the hot air temperature at the front of the exhaust gas not higher than the temperature of the exhaust gas at the nozzle exit.
Why is this important? In the energy balance, as mentioned above, there is a significant loss of energy through re-radiation. The loss from the hottest regions is principal, because according to the Stefan-Boltzmann law, which governs radiative heat transfer, it is directly proportional to the fourth power of temperature. At the high NASA-stated rocket velocity, radiation loss from the front of the smoke cloud would be much higher than similar losses from solid fuel products after they exited from the nozzle. Since we have not considered them, but they do exist, the internal energy of the solid fuel products covers these losses. Hence the emphasis on placing a strong inequality in the energy balance.
If the radius of the front cloud is r, then for the period that solid propellant engines are firing τ molecules of atmospheric air with density ρ will be consistently involved in motion of the rocket with velocity V and with total mass:
Total kinetic energy of these molecules will be:
The air heating in the shock wave was estimated based on the standard formula for a normal shock wave:
Where ,
М – Mach number of the cloud front with respect to the undisturbed air.

15
The initial kinetic energy of the gases at the nozzle exit is:
but this initial kinetic energy cannot be fully utilized to disperse the air at the front of the cloud. Once the gases reduce their speed to the front velocity (rocket speed), they fail to reach the front of the cloud. Therefore, the amount of kinetic energy, which is used to disperse air molecules at the front, should be evaluated as:
Therefore, the inequality becomes:
Molar heat air capacity is 2.5R.
R – universal gas constant 8.314 J/mol⋅К
µ=0,029 kg/mol – average molecular weight of atmospheric air
T0 – air temperature at the separation height.
Energy loss by radiation was taken into account by way of the following considerations. The main contribution to the radiation comes from sub-micron soot particles that accompany the cloud front. Emission of soot particles in the rear hemisphere of the aerosol cloud front is nearly offset by the counter radiation of soot particles in the rearward layers. Therefore, only half the total emission of these particles was considered. Particles throughout the entire volume of the aerosol cloud actually radiate. But with high optical density of aerosol the radiation reaches the surface only from the narrow surface area, which in the first approximation can be regarded as the radiating plane. A cubic inequality was obtained with respect to the rocket velocity V with parameter r – the radius of the cloud front, estimated from the film footage. This inequality was solved numerically by simple iteration for different values of the radius. Given the separation point uncertainty at the height of 65-67 km [2] and the possibility of the declared SP non-compliance to actuality, the maximum possible speeds for different heights was calculated.
Table 3. Maximum possible rocket speeds, based on the energy balance between the energy of the retro‐rocket gases without energy consumption for the radial expansion and the radial radiation energy.
Maximum permissible rocket velocity, m/s Cloud front radius, m H=60 km H=65 km H=67 km
50 1500 1697 1780 60 1315 1501 1584 70 1176 1347 1427

16
The radius of the cloud front is somewhat uncertain and depends on the evaluation of its borders. The diameters of the front in pixels are given in the photographs below. The rocket length is 43 pixels. A reduction ratio of linear dimensions 0.65 was taken on its bottom edge and was determined by comparing the rocket length to its diameter in the film sequence.
Image 10. Diameters of the aerosol cloud front in frames 189‐210. The average radius of the cloud front, starting with frame 192, is 60m.
With the cloud front radius evaluations appearing to be lower than the actual value, the speed evaluation is higher than the actual rocket speed – the average radius of the aerosol cloud front for the "explosion" time from frames 192 to 210 is 61 ± 3 m. For this radius:
V< 1.58 km/s Thus, even without taking into account energy loss by radiation and air dispersal in a radial to trajectory direction, the energy of retro-rocket gases at the stated rocket velocity is insufficient for the explosion cloud to reach the size captured on the footage. In other words: the fact that the rocket speed does not exceed 1.6 km/s at the separation point at the height of 67 km, is calculated from the size of the observed cloud with the declared energy and time duration of firing of the retro-rockets.

17
Results
Examination of the motion picture film record of the Apollo 11 Saturn V flight near the first stage separation permited the estimation of the actual booster speed. This analysis was possible due to the Saturn V using solid propellant retro-rockets which created an exhaust cloud. The result of this analysis was substantially lower (from 800 to 1000 m/s) than expected and substantially lower than stated in the NASA documentation. The calculations were obtained from three independent and mutually inter-relating methods. Therefore the principal conclusions are the same.
Discussion
In the flight plan 1m/s delta-v corresponds to the payload increment of 15 kg [2]. Even taking into account nonlinearity of a payload from delta-v, with a large difference from that projected, it appears that the Saturn V booster was only capable of launching at least 10 tons of payload less into translunar trajectory than oficially stated in the Apollo record.
The conclusion reached as a result of this study into the ability of the Apollo 11-Saturn V rocket to place the stated payload into lunar orbit suggests that these findings completely nullify NASA’s declared propulsion capability with regard to the Apollo 11 mission.
References
1. http://spaceflight.nasa.gov/gallery/video/apollo/apollo11/mpg/apollo11_launchclip03.mpg 2. И.И.Шунейко. Пилотируемые полеты на Луну, конструкция и характеристики
SATURN V APOLLO// Итоги науки и техники. Сер. Ракетостроение. М. 1973. 3. http://www.epizodsspace.narod.ru/bibl/ley/leypr2.html 4. Michael Light. Full Moon. London: Jonathan Cape – 1999. – All photographs courtesy
National Aeronautics and Space Administration 5. Лойцянский Л.Г. Механика жидкости и газа: Учеб. Для вузов. – 7-е изд., испр. – М. Дрофа, 2003, - 840 с.
6. Липман Г.В., Пакет А.Е. Введение в аэродинамику сжимаемой жидкости.-М.:ИЛ,1949. Цитируется по [5].
7. Х.Эртель. Измерения в гиперзвуковых ударных трубах. В сб. Физика быстропротекающих процессов. Перевод под ред. Н.А.Златина. III том. – М.: Издательство «Мир», 1971- 360 с.
English translation from the Russian by BigPhil 2011